 Benhong Guo
 Junsheng Nie
 Jianxing Li
 Wenjiao Xiao
 Feng Pan4
95% of researchers rate our articles as excellent or good
Learn more about the work of our research integrity team to safeguard the quality of each article we publish.
Find out more
ORIGINAL RESEARCH article
Front. Earth Sci. , 08 November 2022
Sec. Quaternary Science, Geomorphology and Paleoenvironment
Volume 10 - 2022 | https://doi.org/10.3389/feart.2022.1052627
This article is part of the Research Topic Landscape Response to Rapid Climate Change: Mechanism, Process, and Modeling View all 5 articles
Uplift of the Tibetan Plateau, expansion/shrinkage of the Paratethys Sea, and global climate are three major forcings for central-east Asian climatic and environmental variations during the Cenozoic. However, knowledge of expansion/shrinkage history of the Paratethys Sea is much less well known in comparison with the other two forcings. Here, we present a first multiple-parameter environmental magnetic and diffuse reflectance spectroscopy study of the Eocene eolian Red Clay deposits (∼51–40 Ma) in the Xorkol Basin of the northeastern Tibetan Plateau, which is near the easternmost maximum boundary of the Eocene Paratethys Sea. The first detailed Eocene expansion/shrinkage history of the Paratethys Sea was reconstructed based on the hematite content of the Eocene Red Clay, which shows remarkable consistency with the previous low-resolution Paratethys Sea paleowater depth record in the southwestern Tarim Basin. These results demonstrate that the Paratethys Sea experienced a three-stage (shrinkage-expansion-shrinkage) evolution between ∼51 and 40 Ma, with boundaries at ∼46.2 and 42 Ma. Superimposed on this framework, the Paratethys Sea experienced four times of rapid shrinkages at the expansion phase (shows 400-kyr cycles) during ∼44–42 Ma modulated by eccentricity forcings. These new results are of great significance to evaluate respective role of Tibetan uplift, global climate, and Paratethys Sea area variations in Asian climate and environmental change over the Eocene.
Loess and eolian Red Clay (reddish loess) sequences are invaluable paleoclimatic and paleoenvironmental archives (An et al., 2001; Deng et al., 2006; Liu et al., 2012; Maher, 2016; Lu et al., 2019). The most continuous loess/Red Clay sequences are preserved on the Chinese Loess Plateau (CLP), which have served as a cornerstone for understanding Asian environmental and monsoonal evolution since ∼25–22 Ma (Guo et al., 2002; Sun et al., 2010; Qiang et al., 2011; Song et al., 2018). However, loess-Red Clay sequences from central-east Asia before ∼25 Ma are rarely reported. A recent study reported a 12 Myr long Eocene eolian Red Clay sequence from the Xishuigou (XSG) section in the Xorkol Basin within the Altyn Mountains of the northeastern Tibetan Plateau (Li et al., 2018; Figure 1), which provides a unique opportunity to examine central Asian paleoenvironmental evolution when Asian monsoon was weak (Dupont-Nivet et al., 2007; Licht et al., 2014) and its relationship with global climate and regional tectonics.
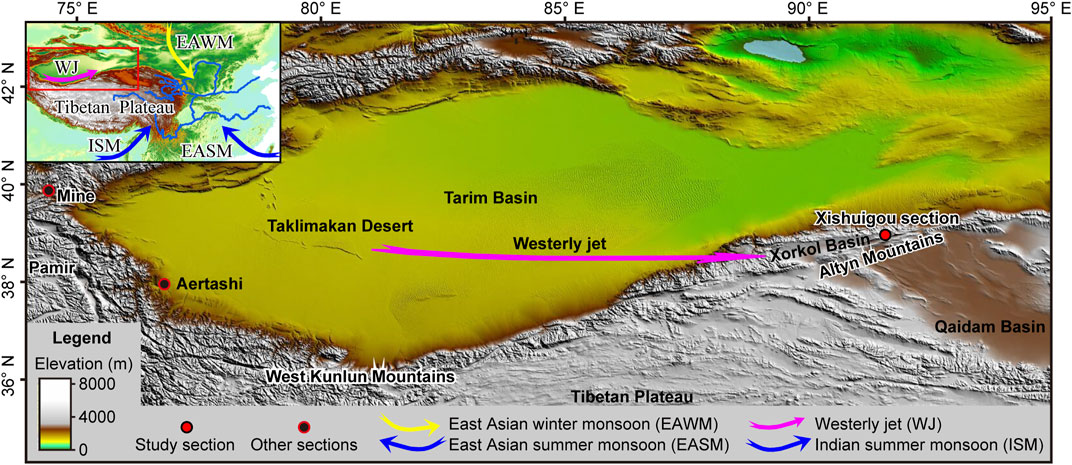
FIGURE 1. Geographic setting of the Altyn Mountains, Qaidam Basin, Tarim Basin, and surrounding mountains and deserts. The location of the Xishuigou section is shown with a red dot, and together with other sections (Kaya et al., 2019) mentioned in the text. Inset map shows modern Asian atmospheric circulation systems with the location of the Altyn Mountains, Qaidam Basin, and Tarim Basin in relation to the Tibetan Plateau.
Magnetic mineral type, content, and grain-size have played a key role in extracting paleoclimate signals from Chinese loess-Red Clay sequences (Thompson and Oldfield, 1986; Nie et al., 2007; Liu et al., 2012). However, only low frequency magnetic susceptibility (χ) and frequency-dependent magnetic susceptibility (χfd) data were reported for the Eocene Red Clay sequence from the XSG section (Li et al., 2018; Zhang et al., 2021). Consequently, more comprehensive environmental magnetic analysis of these sediments should provide a more complete understanding of environmental variations recorded by these eolian sediments.
Here, we present environmental magnetic and diffuse reflectance spectroscopy (DRS) data from this eolian sequence. We find that variations of ferrimagnetic mineral content show different pattern as the hematite content variations. We attribute variations of ferrimagnetic mineral parameters as a result of local precipitation variations. By contrast, we attribute the hematite content variations to availability of hematite particles in the source region, which were controlled by the Paratethys Sea expansion/shrinkage. By combining these data, environmental information from both the dust source and depositional region has been reconstructed.
The studied XSG Red Clay section (38°54′42″ N, 91°31′45″ E; Figure 1) is located in the Xorkol Basin within the Altyn Mountains bounding the eastern Tarim Basin (Li et al., 2018). This section is ∼96 m thick with an age model (∼51–39 Ma) established based on magnetostratigraphy with paleontological fossils as age anchor points (Li et al., 2018).
The samples analyzed here have a stratigraphic resolution of ∼20–60 cm. DRS was measured for all samples using a Purkinje General TU1901 UV-VIS spectrophotometer with a diffuse reflectance attachment (reflectance sphere) from 380 to 700 nm at 1 nm intervals. Hematite content was estimated by calculating the peak value at 565 nm after taking the first derivative of the reflectance data (Deaton and Balsam, 1991). The measurement was made at the Institute of Tibetan Plateau Research, Chinese Academy of Sciences.
χ was measured at two frequencies (976 Hz and 15,616 Hz, χlf and χhf) using an AGICO multifunction spinner Kappabridge magnetic susceptibility meter. χfd was calculated as the difference between χlf and χhf (Nie et al., 2007; Liu et al., 2012). Anhysteretic remanent magnetization (ARM) was imported to each sample in a peak alternating field of 100 mT with a direct current (DC) bias field of 0.05 mT and was measured using a JR-6A Spinner Magnetometer. ARM is often expressed by its susceptibility (χARM), which is calculated by dividing ARM by the DC bias field. Saturation isothermal remanent magnetization (SIRM) was imparted to the Z-axis for each sample in a 1.2 T field with an impulse magnetizer (ASC IM10-30) and then was measured with a JR-6A spinner magnetometer. Then each sample was put into back-fields (-0.1 T, -0.3 T) and the isothermal remanent magnetizations (IRM-0.1T, IRM-0.3T) were measured. L-ratio (Liu et al., 2007) was calculated as L-ratio = (IRM1.2T+IRM-0.3T)/(IRM1.2T+IRM-0.1T). These measurements were made at the Paleomagnetism and Environmental Magnetism Laboratory, China University of Geosciences (Beijing).
The DRS-derived hematite content in the XSG section can be divided into three units (Figure 2). In Units 1 (∼51–46.2 Ma) and 3 (∼42–39.95 Ma), the hematite content is relatively constant with higher values close to 0.4. In Unit 2 (∼46.2–42 Ma), the hematite content is generally lower compared to Units 1 and 3, and undergoes high-amplitude variations over the latter portion ∼44–42 Ma (Figure 2G), with clear 400-kyr band eccentricity period (Figures 3, 4).
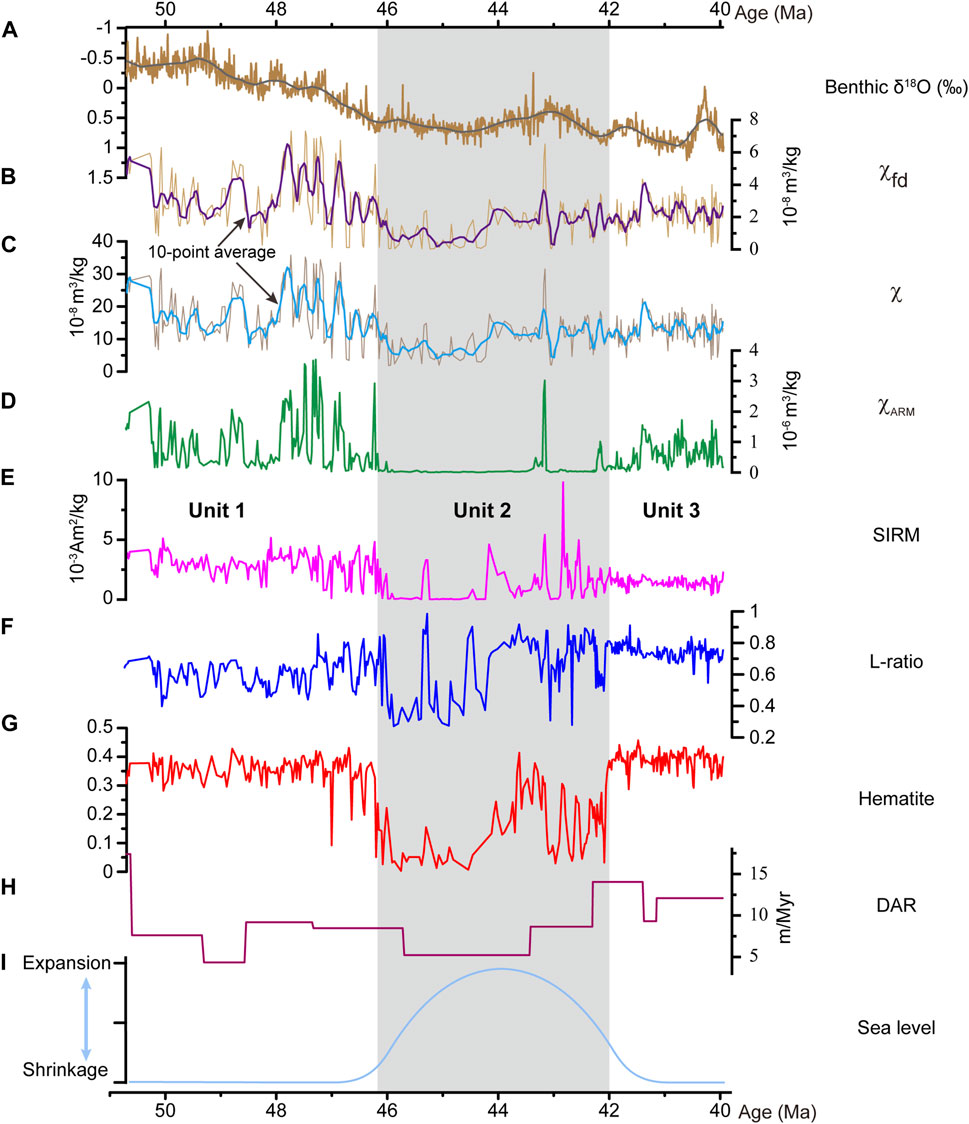
FIGURE 2. Xishuigou environmental magnetic records compared with other Paleogene climatic records. (A) Benthic oxygen isotope stack (Westerhold et al., 2020). (B–H) χfd, χ, χARM, SIRM, L-ratio, the hematite content, and dust accumulation rate (DAR) records from the Xishuigou section. (I) The Paratethys sea level variations in the Tarim region (Bosboom et al., 2014).
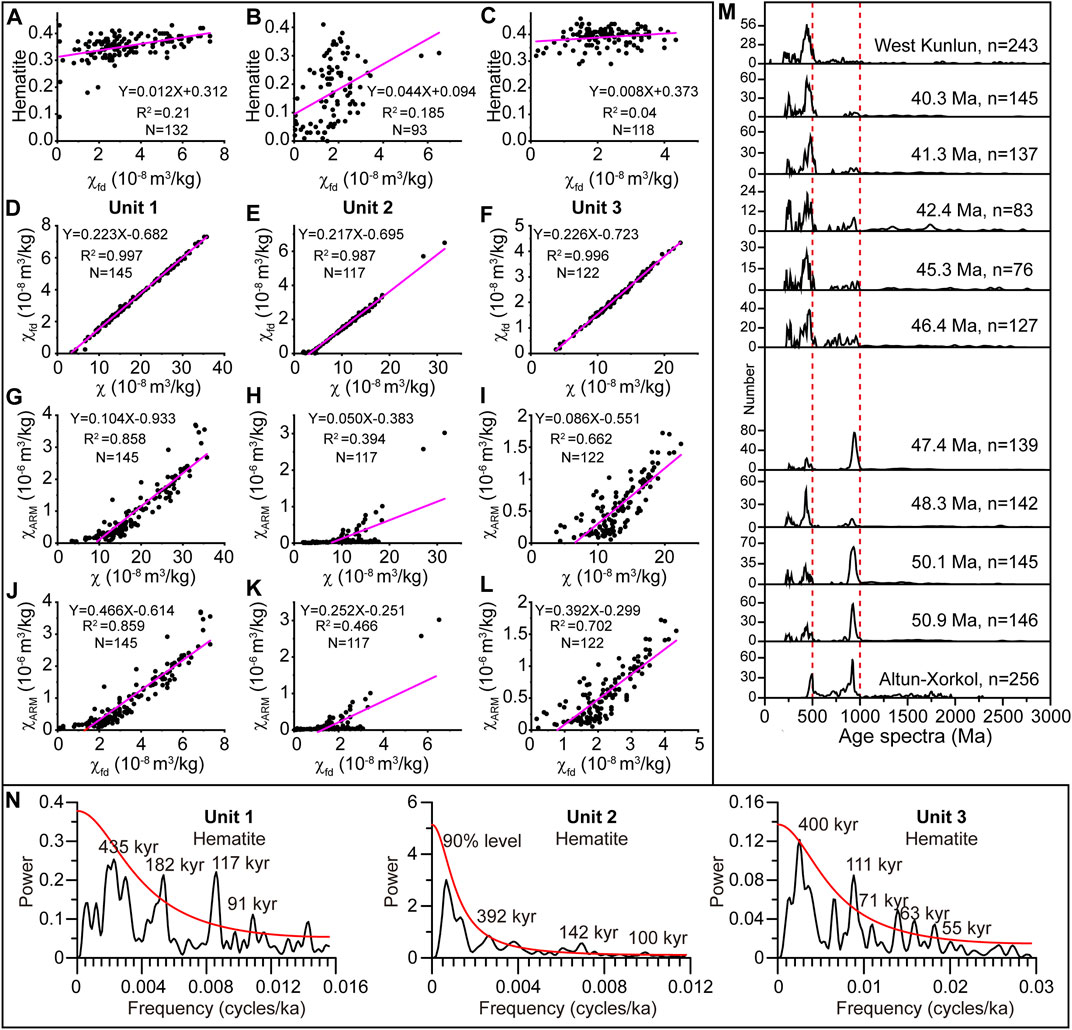
FIGURE 3. (A–L) Correlation analysis of magnetic parameters of the Xishuigou eolian Red Clay section. Relationship for hematite versus χfd, χfd versus χ, χARM versus χ, and χARM versus χfd. (A, D, G, and (J), (B, E, H, and (K), (C, F, I, and L) are from Units 1, 2, and 3, respectively. (M) Comparation of the detrital zircons U-Pb ages results of the Xishuigou eolian Red Clay section with possible source areas (Pan et al., 2022). (N) Power spectral results of the hematite content from Units 1, 2, and 3, respectively.
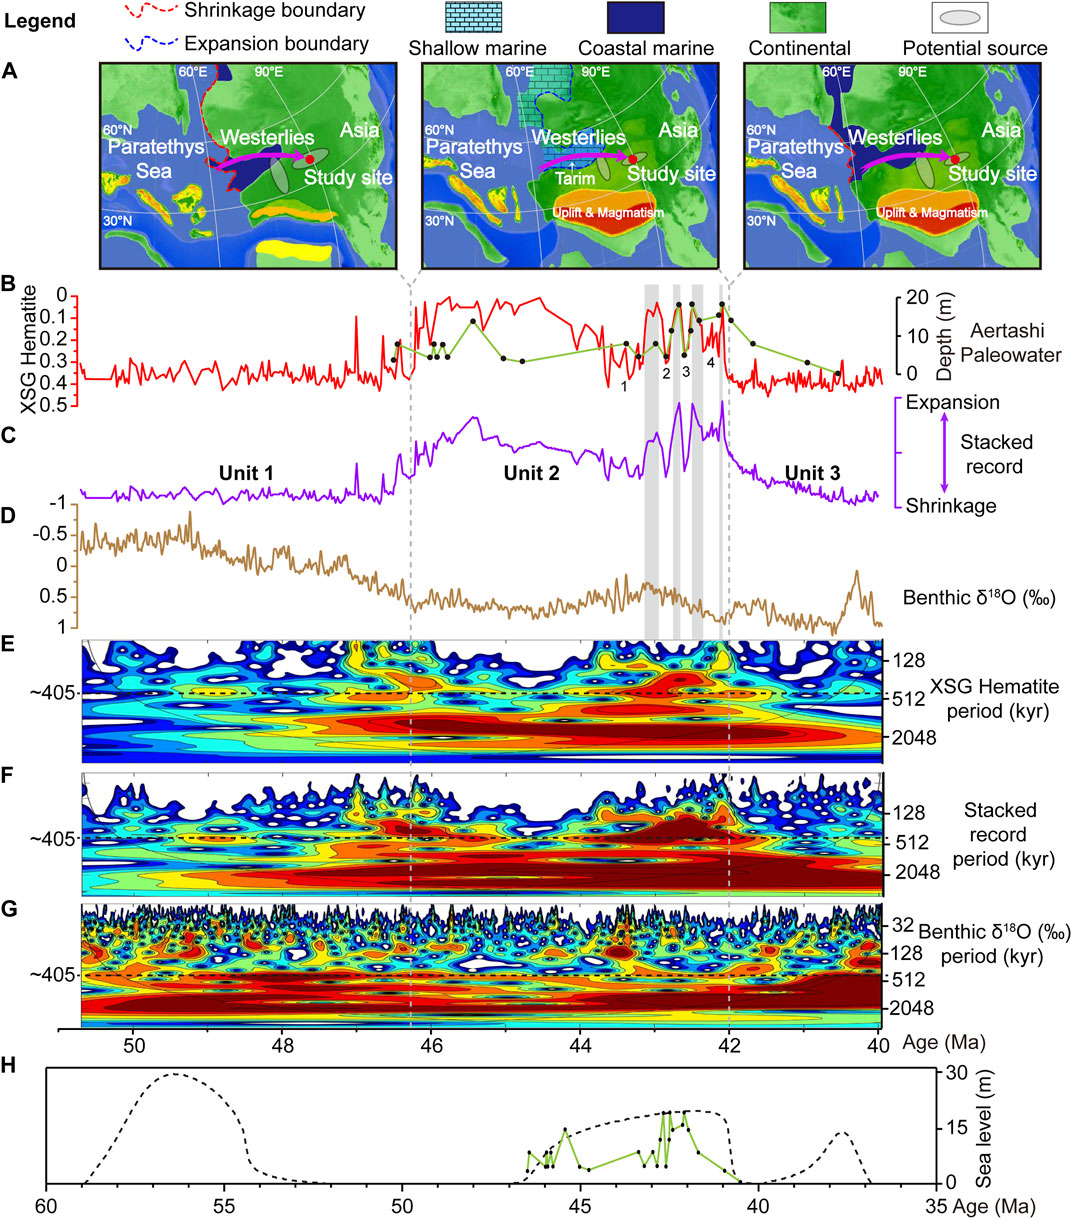
FIGURE 4. Schematic illustration of the relationship between the Paratethys Sea expansion/shrinkage, global climate, dust source area, and the hematite content variations in the studied section in different intervals. (A) The generalized middle to late Eocene paleogeography of Asia is modified from Kaya et al. (2019) and Meijer et al. (2019). The paleo-location of the Xishuigou section is shown with a red dot, which was reconstructed using the open-source Gplate platform citing reference. (B) The hematite record from the Xishuigou section compared to paleowater depth curve for the Aertashi section of Kaya et al. (2019). (C) Stacked expansion/shrinkage record of the Paratethys Sea derived from stacking the hematite content and paleowater depth records in (B). The hematite content and paleowater depth records were interpolated linearly at 20 ka intervals and normalized to 0–1. Then, the hematite content and paleowater depth records were averaged to form a stacked expansion/shrinkage record of the Paratethys Sea. Gray bars highlight the Paratethys Sea expansion during ∼44–42 Ma. (D) Benthic oxygen isotope record (10 point running averaging) (Westerhold et al., 2020). (E–G) Wavelet analysis of the hematite from the Xishuigou section, stacked record, and benthic oxygen isotope between ∼51 and 40 Ma, respectively. (H) Previous sea level record of the Paratethys Sea during ∼60–35 Ma is reflected by the black dotted line (Kaya et al., 2019) and the paleowater depth record during 46.5–40.5 Ma is shown by the light green solid line.
χARM record can also be divided into three units, consistent with the hematite content record, but χARM values over Unit three are lower than those over Unit one and values over Unit two are close to 0 except a few spikes (Figure 2). By contrast, χ and χfd records share the division at ∼46 Ma but their younger boundary is close to 44.2 Ma, in contrast to the division near 42 Ma in the hematite content and χARM records (Figure 2). SIRM record can also be divided into three units, like the hematite content and χARM records, but the values in Unit three are lower than those in Unit one and the high values in Unit 2, different from the hematite content and χARM records.
χ and χfd show positive correlations in all three units, consistent with the pattern on the CLP (Figure 3). χARM only shows good positive correlation with χ and χfd in Units one and three; in Unit 2, χARM is close to 0 suggesting lack of stable single domain (SD) and smaller pseudo single domain (PSD) ferrimagnetic grains except for the few spikes (Figure 2). SIRM variations are generally similar to hematite variations, with low amplitude variations in Units one and three and high amplitude variations in the second half of Unit 2. This may suggest hematite content controls of SIRM. However, SIRM is lower in Unit three than Unit 1, different from hematite content variations, suggesting that some hematite grains may be close to superparamagnetic (SP) domain in Unit 3, not contributing to SIRM for Unit 3. This inference is supported by higher L-ratios in Unit three in comparison with Unit 1, which may indicate a provenance shift (Liu et al., 2007), consistent with zircon U-Pb geochronology-based provenance data (Pan et al., 2022; Figure 3). In summary, ferrimagnetic mineral content variations exhibit different pattern as the hematite content or SIRM records, suggesting different controlling mechanisms.
The loess and Red Clay sediments on the CLP have strong positive correlation between χfd and χ, and this observation provides one key line of evidence clarifying χ enhancement mechanism of loess on the CLP (Zhou et al., 1990): production of SP ferrimagnetic grains over pedogenesis causes magnetic enhancement. Later, Liu et al. (2003), Liu et al. (2004), and Nie et al. (2007) found that χARM and χ also have strong positive correlations for loess and Red Clay sediments on the CLP, suggesting that stable SD and smaller PSD ferrimagnetic grains produced over pedogenesis also contribute to magnetic enhancement. Because degree of pedogenesis is mainly controlled by precipitation in semi-arid region and χ has good correlation with summer precipitation. Thus, the loess and Red Clay χ records on the CLP have been widely used to reflect monsoonal precipitation amount and intensity of the East Asian summer monsoon (An et al., 2001; Maher, 2016).
χ, χfd, and χARM also show clear positive correlations for the XSG Red Clay, except in Unit 2, where χARM is close to 0 for the most part (Figure 2D). And previous rock-magnetic results have also shown that the magnetic minerals in the XSG Red Clay are dominated by magnetite/maghemite and hematite, which are similar to those of Red Clay sequences in the CLP (Li et al., 2018). Those results support a pedogenic model for magnetic enhancement in the study site, like the CLP. However, for Unit 2, we suspect that some degree of magnetic mineral dissolution may have occurred, resulting in lack of stable SD and smaller PSD ferrimagnetic grains. This interpretation is consistent with the lithologic variations of the XSG Red Clay, which contains abundant thick grey and greyish-green carbonate nodule layers in Unit 2 (Li et al., 2018). We note that magnetic mineral dissolution was also observed in southern CLP where modern monsoonal precipitation is higher than the other parts of the CLP, which has likely to be the case in the entire Quaternary (Guo et al., 2001). However, different from the CLP where magnetic enhancement is caused by alternating oxidation/reduction conditions in soils associated with dry-wet oscillations inherent to monsoonal climate, we propose in the study site, the oxidation/reduction conditions in soils was created by seasonal N-S shift of westerly, and this mechanism has been proposed for alluvial sediments in Spain (Gao et al., 2022).
Based on the above analysis, we agree with Li et al. (2018) that χfd and χ records in the XSG section recorded local precipitation variations. Particularly, the higher χfd and χ values in Unit one than Unit three show similar pattern as the benthic oxygen isotope records (Figure 2), which supports global cooling forcing for climatic drying in the Altyn region. However, in Unit 2, it is likely that magnetic mineral dissolution has decreased the χfd and χ values. The dissolution hypothesis is favored by the lower hematite content in Unit 2 (Figure 2). It is well known that hematite formation is favored in dry environment (Thompson and Oldfield, 1986; Nie et al., 2010; Liu et al., 2012), so the lower hematite content record in Unit two indicates dust deposition environment was wetter than that in Units one and 3.
We attribute the three-stage hematite content variations in the study section to shrinkage-expansion-shrinkage of the Paratethys Sea (Figure 4), which is consistent with the evolution of the Eocene Paratethys Sea inferred by Bosboom et al. (2014), but we note that there are different opinions regarding how the Paratethys Sea evolved over this time period (Sun et al., 2016; Sun et al., 2022). This inference assumes that hematite primarily formed in the source region, which are supported by several lines of evidence. First, hematite versus χfd has strong linear correlation for Chinese loess and for soils form Spain, Argentina, and Russia where hematite and fine ferrimagnetic grains are produced mainly in situ (Torrent et al., 2006). However, the correlations between hematite and χfd are weak in all three units (Figure 3), against in situ pedogenic origin model. Indeed, if hematite was mainly produced in situ, it is hard to accommodate the ferrimagnetic mineral content and hematite content variations in the study site because they have different trends and thus cannot both reflect local precipitation variations. Second, the zircon U-Pb geochronology data demonstrate that the west Kunlun pediment area was a persistent dust source region for the study section (Figure 3M), with dust of the lower strata (Unit 1) coming from mixing of the west Kunlun pediments with some contribution from local sources, and upper strata (Units two and 3) coming predominantly from the west Kunlun pediments (Pan et al., 2022). Therefore, at least for Units 2 and 3, it is reasonable to attribute hematite content variations to hematite availability in the west Kunlun pediment area, which should be inversely correlated with area of the Paratethys Sea. Third (and also most compellingly), the hematite content and dust accumulation rate (DAR) variations fit well with the three-stage Paratethys sea level variations estimated by biostratigraphy, magnetostratigraphy, and regional stratigraphic correlation (Bosboom et al., 2014; Kaya et al., 2019; Meijer et al., 2019). One would expect that Units one and three have more hematite when the Paratethys Sea was smaller, more Kunlun pediment was exposed, and climate was drier. More strikingly, the hematite content high frequency variations during ∼44–42 Ma show similar pattern as the paleowater depth records from the southwestern Tarim Basin (Aertashi and Mine sections; Figure 1) (Kaya et al., 2019; Supplementary Figure S1). Because these records have independent age controls (Bosboom et al., 2014; Li et al., 2018; Kaya et al., 2019), their consistency suggests that each captures the main feature of the Paratethys Sea evolution.
Considering the high correlation between the hematite content record and the paleowater depth record (Supplementary Figure S1), we can generate the Eocene Paratethys Sea expansion/shrinkage record by stacking and averaging them together (Figure 4). We argue that this stacked record is better than the individual ones because the stacking strategy has been used to isolate signal and depress noise in paleoceanography studies (Clemens and Prell, 2003; Lisiecki and Raymo, 2005). The stacked record (and the original individual records) shows clear 400-kyr cycles over ∼44–42 Ma, revealing four phases of shrinkage-expansion cycles of the Paratethys Sea (Figure 4).
We attribute the observed Paratethys Sea transgression at ∼46.2 Ma to increased subsidence of the Tarim Basin associated with a phase of uplift of the Pamir and west Kunlun Mountains. Based on the subsidence records from the Aertashi and Mine sections, Kaya et al. (2019) proposed the onset of the tectonic activity and subsidence in the Tarim region at ∼47–46 Ma. Previous thermochronological (zircon and apatite fission-track) data and sedimentological results from the northeastern Pamir and the Tarim Basin reveal that rapid km-scale deformation and uplift of the Altyn and west Kunlun Mountains occurred at ∼48–46 Ma (Yin et al., 2002; Cao et al., 2013), which had likely caused the Tarim area subsidence and transgression.
Geochronologic, geochemical, and isotopic data revealed an additional phase of uplift of the Pamir-Tibetan at ∼44–42 Ma, which was likely induced by delamination/drip in which the lower crust and lithospheric mantle sank into the asthenospheric mantle (Chen et al., 2013; Chapman et al., 2018; Kaya et al., 2019). Accumulation rates of the Aertashi and Mine sections in the western Tarim Basin increased rapidly (from ∼2-4 to ∼12–24 cm/kyr) at ∼42–41 Ma (Kaya et al., 2019), likely a result of the Eocene uplift and increased exhumation of the Pamir-Tibetan Plateau. We concur with Kaya et al. (2019) that increased sedimentary filling resulted in the observed Paratethys regression near 42 Ma.
It is hard to attribute the second-order transgression/regression or expansion/shrinkage of the Paratethys Sea with clear long eccentricity cyclicity over ∼44–42 Ma to tectonic forcing. By contrast, they should come from insolation forcing. However, different from either the insolation forcing or the benthic oxygen isotope record of this time interval which show subtle 400-kyr cyclicity, the observed transgression/regression cycles are dramatic (Figure 4). This suggests a non-linear response of the climate system to the forcing. One way to amplify the 400-kyr cycles is through the carbon cycle. The 400-kyr cycles have been reported to be prominent in the benthic carbon isotope records over the late Cenozoic (Wang et al., 2010), which may have resulted in the prominent 400-kyr wet-dry variation records in East Asia as are recorded by South China Sea K/Al record (Tian et al., 2011), and the Tengger Desert magnetic records (Liu et al., 2021). If carbon cycle is the amplifying agent, more areas should see this singal. Larrasoaña et al. (2003) reported prominent 400-kyr cycles in the Mediterranean records which indicate wet-dry variations of the Sahara Desert over the past ∼3 Ma; this is in line with this hypothesis.
We reported hematite and ferrimagnetic mineral content results on the Eocene eolian Red Clay sediments of the XSG section in the Xorkol Basin within the Altyn Mountains, northeastern Tibetan Plateau. These records allow an evaluation of environmental variations in both the study site area and the distal source region. The hematite content record shows remarkable similarity with the paleowater depth records in the Tarim Basin, and we stacked both records and generated a high resolution Paratethys Sea transgression/regression record for the first time, which is important to evaluate respective role of Tibetan uplift, global climate, and Paratethys Sea area variations in Asian climate and environments over the Eocene. We confirm that the Paratethys Sea experienced a three-stage (shrinkage-expansion-shrinkage) evolution over the Eocene, and our record also reveals large-amplitude rapid shrinkage-expansion (400-kyr cycles) between ∼44 and 42 Ma, suggesting non-linear response of the climate and environmental system in central Asia to insolation forcing, likely via the carbon cycles.
The raw data supporting the conclusions of this article will be made available by the authors, without undue reservation.
JN and BG designed the experiment and wrote the paper with the help of WX, JL, and FP; BG and JN performed the experiments with the samples supplied by JL and FP; All authors analyzed the data and participated in the discussion and modification.
This research was supported by the National Natural Science Foundation of China (Nos. 42001074 and 41888101), the China Postdoctoral Science Foundation (No. 2020M683604) and the Fundamental Research Funds for the Central Universities (Nos. Lzujbky-2020-pd13 and lzujbky-2020-kb01).
The authors declare that the research was conducted in the absence of any commercial or financial relationships that could be construed as a potential conflict of interest.
All claims expressed in this article are solely those of the authors and do not necessarily represent those of their affiliated organizations, or those of the publisher, the editors and the reviewers. Any product that may be evaluated in this article, or claim that may be made by its manufacturer, is not guaranteed or endorsed by the publisher.
The Supplementary Material for this article can be found online at: https://www.frontiersin.org/articles/10.3389/feart.2022.1052627/full#supplementary-material
An, Z. S., Kutzbach, J. E., Prell, W. L., and Porter, S. C. (2001). Evolution of Asian monsoons and phased uplift of the Himalaya-Tibetan Plateau since late Miocene times. Nature 411, 62–66. doi:10.1038/35075035
Bosboom, R. E., Dupont-Nivet, G., Grothe, A., Brinkhuis, H., Villa, G., Mandic, O., et al. (2014). Timing, cause and impact of the late Eocene stepwise sea retreat from the Tarim Basin (west China). Palaeogeogr. Palaeoclimatol. Palaeoecol. 403, 101–118. doi:10.1016/j.palaeo.2014.03.035
Cao, K., Wang, G. C., van der Beek, P., Bernet, M., and Zhang, K. X. (2013). Cenozoic thermo-tectonic evolution of the northeastern Pamir revealed by zircon and apatite fission-track thermochronology. Tectonophysics 589, 17–32. doi:10.1016/j.tecto.2012.12.038
Chapman, J. B., Scoggin, S. H., Kapp, P., Carrapa, B., Ducea, M. N., Worthington, J., et al. (2018). Mesozoic to cenozoic magmatic history of the Pamir. Earth Planet. Sci. Lett. 482, 181–192. doi:10.1016/j.epsl.2017.10.041
Chen, J. L., Wu, J. B., Xu, J. F., Dong, Y. H., Wang, B. D., and Kang, Z. Q. (2013). Geochemistry of Eocene high-Mg# adakitic rocks in the northern Qiangtang terrane, central Tibet: Implications for early uplift of the plateau. Geol. Soc. Am. Bull. 125, 1800–1819. doi:10.1130/B30755.1
Clemens, S. C., and Prell, W. L. (2003). A 350, 000 year summer-monsoon multi-proxy stack from the owen ridge, northern arabian sea. Mar. Geol. 201, 35–51. doi:10.1016/S0025-3227(03)00207-X
Deaton, B. C., and Balsam, W. L. (1991). Visible spectroscopy-A rapid method for determining hematite and goethite concentration in geological materials. J. Sediment. Res. 61, 628–632. doi:10.1306/D4267794-2B26-11D7-8648000102C1865D
Deng, C. L., Shaw, J., Liu, Q. S., Pan, Y. X., and Zhu, R. X. (2006). Mineral magnetic variation of the Jingbian loess/paleosol sequence in the northern Loess Plateau of China: Implications for Quaternary development of Asian aridification and cooling. Earth Planet. Sci. Lett. 241, 248–259. doi:10.1016/j.epsl.2005.10.020
Dupont-Nivet, G., Krijgsman, W., Langereis, C. G., Abels, H. A., Dai, S., and Fang, X. M. (2007). Tibetan Plateau aridification linked to global cooling at the Eocene-Oligocene transition. Nature 445, 635–638. doi:10.1038/nature05516
Gao, P., Nie, J. S., Breecker, D. O., Gallagher, T., Serach, L., and Alonso-Zarza, A. M. (2022). Similar magnetic enhancement mechanisms between Chinese loess and alluvial sediments from the Teruel Basin, NE Spain, and paleoclimate implications. Geophys. Res. Lett. 49, e2021GL096977. doi:10.1029/2021GL096977
Guo, B., Zhu, R. X., Roberts, A. P., and Florindo, F. (2001). Lack of correlation between paleoprecipitation and magnetic susceptibility of Chinese loess/paleosol sequences. Geophys. Res. Lett. 28, 4259–4262. doi:10.1029/2001GL013290
Guo, Z. T., Ruddiman, W. F., Hao, Q. Z., Wu, H. B., Qiao, Y. S., Zhu, R. X., et al. (2002). Onset of Asian desertification by 22 Myr ago inferred from loess deposits in China. Nature 416, 159–163. doi:10.1038/416159a
Kaya, M. Y., Dupont-Nivet, G., Proust, J-N., Roperch, P., Bougeois, L., Meijer, N., et al. (2019). Paleogene evolution and demise of the proto‐Paratethys Sea in Central Asia (Tarim and Tajik basins): Role of intensified tectonic activity at ca. 41 Ma. Basin Res. 31, 461–486. doi:10.1111/bre.12330
Larrasoaña, J. C., Roberts, A. P., Rohling, E. J., Winklhofer, M., and Wehausen, R. (2003). Three million years of monsoon variability over the northern Sahara. Clim. Dyn. 21, 689–698. doi:10.1007/s00382-003-0355-z
Li, J. X., Yue, L. P., Roberts, A., Hirt, A. M., Pan, F., Guo, L., et al. (2018). Global cooling and enhanced Eocene Asian mid-latitude interior aridity. Nat. Commun. 9, 3026–3028. doi:10.1038/s41467-018-05415-x
Licht, A., Van Cappelle, M., Abels, H. A., Ladant, J. B., Trabucho-Alexandre, J., France-Lanord, C., et al. (2014). Asian monsoons in a late Eocene greenhouse world. Nature 513, 501–506. doi:10.1038/nature13704
Lisiecki, L. E., and Raymo, M. E. (2005). A Pliocene-Pleistocene stack of 57 globally distributed benthic δ18O records. Paleoceanography 20 (2), 1071. doi:10.1029/2004PA001071
Liu, C. Y., Nie, J. S., Li, Z. J., Qiao, Q. Q., Abell, J. T., Wang, F., et al. (2021). Eccentricity forcing of East Asian monsoonal systems over the past 3 million years. Proc. Natl. Acad. Sci. U. S. A. 118 (43), e2107055118. doi:10.1073/pnas.2107055118
Liu, Q. S., Jackson, M. J., Banerjee, S. K., Maher, B. A., Deng, C. L., Pan, Y. X., et al. (2004). Mechanism of the magnetic susceptibility enhancements of the Chinese loess. J. Geophys. Res. 109, B12107. doi:10.1029/2004JB003249
Liu, Q. S., Roberts, A. P., Larrasoaña, J. C., Banerjee, S. K., Guyodo, Y., Tauxe, L., et al. (2012). Environmental magnetism: Principles and applications. Rev. Geophys. 50, RG4002. doi:10.1029/2012RG000393
Liu, Q. S., Roberts, A. P., Torrent, J., Horng, C. S., and Larrasoaña, J. C. (2007). What do the HIRM and S-ratio really measure in environmental magnetism? Geochem. Geophys. Geosyst. 8, Q09011. doi:10.1029/2007GC001717
Liu, X. M., Rolph, T., An, Z. S., and Hesse, P. (2003). Paleoclimatic significance of magnetic properties on the Red Clay underlying the loess and paleosols in China. Palaeogeogr. Palaeoclimatol. Palaeoecol. 199, 153–166. doi:10.1016/S0031-0182(03)00504-2
Lu, H. Y., Wang, X. Y., Wang, X. Y., Chang, X., Zhang, H. Z., Xu, Z. W., et al. (2019). formation and evolution of gobi Desert in central and eastern Asia. Earth. Sci. Rev. 194, 251–263. doi:10.1016/j.earscirev.2019.04.014
Maher, B. A. (2016). Palaeoclimatic records of the loess/palaeosol sequences of the Chinese Loess Plateau. Quat. Sci. Rev. 154, 23–84. doi:10.1016/j.quascirev.2016.08.004
Meijer, N., Dupont-Nivet, G., Abels, H. A., Kaya, M. Y., Licht, A., Xiao, M. M., et al. (2019). Central Asian moisture modulated by proto-Paratethys Sea incursions since the early Eocene. Earth Planet. Sci. Lett. 510, 73–84. doi:10.1016/j.epsl.2018.12.031
Nie, J. S., King, J. W., and Fang, X. M. (2007). Enhancement mechanisms of magnetic susceptibility in the Chinese red-clay sequence. Geophys. Res. Lett. 34, 197055–L20268. doi:10.1029/2007GL031430
Nie, J. S., Song, Y. G., King, J. W., Fang, X. M., and Heil, C. (2010). HIRM variations in the Chinese red-clay sequence: Insights into pedogenesis in the dust source area. J. Asian Earth Sci. 38, 96–104. doi:10.1016/j.jseaes.2009.11.002
Pan, F., Li, J. X., Nie, J. S., Xu, Y., and Yue, L. P. (2022). Provenance of the eolian deposits in the Xorkol Basin: Implications for dust transport pattern in Western China since the Eocene. Geol. Soc. Am. Bull. 11, 1376. doi:10.3390/min11121376
Qiang, X. K., An, Z. S., Song, Y. G., Chang, H., Sun, Y. B., Liu, W. G., et al. (2011). New eolian red clay sequence on the Western Chinese Loess Plateau linked to onset of Asian desertification about 25 Ma ago. Sci. China Earth Sci. 54, 136–144. doi:10.1007/s11430-010-4126-5
Song, Y. G., Fang, X. M., Chen, X. L., Torii, M., Ishikawa, N., Zhang, M. S., et al. (2018). Rock magnetic record of late Neogene red clay sediments from the Chinese Loess Plateau and its implications for East Asian monsoon evolution. Palaeogeogr. Palaeoclimatol. Palaeoecol. 510, 109–123. doi:10.1016/j.palaeo.2017.09.025
Sun, J. M., Liu, W. G., Guo, Z. T., Qi, L., and Zhang, Z. L. (2022). Enhanced aridification across the Eocene/Oligocene transition evidenced by geochemical record in the Tajik Basin, Central Asia. Glob. Planet. Change 211, 103789. doi:10.1016/j.gloplacha.2022.103789
Sun, J. M., Windley, B. F., Zhang, Z. L., Fu, B. H., and Li, S. H. (2016). Diachronous seawater retreat from the southwestern margin of the Tarim Basin in the late Eocene. J. Asian Earth Sci. 116, 222–231. doi:10.1016/j.jseaes.2015.11.020
Sun, Y. B., An, Z. S., Clemens, S. C., Bloemendal, J., and Vandenberghe, J. (2010). Seven million years of wind and precipitation variability on the Chinese Loess Plateau. Earth Planet. Sci. Lett. 297, 525–535. doi:10.1016/j.epsl.2010.07.004
Thompson, R., and Oldfield, F. (1986). Environmental magnetism. London, UK: Kluwer. doi:10.1007/978-94-011-8036-8
Tian, J., Xie, X., Ma, W. T., Jin, H. Y., and Wang, P. X. (2011). X-ray fluorescence core scanning records of chemical weathering and monsoon evolution over the past 5 Myr in the southern South China Sea. Paleoceanography 26 (4), 2010PA002045. doi:10.1029/2010PA002045
Torrent, J., Barrón, V., and Liu, Q. S. (2006). Magnetic enhancement is linked to and precedes hematite formation in aerobic soil. Geophys. Res. Lett. 33, L02401. doi:10.1029/2005gl024818
Wang, P. X., Tian, J., and Lourens, L. J. (2010). Obscuring of long eccentricity cyclicity in Pleistocene oceanic carbon isotope records. Earth Planet. Sci. Lett. 290, 319–330. doi:10.1016/j.epsl.2009.12.028
Westerhold, T., Marwan, N., Drury, A. J., Liebrand, D., Agnini, C., Anagnostou, E., et al. (2020). An astronomically dated record of Earth’s climate and its predictability over the last 66 million years. Science 369, 1383–1387. doi:10.1126/science.aba6853
Yin, A., Rumelhart, P. E., Butler, R., Cowgill, E., Harrison, T. M., Foster, D. A., et al. (2002). Tectonic history of the Altyn Tagh fault system in northern Tibet inferred from Cenozoic sedimentation. Geol. Soc. Am. Bull. 114, 1257–1295. doi:10.1130/0016-7606(2002)114<1257:thotat>2.0.co;2
Zhang, R., Kravchinsky, V. A., Qin, J., Goguitchaichvili, A., and Li, J. X. (2021). One and a half million yearlong aridity during the middle Eocene in north-west China linked to a global cooling episode. J. Geophys. Res. Solid Earth 126, e2020JB021037. doi:10.1029/2020JB021037
Keywords: Environmental magnetism, Paratethys Sea, Red Clay, Tibetan Plateau, Eocene
Citation: Guo B, Nie J, Li J, Xiao W and Pan F (2022) Expansion/shrinkage history of the Paratethys Sea during the Eocene: New insights from eolian Red Clay records in the Altyn Mountains, northern China. Front. Earth Sci. 10:1052627. doi: 10.3389/feart.2022.1052627
Received: 24 September 2022; Accepted: 25 October 2022;
Published: 08 November 2022.
Edited by:
Weiming Liu, Institute of Mountain Hazards and Environment (CAS), ChinaReviewed by:
Jinbo Zan, Institute of Tibetan Plateau Research (CAS), ChinaCopyright © 2022 Guo, Nie, Li, Xiao and Pan. This is an open-access article distributed under the terms of the Creative Commons Attribution License (CC BY). The use, distribution or reproduction in other forums is permitted, provided the original author(s) and the copyright owner(s) are credited and that the original publication in this journal is cited, in accordance with accepted academic practice. No use, distribution or reproduction is permitted which does not comply with these terms.
*Correspondence: Junsheng Nie, am5pZUBsenUuZWR1LmNu; Jianxing Li, bGppYW54aW5nMjAwNUAxNjMuY29t
Disclaimer: All claims expressed in this article are solely those of the authors and do not necessarily represent those of their affiliated organizations, or those of the publisher, the editors and the reviewers. Any product that may be evaluated in this article or claim that may be made by its manufacturer is not guaranteed or endorsed by the publisher.
Research integrity at Frontiers
Learn more about the work of our research integrity team to safeguard the quality of each article we publish.