
94% of researchers rate our articles as excellent or good
Learn more about the work of our research integrity team to safeguard the quality of each article we publish.
Find out more
ORIGINAL RESEARCH article
Front. Earth Sci., 10 January 2023
Sec. Interdisciplinary Climate Studies
Volume 10 - 2022 | https://doi.org/10.3389/feart.2022.1050858
This article is part of the Research TopicWeather Disasters in the South China Sea and Surrounding Regions: Observations, Theories, Data Assimilation, and Numerical ForecastingView all 10 articles
 Jie Feng1,2
 Yanbin Huang2Fei Wang1Feiyan Guo3
 Wanju Li1
 Wencai Wang1Shiwen Teng1
 Fenghua Xing2Jiaming Sun1Yu Zhou2
 Lifang Sheng1,2,4*
In autumn, the clouds over the South China Sea contain more cloud water and cloud ice. Intertropical Convergence Zone sometimes can strengthen and move north, causing heavy precipitation in the northern South China Sea. To reveal the distribution and evolution of hydrometeors in the Intertropical Convergence Zone precipitation clouds, a rainfall process occurred in Xisha and surrounding regions on 16 October 2021 was analyzed by utilizing S-band dual-polarization weather radar data and fuzzy logic algorithm. The classified hydrometeors showed that drizzle, rain, and dry snow were the three most abundant types, while dry crystal was less, indicating deposition and aggregation were more active in the marine environment with sufficient water vapor. The relative content of drizzle and dry snow changed oppositely to that of rain particles, suggesting the coalescence of drizzle and the transformation of dry snow were important processes affecting the formation of rain particles. The precipitation clouds were characterized by stratiform clouds with embedded convections. The strong updraft in the convective clouds transported liquid water upward, thus dry snow could collide with supercooled water and rime to form graupel, then graupel melted to form large raindrops below the 0°C layer. However, compared with continental convective clouds, the riming was weaker. In the stratiform clouds, the ascending motion was weak, no graupel was generated, and the 0°C-layer bright band indicated that dry snow could directly contribute to the small raindrops by melting. This study revealed the evolution of hydrometeors in the Intertropical Convergence Zone precipitation clouds and found that the increase in raindrop size in convective clouds was caused by the combined effects of stronger coalescence and riming.
Microphysical processes include the mutual transformation between water vapor and various hydrometeors in clouds. Liquid hydrometeors are mainly located below the 0°C layer, while ice hydrometeors are mainly distributed above the 0°C layer (Fan et al., 2010; Zhu and Guo, 2014). Due to the complexity of ice hydrometeors in shape, size, and density, they can be further classified as ice crystals, snow, graupel, and hail, etc. The growth and evolution of these hydrometeors include condensation, coalescence, deposition, freezing, riming, aggregation, and melting, etc. (Sheng et al., 2013). Among them, riming and aggregation are important growth processes of ice hydrometeors. Riming means that ice crystals grow by colliding with supercooled water and then freezing, and aggregation refers to multiple ice crystals stick together to form snow or larger ice crystals (Zhou et al., 2016). These processes are affected by the thermal and dynamic conditions in clouds, and they also have important feedback on the cloud dynamics, ultimately affect the rainfall area, intensity, and the accumulated amount of precipitation (Hua and Liu, 2016; Lee et al., 2018; Hou et al., 2020).
In warm clouds, hydrometeors grow through condensation and coalescence, the latter is the main mechanism for raindrop formation (Zhou et al., 2017; Chen and Li, 2022). However, the diversity of ice hydrometeors increases the complexity of microphysical processes in cold clouds. In general, the riming process controls the formation of cold cloud precipitation. As the products of riming, the melting of graupel and hail below the 0°C layer is an important source of raindrops in cold rain, and the increase in graupel density implies the enhancement of precipitation rate (Cheng et al., 2010; Ribaud et al., 2019; Cao et al., 2021; Zhang et al., 2021). In the area with insufficient supercooled water, ice hydrometeors mainly grow through deposition, while abundant supercooled water can enhance riming, which promotes the conversion of ice crystals to graupel, resulting in a low concentration of ice crystals in a warm front cloud system, but high in cold front (Qi et al., 2019; Zhu and Guo, 2014). Even under the same weather system, the intensity of riming is different in different stages or types of clouds (Zhao and Lei, 2014; Hou et al., 2021).
In addition to the coalescence of cloud droplets and the melting of graupel, the formation of raindrops is also affected by the melting of snow. From radar observation, there is sometimes a strong echo band near the 0°C layer, which is called the “0°C-layer bright band”. Zhang et al. (2000) summarized the reasons for its formation as follows: the melting effect of ice crystals or snowflakes, the collision and aggregation effect of particles, and the velocity and shape effect after the melting of ice crystals or snowflakes. From the above, it can be seen that the melting of snow provides an important source of raindrops. However, previous studies have also shown that snow in the clouds was far above the 0°C layer, which made it unable to make a direct contribution to the ground rainfall, but could indirectly affect the precipitation by riming to graupel (He et al., 2010; Zhang et al., 2021). Therefore, how snow affects the raindrop formation needs to be further analyzed.
Previous research on cloud microphysics and precipitation mainly focused on North China, Pearl River Delta, and Yangtze River Delta, but relatively little on marine areas. Xisha is located in the northwest region of the South China Sea (SCS). In autumn, cold air often interacts with tropical disturbances in the northward moving Intertropical Convergence Zone (ITCZ) to form precipitation (Li et al., 2016; Wang et al., 2021). Both satellite and ground-based observations demonstrated that precipitation peaked in autumn over most parts of the SCS, especially in September and October, with 58% heavy rainfall caused by non-typhoon systems, of which ITCZ was an important member (Li et al., 2006; Xiao et al., 2013; Li et al., 2016; Feng et al., 2017). So far, many studies have focused on the thermal and dynamic analysis of such precipitations, with less attention paid to microphysics, especially on the distribution and evolution of hydrometeors (Zhao et al., 2011; Feng et al., 2017; Wang et al., 2021). The dual-polarization weather radar can transmit and receive horizontal and vertical electromagnetic waves to obtain the size, shape, phase state, density, and spatial orientation of particles in clouds, then the classification of hydrometeors can be realized combined with algorithms (Liu and Chandrasekar, 2000; Liu et al., 2005; Paulitsch et al., 2009). Based on the observation data of S-band dual-polarization weather radar and fuzzy logic algorithm, this paper classifies the hydrometeors in the clouds during an autumn ITCZ precipitation process in the northwestern SCS and analyzes the distribution and evolution of these particles.
This paper is organized as follows. Section 2 describes the data and methods used in the study. Section 3 introduces the precipitation event. Section 4 presents the hydrometeor classification and evolution during the rainfall. The distribution of hydrometeors in different cloud types is analyzed in Section 5. Conclusion are summarized in Section 6.
Reanalysis data including geopotential height, air temperature, meridional wind, zonal wind, specific humidity, and mean sea level pressure, with a spatial resolution of 0.25° × 0.25° and a temporal resolution of 1 h, were obtained from European Center for Medium-Range Weather Forecasts (ERA5 | ECMWF) to analyze the atmospheric circulation of the precipitation event. The sounding data, surface meteorological elements, and S-band dual-polarization weather radar data were all provided by Sansha Meteorological Station on Yongxing Island (112.33°E, 16.83°N). The sounding data were used to analyze the stratification state of atmosphere and determine the altitudes of the specific temperature layers. To better capture the vertical structure of atmosphere during the precipitation process, a 6-h intensive sounding observation was conducted. Surface meteorological elements include temperature, precipitation, wind speed, and wind direction, with a temporal resolution of 1 h. The S-band dual-polarization weather radar can emit horizontal and vertical electromagnetic waves with a wavelength of 10 cm. The radar operates in volume coverage pattern 21 (i.e., scanning is completed within 6 min for nine elevation angles: 0.5°, 1.5°, 2.4°, 3.3°, 4.3°, 6.0°, 9.9°, 14.6°, and 19.5°), and its radial resolution is 250 m. The polarization parameters of radar include reflectivity Z, differential reflectivity
Reflectivity Z represents the sum of the sixth power of the diameters of all hydrometeors in a unit volume, in dBZ, the formula is as follows:
here
The relationship between rain rate R (
In this study, the relationship was used for rainfall estimation.
There is no clear boundary between the polarization parameters of different hydrometeors, the fuzzy logic algorithm divides the polarization parameters into various levels so that the particles can be identified according to the flexible classification principle (Liu and Chandrasekar, 2000). Liu and Chandrasekar (2000) used neural network learning to determine the constant parameter values in the algorithm. Since then, the algorithm has been further optimized (Cao et al., 2005; Park et al., 2009; Song et al., 2021). At present, this method has been widely used to classify hydrometeors based on radar observation (Dolan et al., 2013; Wu et al., 2018). The process of the algorithm includes the following four steps: fuzzification, inference, aggregation and defuzzification.
Fuzzification transforms the polarization parameter value into the possibility (also known as a fuzzy set) of being judged as a certain hydrometeor type by constructing a membership function. In the membership function, the observed parameters are independent variables and the fuzzy set is a dependent variable. A one-to-one membership function was applied between each hydrometeor type and each polarization parameter, 10 types of hydrometeors (drizzle, rain, dry snow, dry crystal, wet snow, dry graupel, wet graupel, small hail, large hail, rain hail) could be distinguished, and four parameters (Z,
where x is the value of radar polarization parameter,
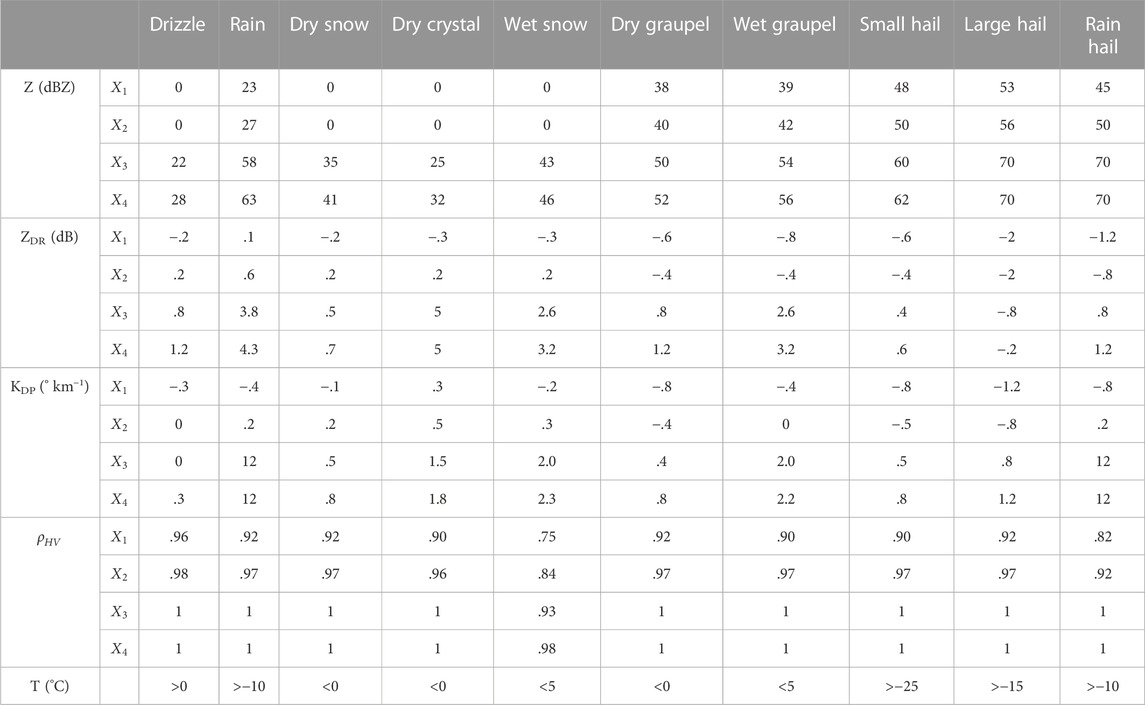
TABLE 1. Parameters of the membership functions for 10 hydrometeor types.
The membership function value
For each point, there should be 10 aggregated values, the defuzzification aims to select the type with the largest RS from them and take it as the classification result.
Although the fuzzy logic algorithm can only identify the dominant hydrometeor type, and the classification results are affected by the quality of radar data and temperature profile (Dolan et al., 2013). It is still an effective method to investigate the spatial and temporal distribution of hydrometeors in clouds, and the uncertainty can be reduced by statistical analysis.
From the evening to the night of 16 October 2021, there were thunderstorms occurred in Xisha and surrounding regions. The precipitation on Yongxing Island was concentrated from 19:00 to 20:00 (UTC+8, the same below), with the hourly rainfall of 11.3 mm (Figure 1A). Due to the “Cone of Silence”, it is difficult to study the cloud directly above the radar, and to reduce the influence of radar scanning field on statistics, a fixed square region (Region 1, 111.6°E–111.9°E, 16.8°N–17.1°N, a size that can contain a complete convective cell) in the west was selected for further analysis, instead of tracking the clouds. Mean rainfall of Region 1 estimated by Eq. (2) is shown in Figure 1B, and radar reflectivity during the rainfall period are shown in Figure 2. The black square in Figure 2 denotes Region 1, and radar reflectivity depicts that the precipitation clouds were mixture of convective and stratiform clouds. Scattered convective bubbles with high reflectivity were embedded in broad stratiform clouds with low reflectivity. Under the prevailing east wind, the clouds system kept moving westward, and the Region 1 was successively affected by different clouds. At 20:01, the strong echo belt from northeast to southwest was located in the east of Region 1, then it moved westward and weakened at 20:31. At 21:17, the rear enhanced convective clouds moved to the eastern edge of Region 1, making the rainfall begin to increase. And at 21:43, Rigion 1 was almost covered by convective clouds, the strongest rainfall occurred, with the rate increasing from less than 4 mm h−1 to more than 14 mm h−1. Later, as the convective clouds moved out and decayed, the echo over Region 1 weakened and the mean rain rate dropped to less than 2 mm h−1, the rainfall tended to end.
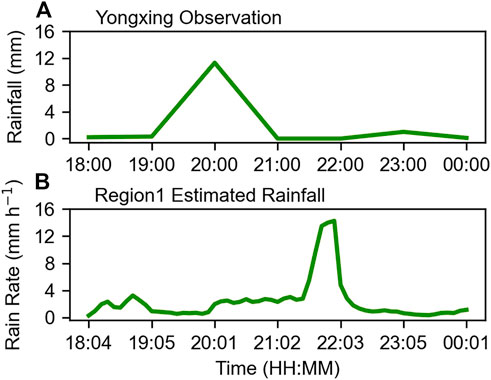
FIGURE 1. Time series of (A) hourly rainfall (units: mm) observed on Yongxing Island and (B) rain rate (units: mm h−1) of Region 1 obtained by radar quantitative precipitation estimation on 16 October 2021 (UTC + 8, the same below).
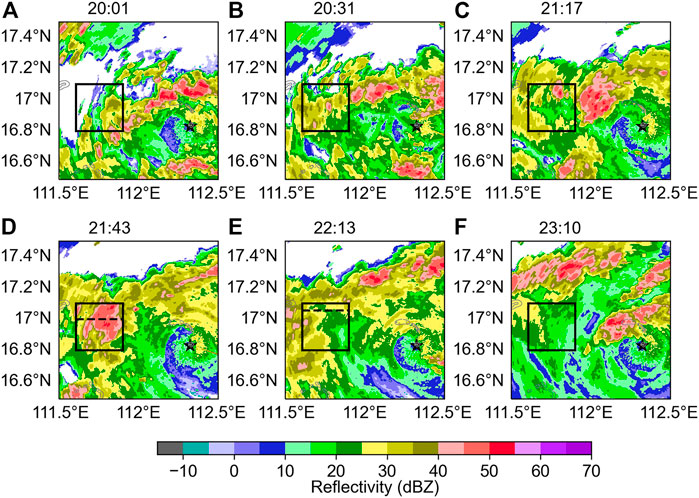
FIGURE 2. Distribution of composite reflectivity (units: dBZ) at (A) 20:01, (B) 20:31, (C) 21:17, (D) 21:43, (E) 22:13, and (F) 23:10 on 16 October. The black square denotes Region 1 (the same below).
Figure 3 delineates large-scale circulation at 17:00 on 16 October. At 200 hPa, the northern SCS was controlled by the South Asian High, and there was a divergence in the upper level (Figure 3A). The East Asian Trough at 500 hPa in the middle and high latitudes was located in the east of 120°E (Figure 3B). The continental high corresponding to the upper trough carried strong cold air southward (Figure 3D). The ridge of Western Pacific Subtropical High at 500 hPa was located near 28°N and extended west to 95°E. Therefore, the warm and humid airflow on the southwest side of the subtropical high was conducive to the transport of water vapor and the development of ascending motion. In the lower layers (700 hPa and below), ITCZ controlled the northern SCS and a tropical depression formed in the ITCZ. Lander (1996) pointed out that ITCZ was located south of 10°N in October, compared with its climatological position, both wind convergence and the maximum outgoing longwave radiation during the event were around 15°N, indicating a northward shift of ITCZ (shown in Supplementary Figures S1, S2). Yongxing Island was located in the north of the depression, the northeast and the southeast airflow converged to form a low-level easterly jet, which provided sufficient water vapor flux for the occurrence of the rainfall (Figure 3C). The continuous southward movement of the continental high increased the pressure gradient in the north of the tropical depression and further intensified the dynamic field. The above analysis indicates that the rainfall was affected by the interactions of multiple systems, including the continental high, the Western Pacific Subtropical High, and the tropical depression in the ITCZ. In autumn, several heavy precipitation events in Xisha were caused by this synoptic situation, so the case was representative to some extent (Feng et al., 2015; Li et al., 2016).
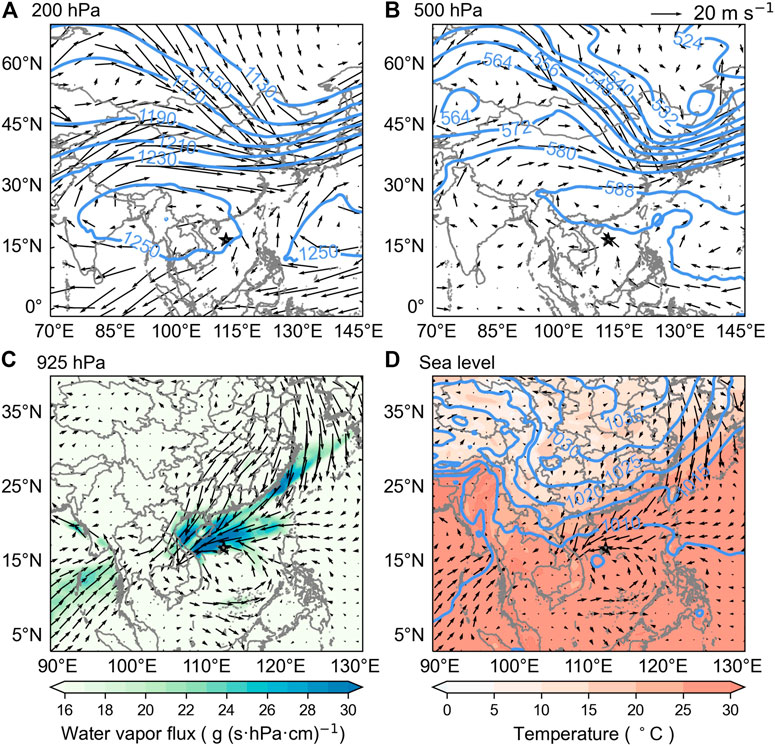
FIGURE 3. Large-scale circulation at 17:00 on 16 October 2021. (A) Geopotential height (blue contours, units: dagpm) and wind field at 200 hPa; (B) Geopotential height (blue contours, units: dagpm) and wind field at 500 hPa; (C) Water vapor flux [shading, units: g (s·hPa·cm)−1] and wind field at 925 hPa; (D) Mean sea level pressure (blue contours, units: hPa), 2 m temperature (shading, units: °C) and 10 m wind field. The black star represents Sansha meteorological station (the same below).
As shown in Figure 4, the temperature profile, dew point temperature profile, and Convective Available Potential Energy (CAPE) in the skew T-lnP diagram were all “narrow and long” at 19:00 on 16 October, indicating there was plenty water vapor from bottom to top, which was favorable for the formation and development of the rainfall. The CAPE reached 3018.3 J kg−1, and the convective inhibition (CIN) was 0, these were thermodynamic factors triggering convection. The lifting condensation level (LCL) was around 150 m, which was responsible for the condensation of water vapor, and the release of latent heat further promoted the development of convection. The 0°C layer was located near 5060 m, and the thick warm cloud layer provided an ample area for the development of warm rain. From the sounding data, the corresponding altitudes of 5°C, 0°C, −10°C, −15°C, and −25°C layers were 4,240, 5,060, 7,160, 8,110, and 9,600 m respectively, which were used to classify hydrometeors in fuzzy logic algorithm. Easterly winds prevailed during the rainfall, the wind speed exceeded 20 m s−1 from 800 to 920 hPa, and the vertical wind shear was 15.2 m s−1 from 0 to 6 km. High CAPE, low LCL, and moderate deep vertical wind shear were all favorable conditions for the development of the convection.
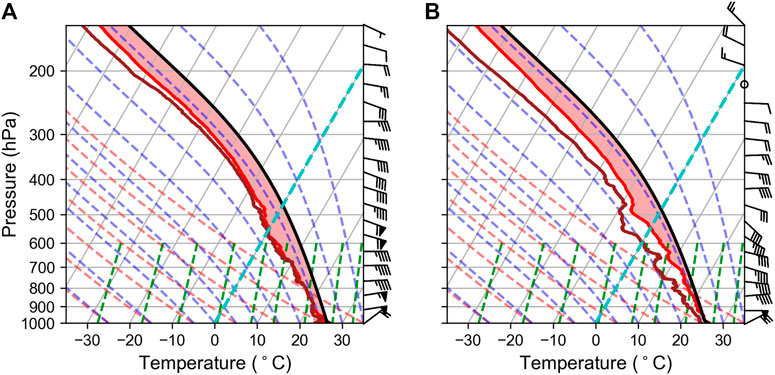
FIGURE 4. The skew T-lnP diagram of Sansha meteorological station at 19:16 on 16 October (A), and 01:18 on 17 October (B). The brown and red solid lines are the dew point temperature and temperature profile, respectively.
The dew point temperature form bottom to top decreased significantly at 01:00 on 17 October, demonstrating that the relative humidity decreased, because the rainfall consumed a certain amount of water vapor. Moreover, the convective instability energy below 700 hPa was reduced, but the CAPE was still high (2860.61 J kg−1), which provided energy for the rainfall on 17 October.
To verify the accuracy of algorithm results, the correlation coefficient between the time series of mean rain rate in Region 1 and the time series of particles classified as rain was calculated. The correlation was up to .93, which was statistically significant at the 95% confidence level, indicating that the classification results of the fuzzy logic algorithm were reasonable.
Figure 5 shows the hydrometer distribution at 4.3° elevation at the same time as Figure 2. It can be seen that the distribution of hydrometeors depended on the temperature inside the clouds. Liquid hydrometeors (rain and drizzle) were mainly located below the 0°C layer, and the greater the reflectivity, the larger the raindrops. Only a few rain particles were transported upward to form supercooled water above the 0°C layer, where ice hydrometeors dominated, among which dry snow was the main type, mixed with wet snow and a small amount of dry crystal. The transition zone was located near the 0°C layer, where liquid and ice hydrometeors coexisted, in which wet snow was abundant, and graupel scattered in the strong echo area.
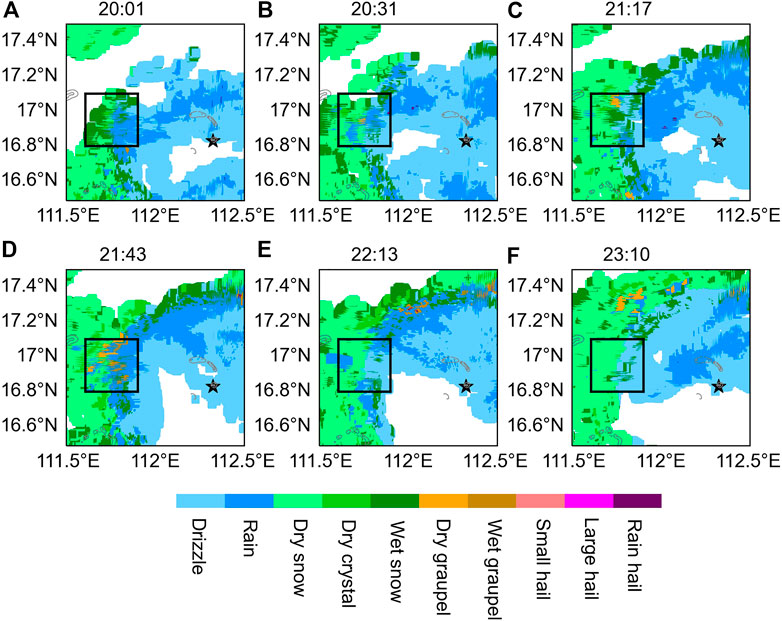
FIGURE 5. Distribution of hydrometeors at 4.3° elevation (A) 20:01, (B) 20:31, (C) 21:17, (D) 21:43, (E) 22:13, and (F) 23:10 on 16 October.
To explore the evolution of hydrometeors during the rainfall process and their impact on the raindrop formation, the relative content of particles was counted, and the correlations between rain particles and other types of hydrometeor were calculated (Table 2). The three most types were drizzle (9.42%–75.39%), rain (0.35%–53.54%) and dry snow (0%–52.59%), followed by wet snow (0%–15.32%) and dry crystal (0%–4.55%), dry graupel and wet graupel (0%–1.72%, 0%–1.93%) were the least, and there were almost no hails (small hail, large hail, rain hail). Abundant liquid and ice hydrometeors indicated that both warm and cold cloud played an important role in the rainfall.
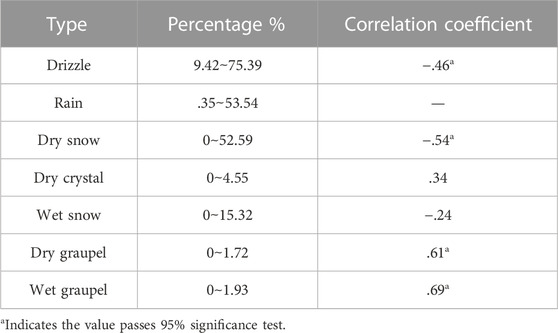
TABLE 2. The relative content of each hydrometeor type in Region 1 and its correlation with rain particles.
Figure 6 shows the time series of the relative content of rain, dry graupel, wet graupel, drizzle, and dry snow. Although the content of dry graupel and wet graupel was small, their relative content showed a consistent change with rain particles, with a correlation coefficient of .61 and .69 respectively (Figures 6A, B), which meant graupel could enhance the ground rainfall (Hua and Liu, 2016). However, due to the low quantity of graupel, its melting was not the main source of rain particles. Figure 6C shows that the increase of rain particles was accompanied by the decrease of drizzle, the opposite trends indicated that the coalescence played an important role in this event. As a kind of giant cloud condensation nuclei with great hygroscopicity, high sea salt aerosol concentration in marine environment can accelerate the conversion of cloud water to rain water, promoting rain formation (Rosenfeld, 2018; Jiang et al., 2019). Compared with the previous research (Li et al., 2017), the dry snow over the Xisha area was rich while the dry crystal was less. This might be because the moist marine environment was conducive to deposition and aggregation, making the generation of snow easy. In addition, as shown in Figure 6D, at 18:04, the relative content of dry snow approached 0%, then it gradually increased with time, and had the strongest negative correlation with rain particles (with a correlation coefficient of −.54). This suggested that the initial rain particles were formed by the collision of drizzle, and then the increasing dry snow also had an important contribution to rain formation. When the focus region was enlarged to Region 2 (Supplementary Figure S3), it was found that the above rule was still valid, but the relative content of dry snow was more negatively correlated with rain particles (−.83, shown in Supplementary Figure S4), which further indicated that during the rainfall dry snow had an important contribution to rain formation.
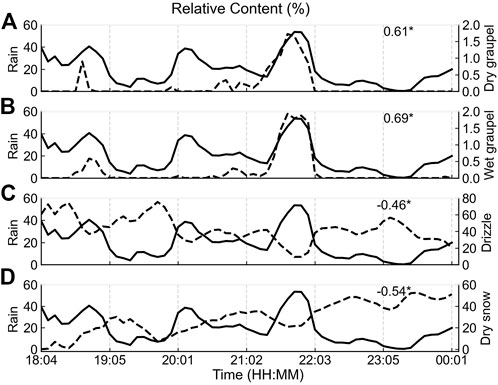
FIGURE 6. Time series of the relative content of rain, dry graupel, wet graupel, drizzle, and dry snow in Region 1. The black solid line represents rain particles, the black dashed line in (A–D) represents dry graupel, wet graupel, drizzle, and dry snow, respectively. The number shows their correlation coefficient, and * indicates the value passes 95% significance test.
Under the prevailing east wind, the precipitation cloud system kept moving westward, and the development and dissipation of clouds changed rapidly. To study the distribution and evolution of hydrometeors in different cloud types, convective clouds at 21:43 (Figure 2D) on 16 October and stratiform clouds at 22:13 (Figure 2E) in Region 1 were selected. Table 3 shows the percentage of reflectivity with different intensities in the two cloud types. There were strong echoes in the convective clouds, 48.89% of which exceeded 30 dBZ, while reflectivity of the stratiform clouds was mainly below 30 dBZ, and only 4.54% was greater than that.
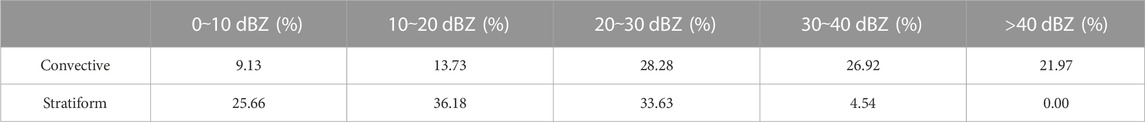
TABLE 3. Percentage of reflectivity in the convective and stratiform clouds.
Radar composite reflectivity and hydrometeors distribution of the convective clouds at 21:43 on 16 October are shown in Figures 2D, 5D respectively. From the classification results at 4.3° elevation in Figure 5D, it can be seen that hydrometeors below the 0°C layer were large rain particles and mixed with wet snow and wet graupel, while above the 0°C layer were mainly dry snow and mixed with dry graupel. A section along the dashed lines in Figure 2D was chosen to analyze the vertical characteristics of the convective clouds, the results are shown in Figure 7, in which the two black horizontal dashed lines represent the 0°C and – 38°C isotherms respectively. The convective clouds were fully developed with the echo top height of 11 km, and the reflectivity greater than 40 dBZ was below the 0°C layer (Figure 7A). Figure 7B shows that graupel existed near the 0°C layer with reflectivity greater than 40 dBZ, which was consistent with the results of Wu et al. (2018). According to the spatial distribution of particles, it can be inferred that the sources of graupel mainly included the automatic conversion of snow to graupel, freezing of rain to graupel when colliding with snow or collected by snow. The melting of ice hydrometeors was an important source of ground rainfall. In the strong convection areas, snow can rime to form graupel, and graupel can further melt to form large raindrops (Wu et al., 2018).
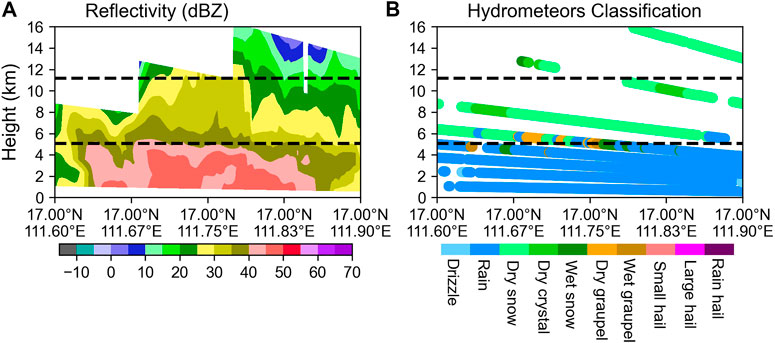
FIGURE 7. Distribution of (A) radar reflectivity (units: dBZ) and (B) hydrometeors at 4.3° elevation in the convective clouds at 21:43 on 16 October along the section in Figure 2D. The black dashed line represents 0°C and −38°C isotherms, respectively.
With the removal of convective system, Region 1 was covered by stratiform clouds at 22:13 on 16 October, the echo intensity obviously weakened (Figure 2E). Hydrometeors below the 0°C layer was small size drizzle, and there was no graupel existed (Figure 5E). The section analysis shows that the echo distribution was flat and conformed to the characteristics of stratiform clouds (Figure 8A). Compared with the convective clouds, the echo top height decreased. The reflectivity greater than 30 dBZ was mainly below the 0°C layer, and a 0°C-layer bright band generated. Above the 0°C layer, dry snow dominated, mixed with a small amount of dry crystal (Figure 8B). According to the formation of bright bands and the distribution of particles, it could be speculated that the formation of the bright band was mainly caused by the melting of snow and the change of particle velocity and shape after melting, which indicated that snow could directly affect ground rainfall in the stratiform clouds by melting. In addition, the existence of the bright band also suggested that the ascending motion in the clouds was weak, creating favorable conditions for the melting of snow.
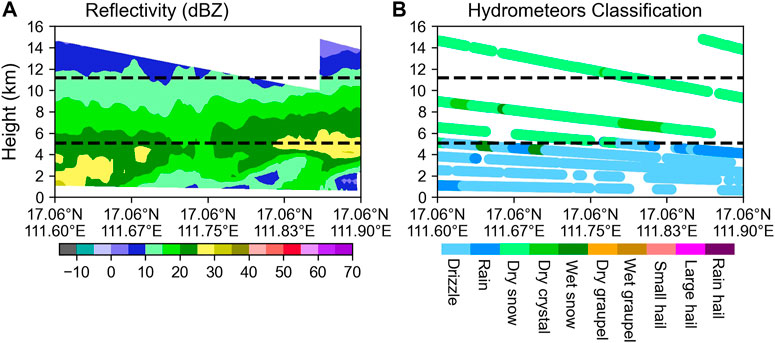
FIGURE 8. Distribution of (A) radar reflectivity (units: dBZ) and (B) hydrometeors at 4.3° elevation in the stratiform clouds at 22:13 on 16 October along the section in Figure 2E. The black dashed line represents 0°C and −38°C isotherms, respectively.
During this tropical marine rainfall, the particles grew through deposition and aggregation above the 0°C layer, and rimed in the supercooled water zone; the rimed particles fell below the 0°C layer and melted, finally forming raindrops through condensation and coalescence growth. This was a typical “seeding-feeding” structure (Hong and Zhou, 2005; He et al., 2015). To explore the effect of ice hydrometeors on raindrop formation and their evolution in different cloud types, the relative content of hydrometeors was analyzed (Table 4). Among them, supercooled water refers to rain particles that existed above the 0°C layer. The relative content of all kinds of hydrometeors was significantly different. In the upper layer where the temperature was lower than −20°C, there were only three type hydrometeors: dry snow, dry crystal, and wet snow. Among them, dry snow was the most, accounting for 10.35% and 19.19% of the total in the convective and stratiform clouds respectively, and 6.81% and 11.44% of them were located above the −38°C layer. It is generally considered that – 38°C is the threshold temperature for homogeneous nucleation of particles, the result shows that homogeneous nucleation could happen above marine area, then dry snow was formed through active deposition and aggregation. In the middle layer of 0 to −20°C, the amount of supercooled water in the convective clouds was more than that in the stratiform clouds (4.18% and 1.28% respectively), the reason was that the ascending motion was more vigorous in the convective clouds, so the liquid hydrometeors in the lower layer was transported to the middle layer. The increase in supercooled water is in favor of rimming. Therefore, dry snow in the convective clouds was consumed and graupel was generated, while no graupel appeared in the stratiform clouds in either the middle or lower layer. This showed that the “seeding-feeding” phenomenon in the convective bubbles was more active. However, compared with the results on continental convective clouds of Li et al. (2017), the content of graupel was less, suggesting that the riming in the marine convective clouds was weaker, this might be attributed to lower anthropogenic aerosol concentration. As an important source of cloud condensation nuclei, high anthropogenic aerosol concentration can reduce the size of cloud droplets (Albrecht, 1989). On the one hand, it can reduce the efficiency of converting cloud water to rain water and the collision between ice crystals and supercooled water; on the other hand, the decrease in the coalescence efficiency increases the liquid water content, providing more cloud water for riming and freezing (Cheng et al., 2010). Cao et al. (2021) and Xiao et al. (2016) also found that high anthropogenic aerosol concentration could ultimately increase surface rainfall by strengthen riming. In the lower layer where the temperature was higher than 0°C, there were mainly liquid types: drizzle and rain. Compared with the stratiform clouds, the size of raindrops in the convective clouds was larger, mainly because of the following two reasons. Firstly, ice hydrometeors in the upper layer in the convective clouds, such as dry snow, could form graupel by riming in the supercooled water zone, and then the graupel melt to form larger size liquid phase particles. Secondly, the stronger updraft in the convective clouds prevented the raindrops of small size from falling to the ground, so the smaller raindrops suspended in the air were easily collected by the larger ones (Seela et al., 2018; Bao et al., 2020).
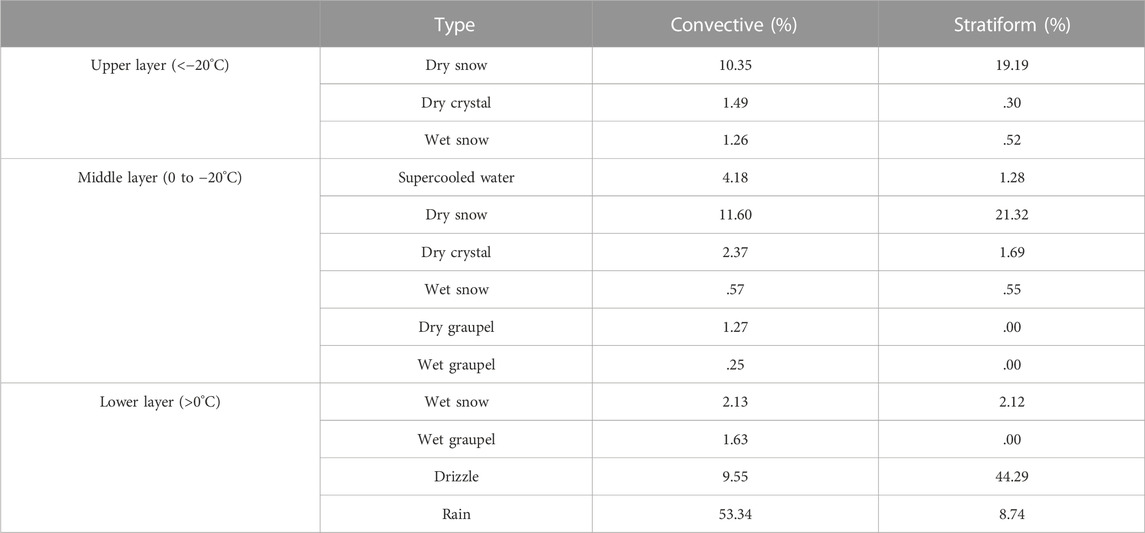
TABLE 4. The relative content of hydrometeors in different layers of the convective and stratiform clouds.
One autumn rainfall caused by the northward movement of ITCZ in Xisha and surrounding regions on 16 October 2021 was analyzed by using S-band dual-polarization weather radar data and fuzzy logic algorithm, to explore the microphysics mechanisms. The conclusions are as follows:
1) The rainfall event was caused by the interactions of the Western Pacific Subtropical High, the continental high, and the tropical depression in the ITCZ. The atmosphere was thermally unstable, with low LCL, large CAPE, and moderate vertical wind shear.
2) Radar quantitative precipitation estimation showed the peak mean rain rate of Region 1 was 14.3 mm h−1. Drizzle, rain, and dry snow were the three most types in the precipitation clouds. Below the 0°C layer, there were mainly liquid hydrometeors, and the greater the reflectivity, the larger the particles. Dry snow was dominant above the 0°C layer, sufficient water vapor in the marine environment promoted the deposition and aggregation growth of ice particles, making the dry snow more than dry crystal. The transition zone was located around the 0°C layer where liquid and ice hydrometeors coexisted, with graupel scattered in the strong echo region (>40 dBZ).
3) The relative content of dry graupel and wet graupel showed consistent trends with rain particles, which confirmed the generation of graupel could enhance surface rainfall, but the melting of it was not the main source of raindrops because of its low content. The opposite trend between drizzle, dry snow and rain particles indicated that the coalescence growth and transformation of snow made great contributions to the ground rainfall.
4) In the stratiform clouds, dry snow mainly melted to small raindrops because of insufficient supercooled water. The vigorous vertical development in the convective clouds transported liquid water above the 0°C layer to form supercooled water, then dry snow could rime to form graupel, and large raindrops were generated by graupel melting. The stronger riming and coalescence growth in the convective clouds made the raindrops larger than that of stratiform clouds. Compared with continental convective clouds, the riming in marine environment was weaker, which might be attributed to lower anthropogenic aerosol concentration.
The original contributions presented in the study are included in the article/Supplementary Material, further inquiries can be directed to the corresponding author.
JF conceived the idea, processed the data, plotted figures, and wrote the manuscript. YH and FX provided the observed data and gave guidance on the data processing. FG, ST, YH, and FW improved the manuscript. FW, WL, WW, JS, and YZ contributed to the study design. LS gave scientific research guidance and revised the manuscript.
This study is supported by the National Natural Science Foundation of China (Grant No. 41975008) and the Key Laboratory of South China Sea Meteorological Disaster Prevention and Mitigation of Hainan Province (Grant No. SCSF201906).
The authors would like to thank ECMWF for providing the free dataset; to Python for the computing and plotting techniques; to editor and reviewers for their efforts and constructive comments that have improved the manuscript.
The authors declare that the research was conducted in the absence of any commercial or financial relationships that could be construed as a potential conflict of interest.
All claims expressed in this article are solely those of the authors and do not necessarily represent those of their affiliated organizations, or those of the publisher, the editors and the reviewers. Any product that may be evaluated in this article, or claim that may be made by its manufacturer, is not guaranteed or endorsed by the publisher.
The Supplementary Material for this article can be found online at: https://www.frontiersin.org/articles/10.3389/feart.2022.1050858/full#supplementary-material
Albrecht, B. A. (1989). Aerosols, cloud microphysics, and fractional cloudiness. Science 245, 1227–1230. doi:10.1126/science.245.4923.1227
Bao, X., Wu, L., Zhang, S., Li, Q., Lin, L., Zhao, B., et al. (2020). Distinct raindrop size distributions of convective inner-and outer-rainband in typhoon maria (2018). J. Geophys. Res. Atmos. 125 (14), e2020JD032482. doi:10.1029/2020JD032482
Cao, J., Liu, L., and Ge, R. (2005). A study of fuzzy logic method in classification of hydrometeors based on polarimetric radar measurement. Chin. J. Atmos. Sci. 29 (5), 827–836. doi:10.3878/j.issn.1006–9895.2005.05.15
Cao, Q., Jiang, B., Shen, X., Lin, W., and Chen, J. (2021). Microphysics effects of anthropogenic aerosols on urban heavy precipitation over the Pearl River Delta, China. Atmos. Res. 253, 105478. doi:10.1016/j.atmosres.2021.105478
Chen, Z., and Li, Y. (2022). formation and hydrometeor type evolution of a typical warm precipitation based on cloud radar and precipitation radar data. Trans. Atmos. Sci. 45 (1), 87–98. doi:10.13878/j.cnki.dqkxxb.20210819001
Cheng, C.-T., Wang, W.-C., and Chen, J.-P. (2010). Simulation of the effects of increasing cloud condensation nuclei on mixed-phase clouds and precipitation of a front system. Atmos. Res. 96 (2–3), 461–476. doi:10.1016/j.atmosres.2010.02.005
Dolan, B., Rutledge, S. A., Lim, S., Chandrasekar, V., and Thurai, M. (2013). A robust C-band hydrometeor identification algorithm and application to a long-term polarimetric radar dataset. J. Appl. Meteorol. Climatol. 52 (9), 2162–2186. doi:10.1175/JAMC–D–12–0275.1
Fan, Y., Guo, X., Zhang, D., Fu, D., Chen, J., and Ma, Y. (2010). Airborne particle measuring system measurement on structure and size distribution of stratocumulus during august to september in 2004 over beijing and its surrounding areas. Chin. J. Atmos. Sci. 34 (6), 1187–1200. doi:10.3878/j.issn.1006–9895.2010.06.12
Feng, W., Fu, S., and Zhao, F. (2015). Circulation of extreme rainstorm and its anomalous characteristics during post-flood period of the last decade in hainan Island. Meteorol. Mon. 41 (2), 143–152. doi:10.7519/j.issn.1000-0526.2015.02.002
Feng, W., Wu, W., Zhao, F., and Zhou, L. (2017). Comparative analysis of circulation feature and dynamic structure of the rainstorms with different intensity during the autumn flood season in hainan Island. J. Meteorological Sci. 37 (6), 784–796. doi:10.3969/2016jms.0077
He, H., Gao, Q., Liu, X., Zhou, W., and Jia, X. (2015). Numerical simulation of the structure characteristics and precipitation mechanism of stratiform clouds with embedded convections. Chin. J. Atmos. Sci. 39 (2), 315–328. doi:10.3878/j.issn.1006–9895.1404.14102
He, Y., Xiao, H., and Lü, D. (2010). Analysis of hydrometeor distribution characteristics in stratiform clouds using polarization radar. Chin. J. Atmos. Sci. 34 (1), 23–34. doi:10.3878/j.issn.1006–9895.2010.01.03
Hong, Y., and Zhou, F. (2005). A numerical simulation on study of precipitation formation mechanism of "Seeding-Feeding" cloud system. Chin. J. Atmos. Sci. 29 (6), 885–896. doi:10.3878/j.issn.1006–9895.2005.06.05
Hou, T., Lei, H., He, Y., Yang, J., Zhao, Z., and Hu, Z. (2021). Aircraft measurements of the microphysical properties of stratiform clouds with embedded convection. Adv. Atmos. Sci. 38 (6), 966–982. doi:10.1007/s00376–021–0287–8
Hou, T., Lei, H., Hu, Z., Yang, J., and Li, X. (2020). Simulations of microphysics and precipitation in a stratiform cloud case over northern China: Comparison of two microphysics schemes. Adv. Atmos. Sci. 37 (1), 117–129. doi:10.1007/s00376–019–8257–0
Hua, C., and Liu, Q. (2016). Sensitivity of landing typhoon structure and precipitation to varying cloud microphysical processes. J. Trop. Meteorol. 22 (3), 341–351. doi:10.16555/j.1006–8775.2016.03.008
Jiang, B., Lin, W., Li, F., and Chen, J. (2019). Sea-salt aerosol effects on the simulated microphysics and precipitation in a tropical cyclone. J. Meteor. Res. 33 (1), 115–125. doi:10.1007/s13351–019–8108–z
Lander, M. A. (1996). Specific tropical cyclone track types and unusual tropical cyclone motions associated with a reverse-oriented monsoon trough in the western north pacific. Weather Forecast 11 (2), 170–186. doi:10.1175/1520-0434(1996)011<0170:stctta>2.0.co;2
Lee, H., Baik, J.-J., and Khain, A. P. (2018). Turbulence effects on precipitation and cloud radiative properties in shallow cumulus: An investigation using the WRF-LES model coupled with bin microphysics. Asia Pac. J. Atmos. Sci. 54, 457–471. doi:10.1007/s13143–018–0012–4
Li, X., Zhou, Y., Xiao, H., Wu, W., Zhai, L., Guo, F., et al. (2017). Synthesis and biological evaluation of a series of bile acid derivatives as FXR agonists for treatment of NASH. Chin. J. Atmos. Sci. 41 (6), 1246–1251. doi:10.1021/acsmedchemlett.7b00318
Li, Y., Li, X., Feng, W., and Chen, Y. (2016). Investigation of the synoptic situation associated with autumnal non-TC heavy precipitation in Xisha. Meteorol. Mon. 42 (8), 934–943. doi:10.7519/j.issn.1000–0526.2016.08.003
Li, Y., Lu, R.-Y., and He, J.-H. (2006). Tropical large-scale atmospheric circulation and sea surface temperature corresponding to autumn precipitation in hainan Island. Chin. J. Atmos. Sci. 30 (5), 1034–1042. doi:10.3878/j.issn.1006-9895.2006.05.29
Liu, H., and Chandrasekar, V. (2000). Classification of hydrometeors based on polarimetric radar measurements: Development of fuzzy logic and neuro-fuzzy systems, and in situ verification. J. Atmos. Ocean. Technol. 17 (2), 140–164. doi:10.1175/1520–0426(2000)017<0140:COHBOP>2.0.CO;2
Liu, L., Zhang, P., Xu, Q., Kong, F., and Liu, S. (2005). A model for retrieval of dual linear polarization radar fields from model simulation outputs. Adv. Atmos. Sci. 22 (5), 711–719. doi:10.1007/BF02918714
Park, H., Ryzhkov, A. V., Zrnic, D. S., and Kim, K.-E. (2009). The hydrometeor classification algorithm for the polarimetric WSR-88d: Description and application to an MCS. Weather Forecast 24 (3), 730–748. doi:10.1175/2008WAF2222205.1
Part, O. P., and Barros, A. P. (2009). Exploring the transient behavior of Z–R relationships: Implications forRadar rainfall estimation. J. Appl. Meteorology Climatol. 48 (10), 2127–2143. doi:10.1175/2009JAMC2165.1
Paulitsch, H., Teschl, F., and Randeu, W. L. (2009). Dual-polarization C-band weather radar algorithms for rain rate estimation and hydrometeor classification in an alpine region. Adv. Geosci. 20, 3–8. doi:10.5194/adgeo–20–3–2009
Qi, P., Guo, X., Lu, G., Duan, Y., Li, B., Wu, Z., et al. (2019). Aircraft measurements of a stable stratiform cloud with embedded convection in eastern taihang mountain of north China: Characteristics of embedded convection and melting layer structure. Chin. J. Atmos. Sci. 43 (6), 1365–1384. doi:10.3878/j.issn.1006–9895.1901.18220
Ribaud, J.-F., Machado, L. A. T., and Biscaro, T. (2019). X-band dual-polarization radar-based hydrometeor classification for Brazilian tropical precipitation systems. Atmos. Meas. Tech. 12 (2), 811–837. doi:10.5194/amt–12–811–2019
Rosenfeld, D. (2018). “Chapter 6—Cloud-aerosol-precipitation interactions based of satellite retrieved vertical profiles of cloud microstructure,” in Remote sensing of aerosols, clouds, and precipitation. Editors T. Islam, Y. Hu, A. Kokhanovsky, and J. Wang (Elsevier), 129–152.
Seela, B. K., Janapati, J., Lin, P.-L., Wang, P. K., and Lee, M.-T. (2018). Raindrop size distribution characteristics of summer and winter season rainfall over north taiwan. J. Geophys. Res. Atmos. 123 (20602–11), 11, 602–611, 624. doi:10.1029/2018JD028307
Sheng, P., Mao, J., Li, J., Mo, Z., Zhang, A., Sang, J., et al. (2013). Atmospheric physics. Beijing: Peking University Press.
Song, W. T., Li, Y. Y., Huang, H., and Zhu, K. F. (2021). Hydrometeors classification and its application based on S-band dual polarization radar data. Trans. Atmos. Sci. 44 (2), 209–218. doi:10.13878/j.cnki.dqkxxb.20200318001
Wang, F., Sheng, L., An, X., Liu, Q., Zhou, H., Zhang, Y., et al. (2021). Controls on the northward movement of the ITCZ over the South China sea in autumn: A heavy rain case study. Adv. Atmos. Sci. 38 (10), 1651–1664. doi:10.1007/s00376–021–0445–z
Wu, D., Zhao, K., Kumjian, M. R., Chen, X., Huang, H., Wang, M., et al. (2018). Kinematics and microphysics of convection in the outer rainband of typhoon nida (2016) revealed by polarimetric radar. Mon. Weather Rev. 146 (7), 2147–2159. doi:10.1175/MWR–D–17–0320.1
Xiao, C., Yuan, W., Li, J., and Yu, R. (2013). Preliminary study of autumn rain in the South China sea. Clim. Environ. Res. 18 (6), 693–700. doi:10.3878/j.issn.1006–9585.2013.12163
Xiao, H., Yin, Y., Chen, Q., and Zhao, P. (2016). Impact of aerosol and freezing level on orographic clouds: A sensitivity study. Atmos. Res. 176–177, 19–28. doi:10.1016/j.atmosres.2016.02.014
Yu, X., Yao, X., Xiong, T., Zhou, X., Wu, H., Deng, B., et al. (2006). Doppler weather radar principle and business application. Beijing: China Meteorological Press.
Zeng, Q., Zhang, Y., Lei, H., Xie, Y., Gao, T., Zhang, L., et al. (2019). Microphysical characteristics of precipitation during pre-monsoon, monsoon, and post-monsoon periods over the South China sea. Adv. Atmos. Sci. 36 (10), 1103–1120. doi:10.1007/s00376-019-8225-8
Zhang, M., Deng, X., Zhu, R., Ren, Y., and Xue, H. (2021). The impact of aerosol vertical distribution on a deep convective cloud. Atmosphere 12 (6), 675. doi:10.3390/atmos12060675
Zhao, F., Wang, F., and Feng, W. (2011). Preliminary study on circulation characteristics and mechanism of rainstorm in autumn of hainan Island. Chin. J. Trop. Agric. 31 (5), 50–57.
Zhao, Z., and Lei, H. (2014). Observed microphysical structure of nimbostratus in northeast cold vortex over China. Atmos. Res. 142 (1), 91–99. doi:10.1016/j.atmosres.2013.09.008
Zhou, Y., Zhao, P., Da, X., Wu, W., Li, X., and Zhai, L. (2016). Physics of clouds and precipitation. Beijing: China Meteorological Press.
Keywords: hydrometeors, dual-polarization radar, fuzzy logic algorithm, Xisha, ITCZ precipitation clouds
Citation: Feng J, Huang Y, Wang F, Guo F, Li W, Wang W, Teng S, Xing F, Sun J, Zhou Y and Sheng L (2023) Distribution and evolution of hydrometeors in the stratiform cloud with embedded convection in the autumn ITCZ precipitation in Xisha: Case study. Front. Earth Sci. 10:1050858. doi: 10.3389/feart.2022.1050858
Received: 22 September 2022; Accepted: 28 December 2022;
Published: 10 January 2023.
Edited by:
Jianjun Xu, Guangdong Ocean University, ChinaReviewed by:
Jie Cao, Nanjing University of Information Science and Technology, ChinaCopyright © 2023 Feng, Huang, Wang, Guo, Li, Wang, Teng, Xing, Sun, Zhou and Sheng. This is an open-access article distributed under the terms of the Creative Commons Attribution License (CC BY). The use, distribution or reproduction in other forums is permitted, provided the original author(s) and the copyright owner(s) are credited and that the original publication in this journal is cited, in accordance with accepted academic practice. No use, distribution or reproduction is permitted which does not comply with these terms.
*Correspondence: Lifang Sheng, c2hlbmdsZkBvdWMuZWR1LmNu
Disclaimer: All claims expressed in this article are solely those of the authors and do not necessarily represent those of their affiliated organizations, or those of the publisher, the editors and the reviewers. Any product that may be evaluated in this article or claim that may be made by its manufacturer is not guaranteed or endorsed by the publisher.
Research integrity at Frontiers
Learn more about the work of our research integrity team to safeguard the quality of each article we publish.