 Long Feng
 He Chang1
 Yi Guixi
 He Xiaohui
 Shi Fuqiang
- 1Sichuan Earthquake Agency, Chengdu, China
- 2Guangdong Provincial Key Laboratory of Geodynamics and Geohazards, School of Earth Science and Engineering, Sun Yat-Sen University, Zhuhai, China
- 3Shanxi Earthquake Agency, Taiyuan, China
- 4Shaanxi Earthquake Agency, Xi’an, China
The 2022 Ms6.0 Maerkang earthquake sequence, Sichuan, China, occurred in an unexpected area with historically rare seismicity in the Bayan Har block. Here we relocated the earthquake sequence, inverted for the focal mechanisms of the larger events, and calculated the rupture directivity of the earthquake sequence to reveal the seismogenic structures and mechanisms of this sequence. The high-precision relocations indicate that the seismogenic structures consist of several clusters that are generally parallel to the nearby NW-trending Songgang fault, and relatively small-scale conjugate faults are also identified. The seismicity migrated from cluster one in the south to cluster two in the north during the sequence. Furthermore, the hypocenters were largely located at 5–10 km depth, thereby highlighting that the seismogenic structures are buried. The vertical fault planes of the seismogenic structures are consistent with the high-dip focal mechanism solutions from seven events. A stress field inversion based on the focal mechanisms indicates that the sequence occurred in a strike-slip environment that was controlled by a NNW–SSE-striking principal compressive stress. The different rupture directivities of the Ms5.8 (southwestward) and Ms6.0 (southeastward) events prove the existence of conjugate faults. The Ms5.8 event induced a coseismic Coulomb stress change of 1.6 MPa where the Ms6.0 event subsequently occurred, thereby highlighting that the Ms5.8 event triggered the Ms6.0 event and produced the spatiotemporal seismicity pattern of the sequence. We therefore conclude that the seismogenic structures of the 2022 Ms6.0 Maerkang earthquake sequence are previously unknown concealed conjugate structures associated with the main Songgang fault. The complex seismogenic structures and their potential to generate large earthquakes warrant the need to better understand the seismogenesis of this area and the seismic risks that may be present.
Introduction
An earthquake sequence that contained three Ms > 5.0 earthquakes (the largest of which was a Ms6.0 event) occurred in Maerkang City, Aba Tibetan and Qiang Autonomous Prefecture, Sichuan Province, southwestern China, beginning in the early morning of June 10, 2022 [China Standard Time (CST)]. A NW-trending seismicity belt with a maximum intensity of VIII was identified during the post-earthquake investigation. The initial earthquake locations were scattered in the inner Bayan Har block in an area adjacent to the northern segment of the NW-trending Songgang fault. Previous studies have revealed that most of the Ms ≥ 6 events that had occurred in the Bayan Har block since 2007, including the 2008 Ms7.3 Yutian (Wang et al., 2009; Ji et al., 2014), 2008 Mw7.9 Wenchuan (Wei et al., 2008; Shen et al., 2009; Yu et al., 2010; Hartzell et al., 2013), 2010 Ms7.1 Yushu (Chen et al., 2010; Wang et al., 2012), 2013 Ms7.0 Lushan (Xu et al., 2013; Long et al., 2015), 2013 Ms6.3 Knagding (Fang et al., 2015; Yi et al., 2015), and 2017 Ms7.0 Jiuzhaigou (Yi et al., 2017; Long et al., 2019; Wu et al., 2020; Hu et al., 2022) earthquakes, were located along boundaries of the block, whereas the 2021 Ms7.4 Maduo earthquake (Wang et al., 2021; Yue et al., 2022) and the Ms6.0 event in this sequence occurred in the block’s interior. Furthermore, the evolution of this sequence followed a foreshock–mainshock–aftershock pattern that was similar to the 2021 Ms6.4 Yangbi sequence in Yunnan Province (Long et al., 2021), thereby providing an additional reason to study this earthquake sequence.
It is well known that the precise location and focal mechanism solutions of an earthquake sequence play significant roles in determining its seismogenic structures and tectonic stress features (Michael, 1988; Shearer, 1997; Presti et al., 2008). We therefore relocated the sequence using a hybrid multi-stage method (Long et al., 2015) and inverted the focal mechanism solutions using the CAP (Zhao and Helmberger, 1994; Zhu and Helmberger, 1996) and HASH (Hardebeck and Shearer, 2002, 2003) methods. We then determined the rupture directivity of the two largest events to determine the fault planes and extracted the local stress map from the focal mechanisms to constrain the geodynamic source of these earthquakes. We also delineated the rupture processes of three M ≥ 5.0 events to deduce the causation of the seismicity transmission revealed by the Coulomb failure stress change. Our study may provide a reference for both investigating the geodynamic environment and earthquake nucleation process in this region and evaluating the potential risk of subsequent strong earthquakes.
Geological setting and historical earthquakes
The Bayan Har block, which is one of the main tectonic units that formed during the eastward movement of the Qinghai–Tibet Plateau. Its movement mode is controlled by the East Kunlun and Ganzi Yushu-Xianshuihe fault belts, two significant strike-slip faults on the northern and southern boundaries of the block, respectively (Xu et al., 2008). This area is also one of the most tectonically complex and active regions for strong earthquakes in Mainland China. The five Ms ≥ 7.0 earthquakes that have occurred in Mainland China since 2007 were all located in the boundary and internal areas of the block (Figure 1A).
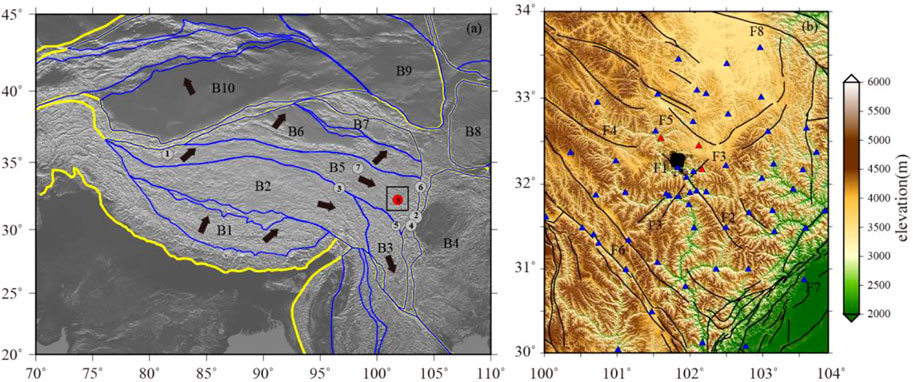
FIGURE 1. (A) Geological setting of the Qinghai–Tibet plateau and the surrounding region. Solid yellow and blue lines indicate the block and sub-block boundaries, respectively, and the blue polygon B5 defines the bayan har block (Zhang et al., 2003). Numbered circles denote the Ms ≥ 6 earthquakes that have occurred in the region since 2007, which are described in the introduction orderly. The solid black arrows represent the movement directions of the blocks. The black box indicates the study region, which is shown in (B). B1: Lhasa block. B2: Qiangtang block. B3: Sichuan–Yunnan block. B4: South China block. B5: Bayan Har block. B6: Qaidam block. B7: Qilian block. B8: Ordos block. B9: Alashan block. B10: Tarim block. (B) Active faults and seismicity associated with the 2022 Ms6.0 Maerkang earthquake sequence in the study region. Black circles denote earthquakes that occurred during the Maerkang Ms6.0 earthquake sequence. Blue and red triangles represent the permanent and temporary (portable) seismometer locations. F1: Songgang fault. F2: Fubianhe fault. F3: Longriba fault. F4: Dari fault. F5: Aba fault. F6: Xianshuihe fault. F7: Longmenshan fault. F8: eastern Kunlun fault.
The nearest known tectonic structure to the Maerkang earthquake sequence is the Songgang fault (F1 in Figure 1B), an ∼103-km-long, NW-striking fault that dips 50°–70° toward the NE (Sun et al., 2010). Its slickensides and geomorphic features indicate mainly left-lateral movement along the fault. The Longriba fault intersects the Songgang fault, dividing it into northern and southern segments. In particular, the southern segment may have experienced a period of strong activity during the middle Pleistocene, followed by another episode in the late Pleistocene, whereas the northern segment records no apparent signs of activity at the surface since the late Pleistocene. Sun et al. (2010) suggested that only two Ms ≥ 5 earthquakes have occurred along the Songgang fault over the past 100 years, the 1932 Ms5.0 Maerkang and 1941 Ms6.0 Heishui earthquakes, both of which ruptured the southern segment.
The NW-trending Fubianhe fault (F2 in Figure 1B) forms the southeastern extension of the Songgang fault, and the two faults are en-echelon structures. Geological surveying has indicated that the Fubianhe fault became active during the late Pleistocene and has been dominated by sinistral strike-slip movement with a specific dip-slip component and an average horizontal slip rate of ∼1.3 ± 0.1 mm/a since the late Quaternary (Zhou et al., 1999). Several strong historical events such as the 1928 Ms5¾, 1989 Ms5.0, 1989 Ms6.0, and 1991 Ms5.0 Xiaojin earthquakes have indicated that the Fubianhe fault has been more seismically active than the Songgang fault over the past 100 years (Zhou et al., 1999).
The NE-trending Longriba fault is a boundary structure that divides the two secondary Aba and Longmenshan blocks within the Bayan Har block (F3 in Figure 1B) (Xu et al., 2008; Ren et al., 2013). This 300-km-long fault is strongly segmented, with thrust and strike-slip faulting along different fault segments. Although a Ms ≥ 5 event has not been recorded along the Longriba fault, Xu et al. (2008) proposed that this fault may be a highly active thrust–strike-slip fault zone that formed during the late Quaternary, based on field investigations, geomorphologic fault measurements. Global positioning system (GPS) measurements have determined a fracture deformation rate of ∼5 mm/a (Shen et al., 2005; Wang et al., 2008), which indicates that a Ms ≥ 7 earthquake risk exists along this fault zone.
The Dari fault (F4 in Figure 1B) is one of several large NW-trending, left-lateral strike-slip faults within the Bayan Har block and has been tectonically active during the Holocene. Liang et al. (2022) estimated an average horizontal slip rate of 20 ± 0.3 mm/a since the late Quaternary based on a joint interpretation of high-resolution seismic images, field investigations, and trench excavations.
The Aba fault (F5 in Figure 1B) is the main structural control on the Aba basin. It generally presents a sinistral strike-slip dislocation, as observed along other NW-trending faults in the region. The Abe fault is also strongly segmented. Geological surveying has indicated weak fault activity along its southern segment, with no dislocation of the Quaternary overburden visible at the surface, whereas intense activity has occurred along the middle segment during the Quaternary, with prominent normal fault movement. The fault plane for this middle segment is inclined to the south at 56°, and many graben structures have formed owing to extension along this segment (Cui, 2020). Fault activity in the northern segment is dominated by low-angle thrust faulting, which initiated during the late Pleistocene (Cui, 2020).
Earthquake sequence relocation and spatiotemporal distribution characteristics
We detected 4,200 events that were associated with the Maerkang earthquake sequence during the June 9–23, 2022, period using a seismometer array that consisted of 57 permanent and three portable stations. Table 1 lists the locations and deployment times of the three portable stations; their locations are also marked as red triangles in Figure 1B. We double-checked the phase arrival information and relocated the earthquakes in the sequence that were detected during this time period. There was excellent station coverage for this earthquake sequence (Figure 1B), with almost all seismometers being within an epicentral distance of 150 km, such that clear upper-crustal compressional (Pg) and shear (Sg) phases were recorded. The magnitude–time (M–t) diagram (Figure 2A) indicates that this sequence consisted of many events, with four foreshocks recorded during the 4-h period before the Ms5.8 event at 00:03 CST on June 10. No events were recorded before June 9 in this region. We estimated the magnitude of completeness (Mc) of the sequence using the entire magnitude range algorithm (Woessner and Wiemer, 2005), and Mc was estimated to 1.4 for our dataset. We also fitted the Gutenberg–Richter (G–R) relationship, log10 N = a − bM (Gutenberg and Richter, 1944), using the maximum-likelihood method (Aki, 1965), where M is the magnitude, N is the cumulative number of earthquakes that are larger than or equal to M, and a and b are constants. The regression parameters were 4.44 and 0.83 for a and b, respectively. The sequence exhibited a significant trend for the higher-magnitude events: the observed frequency of the ML ≥ 4.0 events was higher than the synthetic value (Figure 2B).

TABLE 1. Locations and deployment times for the three portable stations.
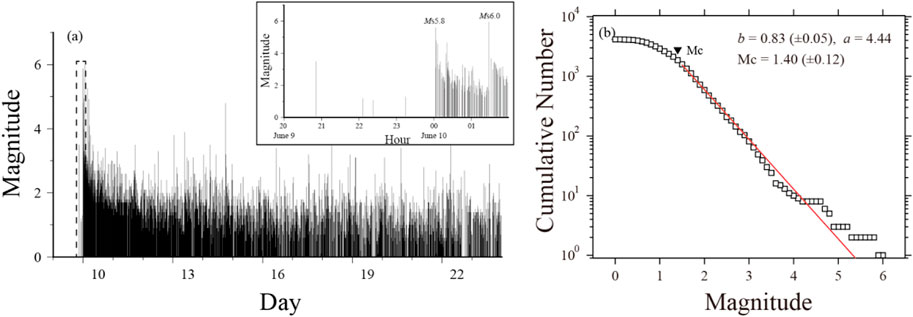
FIGURE 2. (A) M–t diagram of the Maerkang earthquake sequence during June 9–23, 2022. The dashed box highlights the early stage of the sequence, with its M–t diagram enlarged in the upper-right corner. (B) Frequency–magnitude distribution of the 2022 Ms6.0 Maerkang earthquake sequence. Each square indicates the cumulative earthquake frequency at a given magnitude, and the red line is the best-fit line to the G–R relationship (Gutenberg and Richter, 1944).
We used a hybrid multi-stage method (Long et al., 2015) to relocate the earthquake sequence. The sequence was first located using HYPOINVERSE (Klein, 2014) based on a prior seismic velocity model estimated from local phase travel times in the eastern Qinghai–Tibet Plateau (Zhao and Zhang, 1987), wheras the Moho depth and compressional-to-shear seismic velocity ratio (Vp/Vs.) were fiexed at 61 km and 1.71, respectively, based on the H–κ stacking (Zhu and Kanamori, 2000) results from a regional receiver function analysis (Yang, 2014). We then selected the events that were recorded by more than eight stations and possessed a maximum azimuthal gap of <120° for a one-dimensional (1-D) velocity model inversion (Kissling, 1988; Kissling et al., 1994, 1995). The process was conducted 200 times by randomly resampling 80% of the selected events to obtain the best-fit local 1-D velocity model (Table 2) and station corrections. Lastly, we applied the hypoDD double-difference algorithm (Waldhauser and Ellsworth, 2000; Waldhauser, 2001), with a 5-km search radius applied to the travel-time-corrected earthquake sequence using the newly inverted velocity model. We relocated 3,800 events, as some events were eliminated owing to either weak links or air quakes. We applied a bootstrap procedure to estimate the location errors by repeating hypoDD 200 times using phase arrival times with Guassian noise. The standard errors were set to 0.15 and 0.25 s for the p and S phases, respectively, following Long et al. (2018). The average errors estimated from the 90% confidence interval contours were 520, 530, and 960 m in the E–W, N–S, and vertical directions, respectively, and the root mean square (RMS) error was 0.12 s.

TABLE 2. Local 1-D velocity model for the study region.
The relocated epicentral map (Figure 3) shows that the entire sequence is located on the eastern border of a NW–SE-trending valley between Caodeng and Mori towns. The nearest active tectonic structure consists of three branches of the NW-trending Songgang fault, which are located to the west of the sequence. The sequence exhibits strong segmentation characteristics, and three distinguishable earthquake clusters are identified. The two more significant clusters (clusters 1 and 2 in Figure 3B) are parallel, NW-trending features, which are consistent with the main characteristics of the Songgang fault. Cluster 1 is positioned in the southwestern portion of the study region, whereas cluster 2 is much larger and located in the northeast. Clusters 1 and 2 are separated by ∼2 km, which is greater than the location errors. The Ms5.8 event occurred between these two clusters. The Ms6.0 event occurred in the central to northern part of cluster 2, whereas the Ms5.2 event occurred within cluster 3 (Figure 3B), a small NE-trending branch in the south. Furthermore, there appears to be a N–S trend in the depth distribution of the sequence, with the events along the northern segments of clusters 1 and 2 being much deeper than those along the other segments (Figure 3A), as well as a spatiotemporal seismicity pattern, with the seismicity migrating from cluster 1 to cluster 2 during the sequence (Figure 3B). We created a series of vertical profiles through the study region to characterize the seismogenic structures that were activated by the sequence (Figure 3A).
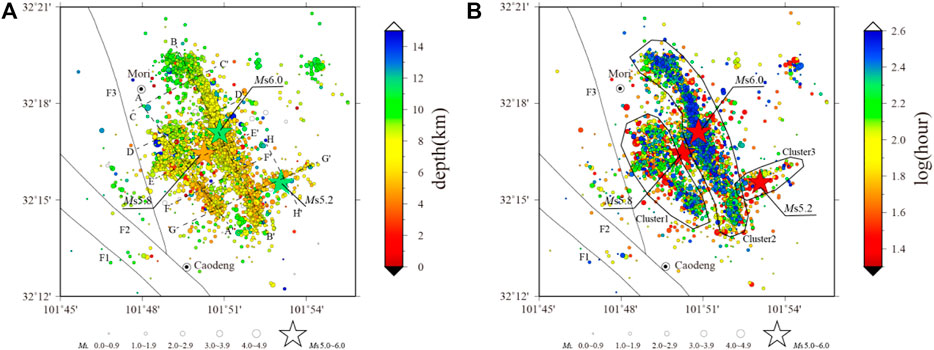
FIGURE 3. Relocated epicenters of the Ms6.0 Maerkang earthquake sequence. (A) Color-coded by depth. Dashed lines indicate the positions of the profiles, which are shown in Figures 4, 8. (B) Color-coded by occurrence time. Black polygons denote the three earthquake clusters discussed in the text. F1–F3: branches of the Songgang fault.
The AA′ profile (Figure 4A) was along the long axis of the southwestern cluster of the sequence (Cluster 1 in Figure 3B), with a 1.5-km projection width on each side to ensure that only the events within this cluster were plotted. The same projection width was set to create the other profiles. The area with a high aftershock density highlights a 6-km-long, NW-dipping rupture plane. Stratified seismicity along three semi-parallel planes is also observed along the southeastern end of the rupture area, illustrating a stress trigger effect. The BB′ profile (Figure 4B) was positioned along the long axis of the northeastern cluster of the sequence (Cluster 2 in Figure 3B), and a 12-km-long, NW-dipping rupture and stratified seismicity were observed along the southeastern end of the rupture area. The structural characteristics of profile BB′ are similar to those of profile AA′. The Ms6.0 event was positioned at ∼12 km depth in profile BB′, slightly below the lower boundary of the dense aftershock area.
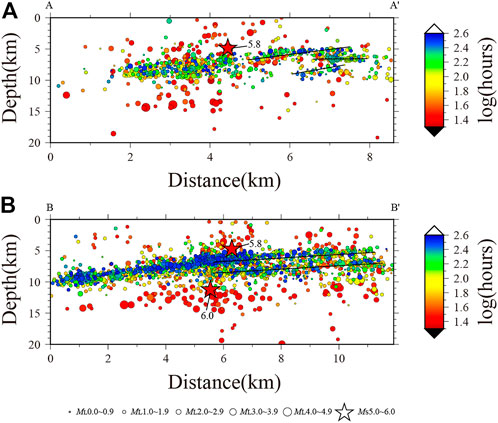
FIGURE 4. Focal depth projections along profiles (A) AA′ and (B) BB′. Solid lines indicate seismicity stratification along distinct rupture planes. Profile locations are shown in Figure 3A.
The relocated Ms5.8 event was at ∼5 km depth in the AA′ and BB′ profiles, along the upper boundary of the dense aftershock area, which is contrary to our understanding of large earthquakes often occurring along the lower boundary of an earthquake sequence. The earthquake depths are heavily scattered during the early stage of the sequence (red circles in Figure 4A, which span the first 46 h of the sequence, or up to ∼1.65 on the logarithm scale) compared with the later earthquakes, which may indicate that the near-field portable station deployment significantly improved the precision of the focal depths. We compared the HYPOINVERSE inversion RMS error (Figure 5A), horizontal error (Figure 5B), and vertical error (Figure 5C) before and after the portable station deployment and found that the portable stations significantly reduced the location errors. The events in the early stage of the sequence, including the Ms5.8 event, may therefore have significant focal depth uncertainties. The focal depths from the early part of the sequence are expected to converge along more defined rupture planes if additional constraints are supplied.
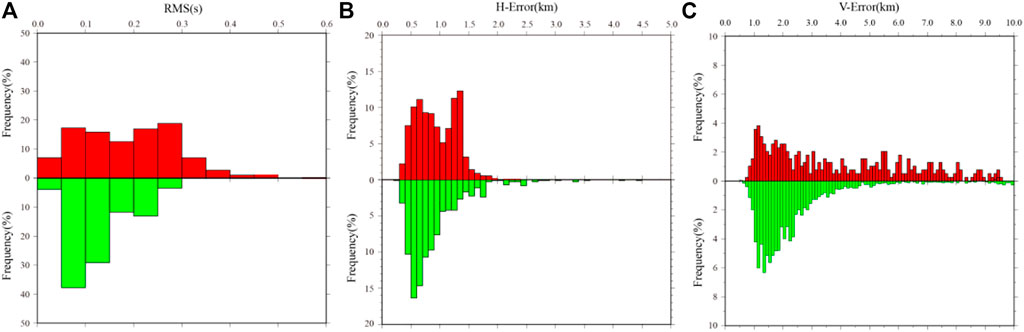
FIGURE 5. Histograms of the earthquake location (A) RMS error, (B) horizontal error, and (C) vertical error before (red) and after (green) deployment of three portable stations.
The subsurface lengths of clusters 1 and 2 are 6 and 12 km, which correspond to predicted magnitudes of 5.4 and 5.9, respectively, based on the Wells and Coppersmith, (1994) relationship. The down-dip rupture widths were also measured from the dense aftershock areas of clusters 1 and 2, with widths of 4 and 6 km corresponding to predicted magnitudes of 5.4 and 5.8, respectively. The predicted magnitudes for cluster 2 are very similar to the observed Ms6.0 (or Mw5.87 from the focal mechanism analysis below) event that occurred within cluster 2, whereas no M > 5 event occurred within cluster 1.
The near-field observations also significantly improved the seismic monitoring limitation. The Mc decreased from 1.8 to 1.3 after the portable station deployment, and the b-value from the G–R relationship increased from 0.72 to 0.97 (Figure 6). We selected the ML ≥ 1.8 events (upper Mc bound for the two stages) to fit the modified Omori law (Utsu, 1961):
where N is the aftershock frequency, t is the time since the triggering event, k is the productivity of the aftershock sequence, p is the power law exponent, and c is the time delay before the onset of the power-law aftershock decay rate. The p-values were 0.41 and 0.66 before and after the portable station deployment, respectively, which indicates that the sequence decayed slowly. However, the near-field observations yielded a faster decay rate (Figure 7).
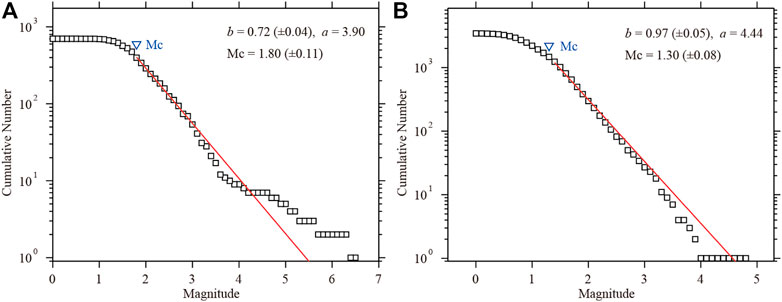
FIGURE 6. Frequency–magnitude distributions (A) before and (B) after the deployment of three portable stations.
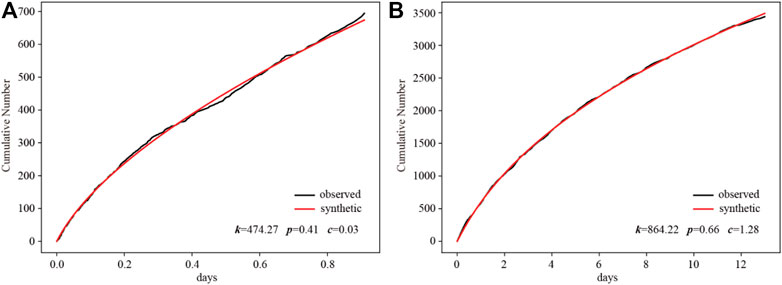
FIGURE 7. Fit of the modified Omori’s law to the earthquake sequence (A) before and (B) after the deployment of three portable stations.
Profiles CC′ to GG′ intersected clusters 1 and 2 from north to south. Profile CC′ (Figure 8A) highlights that the earthquakes in the northwestern part of cluster 2 lie along a listric fault surface that is vertical above 9 km depth and dips toward the southwest below 9 km depth. Profiles DD′–GG′ (Figures 8B–E) indicate that clusters 1 and 2 lie along almost vertical faults above 8 km depth that then start to slope toward each other, intersecting at 10 km depth. The parallel branches of seismogenic structures often show independence on shallow part, while they are connected at deep part, such as the Longquan shan fault (Zhao et al., 2021). The same distribution pattern showed by the cluster 1 and 2 of the Maerkang earthquake sequence highlighted they come from a unified seismogenic structure. Profile HH′ (Figure 8F) indicates that cluster 3 lies along an almost vertical fault plane.
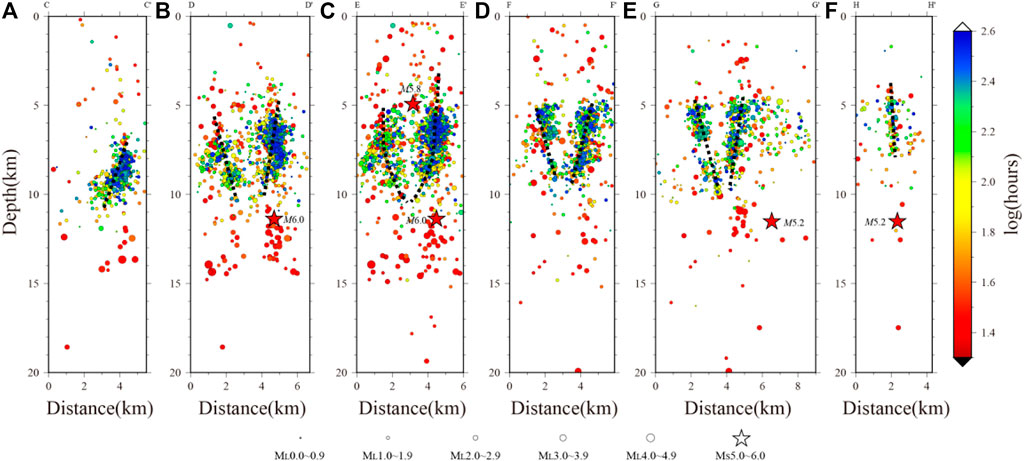
FIGURE 8. Focal depth projection along profiles CC′–HH′. Dashed lines indicate inferred seismogenic structures. (A): profile AA′, (B): profile DD′, (C): profile EE′, (D): profile FF′, (E): profile GG′, (F): profile HH′.
Focal mechanisms
The focal mechanism solutions for most of the Mw ≥ 4.0 events in this sequence that possessed high signal-to-noise ratios were determined via the CAP method (Zhao and Helmberger, 1994; Zhu and Helmberger, 1996). The method has been proven to yield robust and well-constrained results (Tan et al., 2006; Zheng et al., 2009). We divided the waveform into two parts, extended p waves (Pnl), which are long-period body waves after the P-wave onset (first two columns of Figures 10A,B) and surface waves, and time-shifted the synthetic waveforms along the observed waveforms until the maximum cross-correlation coefficient (CC) was obtained. A grid-search algorithm was applied to calculate the best-fit focal mechanism parameters in five dimensions: strike, dip, rake, moment magnitude, and centroid depth.
The waveforms from the broadband stations within an epicentral distance of 350 km were used to invert for the focal mechanisms, and the Green functions were calculated using the frequency–wavenumber method (Zhu and Rivera, 2002) based on the newly inverted local velocity model in Table 2. We specified window lengths of 30 and 60 s for Pnl and surface waves, respectively, and filtered them using 0.05–0.2 and 0.05–0.1 Hz bandpass filters, respectively. The source time duration was set to 5 s when the magnitude was ∼6, and 1 s when the magnitude was less than 5.0.
The RMS error–focal depth diagrams indicate that the respective best-fit depths of the Ms5.8 and Ms6.0 events are 8.0 km (Figure 9A) and 8.5 km (Figure 9B), respectively, which are about ∼4 km from the relocated depths in Figure 4. We believe that the CAP results may therefore be more reliable for constraining the focal depths of these events due to the lack of near-field constraints during the early stage of the sequence. The fits between the observed and synthetic waveforms yielded CC > 0.8 for >70% of the Pnl and surface-wave components (Figure 10), which indicate that the new 1-D model is accurate for the study region. We computed the focal mechanisms for six events in the earthquake sequence via the CAP method and found that they were all strike-slip events with centroid depths between 4.5 and 8.5 km (Table 3).
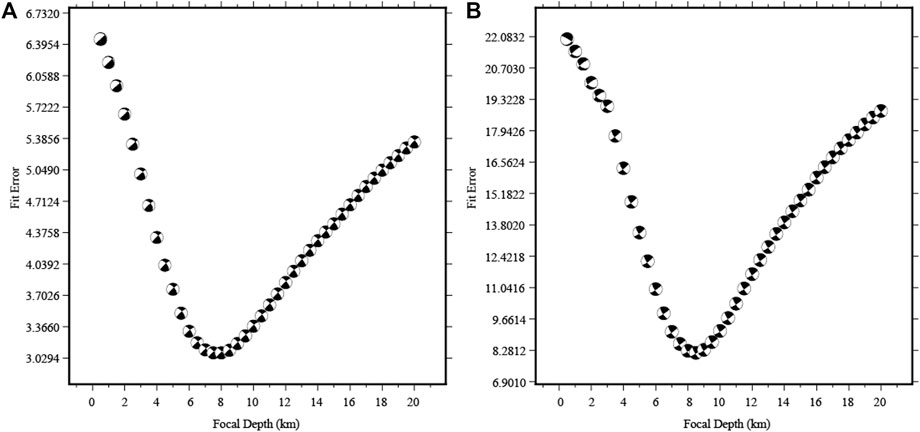
FIGURE 9. Variations in RMS error with focal depth during the focal mechanism inversion for the (A) Ms5.8 and (B) Ms6.0 Maerkang earthquakes.
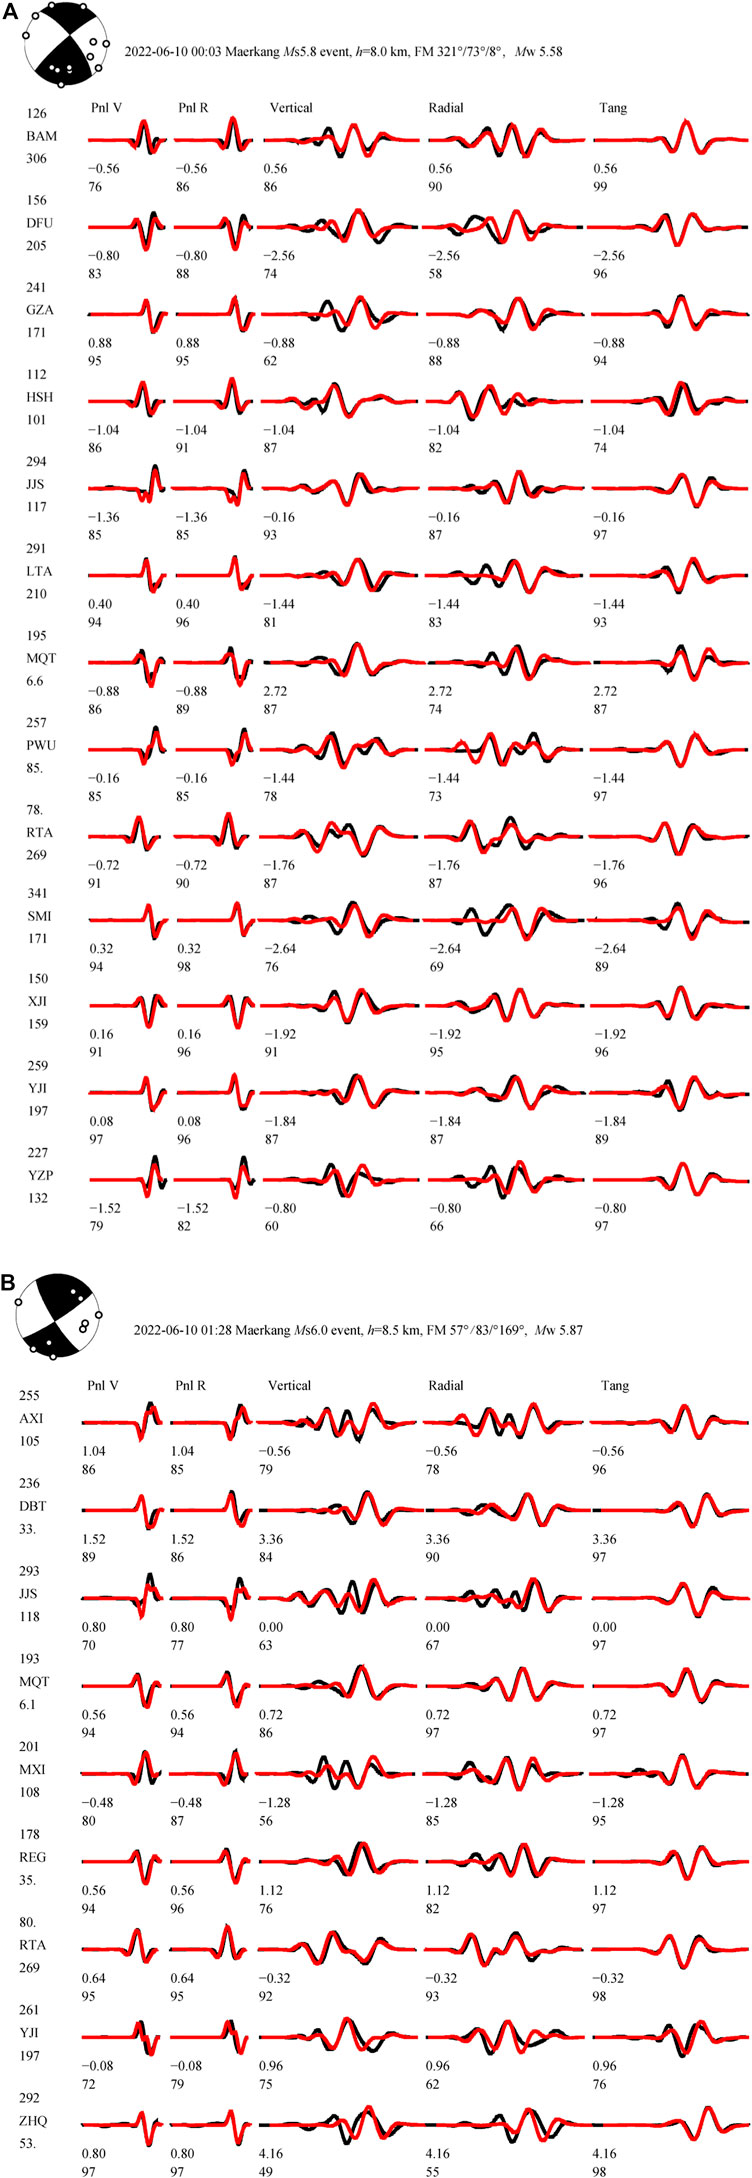
FIGURE 10. (Continued).
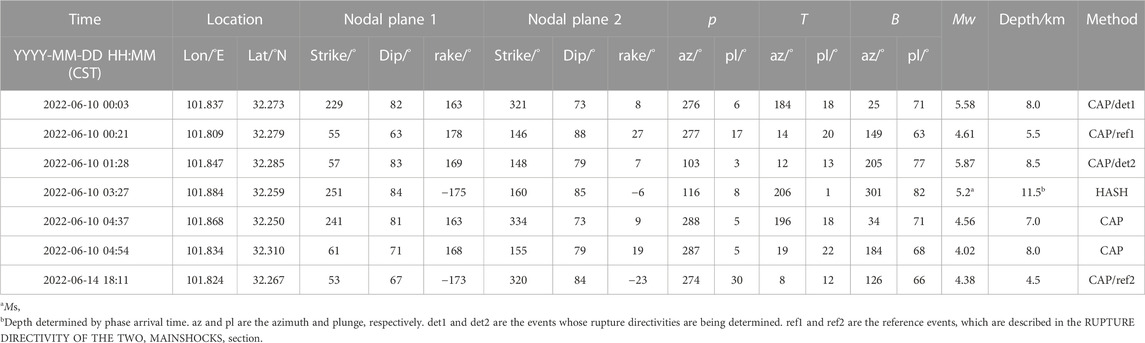
TABLE 3. Focal mechanism solutions for the maerkang earthquake sequence.
The focal mechanism solution for the Ms5.2 event at 03:27 CST on June 10, 2022, could not be determined via the CAP method owing to waveform superposition from a smaller event (Figure 11). We therefore applied the HASH method (Hardebeck and Shearer, 2002, 2003) to obtain the focal mechanism for this event. We only used the P-wave onset polarities from the vertical component within an epicentral distance of 300 km and estimated the take-off angles using a simplified two-layer crust velocity model (Zhu, 1988). The results yielded a nearly pure strike-slip-type focal mechanism, which is very similar to the other focal mechanisms determined via the CAP method (Table 3; Figure 12).
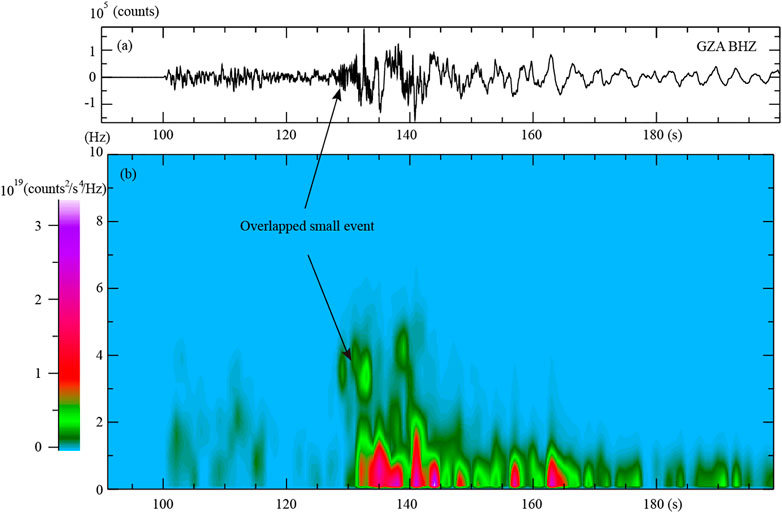
FIGURE 11. (A) Original waveform and (B) spectrogram of the Ms5.2 event, recorded at station GZA, with the high-frequency energy signal detected before the S phase indicating an overlapping small event.
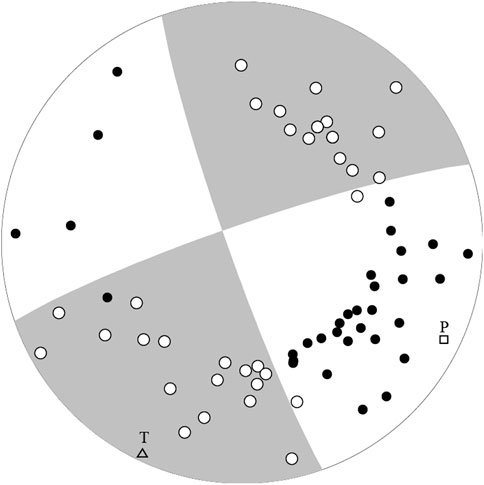
FIGURE 12. Focal mechanism beach ball solution for the Ms5.2 event. Solid and hollow circles indicate downward and upward polarities, respectively.
The stress field was obtained via the SSI method (Michael, 1985; Michael, 1991) using the focal mechanisms of seven Ms > 4 events in the sequence (Table 3; Figure 13A), yielding strike-slip faulting along the seismogenic structures (Figure 13B). The NWW-trending principal stress is consistent with the local stress map (Wang et al., 2015) and GPS-derived block movement (Wang and Shen, 2020). Therefore, we suggest that the regional tectonic stress field may have controlled this earthquake sequence.
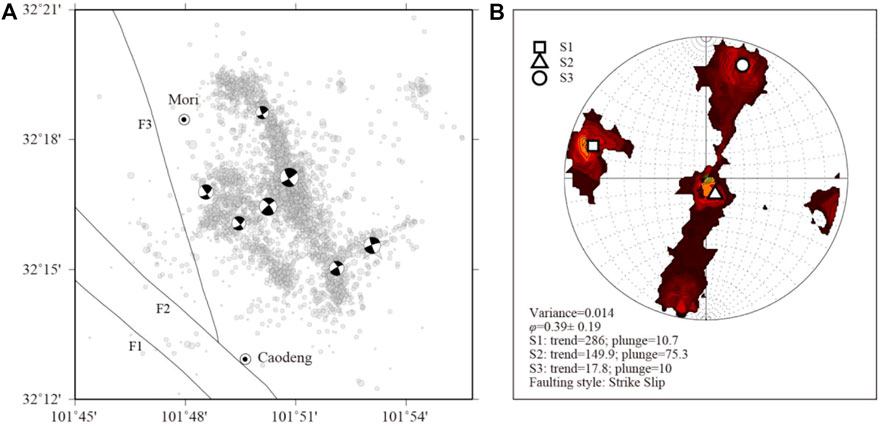
FIGURE 13. (A) Focal mechanisms for the events that were analyzed in this study. (B) Stress field that was inverted via the SSI method using the focal mechanisms in (A). The other symbols in (A) are the same as those in Figure 3. S1, S2, and S3 are the principal stresses, ordered from most compressional to most dilatational, and contours indicate the uncertainty range of each axis at the 95% confidence interval and the variance and φ representing the solution misfit and relative stress size, respectively [see Michael (1991) for further details of the SSI method].
Rupture directivity of the two mainshocks
The different trends of the relocated clusters (Figure 2) indicate varying rupture patterns during this sequence. Although the focal mechanisms can provide nodal plane information, it is difficult to determine the true ruptured fault plane due to ambiguities in the focal mechanism solutions (Shearer, 2009). We further explored the complexity of the source process of this sequence using the relative centroid location approach (He et al., 2015; He et al., 2018) to determine the rupture directivities of the Ms5.8 and Ms6.0 events (det1 and det2, respectively, in Table 4). The relative location between the centroid and hypocenter indicates the rupture direction and half of the rupture length when a unilateral rupture is assumed, where the hypocenter is usually determined using P-wave arrival times and the centroid can be resolved using a long-period waveform cross-correlation approach. This method allows a smaller event near the master event (the reference event) to be applied to suppress the path effect.
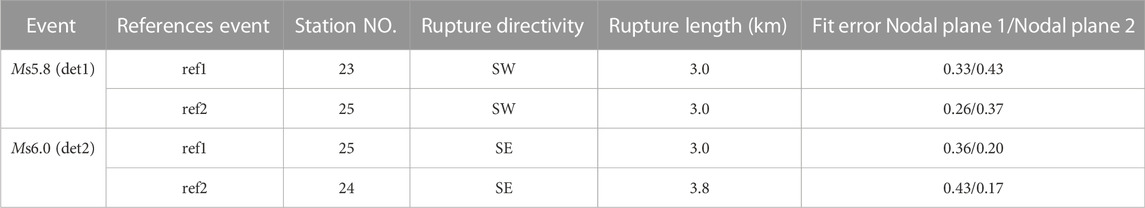
TABLE 4. Rupture directivity of the Ms5.8 (det1) and Ms6.0 (det2) events.
We selected two small events with high signal-to-noise ratios near the Ms5.8 and Ms6.0 events as reference events (ref1 and ref2, respectively, in Table 4) and used the hypocenter locations and focal mechanisms for both the Ms5.8 and Ms6.0 events and the reference events to determine the rupture directivity. The synthetic waveforms in the CAP method are calculated for a given reference velocity model, with the event located at the hypocenter. The time shifts for the Pnl and surface waves that are output in the CAP inversion are mainly attributed to two parameters: the location difference between the centroid and hypocenter and the difference between the real crustal structure and reference velocity model. We assume that the hypocenter and reference event are located close to each other, such that the time shifts of the reference event can be applied as the path calibration factor and the time shifts of the master event can be corrected by subtracting the path calibration factor. The differential time shifts can then be fit using a cosine function (Eq. 2) by assuming that the master event ruptures either parallel or perpendicular to the strike of either nodal plane:
where dt is the differential time shift, t0 is the source time duration difference between the master event and the reference event, v is the apparent velocity of the selected seismic phase (generally assumed to be 6.0 km/s for Pnl waves, 3.1 km/s for Rayleigh waves, and 3.5 km/s for Love waves), L is the rupture length, and az and stk are the azimuth and strike of the rupture plane. t0 and L can be resolved via a least-squares approach, with the sign of L representing rupture perpendicular (positive) or parallel (negative) to the strike of the rupture plane. We used the time shift differences that were measured from the Love waves with CC > 0.9 for the Ms5.8 and Ms6.0 events and then fit the time shifts using Eq. 2, and the rupture directivity and length estimates are listed in Table 4. The Ms5.8 event (det1) ruptured toward the southwest for 3 km (Figure 14), and the Ms6.0 event (det2) ruptured toward the southeast for 3-4 km (Figure 15). The rupture lengths of both events were much shorter than the 9-km rupture length that was determined via the empirical scale law (Wells and Coppersmith, 1994), thereby suggesting the potential of bilateral rupture.
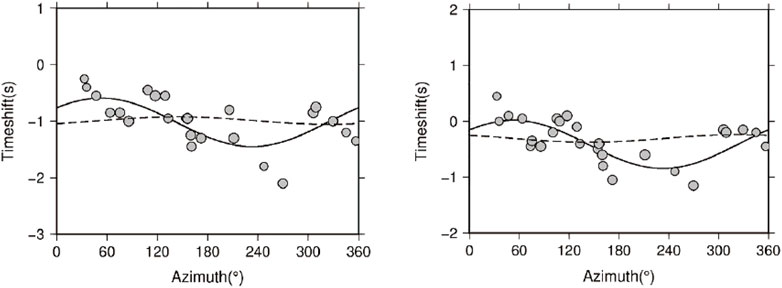
FIGURE 14. Rupture directivity fitting of the Ms5.8 event (det1). Two reference events are used (left: ref1; and right: ref2). Dots denote the time shift differences at each station (CC ≥ 0.9), and the lines denote the predicted time shifts of nodal planes 1 (solid) and 2 (dashed) listed in Table 3. The results indicate ∼3 km of rupture to the southwest.
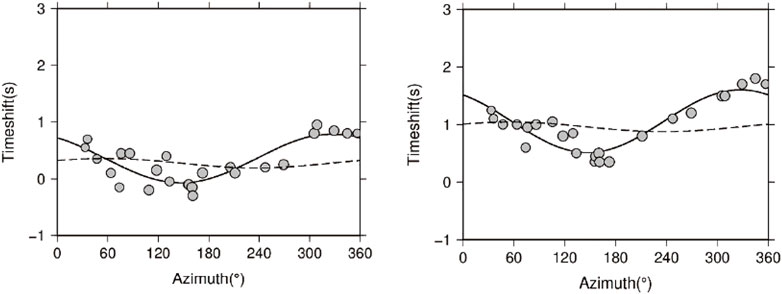
FIGURE 15. Rupture directivity fitting of the Ms6.0 event (det2). Two reference events are used (left: ref1; right: ref2). Dots denote the time shift differences at each station (CC ≥ 0.9), and lines denote the predicted time shifts of nodal planes 1 (dashed) and 2 (solid) listed in Table 3. The results indicate 3–4 km of rupture to the southeast.
Discussion
Seismogenic structures of the 2022 Ms6.0 maerkang earthquake sequence
Although the focal mechanisms indicate that the 2022 Ms6.0 Maerkang earthquake sequence was controlled by a consistent tectonic movement that was induced by a horizontal, approximately E–W-oriented principal compressive stress, both the relocated sequence and the rupture directivity illustrate that more complex seismogenic structures may be associated with this sequence. The different trends of the three clusters, stratified seismicity, and various rupture directions all indicate that at least four different-scale faults ruptured during the sequence (Figure 16). The rupture directivity of the Ms5.8 event suggests that there may be another SW-trending fault where the Ms5.8 event occurred that is perpendicular to clusters 1 and 2. However, there is no sign of a corresponding relocated earthquake distribution.
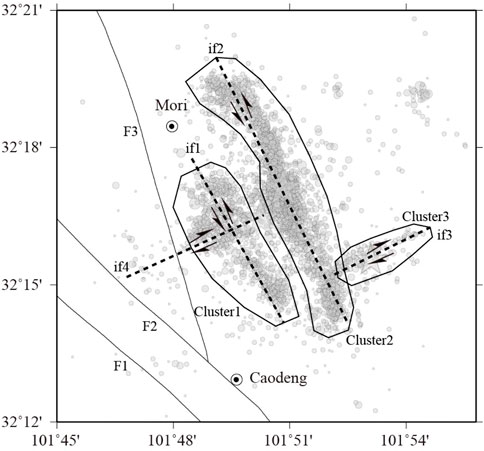
FIGURE 16. Rupture pattern of the 2022 Ms6.0 Maerkang earthquake sequence. F1–F3 are branches of the Songgang fault. Clusters 1–3 are the same earthquake clusters in Figure 2B if1–if4 are the inferred faults that were activated by the sequence, and arrows indicatie the relative movement directions. The other symbols are the same as those in Figure 3.
Although the inferred fault planes of this sequence do not align with the local branches of the Songgang fault, their vertical orientations and proximity to each other suggest that these seismogenic structures may be associated with the Songgang fault. The fact that these structures are buried and only active at 5–10 km depth, as indicated by the relocated sequence (Figure 3), is a key reason why they have not been identified during previous geological surveys (Sun et al., 2010).
Similar to the 2021 Ms6.4 Yangbi earthquake sequence in Yunnan Province, China (Long et al., 2021), clusters one and two, or inferred faults one and two (if1 and if2 in Figure 16), may have been generated by the dragging effect of large-scale strike-slip faults, as these structures are approximately parallel to the Songgang fault, which is the main fault in the area. This interpretation would mean that cluster three (or if3 in Figure 16) and inferred fault four (if4 in Figure 16) are likely conjugate faults (Figure 13B). Under the control of the unified tectonic stress field, conjugate faults are usually perpendicular to the main fault, and they form an angle of 45° with the principal stress axis (Bretan et al., 1996).
Coseismic stress triggering of the earthquake sequence
The coseismic stress transfer produced by large earthquakes has a profound impact on the occurrence of successive earthquakes (Stein, 2003). A number of prior studies have successfully applied the Coulomb failure stress model to explain aftershock distributions (Deng and Sykes, 1997a, b; King et al., 1994; Stein, 1999, 2003; Yadav et al., 2011), earthquake sequences (Stein et al., 1994; Nalbant et al., 1998; Xiong et al., 2010), and the triggering of moderate-to-strong earthquakes (Harris et al., 1995; Deng and Sykes, 1996; Jaume and Sykes, 1996). We calculated the coseismic Coulomb failure stress changes (ΔCFS) of the Ms5.8 event using the PSGRN and PSCMP tools (Wang, 2003; Wang et al., 2006) to determine if there was a stress transfer effect on the spatiotemporal evolution of this sequence. The positions of the main faults were defined by the relocated earthquake locations and their associated rupture directivities, and the fault lengths were estimated from the empirical relationship of Wells and Coppersmith (1994). The slip amount on the fault planes, D, was then evaluated using the M0 = μDA formula (Aki, 1966), where M0 is the seismic moment (determined via the CAP method), μ is the shear modulus (reasonable estimation of 3 × 10¹¹ dyn/cm2 applied), and A is the fault area (measured from the relocated cross sections). We defined if2 as the receiver fault, as the Ms6.0 event occurred along this fault, and we specified the fault occurrence based on the focal mechanism of the Ms6.0 event in Table 3. Our analysis indicates that the Ms6.0 event occurred in a highly stressed area that possessed a ΔCFS value of 1.6 MPa (Figure 17), which is well above the trigger threshold of 0.01 MPa (Toda et al., 1998; Stein, 1999). It could therefore be inferred that the Ms5.8 event along fault if4 triggered the Ms6.0 event along fault if2, which constituted the spatiotemporal pattern of the earthquake sequence.
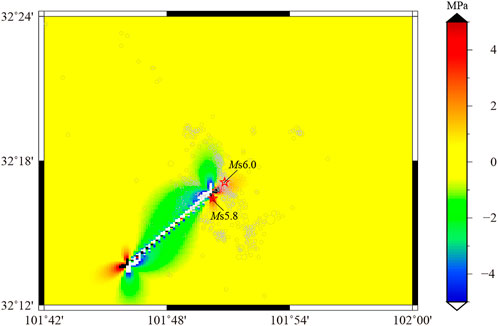
FIGURE 17. Coulomb failure stress changes (ΔCFS) due to the Ms5.8 event.
Characteristics of the complex faults of the seismogenic structures
The interconnectivity of the earthquake clusters and inferred faults highlights that the 2022 Ms6.0 Maerkang earthquake sequence occurred along complex seismogenic faults, which are a rare tectonic phenomenon. This is due to the problem of linking the complex seismogenic structures of multiple faults at depth through geometric and mechanical relationships. Parallel clusters 1 and 2 in the Maerkang sequence appear to be connected at 10 km depth (Figure 8), which illustrates that they are the branches of another main fault. Chamberlain et al. (2021) carefully studied the 2016 Kaikōura earthquake on the South Island of New Zealand, which generated the significant rupture of at least 21 crustal faults, and they found that the offshore faults provided a link between the southern faults where the earthquake initiated and the northern faults where the largest amount of slip occurred. Ross et al. (2019) pointed out that these types of earthquakes, which present complex seismogenic structures, often occur in immature fault zones and activate many orthogonal structures during their analysis of the 2019 Ridgecrest sequence. The migration of seismicity early in the earthquake sequence is a significant characteristic. The Maerkang earthquake sequence migrated from cluster 1 to 2 during the early stage of the sequence, similar to the migration of seismicity during the 2012 Emilia seismic sequence, Italy, which Sugan et al. (2019) interpreted as a fingerprint of an early afterslip that was triggered by the first mainshock.
Conclusion
We revealed the seismogenic structures and mechanism of the 2022 Ms6.0 Maerkang earthquake sequence, Sichuan Province, southwestern China, by relocating the earthquake sequence, inverting for the focal mechanisms, and calculating the rupture directivity of the earthquake sequence to better understand the seismogenesis of this earthquake sequence and the potential seismic risks it may pose. We conclude that:
1. The seismogenic structures of the Maerkang earthquake sequence are buried faults that may be linked to the nearby Songgang fault, as opposed to the Songgang fault itself. There was a strong spatiotemporal segmentation of the sequence that could be separated into several clusters that were generally parallel to the NW-trending Songgang fault, and a conjugate structure was also identified. The fault planes were vertical at shallow depths but appeared to be connected at ∼10 km depth. The fault planes associated with the two major clusters also dip toward the NW.
2. The focal mechanisms for seven M > 4.0 events (Table 3) in the sequence were similar and indicated a stress field with strike-slip faulting, which is consistent with the local stress map (Wang et al., 2015). We determined the rupture plane using the directivity effect to avoid the ambiguity of the two nodal planes of the focal mechanisms. We confirmed that the Ms6.0 event ruptured to the southeast, which is consistent with the dominant distribution of the sequence, whereas the Ms5.8 ruptured to the southwest. This latter rupture direction suggests that additional conjugate faults may be present in the area.
3. Four inferred seismogenic faults were identified. Furthermore, the spatiotemporal pattern of the sequence was due to coseismic stress transfer, with the seismicity migrating from cluster 1 to cluster two.
4. Similar to the Ms6.4 Yangbi (Long et al., 2021) and Ms6.0 Changning (Yi et al., 2019) earthquakes, the associated structures of the active faults may generate strong earthquakes, such that the potential seismic risks in these areas need to be seriously considered.
Data availability statement
The raw data supporting the conclusion of this article will be made available by the authors, without undue reservation.
Author contributions
LF: Conceptualization, methodology, software, visualization, formal analysis, writing–original draft. HC: Conceptualization, writing–reviewing and editing; YG: conceptualization, visualization, formal analysis. HX: Conceptualization, methodology, software, visualization. SF: Methodology, software, visualization. LL: Writing–reviewing and editing. GY: Writing–reviewing and editing. PL: Writing–reviewing and editing.
Funding
This study was supported by the National Key R&D Program of China (Nos. 2020YFA0710603-01, 2021YFC3000702-05), National Science Foundation of China (No. 41574047), Science and Technology Program of Guangzhou (No. 202102020003), Natural Science Foundation of Shanxi Province (No. 201901D211549), and Sichuan Science and Technology Program (No. 2020YJ0475).
Acknowledgments
We thank Professor Fang Lihua and Peng Zhigang for useful discussions on the earthquake sequence analysis, and Wang Meng for helpful suggestions regarding this manuscript. The digital seismic signals were all processed using SAC 2000 (Goldstein et al., 2003), the stress tensor was inverted using zmap (Wiemer, 2001), and most of the figures were plotted using GMT (Wessel and Smith, 1998).
Conflict of interest
The authors declare that the research was conducted in the absence of any commercial or financial relationships that could be construed as a potential conflict of interest.
Publisher’s note
All claims expressed in this article are solely those of the authors and do not necessarily represent those of their affiliated organizations, or those of the publisher, the editors and the reviewers. Any product that may be evaluated in this article, or claim that may be made by its manufacturer, is not guaranteed or endorsed by the publisher.
Supplementary material
The Supplementary Material for this article can be found online at: https://www.frontiersin.org/articles/10.3389/feart.2022.1049911/full#supplementary-material
References
Aki, K. (1966). Earthquake generating stress in Japan for the years 1961 to 1963 obtained by smoothing the first motion radiation patterns. Bull. Earthq. Res. Inst. 44, 447–471.
Aki, K. (1965). Maximum likelihood estimate of b in the formula log10N=a-bM and its confidence limits. Bull. Earthq. Res. 43, 237–239.
Bretan, P., Nicol, A., Walsh, J. J., and Watterson, J. (1996). Origin of some conjugate or “X” fault structures. Geophysics 15, 812–816. doi:10.1190/1.1437367
Chamberlain, C. J., Frank, W. B., Lanza, F., Townend, J., and WarrenSmith, E. (2021). Illuminating the pre-co-and post-seismic phases of the 2016 M7.8 Kaikōura earthquake with 10 years of seismicity. J. Geophys. Res. Solid Earth 126, e2021JB022304. doi:10.1029/2021JB022304
Chen, L., Wang, H., Ran, Y., Sun, X., Su, G., Wang, J., et al. (2010). The Ms7.1 Yushu earthquake surface rupture and large historical earthquakes on the Garzê-Yushu Fault. Chin. Sci. Bull. 55, 3504–3509. doi:10.1007/s11434-010-4079-2
Chen, Y., Liu, J., and Ge, H. (1999). Pattern characteristics of foreshock sequences. Pure Appl. Geophys. 155 (2/4), 395–408. doi:10.1007/s000240050271
Christophersen, A., and Smith, E. G. C. (2008). Foreshock rates from aftershock abundance. Bull. Seismol. Soc. Am. 96, 2133–2148. doi:10.1785/0120060143
Cui, B. (2020). Geological tectonic features and activity analysis of Aba fault in west Sichuan. Master Dissertation (in Chinese). Chengdu: Chengdu University of Technology.
Deng, J., and Sykes, L. R. (1997a). Evolution of the stress field in southern California and triggering of moderate-size earthquakes: A 200-year perspective. J. Geophys. Res. 102, 9859–9886. doi:10.1029/96jb03897
Deng, J., and Sykes, L. R. (1997b). Stress evolution in southern California and triggering of moderate-small-and micro-size earthquakes. J. Geophys. Res. 102, 24411–24435. doi:10.1029/97jb02127
Deng, J., and Sykes, L. R. (1996). Triggering of 1812 santa barbara earthquake by a great san andreas shock: Implications for future seismic hazards in southern California. Geophys. Res. Lett. 23, 1155–1158. doi:10.1029/96gl00738
Fang, L., Wu, J., Liu, J., Cheng, J., Jian, C., Han, L., et al. (2015). Preliminary report on the 22 november 2014 Mw 6.1/ms 6.3 kangding earthquake, western sichuan, China. Seismol. Res. Lett. 86 (6), 1603–1613. doi:10.1785/0220150006
Felzer, K. R. (2004). A common origin for aftershocks, foreshocks, and multiplets. Bull. Seismol. Soc. Am. 96, 88–98. doi:10.1785/0120030069
Goldstein, P., Dodge, D., Firpo, M., and Minner, L. (2003). “SAC2000: Signal processing and analysis tools for seismologists and engineers,” in The IASPEI international handbook of earthquake and engineering seismology, Part B. Editors W. H. K. Lee, P. Jennings, C. Kisslinger, and H. Kanamori (New York: Elsevier). chapter 85.5.
Gulia, L., and Wiemer, S. (2019). Real-time discrimination of earthquake foreshocks and aftershocks. Nature 574 (7777), 193–199. doi:10.1038/s41586-019-1606-4
Gutenberg, R. C., and Richter, F. (1944). Frequency of earthquakes in California. Bull. Seismol. Soc. Am. 34, 185–188. doi:10.1785/bssa0340040185
Hardebeck, J. L., and Shearer, P. M. (2002). A new method for determining first- motion focal mechanisms. Bull. Seismol. Soc. Am. 92, 2264–2276. doi:10.1785/0120010200
Hardebeck, J. L., and Shearer, P. M. (2003). Using S/P amplitude ratios to constrain the focal mechanisms of small earthquakes. Bull. Seismol. Soc. Am. 93, 2434–2444. doi:10.1785/0120020236
Harris, R. A., Simpson, R. W., and Reasenberg, P. A. (1995). Influence of static stress changes on earthquake locations in southern California. Nature 375, 221–224. doi:10.1038/375221a0
Hartzell, S. H., Mendoza, C. I., Ramírez-Guzmán, L., Zeng, Y. J., and Mooney, W. D. (2013). Rupture history of the 2008Mw 7.9 wenchuan, China, earthquake: Evaluation of separate and joint inversions of geodetic, teleseismic, and strong-motion data. Bull. Seismol. Soc. Am. 103 (1), 353–370. doi:10.1785/0120120108
He, X. H., Ni, S. D., and Liu, J. (2015). Rupture directivity of the august 3rd, 2014 ludian earthquake (yunan, China). Sci. China Earth Sci. 58 (5), 795–804. doi:10.1007/s11430-015-5053-2
He, X. H., Ni, S. D., Zhang, P., and Freymueller, J. T. (2018). The 1 May 2017 British Columbia-Alaska earthquake doublet and implication for complexity near southern end of Denali fault system. Geophys. Res. Lett. 45 (12), 5937–5947. doi:10.1029/2018gl078014
Helmstetter, A., Sornette, D., and Grasso, J-R. (2003). Mainshocks are aftershocks of conditional foreshocks: How do foreshock statistical properties emerge from aftershock laws. J. Geophys. Research-Solid Earth 108 (B1), 1–20. doi:10.1029/2002jb001991
Hu, M., Wu, Y., Hao, H., Wang, J., Wang, J., and Li, Z. (2022). Lithospheric flexural isostasy background of the 2017 Ms7.0 Jiuzhaigou earthquake and its implications on material extrusion in the northeastern Bayan Har Block. Tectonophysics. doi:10.1016/j.tecto.2022.229209
Ishimoto, M., and Iida, K. (1939). Observations of earthquakes registered with the microseismograph constructed recently. Bull. Earthq. Res. Inst. 17, 443–478.
Jaume, S. C., and Sykes, L. R. (1996). Evolution of moderate seismicity in the san francisco bay region, 1850 to 1993: Seismicity changes related to the occurrence of large and great earthquakes. J. Geophys. Res. 101, 765–789. doi:10.1029/95jb02393
Ji, Z., Zhao, C., Wang, Q., and LiWang, Z. H. (2014). Source rupture process of yutian, xinjiang, MS7.3 earthquake on 21 march 2008. Acta Seismol. Sin., 339–349. (in Chinese). doi:10.3969/j.issn.0253-3782.2014.03.001
King, G. C. P., Stein, R. S., and Lin, J. (1994). Static stress changes and the triggering of earthquakes. Bull. Seismol. Soc. Am. 84, 935–953. doi:10.1785/BSSA0840030935
Kissling, E., Ellsworth, W., Eberhart-Phillips, D., and Kradolfer, U. (1994). Initial reference models in local earthquake tomography. J. Geophys. Res. 99, 19635–19646. doi:10.1029/93jb03138
Kissling, E., Kradolfer, U., and Maurer, H. (1995). VELEST user’s guideshort introduction, Tech. rep. Institute of Geophysics, ETH Zurich,a2lzc0B0b21vLmlnLmVyZHcuZXRoei5jaA==.
Kissling, E. (1988). Geotomography with local earthquake data. Rev. Geophys. 26 (4), 659–698. doi:10.1029/rg026i004p00659
Klein, F. W. (2014). User’s guide to HYPOINVERSE-2000, a Fortran program to solve for earthquake locations and magnitudes. Menlo Park: U.S. Geological Survey Open-File. Report 02–171.
Liang, M. J., Wu, W. W., Yang, Y., Du, F., Zhou, W. Y., Zuo, H., et al. (2022). Late quaternary fault activity and deformation mechanism in the eastern Tibet Plateau (Dari fault, bayan har block). Quat. Int. doi:10.1016/j.quaint.2022.09.009
Lippiello, E., Petrillo, G., and Godano, C. (2020). Recognizing the waveform of a foreshock. Res. Square. doi:10.21203/rs.3.rs-57209/v1
Long, F., Jiang, C. S., Qi, Y. P., Liu, Z. F., and Fu, Y. (2018). A joint probabilistic approach for merging earthquake catalogs of two neighboring seismic networks: An example of the 2014 Ludian sequence catalog. Chin. J. Geophys. (in Chinese) 61 (7), 2815–2827. doi:10.6038/cjg2018L0593
Long, F., Qi, Y. P., Yi, G. X., Wu, W. W., Wang, G. M., Zhao, X. Y., et al. (2021). Relocation of the Ms6.4 Yangbi earthquake sequence on May 21, 2021 in Yunnan province and its seismogenic structure analysis. Chinese Journal of Geophysics (in Chinese) 64 (08), 2631–2646.
Long, F., Wen, X., Ruan, X., Zhao, M., and Yi, G. (2015). A more accurate relocation of the 2013 Ms7.0 Lushan, Sichuan, China, earthquake sequence, and the seismogenic structure analysis. Journal of Seismology 19, 653–665. doi:10.1007/s10950-015-9485-0
Long, F., Yi, G. X., Wang, S. W., Qi, Y. P., and Zhao, M. (2019). Geometry and tectonic deformation of the seismogenic structure for the 8 August 2017 MS7.0 Jiuzhaigou earthquake sequence, northern Sichuan, China. Earth Planetary Physics 3 (3), 253–267. doi:10.26464/epp2019027
Michael, A. J. (1988). Effects of three-dimensional velocity structure on the seismicity of the 1984 Morgan Hill, California, aftershock sequence. Bulletin of the Seismological Society of America 78, 1199–1221. doi:10.1785/BSSA0780031199
Michael, A. J. (1985). Regional stress and large earthquakes: An observational study using focal mechanisms. Ph.D. Dissertation. Stanford, Calif: Stanford Univ., 156.
Michael, A. J. (1991). Spatial variations in stress within the 1987 whittier narrows, California, aftershock sequence: New techniques and results. Journal of Geophysical Research 96 (B4), 6303–6319. doi:10.1029/91jb00195
Molchan, G. M., Konrod, T. L., and Nekrasova, A. K. (1999). Immediate fore-shocks: Time variation of the b-value. Phys. Earth Planet. Inter 111, 229–240. doi:10.1016/s0031-9201(98)00163-0
Nalbant, S. S., Hubert, A., and King, G. C. P. (1998). Stress coupling between earthquakes in northwest Turkey and the north Aegean Sea. Journal of Geophysical Research 103, 24469–24486. doi:10.1029/98jb01491
Peng, Z., Vidale, J. E., Ishii, M., and Helmstetter, A. (2007). Seismicity rate immediately before and after main shock rupture from high-frequency waveforms in Japan. Journal of Geophysical Research-Solid Earth 112, B03306–B03315. doi:10.1029/2006jb004386
Presti, D., Orecchio, B., Falcone, G., and Neri, G. (2008). Linear versus non-linear earthquake location and seismogenic fault detection in the southern Tyrrhenian Sea, Italy. Geophysical Journal International 172, 607–618. doi:10.1111/j.1365-246x.2007.03642.x
Reasenberg, P. A. (1999). Foreshock occurrence before large earthquakes. Journal of Geophysical Research Solid Earth 104 (B3), 4755–4768. doi:10.1029/1998jb900089
Ren, J., Xu, X., Yeats, R. S., and Zhang, S. (2013). Latest quaternary paleoseismology and slip rates of the Longriba fault zone, eastern Tibet: Implications for fault behavior and strain partitioning. Tectonics 32, 216–238. doi:10.1002/tect.20029
Ross, E., Idini, B., Jia, Z., Stephenson, O. L., Zhong, M., Wang, X., et al. (2019). Hierarchical interlocked orthogonal faulting in the 2019 Ridgecrest earthquake sequence. Science 366 (6463), 346–351. doi:10.1126/science.aaz0109
Shearer, P. M. (2009). Introduction to seismology. Cambridge: Cambridge University Press. doi:10.1017/CBO9780511841552
Shearer, P. (1997). Improving local earthquake locations using the L1 norm and waveform cross correlation: Application to the whittier narrows, California, aftershock sequence. Journal of Geophysical Research 102, 8269–8283. doi:10.1029/96jb03228
Shen, Z. K., Lü, J. N., Wang, M., and Bürgmann, R. (2005). Contemporary crustal deformation around the southeast borderland of the Tibetan Plateau. J. Geophys. Res. 110, B11409. doi:10.1029/2004JB003421
Shen, Z. K., Sun, J., Zhang, P., Wan, Y., Wang, M., Burgmann, R., et al. (2009). Slip maxima at fault junctions and rupturing of barriers during the 2008 Wenchuan earthquake. Nature Geoscience 2, 718–724. doi:10.1038/ngeo636
Stein, R. S. (2003). Earthquake conversations. Scientific American 288, 72–79. doi:10.1038/scientificamerican0103-72
Stein, R. S., King, G. C. P., and Lin, J. (1994). Stress triggering of the 1994 M=6.7 Northridge, California, earthquake by its predecessors. Science 265 (5177), 1432–1435. doi:10.1126/science.265.5177.1432
Stein, R. S. (1999). The role of stress transfer in earthquake occurrence. Nature 402, 605–609. doi:10.1038/45144
Sugan, M., Vuan, A., Kato, A., Massa, M., and Amati, G. (2019). Seismic evidence of an early afterslip during the 2012 sequence in Emilia (Italy). Geophysical Research Letters 46 (2), 625–635. Portico. doi:10.1029/2018gl079617
Sun, D., Wang, D. Y., Wu, D. C., Zhao, D. J., and Huang, C. (2010). Activity and effect of main faults in near field of Bala Hydro power station in Maerkang. J. Engineer. Geol. (in Chinese) 18 (6), 940–949.
Tamaribuchi, K., Yagi, Y., Enescu, B., and Hirano, S. (2018). Characteristics of foreshock activity inferred from the JMA earthquake catalog. Earth, Planets and Space 70, 90–13. doi:10.1186/s40623-018-0866-9
Tan, Y., Zhu, L., Helmberger, D. V., and Saikia, C. K. (2006). Locating and modeling regional earthquakes with two stations. Journal of Geophysical Research 111 (B1), B013061029. doi:10.1029/2005jb003775
Toda, S., Stein, R. S., Reasenberg, P. A., Dieterich, J. H., and Yoshida, A. (1998). Stress transferred by the 1995 Mw= 6.9 Kobe, Japan, shock: Effect on aftershocks and future earthquake probabilities. Journal of Geophysical Research Solid Earth 103 (B10), 24543–24565. doi:10.1029/98jb00765
Waldhauser, F., and Ellsworth, W. L. (2000). A double-difference earthquake location algorithm: Method and application to the northern hayward fault, California. Bulletin of the Seismological Society of America 90, 1353–1368. doi:10.1785/0120000006
Waldhauser, F. (2001). HypoDD: A computer program to compute double-difference earthquake locations. Menlo Park: USGS Open File Rep., 01–113.
Wang, M., and Shen, Z. K. (2020). Present-day crustal deformation of continental China derived from GPS and its tectonic implications. Journal of Geophysical ResearchSolid Earth 125 (2), e2019JB018774. doi:10.1029/2019JB018774
Wang, Q., Wang, H., and Xia, A. (2009). Features of seismicity in Xinjiang and its possible reason after the Yutian MS7.4 earthquake, 2008. Earthquake. Science (in Chinese) 22, 615–622. doi:10.1007/s11589-009-0615-z
Wang, R., (2003). Computation of deformation induced by earthquakes in a multi-layered elastic crust - FORTRAN programs EDGRN/EDCMP. Computer and Geosciences 29 (2), 195–207. doi:10.1016/s0098-3004(02)00111-5
Wang, R., Lorenzo-Martin, F., and Roth, F. (2006). PSGRN/PSCMP - a new code for calculating co- and post-seismic deformation, geoid and gravity changes based on the viscoelastic-gravitational dislocation theory. Computers and Geosciences 32, 527–541. doi:10.1016/j.cageo.2005.08.006
Wang, W., Fang, L., Wu, J., Tu, H., Chen, L., Lai, G., et al. (2021). Aftershock sequence relocation of the 2021 MS7.4 Maduo earthquake, Qinghai, China. Science China Earth Sciences 64, 1371–1380. doi:10.1007/s11430-021-9803-3
Wang, W. L., Wu, J. P., Fang, L. H., and Wang, C. Z. (2012). Relocation of the Yushu MS7.1 earthquake and its aftershocks in 2010 from HypoDD. Science China Earth Sciences 56, 182–191. doi:10.1007/s11430-012-4450-z
Wang, X. S., Lü, J., Xie, Z. J., Long, F., Zhao, X. Y., and Zheng, Y. (2015). Focal mechanisms and tectonic stress field in the North-South Seismic Belt of China. Chinese Journal of Geophysics (in Chinese) 58 (11), 4149–4162. doi:10.6038/cjg20151122
Wang, Y. Z., Wang, E. N., Shen, Z. K., Wang, M., Gan, W. J., Qiao, X. J., et al. (2008). GPS-constrained inversion of present-day slip rates along major faults of the Sichuan-Yunnan region, China. Science in China (Ser D) 51 (9), 1267–1283. doi:10.1360/zd2008-38-5-582
Wei, Z., Yang, S., and Chen, X. F. (2008). Numerical simulation of strong ground motion for the M s8.0 Wenchuan earthquake of 12 May 2008. Science in China Series D Earth Sciences 51, 1673–1682. doi:10.1007/s11430-008-0130-4
Wells, D., and Coppersmith, K. (1994). New empirical relationships among magnitude, rupture length, rupture width, rupture area, and surface displacement. Bulletin of the Seismological Society of America 84, 974–1002.
Wessel, P., and Smith, W. H. F. (1998). New, improved version of generic mapping tools released. AGU 79, 579. doi:10.1029/98eo00426
Wiemer, S. (2001). A software package to analyze seismicity: Zmap. Seismological Research Letters 72 (3), 373–382. doi:10.1785/gssrl.72.3.373
Woessner, J., and Wiemer, S. (2005). Assessing the quality of earthquake catalogues: Estimating the magnitude of completeness and its uncertainty. Bulletin of the Seismological Society of America 95 (2), 684–698. doi:10.1785/0120040007
Wu, W. W., Wei, Y. L., Long, F., Liang, M. J., Chen, X. F., Sun, W., et al. (2020). Study on source parameters of the 8 August 2017 M7.0 Jiuzhaigou earthquake and its aftershocks, northern Sichuan. Seismology and Geology (in Chinese) 42 (02), 492–512. doi:10.3969/j.issn.0253-4967.2020.02.015
Xiong, X., Shan, B., Zheng, Y., and Wang, R. J. (2010). Stress transfer and its implication for earthquake hazard on the Kunlun Fault, Tibet. Tectonophysics 482, 216–225. doi:10.1016/j.tecto.2009.07.020
Xu, X. W., Wen, X. Z., Chen, G. H., and Yu, G. H. (2008). Discovery of the Longriba faults, eastern part of the Bayankela tectonic block and its geodynamic implications. Sciences in China (Series-D) (in Chinese) 38 (5), 529–542. doi:10.1360/zd2008-38-5-529
Xu, X. W., Wen, X. Z., Han, Z. J., Chen, G. H., Li, C. Y., Zheng, W., et al. (2013). Lushan MS7.0 earthquake: A blind reserve-fault event. Chinese Science Bulletin (in Chinese) 58, 3437–3443. doi:10.1007/s11434-013-5999-4
Yadav, R., Papadimitriou, E. E., Karakostas, V., Shanker, D., Rastogi, B. K., Chopra, S., et al. (2011). The 2007 talala, Saurashtra, Western India earthquake sequence: Tectonic implications and seismicity triggering. Journal of Asian Earth Sciences 40, 303–314. doi:10.1016/j.jseaes.2010.07.001
Yang, Y. H. (2014). Application of receiver function method for crust and upper mantle structure beneath sichuan and yunnan region. Master Dissertation (in Chinese). Chengdu: Chengdu University of Technology.
Yi, G. X., Long, F., Liang, M. J., Zhang, H. P., Zhao, Min, Ye, Y. Q., et al. (2017). Focal mechanism solution and seismogenic structure of the 8 August 2017 M7.0 Jiuzhaigou earthquake and its aftershocks, nortthern Sichuan. Chinese Journal of Geophysics (in Chinese) 60 (10), 4083–4097. doi:10.6038/cjg20171033
Yi, G. X., Long, F., Liang, M. J., Zhao, M., Wang, S. W., Gong, Y., et al. (2019). Focal mechanism solutions and seismogenic structure of the 17 June 2019 MS6.0 Sichuan Changning earthquake sequence. Chinese Journal of Geophysics (in Chinese) 62 (9), 3432–3447. doi:10.6038/cjg2019N0297
Yi, G. X., Long, F., Wen, X. Z., Liang, M. J., and Wang, S. W. (2015). Seismogenic structure of the M6.3 kangding earthquake sequence on 22 nov. 2014, southwestern China. Chinese Journal of Geophysics (in Chinese) 58 (4), 1205–1219. doi:10.6038/cjg20150410
Yu, G., Xu, X., Klinger, Y., Diao, G., Chen, G., Feng, X., et al. (2010). Fault-scarp features and cascading-rupture model for the Mw 7.9 Wenchuan earthquake, eastern Tibetan Plateau, China. Bulletin of the Seismological Society of America 100, 2590–2614. doi:10.1785/0120090255
Yue, H., Shen, Z., Zhao, Z., Wang, T., Cao, B., Li, Z., et al. (2022). Rupture process of the 2021 M7.4 Maduo earthquake and implication for deformation mode of the Songpan-Ganzi terrane in Tibetan Plateau. Proc. Natl. Acad. Sci. U. S. A. 119 23 (2022), e2116445119. doi:10.1073/pnas.2116445119
Zhang, P. Z., Deng, Q. D., Zhang, G. M., Ma, J., Gan, W. J., Min, W., et al. (2003). Active tectonic-block and Strong earthquakes in the continent of China. Science in China Series D Earth Sciences 46, 13–20.
Zhao, L. S., and Helmberger, D. V. (1994). Source estimation from broadband regional seismograms. Bulletin of the Seismological Society of America 84 (1), 91–104. doi:10.1785/BSSA0840010091
Zhao, M., Long, F., Yi, G. X., Liang, M. J., Xie, J. T., and Wang, S. W. (2021). Focal mechanism and seismogenic structure of the MS 5.1 qingbaijiang earthquake on february 3, 2020, southwestern China. Frontiers in Earth Science 9. doi:10.3389/feart.2021.644142
Zhao, Z., and Zhang, R. S. (1987). The compilation of regional travel time table in Sichuan. Earthquake Research in Sichuan 2, 29–35. (in Chinese with English abstract).
Zheng, Y., Ma, H., Lü, J., Ni, S., Li, Y., and Wei, S. (2009). Source mechanism of strong aftershocks (MS ≥ 5.6) of the 2008/05/12 Wenchuan earthquake and the implication for seismotectonics. Science in China Series D Earth Sciences 52 (6), 739–753. doi:10.1007/s11430-009-0074-3
Zhou, R. J., He, Y. L., Ma, S. H., and Li, X. G. (1999). Late quaternary active characteristics of Fubianhe fault in Sichuan’s Xiaojin. J. Seismol. Res. (in Chinese) 22 (4), 376–381.
Zhu, J. S. (1988). The computational methods in the Seismology. Beijing: Seismological Press. (in Chinese).
Zhu, L., and Kanamori, H. (2000). Moho depth variation in southern California from teleseismic receiver functions. J Geophys Res 105, 2969–2980. doi:10.1029/1999jb900322
Zhu, L. P., and Rivera, L. A. (2002). A note on the dynamic and static displacements from a point source in multilayered media. Geophysical Journal International 148, 619–627. doi:10.1046/j.1365-246x.2002.01610.x
Keywords: Maerkang earthquake sequence, seismogenic structure, spatiotemporal pattern, focal mechanism, Coulomb stress change
Citation: Feng L, Chang H, Guixi Y, Xiaohui H, Li L, Fuqiang S, Yue G and Liyuan P (2023) Seismogenic structures and spatiotemporal seismicity patterns of the 2022 Ms6.0 Maerkang earthquake sequence, Sichuan, China. Front. Earth Sci. 10:1049911. doi: 10.3389/feart.2022.1049911
Received: 21 September 2022; Accepted: 13 December 2022;
Published: 23 January 2023.
Edited by:
Huajian Yao, University of Science and Technology of China, ChinaReviewed by:
Vasileios Karakostas, Aristotle University of Thessaloniki, GreeceAlessandro Vuan, Istituto Nazionale di Oceanografia e di Geofisica Sperimentale, Italy
Jianshe Lei, China Earthquake Administration, China
Copyright © 2023 Feng, Chang, Guixi, Xiaohui, Li, Fuqiang, Yue and Liyuan. This is an open-access article distributed under the terms of the Creative Commons Attribution License (CC BY). The use, distribution or reproduction in other forums is permitted, provided the original author(s) and the copyright owner(s) are credited and that the original publication in this journal is cited, in accordance with accepted academic practice. No use, distribution or reproduction is permitted which does not comply with these terms.
*Correspondence: Yi Guixi, eWlneDY0QDE2My5jb20=