 Hongxing Wang
 Dizhi Zhang
95% of researchers rate our articles as excellent or good
Learn more about the work of our research integrity team to safeguard the quality of each article we publish.
Find out more
ORIGINAL RESEARCH article
Front. Earth Sci. , 12 January 2023
Sec. Geohazards and Georisks
Volume 10 - 2022 | https://doi.org/10.3389/feart.2022.1047079
In applications of stabilized/solidified (S/S) sediments, the organic matter inside the original sediments will decompose and release fulvic acid (FA) and humic acid (HA) gradually, which may reduce the durability of the S/S sediments. It is critical to understand the long-term internal erosion mechanism to improve the durability of S/S sediments. Thus, S/S sediments solidified by commonly used cement, lime, and metakaolin were first prepared in the laboratory. Reasonable proportioning of the additives was determined through orthogonal tests. Unconfined compression strength tests, measurements of organic environment indexes and chemical environment indexes, and scanning electron microscopy analysis were then conducted after different curing periods of the S/S sediments to explore the erosion mechanism. The following results and conclusions were obtained. 1) The microstructure of S/S sediments is composed of a sediment aggregate core, a hydrated calcium silicate (CSH) shell covering the core, and calcium hydroxide (CH) submerged in the CSH shell. 2) HA and FA are released gradually by organic matter decomposition inside the core and are consumed by neutralization reactions with solidification products. 3) The dissipation process of organic matter and the induced damage process of S/S sediments can be partitioned into three stages: in the first stage, HA and FA jointly neutralize the solidification products inside the CSH shell, the CSH shell is eroded gradually, and the S/S sediments lose strength gradually; in the second stage, the neutralization reactions are still inside the CSH shell, but only occur between FA (not HA) and the solidification products, the CSH shell breaks down at the end of this stage, but the S/S sediments do not lose much strength until the end point; and in the third stage, neutralization reactions take place outside the CSH shell between HA (but not FA) and the solidification products, and the S/S sediments lose strength dramatically. It was also concluded that HA (rather than FA) is more likely to neutralize solidification products in a more alkaline environment; HA has much stronger chemical affinity with Ca2+ ions than FA; HA controls the strength loss of S/S sediments, whereas FA controls the working status of HA; and the developments of HA content and Ca2+ ion concentration reflect the strength loss of S/S sediments.
Very large amounts of dredged sediments are produced annually worldwide for navigation and environmental purposes (Park et al., 2016; Rakshith and Singh, 2017). Pollutant-containing sediments may pose potential harm to the environment again if they are not treated properly after dredging (Hejabi and Belagali, 2009; Zentar et al., 2012; Rakshith and Singh, 2017; Rügner et al., 2019; Dsikowitzky et al., 2020). Beside stockpiling on land or simply dumping at sea, the treatment process to form stabilized/solidified (S/S) sediments also consumes a massive amount of sediments (Chiu et al., 2009; Zentar et al., 2012). This treatment can improve the mechanical properties of sediments (solidification) and reduce contaminant leaching (stabilization) (Sollars and Perry, 1989; Wang et al., 2018; Chen et al., 2019; Li et al., 2019; Wu et al., 2020; Cui et al., 2022). Commonly treated with cement, lime, metakaolin, etc., S/S sediments have been widely used in various engineering fields worldwide, such as road layers, river embankments, and foundation treatment, owing to their superior characteristics, namely low permeability, high strength, high stiffness, and good workability (Wang et al., 2015; Park et al., 2016; Rakshith and Singh, 2017; Pu et al., 2019).
The performances and applicability of S/S sediments have been improved through a large number of studies (Rakshith and Singh, 2017; Pu et al., 2019). In a great many of the investigations, however, it was found that engineering diseases, such as cracking of pavements and failure of embankments and foundations, appeared during the operation period when S/S sediments were applied as the filling materials, even though those S/S sediments initially satisfied controlling indexes such as the compaction degree, optimum moisture content, California bearing ratio (CBR), and unconfined compression strength (UCS) during the construction period (Kamali et al., 2008; Zentar et al., 2012; Ahmed and Issa, 2014; Wang et al., 2022). Investigations also revealed that those constructions performed well in the early post-construction periods and that the controlling indexes, such as the UCS, of the S/S sediments decreased when the engineering diseases appeared in those constructions. This indicates that those engineering diseases were induced by the degradation of the S/S sediments (Zentar et al., 2012; Wang et al., 2019). Therefore, it is crucial to improve the durability of S/S sediments for better applications. Many studies have been conducted according to different atmospheric conditions for development of the durability (Kamali et al., 2008; Zentar et al., 2012; Kamei et al., 2013; Ahmed and Issa, 2014; Du et al., 2014, 2016). For instance, Zentar et al. (2012) studied the impact of freeze–thaw cycles and water immersion on the strength of S/S marine sediments solidified by cement/fly-ash binders, and they found that freeze–thaw cycles and water immersion significantly decreased the UCSs of S/S sediments. Kamei et al. (2013) investigated the impact of dry–wet cycles on the durability of S/S sediments solidified by basanite and coal ash; they found that incorporation of recycled basanite and coal ash achieves an acceptable effect in improving the durability of S/S sediments. Du et al. (2014) investigated the impact of acid rain on the leaching characteristics of S/S sediments and found that lead contamination and cement content levels have a considerable impact on the leaching behavior. However, the impact of organic matter on the durability of S/S sediments has not been considered important.
Adsorbed on the surfaces of the original sediments delivered from households and industries are considerable amounts of organic matter, including residuals of plants, animals, microbes, and humus (Dsikowitzky et al., 2020). Among them, humus including humic acid (HA), fulvic acid (FA), and humin arises from microbiological decomposition of the above-stated organic matter (Frouz, 2018). Studies have noticed the negative impact of organic matter on the immediate solidification of S/S sediments (Dubois et al., 2009; Zentar et al., 2009; Pan et al., 2020). For instance, Zentar et al. (2009) confirmed that the liquid and plastic limits of sediments both increase with increased organic matter inside the sediments. Dubois et al. (2009) pointed out that organic matter inside S/S marine sediments will slow the rise of the pH value and fix the released calcium ions in the cement hydration phase; addition of lime can be an interesting solution because lime will supply abundant calcium ions (Ca2+) and hydroxide ions (OH−1). Studies have also revealed that the substances inside organic matter that will degrade S/S sediments are HA and FA, because HA and FA will neutralize solidification products such as hydrated calcium silicate (CSH) and calcium hydroxide (CH) (Zentar et al., 2009; Pan et al., 2020). For example, Pan et al. (2020) revealed that HA can react quickly with the hydration products of cement and reduces the concentrations of OH−1 and Ca2+ in pore solutions of S/S sediments; as a result, the UCSs of S/S sediments are reduced by HA. Pan et al. (2020) also pointed out that an oxidizing agent such as potassium permanganate can decompose HA into small molecules or monomers, in which way the negative impact of HA on the strength of S/S sediments can be diminished.
Unfortunately, however, very few studies have focused on the negative impact of organic matter on the long-term performance of S/S sediments, even though strength decreases of organic-matter-containing S/S sediments have been recorded during applications in many studies (Zentar et al., 2012; Wang et al., 2013). As pointed out by Saride et al. (2013), for S/S sediments bearing different organic contents (varying between 2% and 6%) and solidified by different dosages of cement and lime, the pH value and organic matter content both decreased from day zero to the 56th day and the strength started to decrease from the 28th day until the 56th day with standard curing. This study indicates that the organic matter inside the original sediments is dissipated gradually during the curing and application of S/S sediments, which are accordingly being damaged. However, the dissipation process for the organic matter and the induced damage process of the S/S sediments are still not clear. 1) How is the organic matter dissipated? Is it decomposed by microorganisms? What exactly are the decomposition outcomes from organic matter: HA or FA? What is the ratio between HA content and FA content? Are those products consumed by neutralization reactions with solidification products? How do the outcomes change during the dynamic balance between organic matter decomposition and consumption of neutralization reactions? How do the products react with the solidification products? 2) How is the solidification process impacted? How is the chemical environment changed? How is the microstructure changed? How is the strength affected? These issues are very important for identifying the long-term internal erosion mechanisms of organic matter in S/S sediments, which we will determine in this study.
To reveal how the strength is affected, we will prepare samples of S/S sediments in the laboratory and measure the UCSs after different curing periods. To reveal how organic matter is dissipated, we will measure organic environment indexes, including the content of organic matter, FA, and HA, after different curing periods. To reveal how the chemical environment of the S/S sediments changes, we will measure chemical environment indexes, including the pH value and Ca2+ ion concentration, after different curing periods. To reveal how the microstructure of the S/S sediments is damaged, we will observe the microstructure aspects by scanning electron microscopy (SEM) after different curing periods. By completing these measurements in turn, we expect to determine the long-term internal erosion mechanism of organic matter in S/S sediments.
Dredged sediments were collected by a cutter–suction dredger from a sediment dredging site in Hubei Province, China. After the sediments were transported to the laboratory by a sludge carrier truck, the residual grasses, branches, and other residues were removed by hand immediately. The initial water content was then measured by the oven-drying method, grain size distributions were obtained by the sieving method (≥0.075 mm) and hydrometer method (<0.075 mm), plastic and liquid limits were measured by the fall cone method, the pH value was measured with a digital pH meter test, and the total organic matter content (TOC) was determined by the potassium dichromate oxidation titration method. The physical and chemical parameters of the sediments obtained from the above tests are shown in Table 1. The material composition measured by X-ray diffraction (XRD) is shown in Figure 1. The primary material component is quartz (SiO2), along with some calcite, berlinite, and moganite.
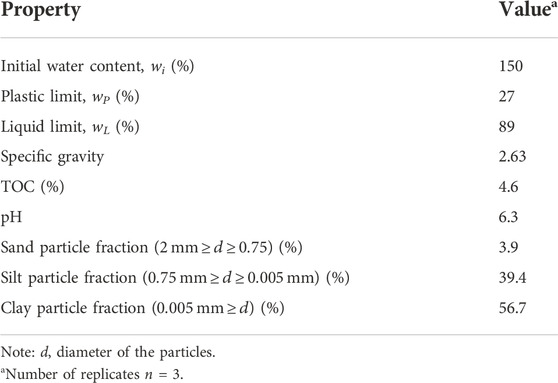
TABLE 1. Physical and chemical parameters of the sediments.
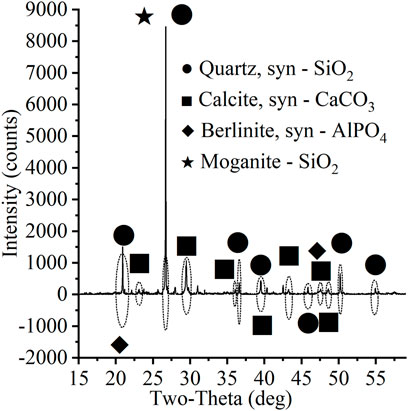
FIGURE 1. XRD analysis of the sediments.
Given their common applications in S/S sediments, cement, lime, and metakaolin were used as additives in this study. The chemical compositions of the solidification agents, such as ordinary Portland cement, lime, and metakaolin purchased from the market, are shown in Table 2.
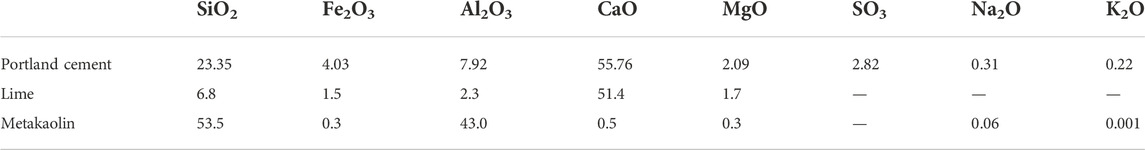
TABLE 2. Chemical compositions of cement, lime, and metakaolin (%).
The initial water content of the sediments was first reduced to predefined values by a preloading method on the ‘sediment-moisture controlling equipment’ (Chinese patent: 2016200439494), whereby the amount of water drained from the sediments under loading was measured and recorded by a flowmeter to control the final water content. This method can avoid the destruction of organic matter inside the sediments because the sediments are not dried as in the traditional oven-drying method.
When S/S sediments are applied as filling materials in the reclamation of lands, dikes, and embankments, all of the procedures, including raw sediment handling, sediment–additive mixing, and pumping, are completed on the working ship in a slurry state (Tang et al., 2001, 2003). With consideration of this background of application, the sediments were stirred in a stirring machine to homogenize them in the slurry state. Afterwards, solidification additives, including cement, lime, and metakaolin, were added to the sediments with predefined proportioning, and the mixtures were stirred into a homogeneous state. The mixtures were then poured into molds that were 50 mm in diameter and 100 mm in height. Because they were in the slurry state, the mixtures were not compacted but vibrated (Zhang et al., 2014; Wang et al., 2019; Wu et al., 2019). The mixtures were first vibrated manually inside the molds; then, with the mixtures inside, the molds were put on a platform vibrator for further densification until no air bubbles were being emitted. After that, the mold was stored for 3 days in a chamber with constant temperature and constant humidity (25 ± 2°C, 95 ± 1%). Once hardened enough, the sample was removed from the mold, covered with preservative film, and kept in the chamber for further curing.
An orthogonal test with four factors at three levels (Xia et al., 2016) was designed for reasonable mixing proportioning, as shown in Table 3, based on the UCSs and TOCs of S/S sediments after 28 days of curing. With the selected proportioning, S/S sediment samples were prepared and cured for different curing periods according to the above-stated procedures. After curing periods of 28, 45, 60, 120, and 180 days, indexes including the UCS, TOC, FA content, HA content, pH value, and Ca2+ ion concentration were determined; after curing periods of 28, 90, and 180 days, the microstructure aspects were scanned by SEM.
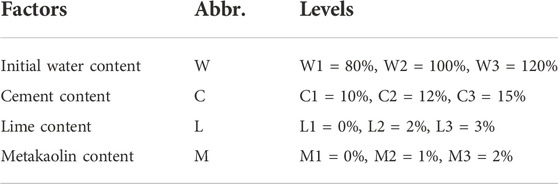
TABLE 3. Factors and levels of the orthogonal test program.
By referring to ASTM D4219-02 (ASTM D4219-02, 2003), the UCS test was carried out on a microcomputer-controlled universal WDW-20 electronic tester from Changchun New Testing Machine Co., Ltd. For this strain-controlled machine, loading velocity was in the range of 0.005–500 mm/min, and the maximum testing force was 20 kN with a relative error smaller than ±0.5%. The specimen was a cylinder of 50 mm in diameter and 100 mm in height, and the loading velocity in the test for this study was 0.08 mm/min.
Measurements of the TOC, HA content, and FA content were conducted by referring to the Technical Specification for Soil Analysis (National Agricultural Technology Extension Service Center, 2006).
The TOC was measured by a potassium dichromate oxidation titration method. The main procedures were as follows: 1) Measure the water content (W) of the air-dried S/S sediment sample; 2) put the sample into the boiling tube; 3) add potassium dichromate–sulfuric acid solution; 4) put the boiling tube in the graphite digestion instrument and heat for 5 min at 185 °C; 5) take out the tube and use 50 ml distilled water to flush the digesting fluid and soil residues into a triangular bottle; and 6) add three drops of phenanthroline indicator to titrate with a standard solution of ammonium ferrous sulfate; record the volume V when the solution color changes from orange to yellow-blue to green-brown, and finally to red. A blank test must be done at the same time for each batch analysis, recording the volume V0. The experimental result is obtained from Eq. 1 (National Agricultural Technology Extension Service Center, 2006):
in which TOC is the total organic matter content, in ‰; C is the concentration of ammonium ferrous sulfate solution, in mol/L; V0 is the blank sample consumption, in ml; V is the sample consumption, in ml; W is the moisture content of sample, in %; and M is the sample mass, in g.
The first step for measuring the HA and FA contents was preparation of the filtrate as follows: 1) grind the air-dried S/S sediment sample; 2) sieve 10 g of pulverized sample with a sieve size of 0.25 mm and pour the sample into a 250 ml triangular flask; 3) add 100 ml of sodium hydroxide–sodium pyrophosphate mixed extract into a triangular flask; and 4) filter the solution after it has been oscillated in an oscillator for 30 min and left to stand for 13 h at 25 ± 2°C; keep the filtrate in a triangular flask.
The measurement of the total contents of HA + FA was as follows: 1) place 10 ml of the above filtrate into a 100 ml triangular flask and neutralize the filtrate to pH 7.0 with 1 mol/L sulfuric acid solution; 2) dry the solution by distillation at 60°C in a water bath and collect the white solid; and 3) measure the total organic content of the white solid by the same method as that of TOC measurement mentioned above. The total content of HA + FA is calculated from Eq. 2 (National Agricultural Technology Extension Service Center, 2006):
in which
The measurement of the HA content was as follows: 1) place 20 ml of the above filtrate into a 200 ml beaker; 2) add 1 mol/L sulfuric acid solution to neutralize the filtrate to pH 1–1.5 (tested with pH test paper; cotton-like HA will appear in the solution); 3) put the solution in a water bath at a constant temperature of 80 °C for 30 min and then leave it to stand at room temperature for more than 12 h until next morning; 4) filter the solution with slow filter paper and obtain the deposits; 5) flush the deposits with 0.05 mol/L sulfuric acid solution, until the washing liquor is colorless; 6) dissolve the deposits in a 50 ml volumetric flask with 0.05 mol/L sodium hydroxide solution; 7) place 20 ml of the solution into a 100 ml beaker, and neutralize to pH 7 with 1 mol/L sulfuric acid solution; 8) dry the solution by distillation at 60°C in a water bath and collect the white solid; and 9) measure the total organic content of the white solid by the same method as that of TOC measurement mentioned above. The content of HA is calculated from Eq. 3 (National Agricultural Technology Extension Service Center, 2006):
in which
The content of FA is the difference between
The pH value and Ca2+ ion concentration of the S/S sediments were measured with a multiparameter Mettler Toledo measuring instrument (Seven Compact S220-K). Samples of 10 g of air-dried specimens were passed through a 0.25 mm soil sieve, mixed with 50 ml distilled water, and stirred and vibrated on a platform vibrator for 30 min. The supernatant was then extracted for measuring the pH value and Ca2+ ion concentration with different probes. The resolution for pH value is 0.0001 pH, with a precision of ±0.002 pH. The detection range for Ca2+ ion concentrations is
SEM analysis was performed on a Zeiss Ultra Plus field emission scanning electron microscope with a 1 cm3 cubic sample cut by a geotechnical knife. SEM can capture surface topography images and relative sample information through secondary electrons and backscattered electrons produced by exposure to a focused electron beam on the sample surface. With an LaB6 thermal field emission electron gun and accelerating voltage from 0.1 to 30 kV, the resolutions of the secondary-electron images are 1.0 nm (15 kV) and 1.9 nm (1 kV), and the magnification of the images is 12–1,000,000 times (for secondary electrons) and 100–1,000,000 times (for backscattered electrons). The microstructure of the S/S sediments, including the solidification products, sediment aggregates, and pores, can be captured on the SEM images.
Based on the orthogonal tests for S/S sediments after 28 days of curing, the UCSs are shown in Figure 2A and the TOCs are shown in Figure 2B. Compared with those of samples with water contents of 80% and 120%, the S/S sediments with a water content of 100% present the smallest UCSs and biggest TOC residuals. Under these conditions, the UCS was not sufficiently developed and the organic matter was not sufficiently consumed compared with the other samples. To capture the course of UCS development and organic matter decomposition more integrally, the S/S sediment samples with a water content of 100%, named as C1L2M3, C2L3M1, and C3L1M2, were cured unceasingly until the 180th day for subsequent analysis.
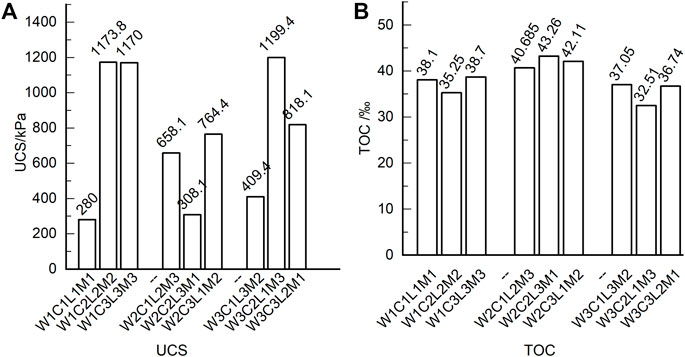
FIGURE 2. UCSs and TOCs of S/S sediments at the 28th day: (A) UCS, (B) TOC.
The UCSs after different curing periods are shown in Figure 3. At the 28th day, the UCS of C2L3M1 is much smaller than that of C1L2M3; more cement, more lime, and less metakaolin are contained in C2L3M1. This indicates that metakaolin is very effective in improving the strength of S/S sediments. Meanwhile, the UCS of C3L1M2 is much bigger than that of the other two samples that contain less lime, less metakaolin, and more cement. This indicates that cement is most important for improving the strength of S/S sediments. The UCSs first increase with curing time from the 28th day but then decrease sharply after a peak point until the 180th day, becoming even smaller than the initial strengths at the 28th day.
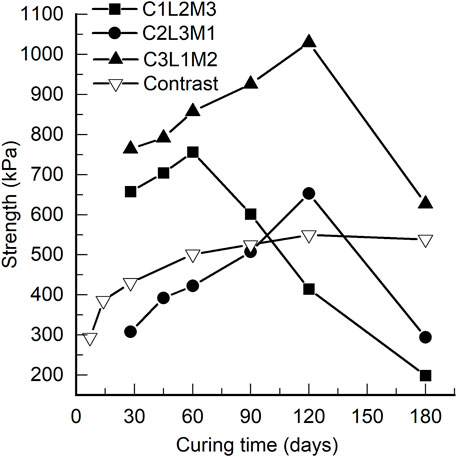
FIGURE 3. UCS development of S/S sediments.
The increase in the UCSs is a result of continuous solidification intensifying. As presented in the previous literature, the solidification reaction is a continuous course, and the strength of S/S sediments will keep increasing over a very long period (Zentar et al., 2012). To verify this, a contrast test was conducted, as shown in Figure 3. Organic matter in the contrast test was removed by oven drying at 140°C for 48 h. To simplify the matter, we used 15% cement as the sole solidification agent. As shown in Figure 3, the UCSs of the reference samples kept increasing until the 180th day, whereas the UCSs of the other S/S sediments, C1L2M3, C2L3M1, and C3L1M2, decreased after the peak points. This suggests that the organic matter weakened the S/S sediments and caused decreases in the UCSs. The UCS of C1L2M3 started to decrease after only 25% of increase at the 60th day, which indicates that metakaolin is not very effective for promoting long-term strength of S/S sediments, although it is effective for enhancing immediate strength. The UCS of C2L3M1 had increased by almost 100% at the 120th day before it decreased; this is an even bigger increase than that of C3L1M2 (50%), which indicates that lime is very effective for increasing long-term strength though not effective for immediately promoting strength.
The decrease in the UCSs is a result of weakening by organic matter. When the weakening effect exceeds the intensifying effect, the strength starts to decrease. For all three S/S sediments, the UCSs dropped to be even smaller than the initial strength at the 28th day, indicating that all of the solidification intensifying after the 28th day has been counteracted. In addition, for all three samples, the rates of UCS increase in the increasing sections before the peak point did not decelerate, whereas the rates of decrease in the decrease sections are even faster than those in the increasing sections. This indicates that a sudden change must occur near the peak point, when the solidification intensifying stops suddenly or the weakening by the organic matter launches suddenly.
The TOCs after different curing periods are shown in Figure 4A. The TOC after any curing period is the content of organic matter that is left over inside the S/S sediments after consumption. The TOCs decreased with curing time. For C1L2M3, C2L3M1, and C3L1M2, the TOCs decreased by 75.15%, 80.93%, and 66.02%, respectively, indicating that the organic matter was sharply consumed.
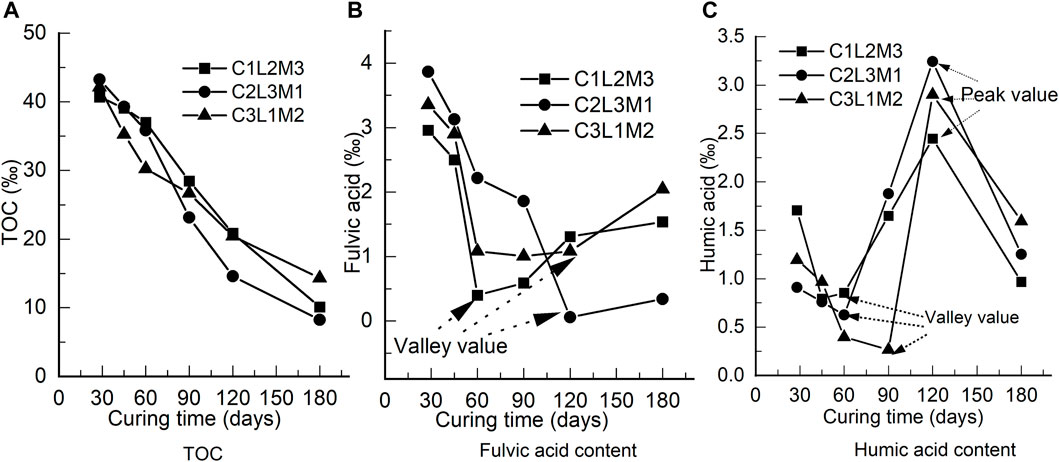
FIGURE 4. Development of organic environment indexes: (A) TOC, (B) fulvic acid content, and (C) humic acid content.
As one part of the organic matter, FA will react with OH− ions inside the S/S sediments and produce insoluble substances; meanwhile, FA will stabilize electrolytes (Shahbaz et al., 2017; Tadini et al., 2018). As shown in Figure 4B, the FA content first decreased with longer curing time and then increased until the 180th day. For C1L2M3, C2L3M1, and C3L1M2, the FA contents decreased by 48.08%, 91.18%, and 38.98% respectively, before increasing. The lost FA must be consumed by neutralization reactions. The FA contents started to increase at the 60th day for C1L2M3, the 120th day for C2L3M1, and the 120th day for C3L1M2, respectively. This indicates that FA was then released from the organic matter gradually by microbiological decompositions.
HA is much bigger than FA in molecular structure; FA molecules will react with themselves to produce HA when the FA content is high enough. HA will also react with OH− ions inside S/S sediments to produce insoluble substances (Shahbaz et al., 2017; Tadini et al., 2018). As shown in Figure 4C, the HA content first decreased with curing time, then increased, and finally decreased again. The details are as follows: 1) HA started to increase at the 45th day, 60th day, and 90th day for C1L2M3, C2L3M1, and C3L1M2, respectively, and 2) it started to decrease at the 120th day for all three S/S sediments. The decrease in HA will be the result of consumption by neutralization reactions. The increase in HA may come from the following three ways: 1) HA was released from other organic matter, as analyzed above, 2) FA molecules reacted with themselves to produce HA, or 3) HA was released from humin when HA was consumed to a low level, because humin was produced by HA and clay minerals.
Taking C2L3M1 as an example, comprehensive analysis of the organic matter dissipation was conducted as follows based on Figures 4B,C. Both FA and HA decreased owing to neutralization reaction consumption before the 60th day. After that, FA continued decreasing whereas HA increased sharply before the 120th day, indicating that the primary material involved in neutralization reactions must be FA rather than HA in this period. Beyond the 120th day, FA increased gradually whereas HA decreased sharply, which means that the primary material involved in neutralization reactions must be HA rather than FA in this period. Therefore, it is concluded that FA and HA were involved in neutralization reactions in the following way: 1) initially, when the HA content was close to the FA content to a certain extent, both FA and HA were involved in neutralization reactions; with consumption by the neutralization reactions, HA reached a valley value, which varies with different solidification proportioning of the agents; 2) HA was then removed from the neutralization reactions, whereas FA kept being involved in the reactions; some of the FA molecules reacted with themselves to produce HA to compensate for the HA consumption until reaching a valley value; at the same time, the HA content was also compensated for from organic matter decomposition until a peak value was reached; and 3) HA was then involved in the neutralization reactions rather than FA, and the HA content started to drop sharply whereas the FA content started to raise.
According to comprehensive analysis of the strength development and organic matter dissipations based on Figures 3, 4, the solidification reactions by solidification agents and neutralization reactions by organic matter were always in a dynamic-balance status during the curing period. In the early period, the solidification reactions were much more vigorous than the neutralization reactions, and the strength of the S/S sediments kept increasing. The primary acid consumed in this period was FA, whereas HA was accumulated gradually by organic matter release. In the later period, when HA had accumulated to a comparatively high level, HA was involved in the neutralization reactions, and these reactions were much more vigorous whereas the solidification reactions became weaker. The strength of the S/S sediments then decreased sharply. During this period, the primary acid consumed was HA, whereas FA was accumulated gradually by organic matter release. As shown in the UCS developments of the S/S sediments, the UCSs decreased so much that the UCSs at the 180th day were even smaller than those at the 28th day. This indicates that HA is much more sensitive to strength losses of S/S sediments than FA. What is more, because HA was involved in the neutralization reactions at times during the early period, the initial part of the strength curves was not much steeper than those parts near the peak, which is different from the strength development of S/S sediments without organic matter.
The pH value is an index to evaluate the alkaline environment inside S/S sediments. The higher the pH value, the better the solidification reactions will take place. As shown in Figure 5A, the pH value decreased sharply from around 11 to around 9. This means that the alkaline environment was becoming worse for solidification. Based on the development of the TOC, it was confirmed that reduction of the TOC induced the decrease in the pH value: The consumed organic matter is neutralized with OH− ions inside the S/S sediments, and this consumes OH− ions. A decrease in pH value will definitely impede solidification reactions or even decompose the solidification products.

FIGURE 5. Development of chemical environment indexes: (A) pH value and (B) Ca2+ ion concentration.
The Ca2+ ion concentration is an index to evaluate the solidification reaction activity: The higher the Ca2+ ion concentration, the better the solidification reactions will take place (Ma et al., 2017). As shown in Figure 5B, the Ca2+ ion concentration first dropped before the 60th day, then increased from the 60th to 120th day, and then dropped again from the 120th to 180th day. Taking C2L3M1 as an example, comprehensive analysis of the developments in the Ca2+ ion concentration, FA content, and HA content indicates the following, based on Figures 4B,C, 5B: HA and FA were both consumed in the first decrease period of Ca2+ ion concentration; FA, rather than HA, was consumed in the increase period; HA, rather than FA, was consumed in the second decrease period. It is shown that Ca2+ ion evolution highly coincides with HA evolution, rather than FA evolution. Thus, we come to the conclusion that HA has much stronger chemical affinity with Ca2+ ions than FA, and its content will affect the Ca2+ ion concentration more sensitively. Therefore, the first decrease in Ca2+ ion concentration was mainly induced by HA consumption from neutralization reactions rather than by FA consumption. The increase in Ca2+ ion concentration was a result of the solidification reactions, which were continuously occurring inside the S/S sediments; meanwhile, HA was compensated for as analyzed above and was not involved in the neutralization reactions. The second drop in Ca2+ ion concentration was owing to HA consumption because HA was involved in the neutralization reactions dramatically during this period.
Microstructures of S/S sediments at different scales are illustrated in Figure 6. As shown in Figure 6A, for S/S sediments cured in the standard environment for 28 days, grit and soil aggregates from the sediments are visible, while pores and cracks are distributed inside randomly. The S/S sediments can be easily cut down with a geotechnical knife and easily broken down by hand pressure. Soil aggregates are composed of bulk structures (looking hard), powder structures (looking soft), and pores between them, as shown in Figure 6B (50 times) and Figure 6C (100 times), respectively, at the scale of 100 µm. Bulk structures are edge-surface contacted with each other, with powder structures filled in among them. The surfaces of powder aggregates cut by geotechnical knife are very smooth, indicating that the powder aggregates are weak. The powder structures are composed of smaller bulk structures and net structures, as shown in Figure 6D (200 times) and Figure 6E (500 times), at the scale of 20 and 10 µm, respectively. Bulk structures in this scale range do not form contacts with each other but are submerged inside the net structures, which can be easily cut down with a geotechnical knife.
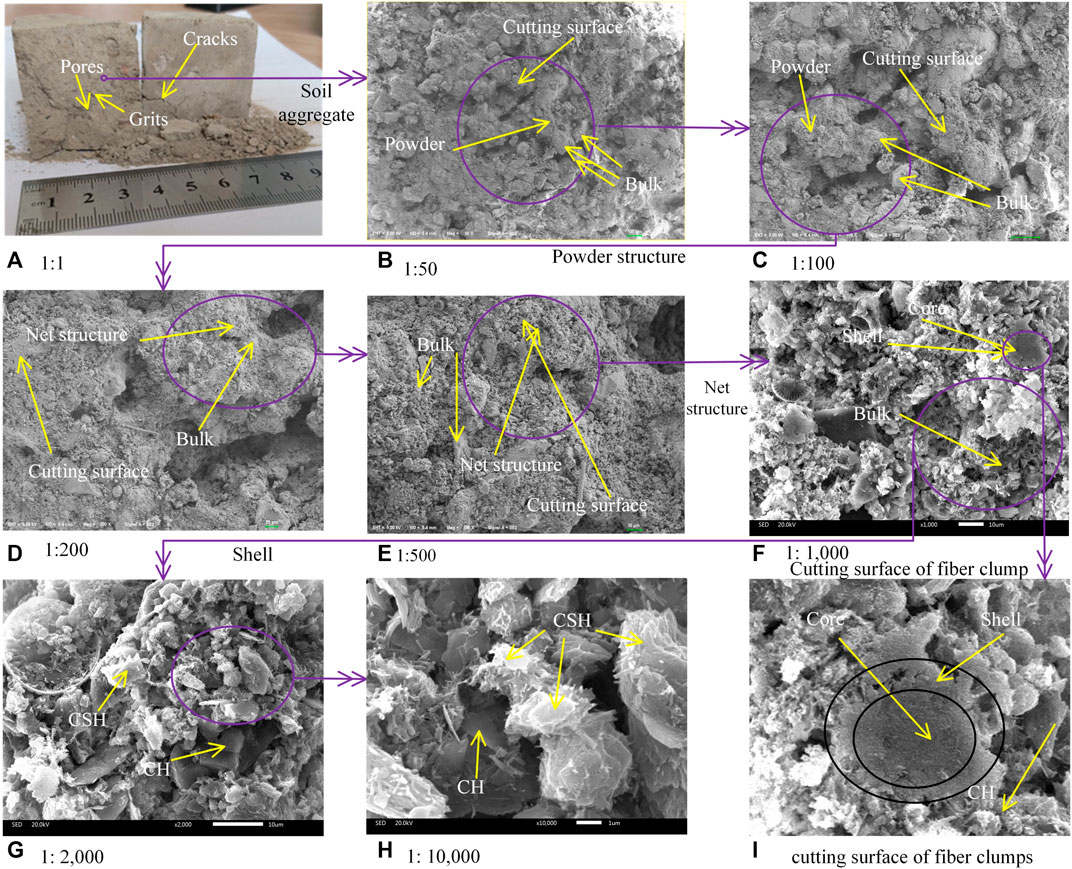
FIGURE 6. Microstructures of S/S sediments at different scales: (A) 1:1, (B) 1:50, (C) 1:100, (D) 1:200, (E) 1:500, (F) 1:1,000, (G) 1:2,000, and (H) 1:10,000. (I) Cutting surface of fiber clumps.
As shown in Figure 7, the particle size distribution of the sediments determined by the hydrometer method is in the range of 9.25–148 µm, and the sizes of the bulk structures in Figures 6B–E are also in a similar size range. As shown in Figure 8, the primary material components of the S/S sediments obtained by XRD are quartz, calcium hydroxide (CH), hydrated calcium silicate (CSH), and a small amount of hydrated calcium aluminate silicate (CASH). The sizes of CSH (and CASH) are much smaller than 10 μm, and the color of CH is much shinier, according to previous studies (Ahmed, 2015). Therefore, it is thought that the bulk structures in Figures 6B–E are sandy particles from the original sediments.
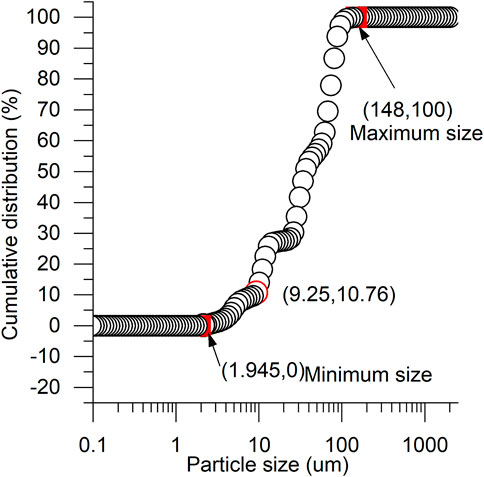
FIGURE 7. Particle size distributions of sediments.
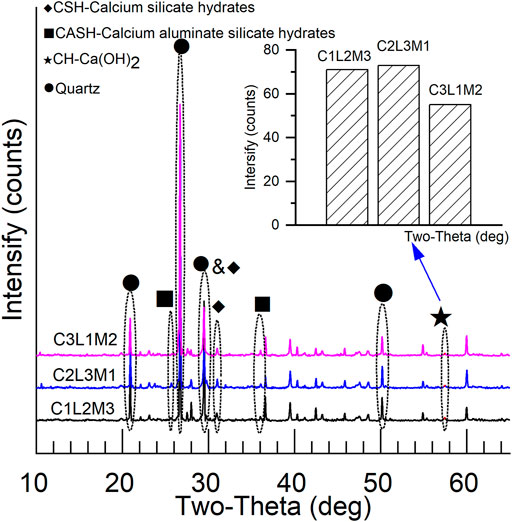
FIGURE 8. Material compositions of S/S sediments.
Within the net structures, the bulk structures are submerged between fiber clumps. The fiber clumps are in a flowery shape, loose and with lots of pores, as shown in Figure 6F (1000 times), at the scale of 10 µm. The fiber clumps can be easily cut down with a geotechnical knife. From the cutting surface of the fiber clumps, as shown in Figure 6I, it is observed that the inner core of the fiber clumps is the sediment aggregate. According to the material compositions of the S/S sediments shown in Figure 8, the shell of the fiber clumps is CSH in colloid status. On the surface of the CSH shell, CSH (as colloidal structures) and crystal structures are mixed, as shown in Figure 6G (2000 times) and Figure 6H (10,000 times), respectively. From the material compositions of the S/S sediments shown in Figure 8, these crystal structures and the bulk structures submerged between the fiber clumps in Figure 6F are thought to be CH.
Microstructures at the scale of 1 µm for different S/S sediments after different curing periods are illustrated in Figure 9. As shown in Figures 9A1,B1,C1, C2L3M1, containing more cement, more lime, and less metakaolin, is more developed in CH (bulk structure) but less developed in CSH (colloid structure), as compared with C1L2M3. C3L1M2, with more cement, less lime, and less metakaolin, is less developed in CH but more developed in CSH, as compared with C1L2M3. Also as illustrated by the XRD analysis in Figure 8, the CH diffraction peaks are strongest in C2L3M1 but weakest in C3L1M2.
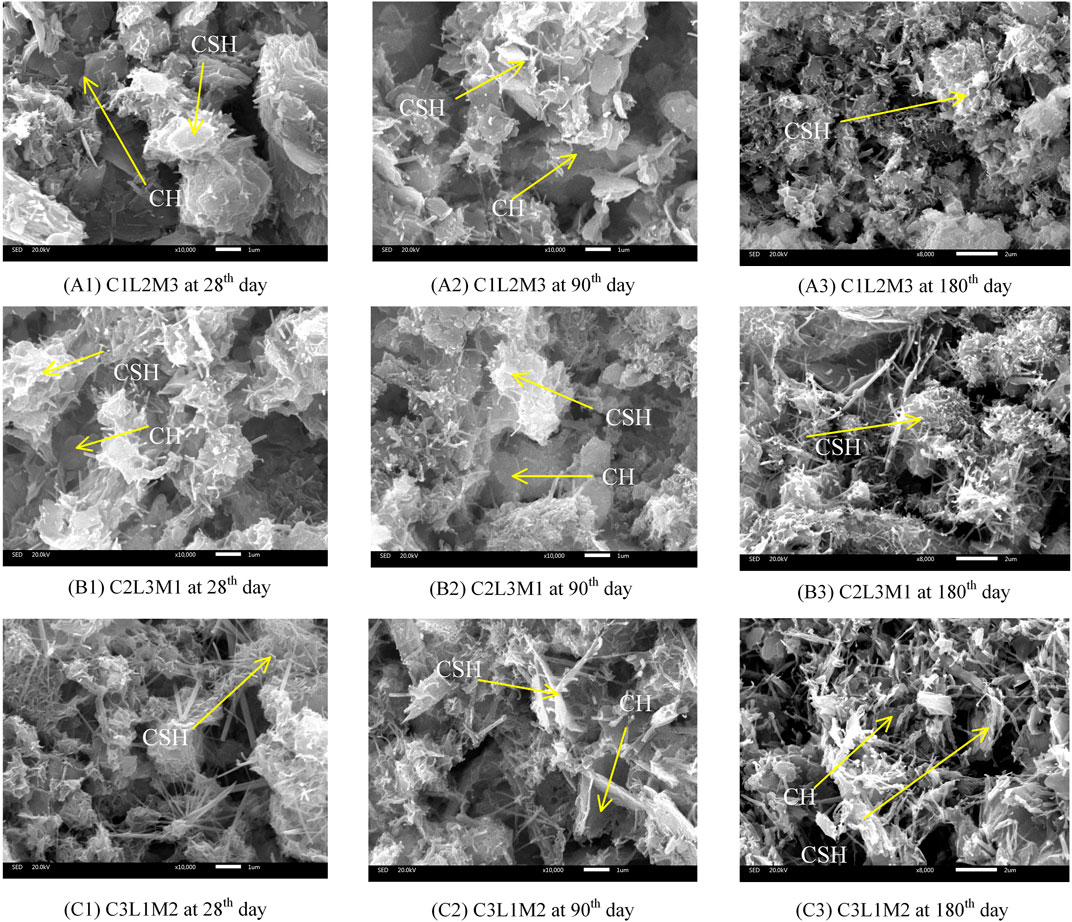
FIGURE 9. Microstructures of S/S sediments after different curing periods: (A1) C1L2M3 at the 28th day, (A2) C1L2M3 at the 90th day, (A3) C1L2M3 at the 180th day, (B1) C2L3M1 at the 28th day, (B2) C2L3M1 at the 90th day, (B3) C2L3M1 at the 180th day, (C1) C3L1M2 at the 28th day, (C2) C3L1M2 at the 90th day, and (C3) C3L1M2 at the 180th day.
With an increase in curing time, the S/S sediments were eroded gradually by acids released during organic matter decomposition inside the original sediments. As shown in Figures 9A1–A3 for C1L2M3, compared with the S/S sediment at the 28th day, the CSH was eroded at the 90th day while more CH was exposed from the cover of CSH; by the 180th day, the CSH structure was damaged and broken while the CH was invisible. As shown in Figures 9B1–B3 for C2L3M1, there were fewer CSH fibers and the CH bulk structures were exposed at the 90th day, whereas the CSH fibers were damaged and the CH bulk structures were invisible at the 180th day. As shown in Figures 9C1–C3 for C3L1M2, the CSH fibers were eroded and the CH bulk structures were exposed at the 90th day, but the CSH fibers were damaged and the CH bulk structures were further exposed at the 180th day.
Based on the microstructure analysis above and as shown in Figure 6F, the sediment aggregates are covered by a CSH shell and some of the CH bulk structures are separated from the sediment aggregates because of the existence of the CSH shell. Acids are released from organic matter inside the sediment aggregates, so the CSH fibers are much closer to the acids than the CH bulk structures. Therefore, the CSH fibers are eroded prior to the CH bulk structures; this is why the CH bulk structures were exposed first and then diminished, as shown in Figures 9A1–A3,B1–B3. Because fewer CH bulk structures are produced in C3L1M2, and most of those CH bulk structures are covered by more CSH fiber structures, the CH bulk structures were exposed gradually even at the 180th day, as shown in Figures 9C1–C3.
Clay particles are distributed randomly in original sediments before mixing with solidification agents, with organic matter absorbed on the surface of them (Zentar et al., 2009), as shown in Figure 10A. Based on the above analysis, a three-layer structure is generated gradually in the mixing and solidification process of S/S sediments, as shown in Figure 10B: 1) by ion exchanging and granulation reactions, clay particles are assembled into aggregates with a size of about 10 µm (Figure 6F) to make the inner core of the three-layer structure; 2) meanwhile, solidification products such as CSH grow on the surface of the aggregates and encase them; with the development of the solidification reactions, the CSH structures become thicker and form the shell of the inner core; and 3) at the same time, other solidification products, such as CH, are produced in the pores outside the CSH shell. The three-layer structure of S/S sediments can be confirmed by the SEM images provided by Pan et al. (2020), even though they did not specify the three-layer structure explicitly.
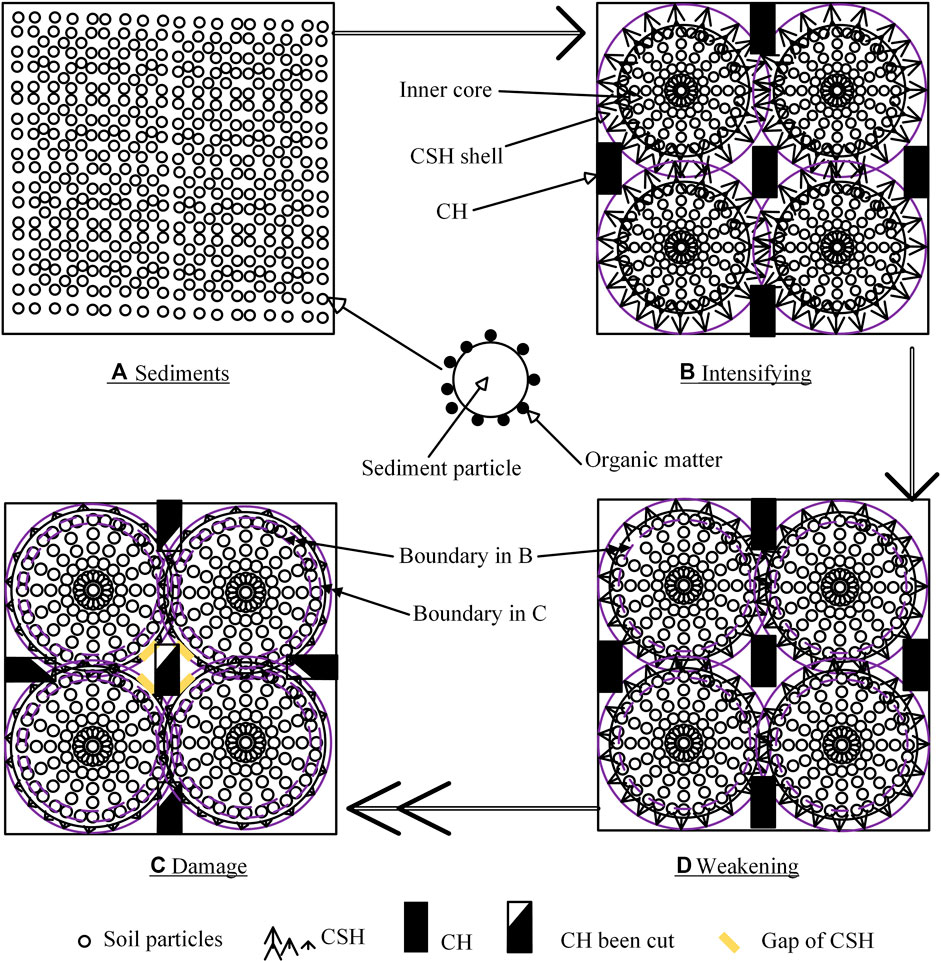
FIGURE 10. Microstructure evolution of S/S sediments: (A) sediments, (B) intensifying, (C) weakening, and (D) damage.
Generation of the three-layer structure produces a stable structure and supplies strength under load, which is called “intensifying” through solidification in S/S sediments, as shown in Figure 10B. Although organic matter is adsorbed on the surface of the clay particles, it is also embedded inside the CSH shell and separated from the CH structures. Therefore, the inner part of the CSH shell close to the sediment particles is decomposed by the organic matter prior to the CH, and the CSH structure gradually becomes thinner, which is called “weakening” by organic matter, as shown in Figure 10C.
The CSH shell will grow thicker by solidification intensifying, and it will degrade and become thinner by organic matter weakening. Therefore, the thickness of the CSH shell will be in a dynamic-balance status under the influence of solidification intensifying and organic matter weakening: 1) when solidification intensifying finally prevails, the CSH shell will keep growing until the solidification reactions are accomplished, and 2) when organic matter weakening finally prevails, the CSH shell will degrade gradually until the organic matter runs out, as shown in Figure 10D. Once the CSH shell is damaged, organic matter inside the sediment aggregates will be released out of the CSH shell and erode the CH outside. The microstructures of the S/S sediments will then be weakened and the strength will be decreased much more rapidly, as shown in Figure 3, because CH is much more sensitive to acids than CSH.
This can be verified by Saride et al. (2013), because they have captured the UCS development of S/S sediments: 1) for those S/S sediments solidified only by cement, the UCS increased until the 28th day and then decreased until the 56th day, whereas 2) for those S/S sediments solidified only by lime, the UCS increased sharply until the 28th day and then remained stable with very little increase. Because cement solidifies much faster than lime, the CSH shell of the S/S sediments solidified by cement was damaged by organic matter from the 28th day, whereas damage to the S/S sediments solidified by lime was compensated for by the long-term solidification of lime. Furthermore, because of this, cement, lime, and metakaolin were comprehensively applied as solidification additives in this study, for better solidification effects.
`As shown in Figure 3, the strength of S/S sediments without organic matter consistently increased by solidification intensifying, and the strength curve can be partitioned into three stages, as shown in Figure 11: 1) in the initial stage, the solidification reactions are very drastic, and the strength increase is very big until Point 1; 2) in the second stage, as the solidification reactions contributing the early strength are gradually completed, the rate of strength increase slows down to some extent until Point 2; and 3) in the third stage, when most of the solidification reactions have been accomplished except those contributing the long-term strength, the strength increase rate further slows, and the strength finally tends to be stable. Correspondingly, based the above analysis, organic matter weakening can also be partitioned into three stages, as shown in Figure 11 and as follows.
1) In Stage 1, the strength of the S/S sediments is decreased sharply by organic matter weakening, as shown in Figures 3, 11. As a result, the strength loss, i.e., the difference between solidification intensifying and actual strength development, becomes bigger until Point 1. The increasing rate of strength in the first stage is reduced by organic matter weakening to be almost the same as that in the second stage, as shown in Figures 3, 11. In this stage, sufficient acids released from the organic matter remain inside the S/S sediments, and a good alkaline environment is maintained in this stage as a result of the vigorous solidification reactions. FA and HA are both decreased by neutralization consumption, as shown in Figures 4B,C, 11. In addition, the Ca2+ ion concentration is decreased owing to consumption by acids, as shown in Figures 5B, 11.
2) In Stage 2, the strength loss of the S/S sediments remains stable until Point 2, as show in Figures 3, 11, indicating that no more strength loss is produced in this stage. In this stage, the alkaline environment inside the CSH shell becomes worse because of the consumption of OH− ions by acids in Stage 1. FA decreases in Stage 2 because it is being continuously consumed by neutralization reactions, whereas HA increases as a result of organic matter release, as shown in Figures 4B,C, 11. Accordingly, it can be concluded that, in the lower alkaline environment, the kind of acid that is more easily involved in the neutralization reactions is FA, rather than HA. Furthermore, the FA decrease rate in Stage 2 is higher than that in Stage 1, as shown in Figures 4B,C, 11, because the alkaline environment is lower in Stage 2. Moreover, the Ca2+ ion concentration increases in this stage because of compensation by the solidification reactions when less HA is consumed, as shown in Figures 5B, 11. This confirms that HA is much stronger in chemical affinity with Ca2+ ions than FA.
3) In Stage 3, the actual strength drops sharply in a comparatively short period of time to be even less than the initial strength, and the strength loss increases sharply, as shown in Figures 3, 11. At the same time, the HA content decreases sharply and the FA content increases gradually. As indicated in the above analysis, the CSH shell encasing the sediment aggregate core has been damaged at around Point 2 at the beginning of Stage 3. In this case, the inner side and outer side of the CSH shell are connected, and the acids and OH− ions from CH can flow freely. As a result, an alkaline environment for solidification will be instantaneously promoted. This confirms that the kind of acid that is more easily involved in neutralization reactions in a higher alkaline environment is HA, rather than FA. Consequently, HA is consumed rapidly by neutralization reactions, whereas the FA content is gradually compensated by organic matter release. Moreover, the Ca2+ ion concentration decreases sharply in this stage, as shown in Figures 5B, 11, because more HA is consumed and the solidification reactions are weaker.
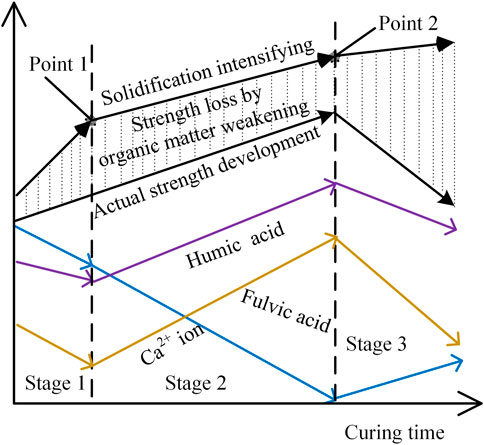
FIGURE 11. Development of strength, acids, and Ca2+ ion concentration.
Wang et al. (2013) and Zentar et al. (2012) have solidified marine sediments with TOCs of 6.27% by cement, lime, and/or fly ash, and they found that the UCSs of some S/S sediments increased very slowly from the 14th day to the 90th day; some even decreased. These strength developments must be the result of organic matter erosions but are not completely the same as those in this study because of differences in the additives and curing times. Those authors noticed and reported these phenomena, and they proposed controlling methods but have not studied the mechanisms deeply. Saride et al. (2013) have captured similar strength developments to those in this study. The strength of S/S sediments solidified by cement started to decrease from the 28th day until the 56th day. They have also studied the pH values of those S/S sediments to reveal the mechanisms, and the development of the pH values was similar to those in this study. Their study has confirmed the correctness of the organic matter weakening described in this study, even though they have not measured more microindexes and cured the S/S sediments longer to deeply reveal the micromechanisms.
As analyzed above, the strength losses of the S/S sediments are biggest in Stage 3 when HA is primarily involved in the neutralization reactions and smallest in Stage 2 when FA is primarily involved in the neutralization reactions. Therefore, it is concluded that FA primarily erodes the CSH structure in the lower alkaline environment before damage to the CSH shell; FA is less sensitive to strength losses of the S/S sediments than HA, but it controls the occurrence of the break point of strength development (Point 2 in Figure 11) by controlling the damage to the CSH shell. FA controls the working status of HA, as analyzed above. HA primarily erodes the S/S sediments in the higher alkaline environment after damage to the CSH shell, consumes more OH− ions, and is more sensitive to strength losses, which can be proved by the Ca2+ ion concentration evolution, as shown in Figures 5B, 11, because the evolution of Ca2+ ions coincides closely with the HA content evolution, rather than with that of FA. Accordingly, changes in Ca2+ ion concentrations reflect the level of involvement of HA in neutralization reactions, as well as the level of strength losses.
UCS tests, measurements of organic environment and chemical environment, and SEM analysis were conducted on S/S sediments after different curing periods to evaluate the long-term internal erosion mechanism of organic matter on sediments solidified by cement, lime, and metakaolin. Based on the above analysis, the following conclusions are obtained.
(1) The microstructure of the S/S sediments is a three-layer structure composed of the following components: 1) the inner core, which is composed of sediment aggregates of about 10 μm in size; 2) a CSH shell that is produced by solidification reactions growing on the surface of the core and that encases the core; and 3) other solidification products such as CH that are submerged in the CSH shell.
(2) The dissipation process of organic matter and the induced damage process of the S/S sediments can be partitioned into three stages. In the first stage, HA/FA released from the organic matter undergo neutralization reactions with the solidification products inside the CSH shell. In the second stage, the neutralization reactions still take place inside the CSH shell but in a much less alkaline environment owing to the consumption of OH−1 ions by the acids. The CSH shell is finally damaged at the end of the second stage, and in the third stage, the acids flow out of the shell and react with the CH outside in a much more alkaline environment.
(3) FA primarily reacts with solidification products in the lower alkaline environment, whereas HA primarily reacts in the higher alkaline environment. FA controls the working status of HA: With a higher relative ratio of FA to HA, HA involvement in neutralization reactions will be restrained; otherwise, HA involvement will be promoted. In the first stage, therefore, both HA and FA are involved in neutralization reactions, and their contents both decrease. In the second stage, FA is consumed by neutralization reactions and HA is compensated sharply by organic matter decomposition, while the alkaline environment is much lower because of the consumption of OH−1 ions by the neutralization reactions. In the third stage, HA is consumed by neutralization reactions sharply through contact with CH in a much higher alkaline environment, whereas FA is compensated by organic matter decompositions.
(4) The strength of the S/S sediments is in a dynamic-balance status, being intensified by solidification reactions and weakened by organic matter. HA is much stronger in chemical affinity with Ca2+ ions than FA and is more sensitive to the strength losses of S/S sediments than FA. However, FA controls the occurrence of the strength development break point by controlling the damage to the CSH shell. In the first stage, the strength loss increases because of organic matter weakening by HA neutralizations, but the strength keeps increasing owing to the solidification intensifying. In the second stage, the strength loss tends to be stable because HA is not involved in the neutralization reactions, and the strength keeps increasing as a result of solidification intensifying. In the third stage, the strength loss increases sharply because of the CSH shell damage caused by FA and the involvement of HA in the neutralization reactions.
The original contributions presented in the study are included in the article/Supplementary Material, and further inquiries can be directed to the corresponding author.
HW contributed to the conception and design of this study and conducted some of the macro tests. DZ conducted some of the micro measurements and wrote the first draft of the manuscript. SW conducted some of the micro measurements. XJ performed the data analysis. KL conducted some of the macro tests. LR conducted some of the micro measurements. All authors contributed to manuscript revision, read, and approved the submitted version.
This research was financially supported by the National Natural Science Foundation of China (Grant Nos. 51709154 and 51974051) for the micro tests and the Research Foundation of Chongqing University of Science and Technology (Grant No. ckrc2022014) for the macro tests. The open access publication fees were funded by Chongqing University of Science and Technology.
The authors declare that the research was conducted in the absence of any commercial or financial relationships that could be construed as a potential conflict of interest.
All claims expressed in this article are solely those of the authors and do not necessarily represent those of their affiliated organizations, or those of the publisher, the editors, and the reviewers. Any product that may be evaluated in this article, or claim that may be made by its manufacturer, is not guaranteed or endorsed by the publisher.
The Supplementary Material for this article can be found online at: https://www.frontiersin.org/articles/10.3389/feart.2022.1047079/full#supplementary-material
Ahmed, A. (2015). Compressive strength and microstructure of soft clay soil stabilized with recycled bassanite. Appl. Clay Sci. 104, 27–35. doi:10.1016/j.clay.2014.11.031
Ahmed, A., and Issa, U. H. (2014). Stability of soft clay soil tabilized with recycled gypsum in a wet environment. Soils Found. 54, 405–416. doi:10.1016/j.sandf.2014.04.009
ASTM D4219-02 (2003). Standard test method for unconfined compressive strength index of chemical-grouted soils. United States: ASTM International.
Chen, P., Feng, B., Lin, Y., and Lin, C. (2019). Solidification and stabilization of sewage sludge and MSWI bottom ash for beneficial use as construction materials. J. Mat. Civ. Eng. 31, 1–9. doi:10.1061/(ASCE)MT.1943-5533.0002572
Chiu, C. F., Zhu, W., and Zhang, C. L. (2009). Yielding and shear behaviour of cement-treated dredged materials. Eng. Geol. 103, 1–12. doi:10.1016/j.enggeo.2008.07.007
Cui, S. L., Tao, Z. P., Zhang, Y., Su, H., and Jia, Y. (2022). Engineering properties and microcosmic mechanism of cement stabilized diatomite. Front. Earth Sci. 10, 971387. doi:10.3389/feart.2022.971387
Dsikowitzky, L., Crawford, S. E., Nordhaus, I., Lindner, F., Dwiyitno, Irianto, H. E., et al. (2020). Analysis and environmental risk assessment of priority and emerging organic pollutants in sediments from the tropical coastal megacity Jakarta, Indonesia. Reg. Stud. Mar. Sci. 34, 101021. In press. doi:10.1016/j.rsma.2019.101021
Du, Y. J., Wei, M. L., Reddy, K. R., Liu, Z. P., and Jin, F. (2014). Effect of acid rain pH on leaching behavior of cement stabilized lead-contaminated soil. J. Hazard. Mat. 271, 131–140. doi:10.1016/j.jhazmat.2014.02.002
Du, Y. J., Wei, M. L., Reddy, K. R., and Wu, H. L. (2016). Effect of carbonation on leachability, strength and microstructural characteristics of KMP binder stabilized Zn and Pb contaminated soils. Chemosphere 144, 1033–1042. doi:10.1016/j.chemosphere.2015.09.082
Dubois, V., Abriak, N. E., Zentar, R., and Ballivy, G. (2009). The use of marine sediments as a pavement base material. Waste Manag. 29, 774–782. doi:10.1016/j.wasman.2008.05.004
Frouz, J. (2018). Effects of soil macro- and mesofauna on litter decomposition and soil organic matter stabilization. Geoderma 332, 161–172. doi:10.1016/j.geoderma.2017.08.039
Hejabi, Á. T., and Belagali, S. L. (2009). Survey of trace metal contaminants in sediments of kabini river in the nanjangud industrial area, Mysore district. Nat. Environ. Pollut. Technol. 8, 49–52.
Kamali, S., Bernard, F., Abriak Nor, E., and Degrugilliers, P. (2008). Marine dredged sediments as new materials resource for road construction. Waste Manag. 28, 919–928. doi:10.1016/J.WASMAN.2007.03.027
Kamei, T., Ahmed, A., and Shibi, T. (2013). The use of recycled bassanite and coal ash to enhance the strength of very soft clay in dry and wet environmental conditions. Constr. Build. Mat. 38, 224–235. doi:10.1016/j.conbuildmat.2012.08.028
Li, J. S., Zhou, Y. F., Wang, Q. M., Xue, Q., and Poon, C. S. (2019). Development of a novel binder using lime and incinerated sewage sludge ash to stabilize and solidify contaminated marine sediments with high water content as a fill material. J. Mat. Civ. Eng. 31, 1–12. doi:10.1061/(ASCE)MT.1943-5533.0002913
Ma, Y., Dong, B., He, X., Shi, Y., Xu, M., He, X., et al. (2017). Quicklime-induced changes of soil properties: Implications for enhanced remediation of volatile chlorinated hydrocarbon contaminated soils via mechanical soil aeration. Chemosphere 173, 435–443. doi:10.1016/j.chemosphere.2017.01.067
National Agricultural Technology Extension Service Center (2006). Technical specification for soil analysis. 2nd ed. Beijing: China Agriculture Press. (in Chinese).
Pan, C., Xie, X., Gen, J., and Wang, W. (2020). Effect of stabilization/solidification on mechanical and phase characteristics of organic river silt by a stabilizer. Constr. Build. Mat. 236, 117538. In press. doi:10.1016/j.conbuildmat.2019.117538
Park, J., Son, Y., Noh, S., and Bong, T. (2016). The suitability evaluation of dredged soil from reservoirs as embankment material. J. Environ. Manage. 183, 443–452. doi:10.1016/j.jenvman.2016.08.063
Pu, S.-Y., Zhu, Z.-D., Song, W.-L., Wang, H.-R., and Wei, R.-J. (2019). Deformation properties of silt solidified with a new SEU-2 binder. Constr. Build. Mat. 220, 267–277. doi:10.1016/j.conbuildmat.2019.06.016
Rakshith, S., and Singh, D. N. (2017). Utilization of dredged sediments: Contemporary issues. J. Waterw. Port. Coast. Ocean. Eng. 143, 1–13. doi:10.1061/(ASCE)WW.1943-5460.0000376
Rügner, H., Schwientek, M., Milačič, R., Zuliani, T., Vidmar, J., Paunović, M., et al. (2019). Particle bound pollutants in rivers: Results from suspended sediment sampling in Globaqua River Basins. Sci. Total Environ. 647, 645–652. doi:10.1016/j.scitotenv.2018.08.027
Saride, S., Puppala, A. J., and Chikyala, S. R. (2013). Swell-shrink and strength behaviors of lime and cement stabilized expansive organic clays. Appl. Clay Sci. 85, 39–45. doi:10.1016/j.clay.2013.09.008
Shahbaz, M., Kuzyakov, Y., and Heitkamp, F. (2017). Decrease of soil organic matter stabilization with increasing inputs: Mechanisms and controls. Geoderma 304, 76–82. doi:10.1016/j.geoderma.2016.05.019
Sollars, C. J., and Perry, R. (1989). Cement-based stabilization of wastes: Practical and theoretical considerations. J. Inst. Environ. Manag., 125–134. doi:10.1111/j.1747-6593.1989.tb01500.x
Tadini, A. M., Nicolodelli, G., Senesi, G. S., Ishida, D. A., Montes, C. R., Lucas, Y., et al. (2018). Soil organic matter in podzol horizons of the Amazon region: Humification, recalcitrance, and dating. Sci. Total Environ. 613, 160–167. –614. doi:10.1016/j.scitotenv.2017.09.068
Tang, Y., Miyazaki, Y., and Tsuchida, T. (2003). “Utilization of cement treated soft dredgings with special working ship,” in Soft ground engineering in coastal areas (Taylor & Francis), 335–343. doi:10.1201/9781439833919.ch38
Tang, Y. X., Miyazaki, Y., and Tsuchida, T. (2001). Practices of reused dredgings by cement treatment. Soils Found. 41, 129–143. doi:10.3208/sandf.41.5_129
Wang, D., Abriak, N. E., and Zentar, R. (2013). Strength and deformation properties of Dunkirk marine sediments solidified with cement, lime and fly ash. Eng. Geol. 166, 90–99. doi:10.1016/j.enggeo.2013.09.007
Wang, D., Zentar, R., and Abriak, N. E. (2018). Durability and swelling of solidified/stabilized dredged marine soils with Class-F fly ash, cement, and lime. J. Mat. Civ. Eng. 30, 1–12. doi:10.1061/(ASCE)MT.1943-5533.0002187
Wang, H., Wu, S., Jing, X., Liu, K., and Ren, L. (2022). Strength and stiffness degradation mechanisms of stabilized/solidified sediments by freeze–thaw cycles. Front. Earth Sci. 10, 905482. doi:10.3389/feart.2022.905482
Wang, H., Wu, Z., Tan, Y., Cui, X., and Zuo, Q. (2019). Characteristics of the micro pore structures of stabilized/solidified sediments during freeze-thaw cycles. Constr. Build. Mat. 211, 1–22. doi:10.1016/J.CONBUILDMAT.2019.03.256
Wang, L., Tsang, D. C. W., and Poon, C. S. (2015). Green remediation and recycling of contaminated sediment by waste-incorporated stabilization/solidification. Chemosphere 122, 257–264. doi:10.1016/j.chemosphere.2014.11.071
Wu, J., Deng, Y., Zheng, X., Cui, Y., Zhao, Z., Chen, Y., et al. (2019). Hydraulic conductivity and strength of foamed cement-stabilized marine clay. Constr. Build. Mat. 222, 688–698. doi:10.1016/j.conbuildmat.2019.06.164
Wu, Y., Shi, K., Yu, J., Han, T., and Li, D. (2020). Research on strength degradation of soil solidified by steel slag powder and cement in seawater erosion. J. Mat. Civ. Eng. 32, 04020181. doi:10.1061/(asce)mt.1943-5533.0003205
Xia, S., Lin, R., Cui, X., and Shan, J. (2016). The application of orthogonal test method in the parameters optimization of PEMFC under steady working condition. Int. J. Hydrogen Energy 41, 11380–11390. doi:10.1016/j.ijhydene.2016.04.140
Zentar, R., Abriak, N. E., and Dubois, V. (2009). Effects of salts and organic matter on Atterberg limits of dredged marine sediments. Appl. Clay Sci. 42, 391–397. doi:10.1016/j.clay.2008.04.003
Zentar, R., Wang, D., Abriak, N. E., Benzerzour, M., and Chen, W. (2012). Utilization of siliceous-aluminous fly ash and cement for solidification of marine sediments. Constr. Build. Mat. 35, 856–863. doi:10.1016/j.conbuildmat.2012.04.024
Zhang, T., Yue, X., Deng, Y., Zhang, D., and Liu, S. (2014). Mechanical behaviour and micro-structure of cement-stabilised marine clay with a metakaolin agent. Constr. Build. Mat. 73, 51–57. doi:10.1016/j.conbuildmat.2014.09.041
S/S stabilized/solidified
HA humic acid
FA fulvic acid
CSH hydrated calcium silicate
CH calcium hydroxide
UCS unconfined compression strength
TOC total organic matter content
C concentration of ammonium ferrous sulfate solution in the measurement of TOC, in mol/L
M sample mass in the measurement of TOC, in g
V sample consumption in the measurement of TOC, in ml
V0 blank sample consumption in the measurement of TOC, in ml
W moisture content of sample, in %
m mass of the air-dried sample excluding the mass of pore water, in g
Keywords: stabilized/solidified sediments, organic matter, long-term internal erosion, dissipation process, damage process
Citation: Wang H, Zhang D, Wu S, Jing X, Liu K and Ren L (2023) Long-term internal erosion mechanism of organic matter in sediments solidified by cement, lime, and metakaolin. Front. Earth Sci. 10:1047079. doi: 10.3389/feart.2022.1047079
Received: 17 September 2022; Accepted: 28 October 2022;
Published: 12 January 2023.
Edited by:
Tianshou Ma, Southwest Petroleum University, ChinaReviewed by:
Xiulei Li, Chongqing Jiaotong University, ChinaCopyright © 2023 Wang, Zhang, Wu, Jing, Liu and Ren. This is an open-access article distributed under the terms of the Creative Commons Attribution License (CC BY). The use, distribution or reproduction in other forums is permitted, provided the original author(s) and the copyright owner(s) are credited and that the original publication in this journal is cited, in accordance with accepted academic practice. No use, distribution or reproduction is permitted which does not comply with these terms.
*Correspondence: Hongxing Wang, d2FuZ2hvbmd4aW5nbGloQDEyNi5jb20=
Disclaimer: All claims expressed in this article are solely those of the authors and do not necessarily represent those of their affiliated organizations, or those of the publisher, the editors and the reviewers. Any product that may be evaluated in this article or claim that may be made by its manufacturer is not guaranteed or endorsed by the publisher.
Research integrity at Frontiers
Learn more about the work of our research integrity team to safeguard the quality of each article we publish.