 Tong Jia
 Liqiang Zhang
 Cai Chen3
 Yiming Yan
- 1School of Geosciences, China University of Petroleum, Qingdao, China
- 2Key Laboratory of Deep Oil and Gas, China University of Petroleum, Qingdao, China
- 3Research Institute of Exploration and Development, PetroChina Tarim Oilfield Company, Korla, China
Mechanical compaction is an important diagenetic process in sandstone reservoirs. Particle breakage, which commonly occurs during mechanical compaction, plays a significant role in controlling the physical properties of the reservoir. However, existing numerical simulation methods have limitations in simulating mechanical compaction when considering particle breakage. In this study, a discrete element simulation method of mechanical compaction was proposed based on particle cutting, and the experimental results reported in the literature were used to calibrate the simulation parameters. Finally, this method was applied to the simulation of the mechanical compaction of sandstone to analyze the pore evolution process. The results show that the new simulation method has high computational efficiency and can reflect the process of particle breakage. The simulation results coincide well with the experimental results. In the simulated mechanical compacted process of coarse sandstone, particle breakage is strong in the high-stress stage with a vertical stress of 30 MPa–50 MPa. The porosity and mean radii of pores and throats decreased rapidly, and the number of pores and throats increased rapidly in the high-stress stage. When the vertical stress reached 50 MPa, compared to the simulation results without considering particle breakage, the porosity difference rate caused by particle breakage was 4.63%; the radius difference rates of pores and throats were 2.78% and 6.8%, and the number difference rates of pores and throats were 4.95% and 8.74%, respectively. In the process of mechanical compaction, the pore evolution of the reservoir is controlled by the filling of the pre-existing pore space by the fragments generated through particle breakage and the generation of microfractures. Additionally, the simulation method presented in this study can be applied to complex geological conditions and can be combined with other reservoir simulation methods. The simulation results can provide rich training samples for artificial intelligence and other emerging technologies.
1 Introduction
Diagenesis plays a significant role in controlling the porosity and permeability of sandstone reservoirs (Higgs et al., 2007; Morad et al., 2010; Bjørlykke, 2014). Mechanical compaction occurs throughout the entire diagenetic evolution of the sandstone reservoir. Simultaneously, particle breakage is common during compaction, which causes rapid changes in the particle surface area and accumulation structure, and is accompanied by a large number of microfractures, thereby affecting chemical diagenesis (Anders et al., 2014; Hooker et al., 2018; Qin et al., 2022). Changes in the particle packing structure affect the rate of pore reduction through mechanical compaction (Chuhan et al., 2002; Karner et al., 2003; Yan et al., 2021a). Simultaneously, the particle accumulation structure and microfractures jointly control the pore throat structure characteristics, thereby changing the reservoir permeability (Laubach and Ward, 2006; Zeng, 2010; Qin et al., 2022). Particle breakage commonly occurs during mechanical compaction, which affects the diagenesis and physical property evolution of reservoirs in different ways. Therefore, studying the particle breakage process can reveal the evolution process of the physical properties and reservoir formation mechanism of sandstone reservoirs.
Physical experiments and numerical simulations are typically used to study the processes of reservoir compaction and particle breakage. Physical experiments are the most direct and effective method. The influences of particle size, morphology, mineralogical characteristics, and sorting characteristics on particle breakage was analyzed using previous uniaxial compression physical experiments combined with experimental results such as the stress-strain curve, porosity ratio/porosity evolution characteristics, particle size distribution (PSD) curve, and optical microscope images. The main conclusions are summarized as follows: under the same stress conditions, particles with larger particle sizes, lower mechanical strengths, worse sorting, smaller roundness, and rougher surfaces are more severely broken (Hagerty et al., 1993; Lade et al., 1996; Mcdowell and Bolton, 1998; Nakata et al., 2001a, b; Chuhan et al., 2002; Mcdowell, 2002; Chester et al., 2004; Huang et al., 2013; Zheng and Tannant, 2016; De Bono and Mcdowell, 2018). Additionally, the new technologies combined with the experiment provides an effective way to study the particle breakage process. Acoustic emission (AE) technology can indirectly obtain the information of the internal damage by capturing acoustic signals generated in experimental samples (Zhang and Zhou, 2020; Niu and Zhou, 2021; Zhou and Zhang, 2021). AE technology can be used to quantitatively assess the degree of particle breakage (Mao et al., 2021; Feng et al., 2022). On the other hand, Digital Imaging Correlation (DIC) and computed tomography (CT) can obtain real-time images and reconstruct the internal structure of experimental samples (Zhou et al., 2018; Zhou et al., 2019; Xiao et al., 2021a; 2021b). These technologies can reproduce 3D dynamic evolution processes of particle breakage (Afshar et al., 2018; Cuesta Cano et al., 2021; Seo et al., 2021). However, considering the high economic cost and the complex and changeable composition of sandstone, it is not practical to carry out large-scale experiments with this technology.
In recent years, numerical simulation technology for sandstone diagenesis has developed rapidly and has garnered the attention of petroleum geologists. This technology mainly includes the discrete element method (Yan et al., 2021b), soft shell model, onion skin model (Mousavi and Bryant, 2013), Touchstone (English et al., 2017), quartet structure generation set algorithm (QSGSA) (Wu et al., 2022), etc. However, particle breakage is not well considered in the above diagenetic simulation techniques. In field of geotechnical and civil engineering, a variety of numerical simulation methods have been developed for the material damage. The simulation methods include Finite Element Method (FEM) (Turner et al., 2019; Zhou et al., 2021a) Extended Finite Element Method (XFEM) (Seyyedan et al., 2021; Zhou et al., 2021b), Peridynamics (PD) (Wang et al., 2016, 2018; Wan et al., 2020; Zhang et al., 2021), General Particle Dynamics (GPD) (Zhou et al., 2014), cluster method based on Discrete Element Method (DEM) (Cil and Alshibli, 2014; Sun et al., 2018; Jarrar et al., 2020) and particle replacement method based on DEM (De Bono and Mcdowell, 2016; Zheng and Tannant, 2019; Wang et al., 2021). FEM, XFEM, FD, GPD and cluster method can accurately simulate the breakage process and have a good application in the simulation of rock, single particle or a small number of particles. However, each simulation object of these methods contains multiple computational units, and the huge computational cost limits its application in the simulation of multiple particles (thousands of particles or more). For the breakage of multiple particles, the most commonly used simulation method is particle replacement method. In this method, the original particle is replaced by a group of small particles to achieve particle breakage. The computational units are consistent with particles. Particle replacement method has the advantage of high computational efficiency but cannot reflect the particle breakage process. However, the study of particle breakage in the diagenesis of sandstone reservoirs not only requires sufficient particles, but also needs to reflect the process of particle breakage.
Therefore, the main purpose of this study is to propose a new discrete element numerical simulation method that can not only conduct numerical simulations of the mechanical compaction process of sufficient particles, but also reflect the real process of particle breakage. This can be used to study the pore evolution during the diagenesis of sandstone. The structure of this paper is as follows: Section 2 introduces the flow of the numerical simulation method; Section 3 the accuracy and applicability of the method; Section 4 analyzes the application results in the simulation of mechanical compaction of sandstone; and Section 5 discusses the influence of particle breakage on the pore evolution process and the application prospect of simulation method.
2 Numerical simulation method
2.1 Particle breakage criterion
Particle breakage depends on the relationship between the stress of a particle and its breakage threshold, and breakage occurs when the former is greater than the latter. There are two kinds of criteria for calculating the stress on particles. One is based on the principal stress calculation, including the maximum principal stress (Eq. 1), average principal stress (Eq.2), and octahedral shear stress criteria (Eq. 3). The other is based on the maximum contact force and particle diameter, called maximum contact force stress criterion (Eq. 4) (Ben-Nun and Einav, 2010; Esnault and Roux, 2013; De Bono and Mcdowell, 2016; Ciantia et al., 2019). De Bono and Mcdowell (2016) compared the DEM simulation results with different breakage criteria and found that the simulation results using the maximum contact force stress criterion fit the physical experimental results best. Therefore, the maximum contact force stress criterion was adopted in this study. The particle breakage occurs when the maximum contact force stress is greater than the breakage threshold. The breakage threshold of particle is related to the particle size. If the breakage threshold of the reference particle (diameter = D0) is known, the breakage threshold of any particle size can be calculated using Eq. 5.
where σ is the stress of the particle; σ1, σ2 and σ3 are the maximum, minimum and intermediate principal stresses, respectively; Fmax is the maximum contact force of the particle; D is the particle diameter; σlimit and σlimit0 are the breakage thresholds of the particles with diameters D and D0, respectively; and m is the Weibull modulus. Notably, the particle diameters in this study were equivalent to sphere diameters.
2.2 Realization of particle breakage
Particle breakage is a process wherein the microfracture generated at the contact point of the particle extends to the interior and eventually penetrates the particle (Yashima et al., 1987; Cil and Alshibli, 2014; Ciantia et al., 2015). In this study, we proposed a particle-breakage method based on particle cutting. When the maximum contact force stress reaches the breakage threshold of the particle, a random cutting plane is generated through the particle at the maximum contact force point to realize the particle breakage (Figure 1).
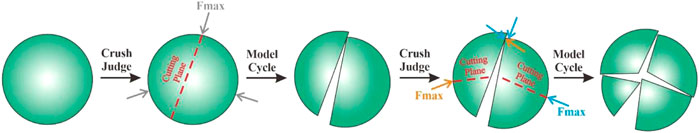
FIGURE 1. Schematic diagram of the particle breakage process based on particle cutting.
2.3 Simulation settings
To verify the accuracy of the simulation method, the simulation device and particle samples were set up according to the experimental conditions of Zheng and Tannant (2016). The experiment involved the uniaxial compaction of quartz sand in a cylindrical rigid cup. The particles had high sphericity, and the range of particle diameter was 0.6 mm–0.71 mm. In the numerical simulation, to improve the calculation efficiency, the simulation device and height of the sample were equally reduced. The simulation device comprised a rigid cylinder with a bottom diameter of 10 mm and height of 7 mm, and a square rigid loading plate with a side length of 10 mm. Spherical particles with a uniform distribution in the diameter range of 0.6 mm–0.71 mm were generated in the cylinder, and the particles naturally accumulated under the action of gravity to form simulated samples with a height of approximately 5 mm (Figure 2).
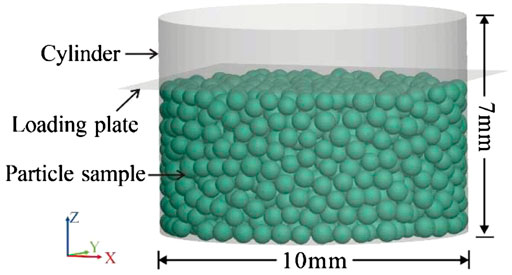
FIGURE 2. Simulation device and particle sample.
In the DEM simulation, the contact model and mesoscopic parameters controlled the mechanical behavior and interaction process of the simulated object. In terms of the contact model, the contact moment of the linear contact model is zero and the contact force is decomposed into linear component and damping component. The linear component provides linear elastic, frictional behavior, while the dashpot component provides viscous behavior (Itasca Consulting Group Inc., 2018). The linear contact model has been proved to be consistent with the mechanical behavior of granular materials (Cil and Alshibli, 2014; Zheng and Tannant, 2019; Yan et al., 2021). For the mesoscopic parameters in the linear contact model, the results calibrated by Zheng and Tannant (2019) based on their experiments (Zheng and Tannant, 2016) were referred to and modified in this study (Table 1).
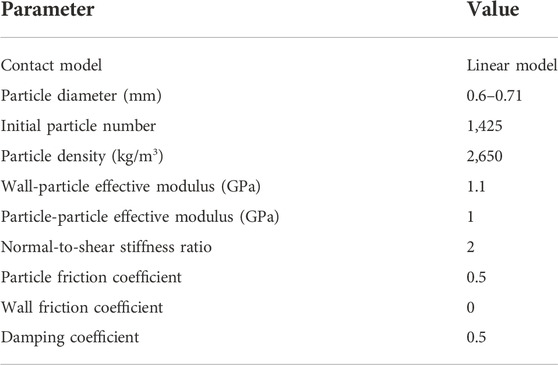
TABLE 1. DEM simulation parameters.
2.4 Numerical simulation workflow
In this study, the particle flow code was used to conduct numerical simulations on the PFC6.0 discrete element numerical simulation platform developed by Itasca (Itasca Consulting Group Inc., 2018). Based on the setting of the simulation parameters, the particles in the device naturally accumulated to an equilibrium state under the action of gravity, and the loading plate moved downward at a uniform speed of 0.05 m/s. The vertical stress was the average value of the stress between the loading plate and the bottom plate in the Z-axis direction. The model with a vertical stress of 0.1 Mpa was used as the initial compaction model. Subsequently, the breakage threshold of the reference particle (σlimit0) and Weibull modulus (m) were set. The model traversed each particle at 100 steps per cycle to calculate the maximum contact force stress σ and breakage threshold σlimit. If σ > σlimit, the particle was cut and broken. This process was repeated until the vertical stress reached the target condition required by the simulation (Figure 3).
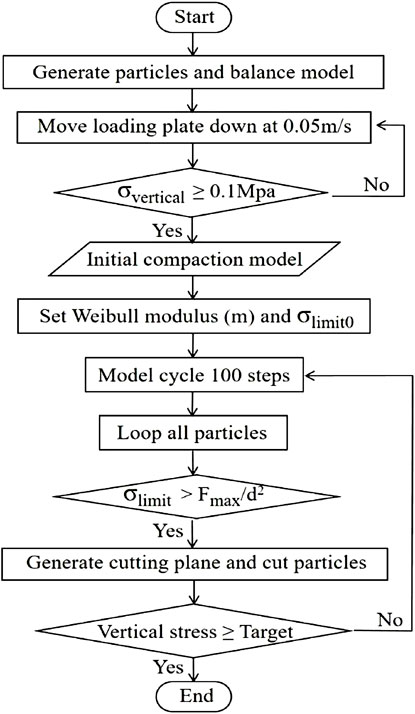
FIGURE 3. DEM simulation workflow chart.
3 The accuracy and applicability of numerical simulation method
3.1 Calibration of σlimit0 and weibull modulus (m)
The breakage threshold of the reference particle (with a diameter of 0.6 mm) (σlimit0) and the Weibull modulus (m) determine the particle breakage process in the numerical simulation. The values of σlimit0 and m for different particle breakage criteria and breakage realization methods are often inconsistent. The control variable method was used to establish two groups of DEM simulations. In group A, m was set as 3 and σlimit0 values were set as 50 MPa, 52.5 MPa, 55 MPa, 57.5 MPa, and 60 MPa, respectively. In group B, σlimit0 was set as 55 MPa, and m values were set as 1, 2, 3, 4 and 5, respectively. A uniaxial vertical compression simulation was conducted based on the aforementioned DEM simulation process. The target vertical stress was set as 40 MPa. The simulation results of different σlimit0 and m were compared and combined with the experimental results (Zheng and Tannant, 2016) to obtain the values of σlimit0 and m that are suitable for the particle breakage criterion and particle breakage realization method used in this study.
3.1.1 Effects of σlimit0 and weibull modulus (m) on simulation results
With an increase in the vertical stress, particle breakage commenced and gradually intensified, resulting in an increase in the number of particles. In the two groups of simulations, the particle breakage began in the vertical stress range of 10 MPa–15 MPa. Therefore, the number of particles was counted every 5 MPa from a vertical stress of 15 MPa to analyze the particle number evolution. Under a constant m value, the lower the σlimit0 value, the higher is the number of particles. When σlimit0 = 50 MPa, the number of particles increased the fastest in the vertical stress range of 25 MPa–30 MPa, and when σlimit0 = 52.5 and 55 MPa, the number of particles increased the fastest in the vertical stress range of 30 MPa–35 MPa. When σlimit0 = 57.5 and 60 MPa, the number of particles increased the fastest in the vertical stress range of 35 MPa–40 MPa. Therefore, the lower the σlimit0 value, the lower is the vertical stress corresponding to the rapid particle increase stage (Figure 4A). Additionally, under a constant σlimit0 value, with increasing m values, the increase in the number of particles is faster and larger (Figure 4B).
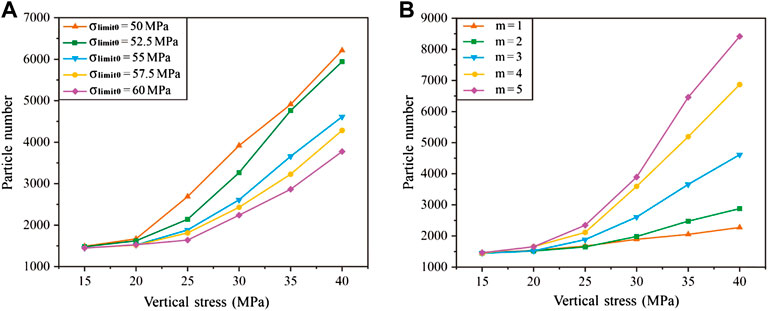
FIGURE 4. Evolution characteristics of particle number: (A) Group A and (B) Group B.
During the loading process, some of the particles did not break, while the remaining particles underwent one or more breakage events and formed multiple fragments, which jointly determined the particle number. The percentages of unbroken and broken particles at different loading stages (vertical stresses of 20 MPa, 30 MPa, and 40 MPa) were calculated. Both simulation results showed that the content of broken particles increased rapidly with increasing vertical stress. Under a constant m value, the proportion of broken particles increased with increasing σlimit0. Among the particles generated by breakage, the proportion of particles generated by different breakage times was similar (Figure 5A). Under a constant σlimit0 value, the proportion of broken particles increased with increasing m values. Moreover, with an increase in the m value, the particle content generated by high breakage times increased rapidly; namely, with increasing m values, the particle is more likely to undergo multiple breakage events (Figure 5B).
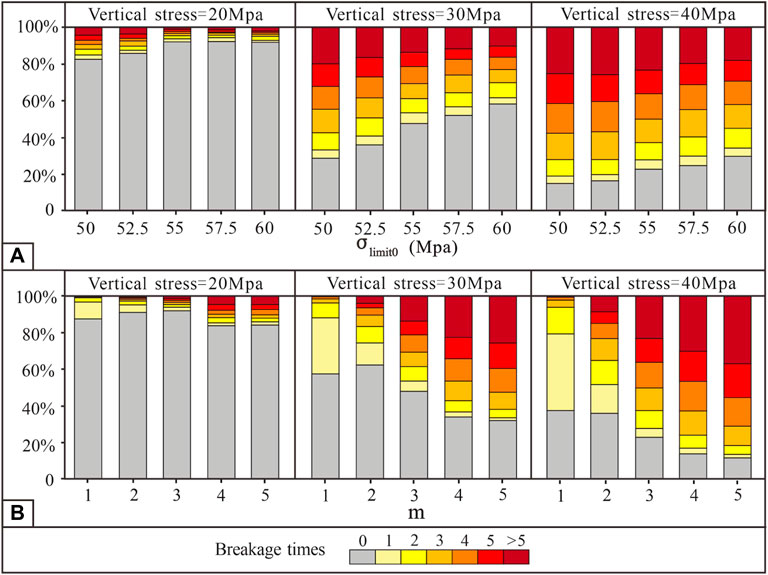
FIGURE 5. The percentage of particles formed by different breakage times: (A) Group A and (B) Group B.
Conversely, the cumulative PSD curves of different compaction stages (vertical stresses of 20 MPa, 30 MPa, and 40 MPa) were drawn to analyze the changes in PSD characteristics caused by particle breakage. The PSD curve was drawn to diameter of 0.6 mm and the cumulative percentage of the diameter of 0.71 mm are omitted (the value is 100%) for data display. Therefore, the description of this part did not include a particle diameter of 0.71 mm. Under the condition of constant m, the larger the σlimit0 value, the lower was the particle content at each particle size interval, and the PSD curves show similar change characteristics. The particle content in each particle size interval gradually increased with increasing vertical stress, and the higher the vertical stress, the faster was the rate of increase (Figure 6). Under a constant σlimit0 value, the larger the m value, the greater was the particle content difference at different particle size ranges, which was manifested as the difference between the content of particles with large sizes and that of particles with small sizes. The particle content at each particle size interval gradually increased, and the above differences became more evident with increase of the vertical stress (Figure 7).
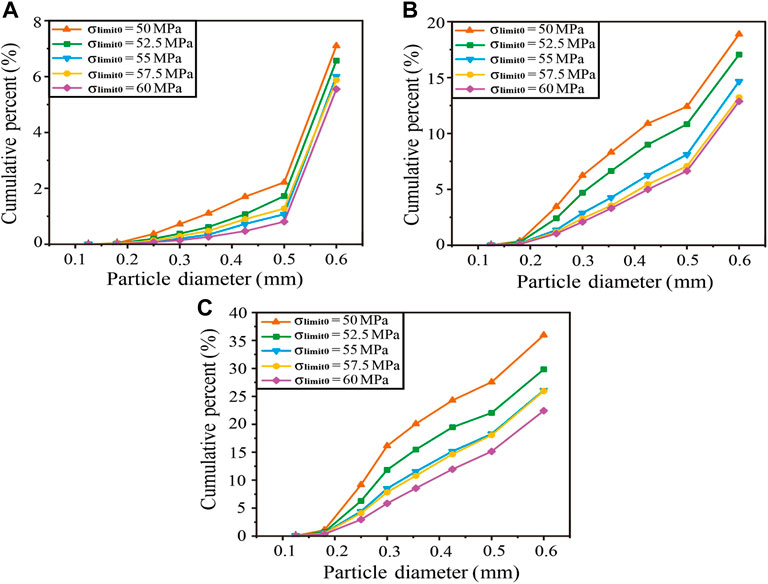
FIGURE 6. PSD of Group A (A) Vertical stress = 20 MPa, (B) Vertical stress = 30 MPa, and (C) Vertical stress = 40 MPa.
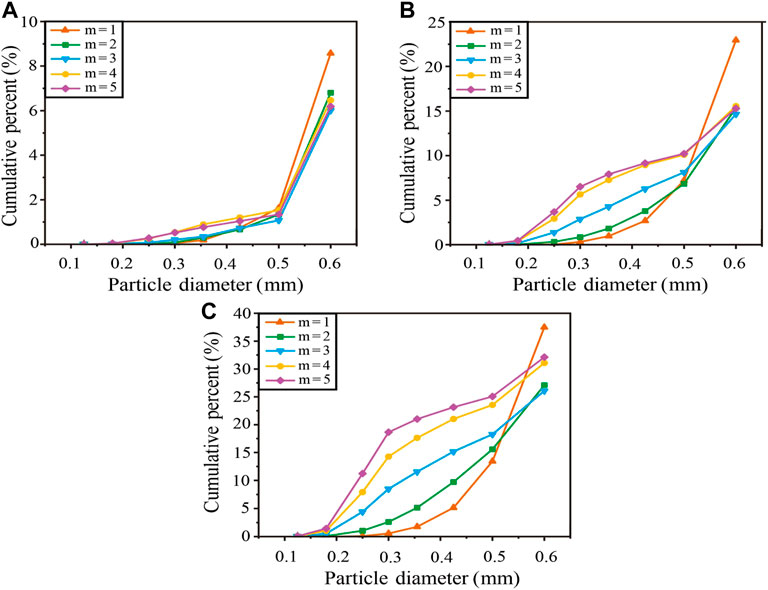
FIGURE 7. PSD of Group B: (A) Vertical stress = 20 MPa, (B) Vertical stress = 30 MPa, and (C) Vertical stress = 40 MPa.
Therefore, in the uniaxial vertical compression simulation, both σlimit0 and m affect the evolution of the particle number. σlimit0 affects the rapid increase stage of the particle number and m affects the breakage times, and they jointly control the evolution of the PSD.
3.1.2 Calibration results of σlimit0 and m
By comparing the PSD curves of the experiment, the simulation results in the loading process (vertical stresses of 20 MPa, 30 MPa, and 40 MPa) coincided well with the physical experimental results under the conditions of σlimit0 = 55 MPa and m = 3 (Figure 8). The results showed that the simulation method based on particle cutting was accurate. Therefore, the breakage threshold of a particle with an equivalent sphere diameter D can be calculated using Eq. 6.
where σlimit is the particle breakage threshold (MPa) and D is the particle equivalent sphere diameter (mm).
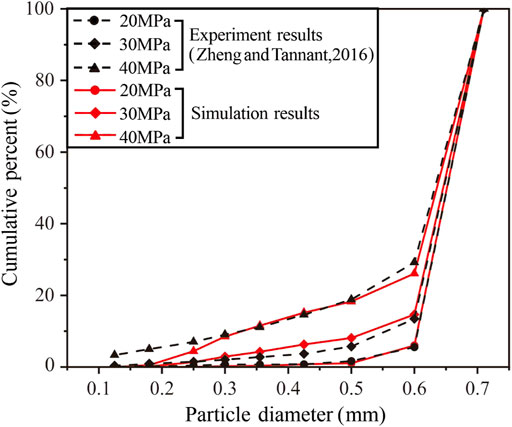
FIGURE 8. Comparison of the PSD curves between the simulation and experiment.
3.2 Applicability of the simulation method in the study of compaction
In the study of sandstone reservoir compaction, it is essential to analyze the evolution process of porosity (pore volume/total volume of sample × 100) under stress. Additionally, in the study of granular material mechanics, the stress-void ratio (pore volume/particle volume) or stress-strain characteristics are used to evaluate the experimental results. During the simulation, the displacement of the loading plate was recorded and the porosity of the sample was obtained by calculating the percentage of the volume of particles in the total volume (Eq. 7). Combined with the results of the stress-pore ratio in physical experiments, the pore ratio was converted into the porosity (Eq. 8). A comparison between the numerical simulation and experimental results shows that, although there were some differences in the initial porosity, the porosity evolution has the same change characteristics during the process of stress increase, indicating that the simulation result of this method was ideal for the process of sandstone compaction and porosity reduction (Figure 9).
where P1 is the porosity of the numerically simulated sample; VP is the total volume of the particles; S is the bottom area of the simulation device; H0 is the height of the loading plate when the vertical stress is 0.1 MPa; ▵H is the downward displacement of the loading plate; P2 is the porosity of the experimental sample; and e is the pore ratio of the experimental sample.
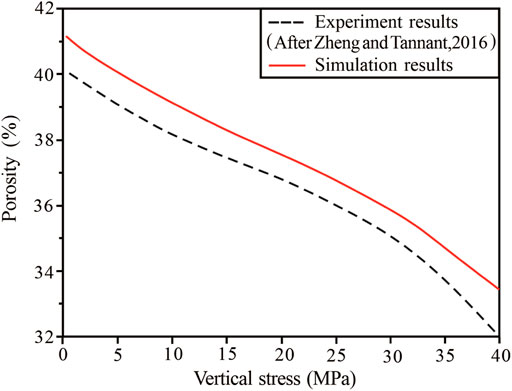
FIGURE 9. Comparison of porosity evolution between the simulation and experiment.
In sandstone reservoirs, porosity determines the space for hydrocarbon storage. The pore structure controls the flow path and determines the charge, migration and accumulation of oil and gas, which is another key index for reservoir pore evaluation. (Nelson, 2009; Shanley and Cluff, 2015; Qiao et al., 2020). In addition to studying the porosity, pore structure is also the focus of sandstone reservoir research. As mentioned in the introduction, particle replacement method is commonly used to simulate particle breakage, but cannot reflect the particle breakage process, and simulating particles with irregular morphology is challenging (Figure 10A). The particle morphology and microfracture formed by particle breakage have a significant effect on the pore structure, so the simulation results of particle replacement method for pore structure are not accurate. The particle cutting method proposed in this study is an improved attempt based on the particle replacement method. The method reflects the process of particle breakage, and the fragments after particle breakage are real and can simulate particle breakage of any shape (Figure 10B). Therefore, this method is suitable for studying the evolution of the pore structures during compaction.
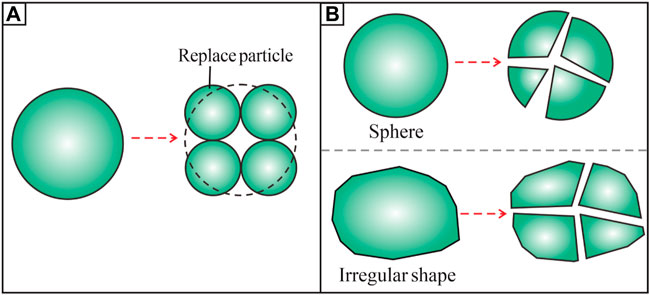
FIGURE 10. Comparison of DEM simulation methods for particle breakage: (A) particle replacement method and (B) particle cutting method.
4 Application results of the simulation method
4.1 Simulation conditions
Based on the calibration of simulation parameters and the analyses of accuracy and applicability, the numerical simulation method proposed in this study is applied to the study of mechanical compaction of sandstone. Coarse sand particles with irregular shapes were generated in the cuboid container as simulation samples (Figure 11), and the initial number of particles was 1,580. The particle shape is the real shape of quartz sand particles obtained by CT, and the particle diameter approximately shows a Gaussian distribution in the range of 0.5 mm–1 mm (Figure 12). The simulated parameters are those calibrated in Sections 2, 3. The simulation is carried out based on the flow shown in Figure 3, and the simulated target stress is set to 50 Mpa.
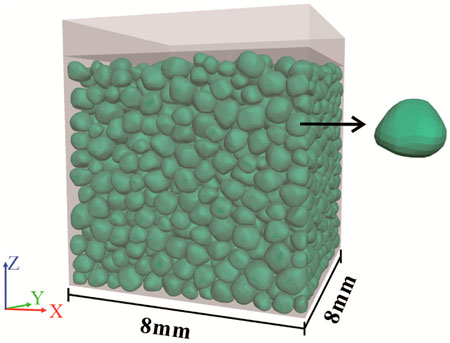
FIGURE 11. Simulation device and sample for mechanical compaction simulation.
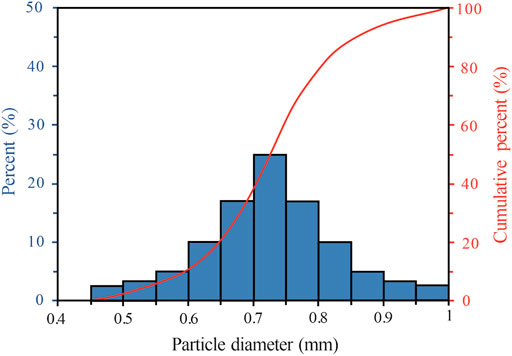
FIGURE 12. Initial particle diameter distribution of the sample.
4.2 Particle breakage characteristics
The simulation results were extracted at intervals of 5 or 10 MPa (Figure 13). The particle breakage characteristics of the mechanical compaction process were analyzed in terms of the particle number, breakage times, PSD curve, and relative breakage.
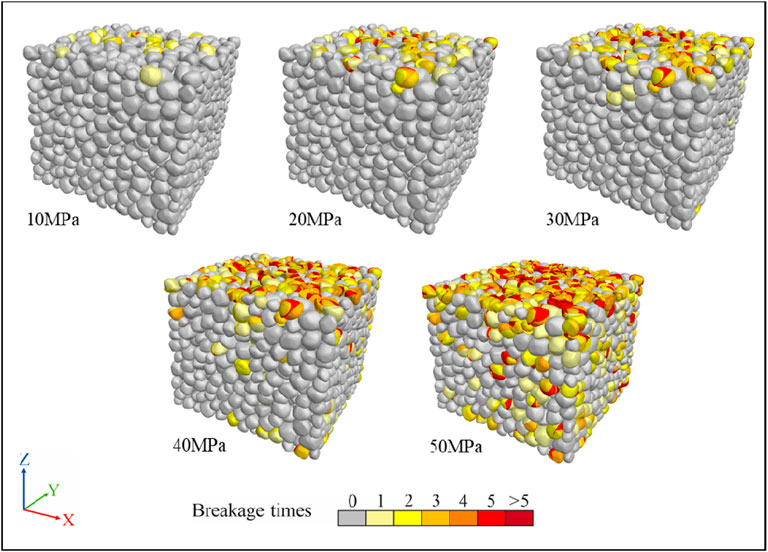
FIGURE 13. Simulation effect of the coarse sand sample.
During the mechanical compaction of coarse sand, particles began to break when the vertical stress was approximately 5 MPa. In the low-stress stage (vertical stress of 5 MPa–30 MPa), the number of broken particles increased slowly, whereas in the high-stress stage (vertical stress of 30 MPa–50 MPa), the number of broken particles increased rapidly with increasing vertical stress, and the rate of increase gradually increased (Figures 13, 14). Additionally, among the broken particles, the proportion of the number of particles produced at different times of breakage was similar and did not change significantly with increasing vertical stress (Figure 14). In terms of the evolution of the PSD curve, compared to the original PSD curve, in the low stress stage, the PSD curve did not change significantly. However, in the high-stress stage, the content of small-sized particles increased rapidly and the sorting of the samples gradually worsened (Figure 15).
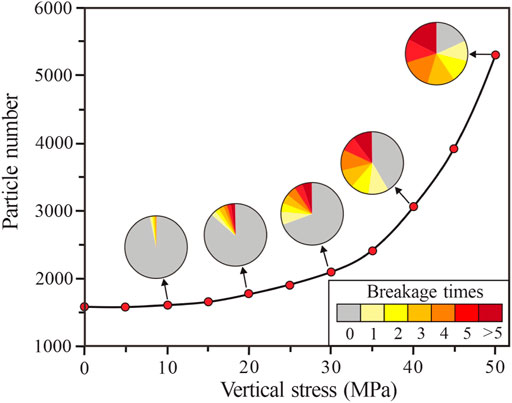
FIGURE 14. Evolution of the particle number and breakage times during the compaction of coarse sand.
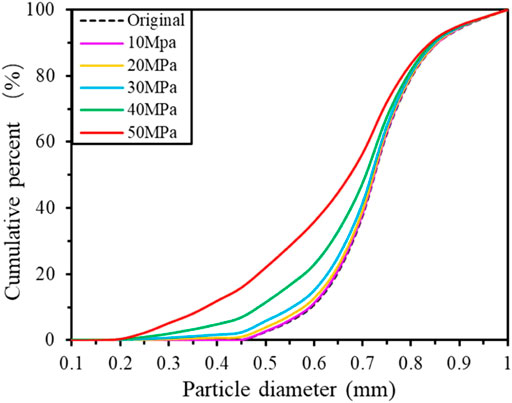
FIGURE 15. PSD evolution during the compaction of coarse sand.
Based on the PSD curve, the relative breakage (Br) was calculated to evaluate the degree of particle breakage. Br is the ratio of the total breakage (Bt) to the breakage potential (Bp) (Hardin, 1985). Bt is the area enclosed by the initial PSD curve and loaded PSD curve, namely, the area of the shaded part in Figure 16A. Bp is the area between the vertical line with the minimum particle size value (0.15 mm in this study) and the initial PSD curve, namely, the area filled by the grid line in Figure 16A. With increasing vertical stress, the relative breakage showed a near-exponential growth, wherein it slowly increased at first and rapidly increased thereafter; namely, the rate of increase of relative breakage was obviously accelerated at the high-stress stage.
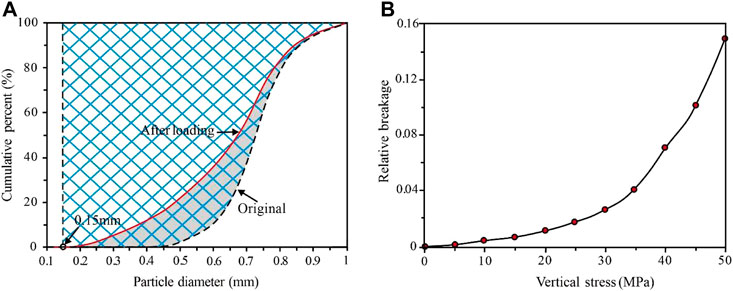
FIGURE 16. (A) Schematic diagram of the calculation method of relative breakage and (B) the evolution characteristics of relative breakage.
4.3 Pore evolution characteristics
In the mechanical compaction simulation, a sample with a vertical stress of 0.1 MPa was used as the initial sample, and the corresponding initial porosity was 37.1%. The displacement of the loading plate was monitored in real time, and the porosity of the sample was calculated (Eq. 7). With increasing vertical stress, the evolution of porosity can be divided into three stages. The first stage (vertical stress below 8 MPa) involved particle rolling and rearrangement. At this stage, the porosity of the samples decreased exponentially and the rate of porosity reduction changed from fast to slow. At the beginning of this stage, the rate of porosity reduction was highest during the entire compaction process. The second stage (vertical stress of 8 MPa–30 MPa) was the weak particle breakage stage. At this stage, the porosity decreased linearly, and the rate of porosity decrease was the lowest during the entire compaction process. The third stage (vertical stress of 30 MPa–50 MPa) was the strong particle breakage stage. In this stage, the porosity also showed a near-linear decreasing trend, but the slope was larger than that in the second stage; namely, the porosity decreased at a faster rate (Figure 17).
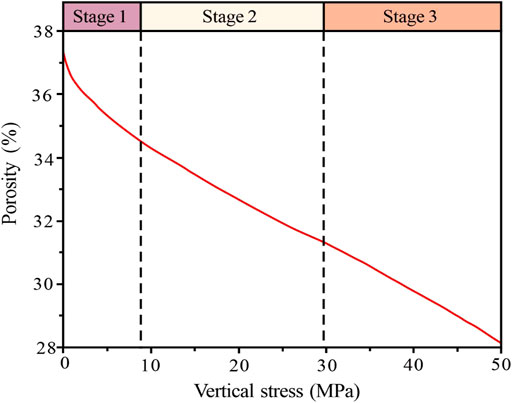
FIGURE 17. Porosity evolution characteristics of coarse sand.
Conversely, the model was saved and exported at an interval of 5 MPa in the DEM simulation process, and the Avizo 9.0 software was used to analyze the pore structure evolution characteristics of the samples during mechanical compaction. In terms of the pore evolution, when the vertical stress was lower than 30 MPa, the pore number of the sample did not change considerably (Figure 18A), whereas when the vertical stress was 30 MPa–50 MPa, the pore number showed an upward trend. Simultaneously, with increasing vertical stress, the mean pore radius of the sample showed a three-stage variation trend similar to that of porosity; namely, a rapid decrease, slow decrease, and rapid decrease (Figure 18B). In terms of the throat evolution, with increasing vertical stress, the number of throat first decreased and then increased (Figure 18A). The mean throat radius gradually decreased, and its reduction rate gradually accelerated (Figure 18B).
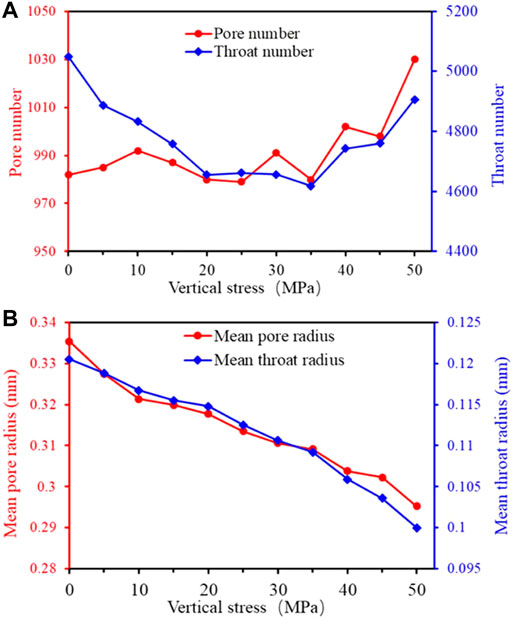
FIGURE 18. Evolution of pore structure characteristics of coarse sand: (A) number of pores and throats and (B) mean radii of the pore and throat.
5 Discussion
5.1 Comparison with the simulation without particle breakage
A control simulation was conducted under the same conditions but without particle breakage, and compared the difference rate of the simulation results with and without particle breakage (ratio of the difference between the two results and the simulation results with particle breakage).
In terms of the porosity evolution, with increasing vertical stress, the simulation results without particle breakage showed a two-stage evolution feature. When the vertical stress was below 8 MPa, the porosity decreased exponentially. When the vertical stress was 8 MPa–50 MPa, the porosity decreased in a linear, slow, and stable manner. The porosity of the simulation with particle breakage exhibited a three-stage pore evolution. Therefore, with increasing vertical stress, the porosity of the two simulations gradually showed a difference, especially when the vertical stress was 30 MPa–50 MPa; the above difference was more obvious (Figure 19). When the vertical stress reached 50 MPa, the difference in the porosity was 4.63%.
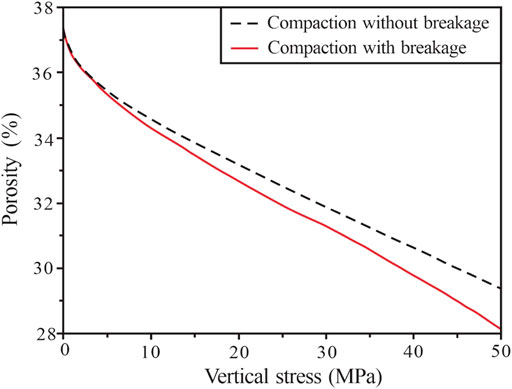
FIGURE 19. Porosity evolution of the simulation with and without breakage.
In terms of the pore structure evolution, when the vertical stress was below 30 MPa, there was little difference in the number and mean radii of pores and throats between the simulation results with and without particle breakage. When the vertical stress was 30 MPa–50 MPa, the difference between the two simulations was significant. The number of pores and throats in the simulation without particle breakage did not change significantly, and the mean radius decreased slowly and stably. However, the number of pores and throats in the simulation with particle breakage showed an obvious upward trend, and the mean radii decreased rapidly. Additionally, the above differences were more pronounced in the throats than in the pores. When the vertical stress reached 50 MPa, the difference rates of the number of pores and throats were 4.95% and 8.74%, respectively, and those of the radii of the pores and throats were 2.78% and 6.8%, respectively.
5.2 Control of the pore evolution in the sandstone reservoir by particle breakage
In the process of mechanical compaction, the pore evolution characteristics of the simulation with and without particle breakage are obviously different in the high-stress stage (vertical stress of 30 MPa–50 MPa), wherein the particle breakage is strong (Figures 14, 15, Figure 16B). Therefore, particle breakage has a significant effect on the porosity and pore structure. The particle size composition characteristics of uncompacted loose sand affect the packing structure and further control the porosity (Yan et al., 2018, 2019). The particle size composition was characterized by dynamic changes during the mechanical compaction with particle breakage (Figure 15). Therefore, the porosity is not only controlled by the vertical stress but also by the change in the particle size composition. The fragments generated by particle breakage continued to rotate and move under the action of stress and filled the pore space between the pre-existing particles (Figures 21A,B), thereby further decreasing the porosity. Simultaneously, the production of small particles formed smaller pores and throats, resulting in the number of pores and throats increased rapidly while the mean radius decreased rapidly in the high-stress stage (Figures 20A,B). Additionally, particle breakage creates a large number of microfractures that can form thin throats, which increases the number of throats and decreases the mean radius (Figure 21B). Therefore, owing to the influence of both fragments and microfractures caused by particle breakage, particle breakage has a more significant effect on the evolution of the number and radius of throats during mechanical compaction.
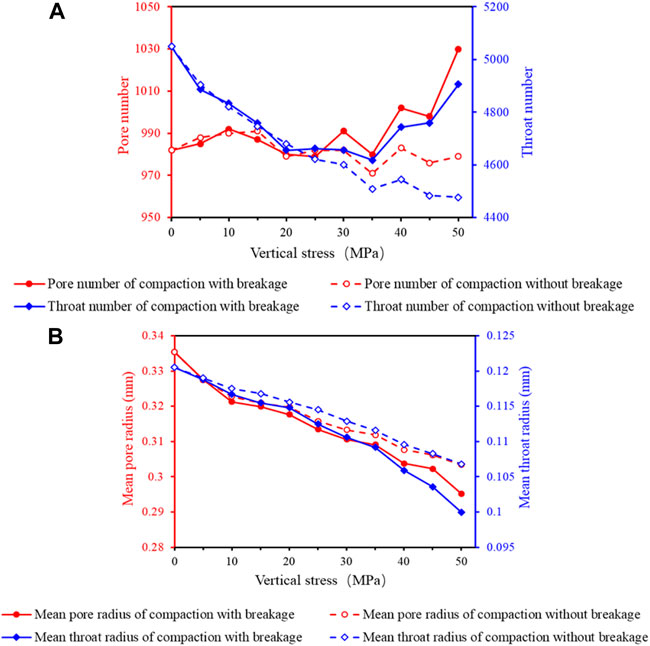
FIGURE 20. Evolution of the pore structure characteristics of the simulation with and without breakage: (A) number of pores and throats and (B) the mean radii of pores and throats.
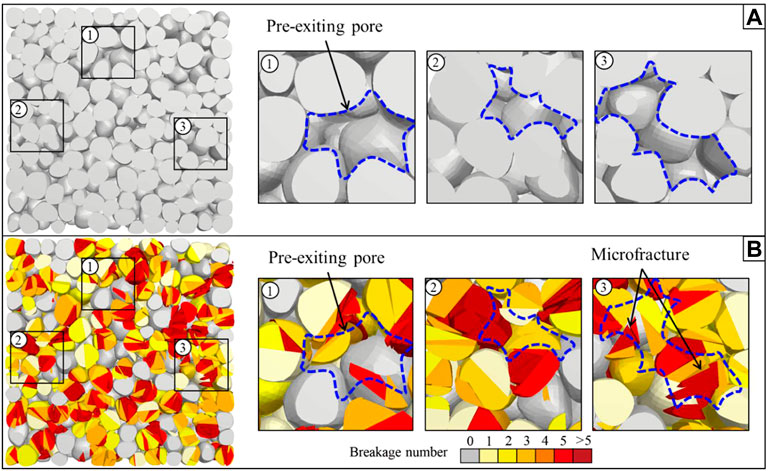
FIGURE 21. Section characteristics of the sample when the vertical stress is 50 MPa: (A) simulation without breakage and (B) simulation with breakage.
5.3 Application prospect of the simulation method
In this study, the DEM simulation method for simulating the mechanical compaction considering particle breakage exhibits the advantages of the numerical simulation method and is improved. In addition to the aforementioned applications, this method also has broad application prospects in other studies on sandstone reservoirs. First, particles with different particle size compositions, morphologies, and mechanical properties (e.g., quartz and feldspar) can simulate different types of clastic sediments. Simultaneously, different burial depths, burial rates, and tectonic stress conditions can be simulated by setting the loading stress, loading rate, and stress direction. Therefore, this method enables the multi-factor-controlled simulation of mechanical compaction with particle breakage in complex geological settings (Figure 22A). Second, the numerical simulation method proposed in this study can be combined with other numerical simulation software to conduct comprehensive reservoir research. For example, the simulation results can provide accurate basic models for the numerical simulation of chemical diagenesis method (e.g., QSGSA) and can be combined with fluid flow simulation software or technology (e.g., Avizo software, Lattice Boltzmann Method, etc.) to obtain the permeability of compacted samples (Figure 22B). Additionally, artificial intelligence technology has become an important research means in the field of oil and gas geology. In terms of reservoir diagenesis, current research has focused on the prediction of diagenetic facies by combining extensive well logging data (Wang and Lu, 2021; Li et al., 2022). However, the current challenge of artificial intelligence in the application of diagenetic processes is that it is difficult to form an ideal training set due to time and economic cost constraints. The 3D model of the simulation has good visualizations, and 2D images can be obtained by slicing at any position and angle (Figure 22C). Thus, it can provide rich training samples and basic support for artificial intelligence and other emerging technologies in reservoir diagenesis research.
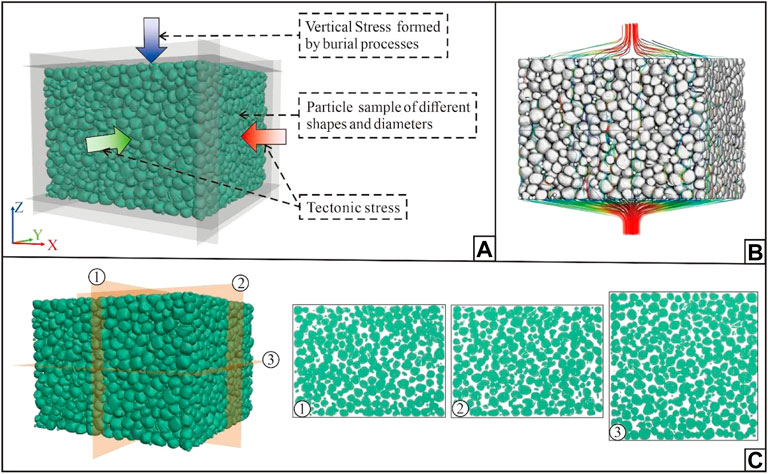
FIGURE 22. Application prospect of the simulation method proposed in this paper: (A) simulation of mechanical compaction with particle breakage considering various geological factors, (B) fluid flow simulation with Avizo 9.0, and (C) 3D visualization effect of the model and 2D slice images.
5.4 Deficiencies and future research
The mechanical mechanism of granular materials breakage is complex and the fragmentation forms are diverse. It is challenging to simulate the breakage of multiple particles. In the numerical simulation method proposed in this paper, the particle breakage is realized by generating random cutting plane to cut the particle at the maximum contact force point, which simplifies the particle breakage process to a certain extent. The simulation results may not fully reflect the characteristics of particle fragmentation. Therefore, in future research, enriching and optimizing the particle breakage mode in numerical simulation based on the particle breakage mechanism may be an effective way to improve the accuracy of the numerical simulation method of mechanical compaction considering particle breakage.
6 Conclusion
This study proposes a DEM simulation method for mechanical compaction considering particle breakage. The effects of the breaking threshold of the reference particles (σlimit0) and the Weibull modulus (m) on the simulation results are discussed, and the model parameters are calibrated. On this basis, this method was applied to the compaction simulation of coarse sandstone, and the control of pore evolution by particle breakage was analyzed. The main conclusions of this study are as follows:
1) A DEM simulation method to realize particle breakage by particle cutting is proposed. This method has high computational efficiency and can reflect the process of particle breakage. The simulation results coincided well with the experimental results under the conditions of σlimit0 = 55 MPa and m = 3.
2) During the mechanical compaction of coarse sandstone, the reservoir porosity and mean radii of pores and throats decreased rapidly, and the number of pores and throats increased rapidly during the high-stress stage (vertical stress of 30 MPa–50 MPa) with strong particle breakage. When the vertical stress reached 50 MPa, compared to the simulation results without considering particle breakage, the porosity difference rate caused by particle breakage was 4.63%, the number difference rates of pores and throats were 4.95% and 8.74%, and the radius difference rates of the pores and throats were 2.78% and 6.8%, respectively.
3) The fragments generated by particle breakage filled the pore space between the pre-existing particles under the action of stress, resulting in the evolution characteristics of porosity and pore structure. Additionally, the microfractures generated by particle breakage also controlled the characteristics of the throat, resulting in a more significant control of throat evolution by particle breakage.
4) The numerical simulation method presented in this study can be applied to complex geological conditions and combined with other simulation methods, which can be used as an important technique in sandstone reservoir research. At the same time, the simulation results can provide rich training samples for artificial intelligence and other emerging technologies.
Data availability statement
The raw data supporting the conclusion of this article will be made available by the authors, without undue reservation.
Author contributions
TJ and LZ designed the simulation, wrote the code, analyzed the results and drafted the manuscript. CC, ZW, and JL analyzed the simulation data. YY improve the code and tested the model. All co-authors contributed to the final manuscript.
Funding
This study was supported by the Strategic Priority Research Program of the Chinese Academy of Sciences (XDA14010202) and Exploration and Development of Deep Oil and Gas in Tarim Basin (ZD2019-183).
Conflict of interest
The authors CC and ZW were employed by PetroChina Tarim Oilfield Company.
The remaining authors declare that the research was conducted in the absence of any commercial or financial relationships that could be construed as a potential conflict of interest.
Publisher’s note
All claims expressed in this article are solely those of the authors and do not necessarily represent those of their affiliated organizations, or those of the publisher, the editors and the reviewers. Any product that may be evaluated in this article, or claim that may be made by its manufacturer, is not guaranteed or endorsed by the publisher.
References
Afshar, T., Disfani, M. M., Narsilio, G. A., and Arulrajah, A. (2018). Post-breakage changes in particle properties using synchrotron tomography. Powder Technol. 325, 530–544. doi:10.1016/j.powtec.2017.11.039
Anders, M. H., Laubach, S. E., and Scholz, C. H. (2014). Microfractures: A review. J. Struct. Geol. 69, 377–394. doi:10.1016/j.jsg.2014.05.011
Ben-Nun, O., and Einav, I. (2010). The role of self-organization during confined comminution of granular materials. Phil. Trans. R. Soc. A 368 (1910), 231–247. doi:10.1098/rsta.2009.0205
Bjørlykke, K. (2014). Relationships between depositional environments, burial history and rock properties. some principal aspects of diagenetic process in sedimentary basins. Sediment. Geol. 301, 1–14. doi:10.1016/j.sedgeo.2013.12.002
Chester, J. S., Lenz, S. C., Chester, F. M., and Lang, R. A. (2004). Mechanisms of compaction of quartz sand at diagenetic conditions. Earth Planet. Sci. Lett. 220 (3-4), 435–451. doi:10.1016/s0012-821x(04)00054-8
Chuhan, F. A., Kjeldstad, A., Bjørlykke, K., and Høeg, K. (2002). Porosity loss in sand by grain crushing—Experimental evidence and relevance to reservoir quality. Mar. Petroleum Geol. 19 (1), 39–53. doi:10.1016/s0264-8172(01)00049-6
Ciantia, M. O., Arroyo, M., Calvetti, F., and Gens, A. (2015). An approach to enhance efficiency of dem modelling of soils with crushable grains. Geotechnique 65 (2), 91–110. doi:10.1680/geot.13.p.218
Ciantia, M. O., Arroyo, M., O'Sullivan, C., Gens, A., and Liu, T. (2019). Grading evolution and critical state in a discrete numerical model of Fontainebleau Sand. Geotechnique 69 (1), 1–15. doi:10.1680/jgeot.17.p.023
Cil, M. B., and Alshibli, K. A. (2014). 3D evolution of sand fracture under 1d compression. Géotechnique 64 (5), 351–364. doi:10.1680/geot.13.p.119
Cuesta Cano, A., Van Stappen, J. F., Wolterbeek, T. K. T., and Hangx, S. J. T. (2021). Uniaxial compaction of sand using 4D X-ray tomography: The effect of mineralogy on grain-scale compaction mechanisms. Mater. Today Commun. 26, 101881. doi:10.1016/j.mtcomm.2020.101881
De Bono, J., and Mcdowell, G. R. (2016). Particle breakage criteria in discrete-element modelling. Geotechnique 66 (12), 1014–1027. doi:10.1680/jgeot.15.p.280
De Bono, J., and Mcdowell, G. R. (2018). Validation of the log e–log σ normal compression law using particle strength data. Geotechnique 68 (5), 451–456. doi:10.1680/jgeot.17.t.007
English, K. L., English, J. M., Bonnell, L. M., Lander, R. H., Hollis, C., Redfern, J., et al. (2017). Controls on reservoir quality in exhumed basins – An example from the Ordovician sandstone, Illizi basin, Algeria. Mar. Petroleum Geol. 80, 203–227. doi:10.1016/j.marpetgeo.2016.11.011
Esnault, V. P. B., and Roux, J. N. (2013). 3D numerical simulation study of quasistatic grinding process on a model granular material. Mech. Mater. 66, 88–109. doi:10.1016/j.mechmat.2013.07.018
Feng, G., Feng, Z., Li, Z., Qi, T., Zhao, J., Fan, W., et al. (2022). Effect of particle size on re-crushing characteristics of crushed coal during axial loading. Powder Technol. 407, 117675. doi:10.1016/j.powtec.2022.117675
Hagerty, M. M., Hite, D. R., Ullrich, C. R., and Hagerty, D. J. (1993). One-dimensional high-pressure compression of granular Media. J. Geotech. Engrg. 119 (1), 1–18. doi:10.1061/(asce)0733-9410(1993)119:1(1)
Hardin, B. O. (1985). Crushing of soil particles. J. Geotech. Engrg. 111 (10), 1177–1192. doi:10.1061/(asce)0733-9410(1985)111:10(1177)
Higgs, K. E., Zwingmann, H., Reyes, A. G., and Funnell, R. H. (2007). Diagenesis, porosity evolution, and petroleum emplacement in tight gas reservoirs, Taranaki Basin, New Zealand. J. Sediment. Res. 77 (12), 1003–1025. doi:10.2110/jsr.2007.095
Hooker, J. N., Laubach, S. E., and Marrett, R. (2018). Microfracture spacing distributions and the evolution of fracture patterns in sandstones. J. Struct. Geol. 108, 66–79. doi:10.1016/j.jsg.2017.04.001
Huang, J., Xu, S., and Hu, S. (2013). Effects of grain size and gradation on the dynamic responses of Quartz Sands. Int. J. Impact Eng. 59, 1–10. doi:10.1016/j.ijimpeng.2013.03.007
Itasca Consulting Group Inc (2017). PFC - particle flow code. Minneapolis: Itasca. Ver. 6.0Available At https://www.itascacg.com.
Jarrar, Z. A., Alshibli, K. A., and Al-Raoush, R. I. (2020). Three-dimensional evaluation of sand particle fracture using discrete-element method and synchrotron microcomputed tomography images. J. Geotech. Geoenviron. Eng. 146 (7). doi:10.1061/(asce)gt.1943-5606.0002281
Karner, S. L., Chester, F. M., Kronenberg, A. K., and Chester, J. S. (2003). Subcritical compaction and yielding of granular quartz sand. Tectonophysics 377 (3-4), 357–381. doi:10.1016/j.tecto.2003.10.006
Lade, P. V., Yamamuro, J. A., and Bopp, P. A. (1996). Significance of particle crushing in granular materials. J. Geotech. Engrg. 122 (4), 309–316. doi:10.1061/(asce)0733-9410(1996)122:4(309)
Laubach, S. E., and Ward, M. E. (2006). Diagenesis in porosity evolution of opening-mode fractures, Middle triassic to lower Jurassic La Boca formation, NE Mexico. Tectonophysics 419 (1-4), 75–97. doi:10.1016/j.tecto.2006.03.020
Li, Z., Zhang, L., Yuan, W., Chen, X., Zhang, L., and Li, M. (2022). Logging identification for diagenetic facies of tight sandstone reservoirs: A case study in the lower Jurassic Ahe formation, Kuqa depression of Tarim Basin. Mar. Petroleum Geol. 139, 105601. doi:10.1016/j.marpetgeo.2022.105601
Mao, W., Hei, L., and Yang, Y. (2021). Advances on the acoustic emission testing for monitoring of granular soils. Measurement 185, 110110. doi:10.1016/j.measurement.2021.110110
Mcdowell, G. R., and Bolton, M. D. (1998). On the micromechanics of crushable aggregates. Geotechnique 48 (5), 667–679. doi:10.1680/geot.1998.48.5.667
Mcdowell, G. R. (2002). On the yielding and plastic compression of sand. Soils Found. 42 (1), 139–145. doi:10.3208/sandf.42.139
Morad, S., Al-Ramadan, K., Ketzer, J. M., and De Ros, L. F. (2010). The impact of diagenesis on the heterogeneity of sandstone reservoirs: A review of the role of depositional facies and sequence stratigraphy. Am. Assoc. Pet. Geol. Bull. 94 (8), 1267–1309. doi:10.1306/04211009178
Mousavi, M. A., and Bryant, S. L. (2013). Geometric models of porosity reduction by ductile grain compaction and cementation. Am. Assoc. Pet. Geol. Bull. 97 (12), 2129–2148. doi:10.1306/05171311165
Nakata, Y., Hyodo, M., Hyde, A. F. L., Kato, Y., and Murata, H. (2001a). Microscopic particle crushing of sand subjected to high pressure one-dimensional compression. Soils Found. 41 (1), 69–82. doi:10.3208/sandf.41.69
Nakata, Y., Kato, Y., Hyodo, M., Hyde, A. F. L., and Murata, H. (2001b). One-dimensional compression behaviour of uniformly graded sand related to single particle crushing strength. Soils Found. 41 (2), 39–51. doi:10.3208/sandf.41.2_39
Nelson, P. H. (2009). Pore-throat sizes in sandstones, tight sandstones, and shales. Am. Assoc. Pet. Geol. Bull. 93 (3), 329–340. doi:10.1306/10240808059
Niu, Y., and Zhou, X. (2021). Forecast of time-of-instability in rocks under complex stress conditions using spatial precursory AE response rate. Int. J. Rock Mech. Min. Sci. 147, 104908. doi:10.1016/j.ijrmms.2021.104908
Qiao, J., Zeng, J., Jiang, S., and Wang, Y. (2020). Impacts of sedimentology and diagenesis on pore structure and reservoir quality in tight oil sandstone reservoirs: Implications for macroscopic and microscopic heterogeneities. Mar. Petroleum Geol. 111, 279–300. doi:10.1016/j.marpetgeo.2019.08.008
Qin, S., Wang, R., Shi, W., Liu, K., Zhang, W., Xu, X., et al. (2022). Diverse effects of intragranular fractures on reservoir properties, diagenesis, and Gas Migration: Insight from Permian tight sandstone in the Hangjinqi area, North Ordos Basin. Mar. Petroleum Geol. 137, 105526. doi:10.1016/j.marpetgeo.2022.105526
Seo, D., Sohn, C., Cil, M. B., and Buscarnera, G. (2021). Evolution of particle morphology and mode of fracture during the oedometric compression of sand. Geotechnique 71 (10), 853–865. doi:10.1680/jgeot.18.p.300
Seyyedan, S. M., Mirghasemi, A. A., and Mohammadi, S. (2021). Numerical simulation of direct shear test on granular materials composed of breakable angular particles: A DEM-XFEM approach. Powder Technol. 391, 450–466. doi:10.1016/j.powtec.2021.06.038
Shanley, K. W., and Cluff, R. M. (2015). The evolution of pore-scale fluid-saturation in low-permeability sandstone reservoirs. Am. Assoc. Pet. Geol. Bull. 99 (10), 1957–1990. doi:10.1306/03041411168
Sun, Z., Tang, H., Espinoza, D. N., Balhoff, M. T., and Killough, J. E. (2018). Discrete element modeling of grain crushing and implications on reservoir compaction. J. Petroleum Sci. Eng. 171, 431–439. doi:10.1016/j.petrol.2018.07.046
Turner, A. K., Sharma, A., Penumadu, D., and Herbold, E. B. (2019). Finite element analyses of single particle crushing tests incorporating computed tomography imaging and Damage Mechanics. Comput. Geotechnics 115, 103158. doi:10.1016/j.compgeo.2019.103158
Wan, J., Chen, Z., Chu, X., and Liu, H. (2020). Dependency of single-particle crushing patterns on discretization using peridynamics. Powder Technol. 366, 689–700. doi:10.1016/j.powtec.2020.03.021
Wang, J., Chi, S., Shao, X., and Zhou, X. (2021). Determination of the mechanical parameters of the microstructure of rockfill materials in triaxial compression DEM simulation. Comput. Geotechnics 137, 104265. doi:10.1016/j.compgeo.2021.104265
Wang, Y., and Lu, Y. (2021). Diagenetic facies prediction using a LDA-assisted SSOM method for the Eocene Beach-bar sandstones of dongying depression, East China. J. Petroleum Sci. Eng. 196, 108040. doi:10.1016/j.petrol.2020.108040
Wang, Y., Zhou, X., Wang, Y., and Shou, Y. (2018). A 3-D conjugated bond-pair-based peridynamic formulation for initiation and propagation of cracks in brittle solids. Int. J. Solids Struct. 134, 89–115. doi:10.1016/j.ijsolstr.2017.10.022
Wang, Y., Zhou, X., and Xu, X. (2016). Numerical simulation of propagation and coalescence of flaws in rock materials under compressive loads using the extended non-ordinary state-based peridynamics. Eng. Fract. Mech. 163, 248–273. doi:10.1016/j.engfracmech.2016.06.013
Wu, Y., Tahmasebi, P., Lin, C., and Dong, C. (2022). Using digital rock Physics to investigate the impacts of diagenesis events and pathways on rock properties. J. Petroleum Sci. Eng. 208, 108025. doi:10.1016/j.petrol.2020.108025
Xiao, N., Zhou, X., and Berto, F. (2021a). Fracture Analysis of rock reconstruction models based on cooling–solidification annealing algorithms. Fatigue Fract. Eng. Mater. Struct. 44 (9), 2503–2523. doi:10.1111/ffe.13531
Xiao, N., Zhou, X., and Ling, T. (2021b). Novel cooling–solidification annealing reconstruction of rock models. Acta Geotech. 17 (5), 1785–1802. doi:10.1007/s11440-021-01307-5
Yan, Y., Zhang, L., and Luo, X. (2019). Calculating the primary porosity of unconsolidated sands based on packing texture: Application to Braided River Sands. Mar. Petroleum Geol. 107, 515–526. doi:10.1016/j.marpetgeo.2019.05.033
Yan, Y., Zhang, L., Luo, X., Li, C., and Hu, F. (2018). A new method for calculating the primary porosity of unconsolidated sands based on packing texture: Application to modern beach sand. Mar. Petroleum Geol. 98, 384–396. doi:10.1016/j.marpetgeo.2018.08.033
Yan, Y., Zhang, L., Luo, X., Liu, K., Zhang, L., and Jia, T. (2021b). New method to predict porosity loss during sandstone compaction based on packing texture. Mar. Petroleum Geol. 133, 105228. doi:10.1016/j.marpetgeo.2021.105228
Yan, Y., Zhang, L., Luo, X., Zhang, L., and Li, J. (2021a). Process of porosity loss and predicted porosity loss in high effective stress sandstones with grain crushing and packing texture transformation. J. Petroleum Sci. Eng. 207, 109092. doi:10.1016/j.petrol.2021.109092
Yashima, S., Kanda, Y., and Sano, S. (1987). Relationships between particle size and fracture energy or impact velocity required to fracture as estimated from single particle crushing. Powder Technol. 51 (3), 277–282. doi:10.1016/0032-5910(87)80030-x
Zeng, L. (2010). Microfracturing in the upper triassic sichuan basin tight-gas sandstones: Tectonic, overpressure, and diagenetic origins. Am. Assoc. Pet. Geol. Bull. 94 (12), 1811–1825. doi:10.1306/06301009191
Zhang, J., and Zhou, X. (2020). AE event rate characteristics of flawed granite: From damage stress to Ultimate Failure. Geophys. J. Int. 222 (2), 795–814. doi:10.1093/gji/ggaa207
Zhang, T., Zhou, X., and Qian, Q. (2021). Drucker-Prager plasticity model in the framework of OSB-PD theory with shear deformation. Eng. Comput. 177, 54. doi:10.1007/s00366-021-01527-z
Zheng, W., and Tannant, D. D. (2016). Frac sand crushing characteristics and morphology changes under high compressive stress and implications for sand pack permeability. Can. Geotech. J. 53 (9), 1412–1423. doi:10.1139/cgj-2016-0045
Zheng, W., and Tannant, D. D. (2019). Influence of proppant fragmentation on fracture conductivity - insights from three-dimensional discrete element modeling. J. Petroleum Sci. Eng. 177, 1010–1023. doi:10.1016/j.petrol.2019.03.015
Zhou, X., Wang, Y., Zhang, J., and Liu, F. (2018). Fracturing Behavior Study of three-flawed specimens by uniaxial compression and 3D digital image correlation: Sensitivity to brittleness. Rock Mech. Rock Eng. 52 (3), 691–718. doi:10.1007/s00603-018-1600-4
Zhou, X., Bi, J., and Qian, Q. (2014). Numerical simulation of crack growth and coalescence in rock-like materials containing multiple pre-existing flaws. Rock Mech. Rock Eng. 48 (3), 1097–1114. doi:10.1007/s00603-014-0627-4
Zhou, X., Jia, Z., and Wang, L. (2021a). A field-enriched finite element method for brittle fracture in rocks subjected to mixed mode loading. Eng. Analysis Bound. Elem. 129, 105–124. doi:10.1016/j.enganabound.2021.04.023
Zhou, X., and Zhang, J. (2021). Damage progression and acoustic emission in brittle failure of granite and sandstone. Int. J. Rock Mech. Min. Sci. 143, 104789. doi:10.1016/j.ijrmms.2021.104789
Zhou, X., Zhang, J., Qian, Q., and Niu, Y. (2019). Experimental investigation of progressive cracking processes in granite under uniaxial loading using digital imaging and AE Techniques. J. Struct. Geol. 126, 129–145. doi:10.1016/j.jsg.2019.06.003
Keywords: sandstone reservoir, mechanical compaction, particle breakage, pore evolution, discrete element method
Citation: Jia T, Zhang L, Chen C, Wang Z, Yan Y and Li J (2023) Numerical simulation of mechanical compaction and pore evolution of sandstone considering particle breakage. Front. Earth Sci. 10:1038038. doi: 10.3389/feart.2022.1038038
Received: 06 September 2022; Accepted: 24 October 2022;
Published: 16 January 2023.
Edited by:
Xiaoping Zhou, Chongqing University, ChinaReviewed by:
Nan Xiao, Changsha University of Science and Technology, ChinaYong Niu, Shaoxing University, China
Copyright © 2023 Jia, Zhang, Chen, Wang, Yan and Li. This is an open-access article distributed under the terms of the Creative Commons Attribution License (CC BY). The use, distribution or reproduction in other forums is permitted, provided the original author(s) and the copyright owner(s) are credited and that the original publication in this journal is cited, in accordance with accepted academic practice. No use, distribution or reproduction is permitted which does not comply with these terms.
*Correspondence: Liqiang Zhang, emhhbmdscUB1cGMuZWR1LmNu Yiming Yan, eWltaW5nQHVwYy5lZHUuY24=