 Qingxiang Dong
 Shengwei Wang1,2
 Jinkui Ma
 Shuaifeng Lyu
 Weiyong Lu
- 1School of Earth Resources, China University of Geosciences, Wuhan, China
- 2State Key Laboratory of Coal and CBM Co-mining, Jincheng, China
- 3State Key Laboratory of Coal Mine Safety Technology, China Coal Technology & Engineering Group Shenyang Research Institute, Shenyang, China
- 4School of Mining Engineering, Lyuliang University, Lyuliang, China
CBM (CBM) development in coal mining area has good safety, economic and energy benefits, but methane emission is common in surface well sites. In view of this, taking the CBM wells in Qinshui County of Shanxi Province as an example, the methane emission location and emission volume of CBM wells are obtained, and the prediction model of methane emission volume is established through field investigation and multiple regression analysis. The results show that 81% of CBM wells have methane emission. Wellhead and drainage outlet are the two main positions of methane emission. The proportion of wells with emission volume between 0 and 10 m3/d is 59%. On the whole, the emission accounts for 1.53% of the gas well production. There is almost no methane emission in the single liquid phase flow stage. The methane emission in the gas-liquid two-phase flow stage is positively correlated with the bottom hole flow pressure, times of stroke and gas production, and negatively correlated with the pump embedment and water production. The bottom hole flow pressure and the pump embedment have the greatest impact on the methane emission. In the single-phase gas flow stage, methane emission is positively correlated with gas production and casing pressure, and negatively correlated with stroke frequency and water production.
Introduction
CBM is a clean energy with methane as the main component. The development of CBM resources has three attributes: coal mine safety, energy utilization and environmental protection. China’s CBM industry has taken shape, and the amount of CBM resources within 2000 m burial depth is 30.05 × 10¹² m3, ranking third in the world. Qinshui Basin in Shanxi Province has the most successful CBM development (Jia and Zhou, 2013; Shang et al., 2020; Xue et al., 2020; Sun et al., 2021; Zhu et al., 2021). The development process of CBM includes drilling, reservoir reconstruction and drainage gas production (Lyu et al., 2020a; Lyu et al., 2020b; Shen et al., 2020). The methane content in CBM is generally greater than 96.5%. Its ability to absorb infrared rays, greenhouse effect and radiation efficiency are 25 times, 26 times and 27 times that of carbon dioxide respectively, and its average life in the air is as high as 8 years (Tang and Li, 1990; Tang et al., 2006; Wu et al., 2014). The increase of the volume fraction of methane in the atmosphere causes the weakening of the atmospheric circulation, which is not conducive to the flow of solid particles, and significantly increases the greenhouse effect and urban heat island effect. Therefore, methane emission not only wastes clean energy, but also causes serious damage to the environment (Li et al., 2019). In addition, when the volume fraction of methane in the air reaches 5%–16%, it will explode in case of open fire. When the volume fraction of methane in the environment reaches 25%–30%, it may cause physical discomfort of operators, such as headache, fatigue, accelerated heartbeat and even suffocation (Zhang, 2011). It can be seen that when the methane volume fraction reaches the critical value under the condition of methane emission in the CBM well site, there are potential safety hazards for the well site equipment and personnel. Domestic and foreign scholars have carried out research on the monitoring and prevention methods of gas emission in natural gas transportation pipelines, but there are few studies on the methane emission mode, location, rate, emission amount and other parameters and evaluation methods of natural gas production wells, especially CBM emission wells (Zhang, 2011; Hou and Zeng, 2013; Li, 2014; Zhou et al., 2016; Kong and Wang, 2019). Therefore, it is of great significance to reveal the characteristics of methane emission and establish the prediction model of methane emission for formulating the production system of CBM and preventing methane emission. It will play a positive role in promoting the ecological civilization construction goal of striving to achieve carbon peak by 2030 and carbon neutrality by 2060. Therefore, taking the surface CBM wells in Qinshui Coal Mine Area as the research object, the methane emission and operating parameters of 204 CBM wells were tested and investigated on the spot. According to the multi factor analysis method (Luo et al., 2019; Meng and Zhu, 2019; Zheng, 2020), a methane emission model applicable to this area is established, which provides a basis for the formulation of control measures for methane emission of CBM wells.
Principle and measurement method of methane emission in CBM well
Methane emission principle
Figure 1 shows the principle of methane emission from CBM wells. After the completion of the drilling of the CBM well, the well is completed by running the casing-well cementation-perforating-fracturing. The purpose of fracturing is to produce artificial fractures in the coal seam, improve the permeability of the coal reservoir and improve the gas water flow channel. The oil pipe and drainage pump are installed in the casing to discharge the liquid in the wellbore to the surface through the oil pipe. As the bottom hole flow pressure decreases to the CBM desorption pressure, the adsorbed CBM begins to desorb and enters the casing along the fracturing fracture and perforation hole after diffusion and seepage. Due to the difference of gas and water, the CBM enters the annulus between the casing and the oil pipe and migrates to the low-pressure wellhead, thus entering the gas transmission pipeline for gathering and utilization. However, under the action of fluid entrainment, part of methane escapes into the oil pipe, and mainly escapes directly into the atmosphere from the drainage outlet on the ground. At the same time, as the pumping unit drives the pumping rod to rise and fall back and forth, the wellhead will be eccentric worn, the seal will be damaged, and the CBM will also overflow from the wellhead. Therefore, the direct cause of CBM emission is that the methane gas in the formation enters the oil pipe through gas channeling, and the poor sealing quality of the wellhead will also cause methane emission. Through theoretical analysis and a lot of field verification, the methane emission points of CBM wells are mainly at wellhead and sucker rod annulus and water outlet. Methane emission also occurs at the flange connection of a few CBM wells.
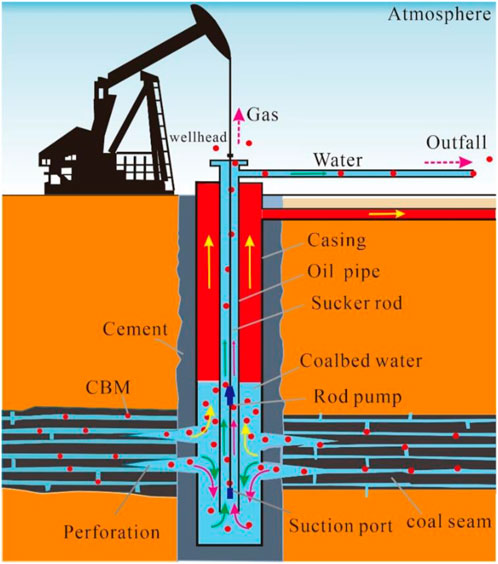
FIGURE 1. Principle of methane emission in CBM well.
Determination method
The selected CBM wells are located in 6 CBM working areas in Qinshui County, Shanxi Province, mainly distributed on both sides of Qinhe river. The distribution map of CBM wells in the study area of Qinshui county is shown in Figure 2.
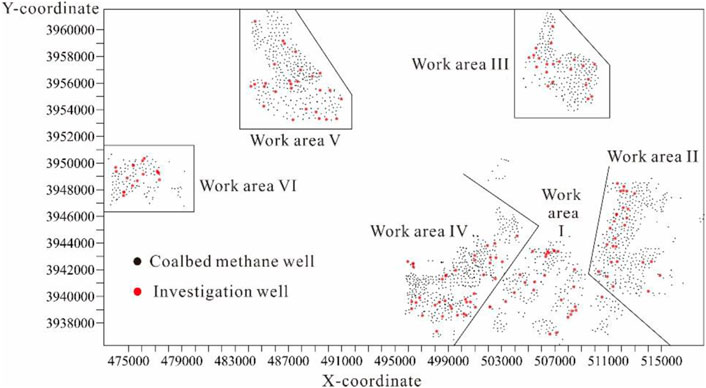
FIGURE 2. Distribution map of CBM wells in the study area.
The methane emission parameters of CBM wells are measured on site. First of all, the location, process flow, production equipment parameters, output, energy consumption and other data of CBM wells are recorded. The explosion-proof infrared thermal imager is used to detect the gas emission, and the emission position of the measuring point is determined according to the infrared imaging. When there is no wind in the well pad, the temperature of the emission point is measured by the hand-held infrared thermometer, and the volume fraction of methane is measured by the inhaled methane gas detector. Use impeller anemometer or thermal flowmeter to test the gas flow rate and obtain the atmospheric pressure at the measuring point. The calculation formula of methane emission is as follows:
Where:
For CBM wells with large liquid and gas output at the drainage outlet, the gas-liquid separation device is used to measure the gas flow in conjunction with the gas bag, and then the methane volume fraction is measured to obtain the methane emission.
Due to the influence of temperature and pressure under environmental conditions, and the output of CBM wells is the gas volume under standard conditions, the measured methane emission is converted into the emission under standard conditions according to the conservation of matter. That is:
Where:
Simultaneous Eq. 1, 2 can be obtained:
In the actual measurement, it was found that the methane volume fraction at the measuring point also changed periodically because the pumping unit and other drainage and production equipment operated repeatedly under a certain number of impulses. The change curve of methane volume fraction at the outlet of CBM well is shown in Figure 3. After the methane detector is close to the measuring point, the volume fraction starts to rise after the methane gas is sucked into the instrument and touched by the detector. After 25 s, the volume fraction of methane is stable at about 20% and fluctuates up and down regularly, and the fluctuation period is about 12 s. This fluctuation period is consistent with the pumping unit stroke of the well (5 times/min). When the methane detector was removed, the methane volume fraction decreased to 0. It is worth noting that due to the rapid diffusion of methane in the air and the influence of surrounding wind speed, the methane volume fraction can hardly be detected about 0.5 m away from the methane emission point. Therefore, the safety risk caused by methane emission in the well pad is small. In order to make the determination of methane volume fraction more accurate and eliminate the error caused by unbalanced emission of methane, the rising and falling sections at both ends of the methane volume fraction curve are cut off during calculation, and the average volume fraction in the middle period is taken as the volume fraction of methane emission.
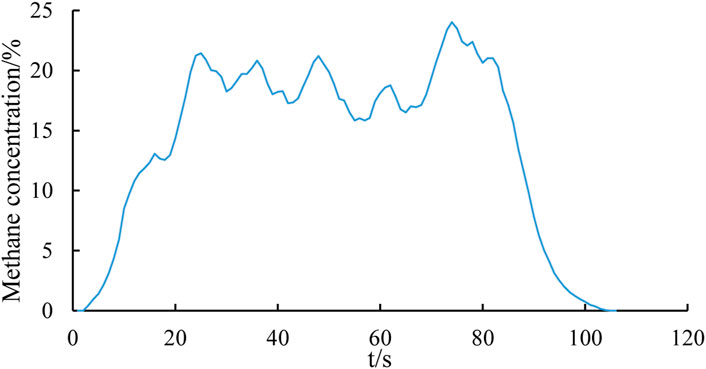
FIGURE 3. Change curve of methane volume fraction at drainage outlet of CBM well.
Results and discussion
Methane emission characteristics
Among the 204 investigated CBM wells, the methane emission at the wellhead is between 0 and 20 m3/d, of which 39% of CBM wells have no methane emission detected at the wellhead. There are 116 CBM wells with methane emission at the wellhead and the emission is less than 10 m3/d, accounting for 56% of the total number of wells. Therefore, more than 1/2 CBM wells have wellhead methane emission, but the emission is generally low. Figure 4 shows the proportion of CBM wells with different methane emission. The statistical chart of the number of CBM wells with different methane emission and emission rate is shown in Figure 5.
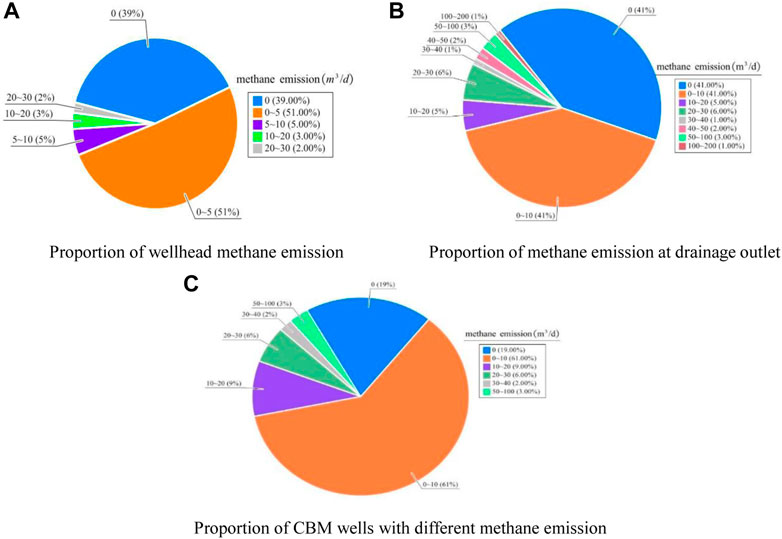
FIGURE 4. Proportion of CBM wells with methane emission in different parts (A) Proportion of wellhead methane emission (B) Proportion of methane emission at drainage outlet (C) Proportion of CBM wells with different methane emission.
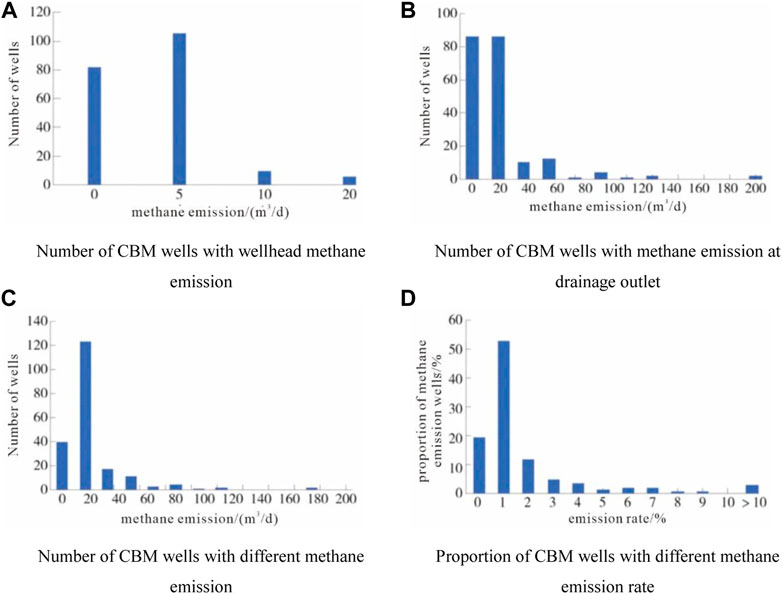
FIGURE 5. Statistics of CBM wells with different methane emission and emission rates (A) Number of CBM wells with wellhead methane emission (B) Number of CBM wells with methane emission at drainage outlet (C) Number of CBM wells with different methane emission (D) Proportion of CBM wells with different methane emission rate.
It can be seen from Figure 4 and Figure 5 that the methane emission at the drainage outlet is between 0 and 200 m3/d, and 41% of the wells have not detected methane emission. There are 86 CBM wells with emission less than 10 m3/d, accounting for 41% of the total number of wells. There are 32 CBM wells with emission greater than 10 m3/d, accounting for 18% of the total number of wells. In contrast, the methane emission at the drainage outlet is generally higher than that at the wellhead, and the number of emission wells also accounts for a large proportion. In general, 19%, 59% and 22% of CBM Wells have no emission, 0–10 m3/d emission and more than 10 m3/d emission, respectively. It is worth noting that all the emission sites with methane emission greater than 20 m3/d are located at the drainage outlets.
In order to characterize the degree of methane emission, the methane emission rate of CBM gas wells is defined as the percentage of methane emission in CBM production. Statistics show that 52% of the wells have a methane leak rate of less than 1%, 26% of the wells have a methane leak rate between 2% and 10%, and 3% of the wells have a methane leak rate greater than 10%. The average emission rate is 1.53%. The methane emission rate may be small for a single well, but when the average CBM well produces 2000 m3/d of gas, the methane emission rate is 30 m3/d, which is enough methane to run a household for a month every day. Therefore, effective control of methane emission can effectively improve the resource utilization rate.
Multi factor analysis of methane emission
In order to reveal the relationship between methane emission and CBM production parameters and find out the main control factors, a single factor analysis of methane emission is carried out first. Theoretically, the more and denser the methane bubbles under the well, the greater the probability of bubbles entering the water inlet. That is, the higher the gas production, the higher the methane emission. CBM is transported to the surface through casing and tubing annulus, and casing pressure often has a positive correlation with gas production. Due to the pumping unit and liquid lifting, the liquid discharge also directly affects the methane emission. The single factor analysis chart of methane emission of CBM wells is shown in Figure 6.
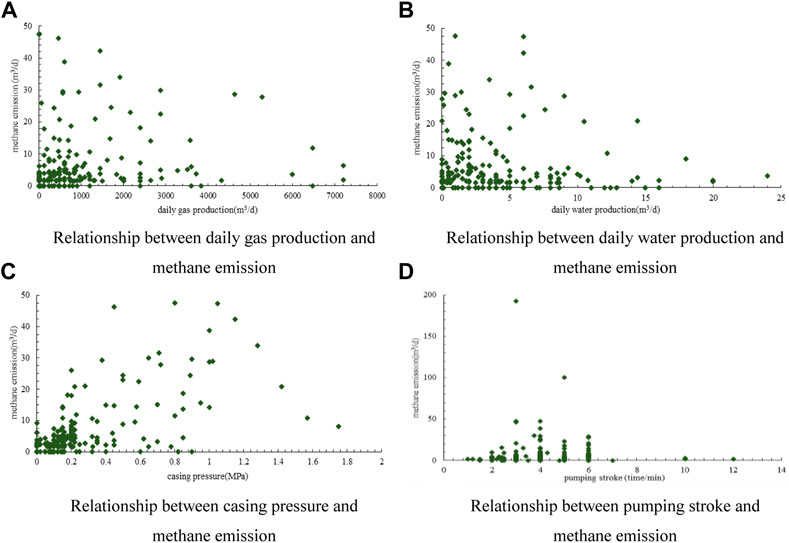
FIGURE 6. Single factor analysis of methane emission in CBM wells (A) Relationship between daily gas production and methane emission (B) Relationship between daily water production and methane emission (C) Relationship between casing pressure and methane emission (D) Relationship between pumping stroke and methane emission.
In fact, it can be seen from Figure 6 that there is no significant linear relationship between the methane emission of the investigated well and the daily gas production, casing pressure and daily gas production. Therefore, for the running CBM drainage and production wells, methane emission is controlled by a variety of factors. There are obvious limitations in using single factor method to analyze methane emission.
In addition to daily gas production, casing pressure, daily water production and other factors, the depth from the pump suction port to the liquid surface, the number of strokes, the bottom hole flow pressure and other factors will also affect the methane emission. The closer to the moving liquid surface, the more bubbles in the water, and the depth from the pump suction port to the liquid surface affects the volume of gas entering the suction port. When the impulse of the oil well pump is large, the liquid flow speed in the well is accelerated, and the liquid is easy to pull the bubbles downward, making it easier for the gas to enter the pump with the liquid. The greater the bottom hole flow pressure is, the greater the pressure difference is between the fluid and the outside world. In the case of constant pump suction port cross-sectional area, the fluid flow rate will be faster.
Methane emission model of CBM well
According to the gas water saturation or fluid production characteristics of the coal reservoir, the process of CBM drainage and production is generally divided into three stages: single-phase water flow, gas-liquid two-phase flow and unidirectional gas flow. Among them, in the single-phase water flow stage, which is also the initial stage of drainage, the reservoir pressure has not yet fallen to the critical desorption pressure. The adsorbed gas in the coal reservoir has not yet been desorbed, and the CBM well only discharges water without producing gas, or only a small amount of free gas is produced. At this time, the methane emission is lack of material source, and the methane emission of CBM wells detected at this stage is mostly zero. In fact, only one well has methane emission, which can be ignored. Therefore, the methane emission function at this stage is constant, that is Q0=0.
In the gas-liquid two-phase flow stage, the casing pressure starts to appear, the liquid level drops steadily, and the pump suction port remains below the liquid level. At this time, the gas at the bottom of the well flows into the tubing in the form of bubbles, and the flow pressure at the bottom of the well at this stage is the sum of the casing pressure and the hydrostatic column pressure. Five factors including the depth X1 of the pump suction port under the dynamic liquid surface, the bottom hole flow pressure X2, the times of flushing X3, the daily water production X4 and the daily gas production X5 are taken as independent variables, and the SPSS software is used to conduct multiple linear regression. The model of methane emission in gas-liquid two-phase flow stage is obtained.
The significance of the regression equation of this model is 0.38 (Table 1), which is significantly higher than that of single factor analysis. In the functional relationship, the standardized regression coefficients of the independent variables X1, X2, X3, X4, X5 are -0.47, 0.62, 0.19, -0.14, 0.19 respectively (Table 2).

TABLE 1. Statistical table of model parameters (the gas-liquid two-phase flow stage).
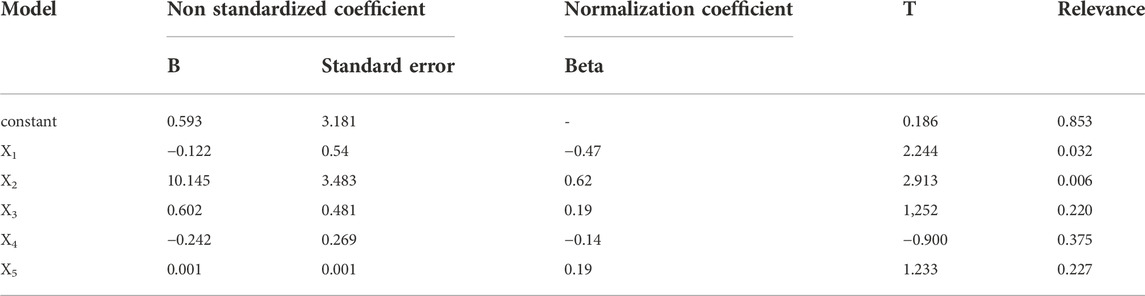
TABLE 2. Table of regression coefficients of various factors (the gas-liquid two-phase flow stage).
It can be seen that methane emission is positively correlated with bottom hole flow pressure, flushing times and daily gas production. These three factors promote bottom hole methane gas to enter the tubing and rise to the surface. Among them, the standardized regression coefficient of bottom hole flow pressure is 0.62, accounting for the largest weight, indicating that the bottom hole flow pressure has the largest impact on methane emission in the gas-liquid two-phase flow stage. The second is impulse times and daily air flow. The normalized regression coefficients of pump embedment and daily water output are −0.47 and −0.14 respectively, so methane emission is negatively correlated with these two factors. The greater the depth of the pump suction port under the liquid surface, the longer the methane bubble migration distance, so the slower the methane emission stall rate and the smaller the emission.
After entering the single-phase gas flow stage, the pressure drop funnel expands to the limit, and the liquid level decreases to the buried depth of the coal reservoir. Part of the time, the coal seam is exposed above the liquid surface, and the water production is very small. CBM mainly enters the wellbore freely under the action of casing pressure in the form of single-phase gas flow. At this stage, because the hydrostatic column pressure is very small, the casing pressure is approximately equal to the bottom hole flow pressure. Therefore, daily water production, stroke times, daily gas production and casing pressure are selected as independent variables. Through multiple linear regression, the methane emission model in single-phase gas flow stage was obtained.
The significance of the regression equation of this model is 0.36, lower than 0.5, and the significance is good (Table 3). The standardized regression coefficients of the independent variables Y1, Y2, Y3 and Y4 in the functional relationship are −0.21, −0.08, 0.12, and 0.62 respectively (Table 4).
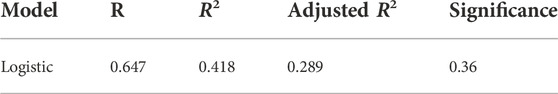
TABLE 3. Statistical table of model parameters (the single-phase gas flow stage).
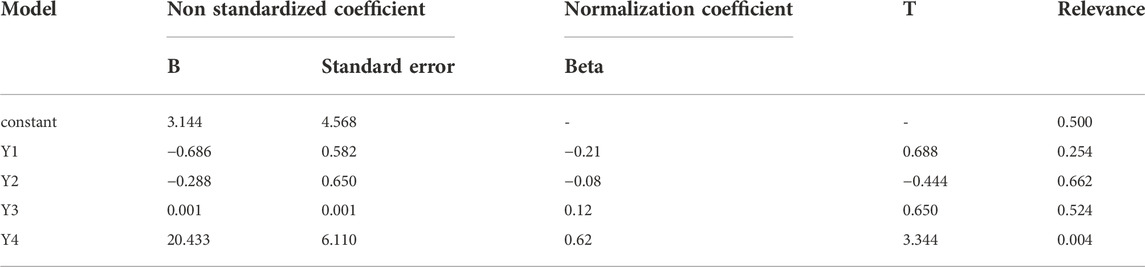
TABLE 4. Table of regression coefficients of various factors (the single-phase gas flow stage).
Methane emission is positively correlated with daily gas production and casing pressure. These two factors have a promoting effect on methane emission, of which the standardized regression coefficient of casing pressure is 0.62, accounting for the largest weight. It indicates that the casing pressure has the greatest influence on the bottom hole methane entering the tubing at this stage. The methane emission is negatively correlated with the times of flushing and water production. Although the water production at this stage is very small, the liquid column in the wellbore prevents the methane gas flow from rising to the surface to a certain extent. The greater the number of strokes, the disturbance effect on the methane gas flow that has entered the oil pipe through the pump suction port, and on the contrary, it is unfavorable for the methane gas to enter the oil pipe and migrate to the surface. Therefore, in different stages of CBM gas well drainage and production process, the influence of various operating parameters on methane emission is quite different.
Example verification
Five CBM drainage wells in the gas-liquid two-phase flow stage are selected as the control wells. Table 5 and Figure 7 show the comparison between the measured value and the predicted value of methane emission from CBM wells.

TABLE 5. Calculation results of methane emission model (the gas-liquid two-phase flow stage).
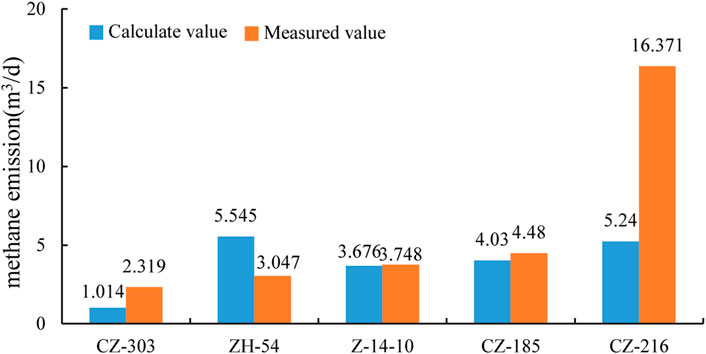
FIGURE 7. Comparison of measured and calculated (the gas-liquid two-phase flow stage).
The measured methane emission of well CZ-303, ZH-54, Z-14-10, CZ-185 and CZ-216 are 2.319, 3.047, 3.748, 4.48, and 16.371 m3/d respectively. The calculated values of methane emission obtained by the model are 1.014, 5.545, 3.676, 4.03, and 5.24 m3/d respectively. Compared with the predicted value, the relative error of the measured value is 1.92%–81.98%, and the absolute error is 0.072–11.131 m3/d.
The absolute error of 4 wells is less than 2.5 m3/d. Among the 204 coal-bed gas wells investigated in the early stage, the number of wells with methane emission between 0 and 2.5 m3/d accounted for 6.37%. At the same time, in the gas water two-phase flow stage, due to the instability of water production and gas production, it is greatly affected by many factors. Therefore, there are some errors in the field measurement results. This is also the reason why the actual measurement and calculation errors are large when the methane emission is large. However, the proportion of CBM wells with emission exceeding 20 m3/d is less than 20%. Therefore, this prediction model has high accuracy for most CBM wells.
Five CBM drainage wells in the single-phase gas flow stage are selected as the control wells. Table 6 and Figure 8 show the comparison between the measured value and the predicted value of methane emission from CBM wells.
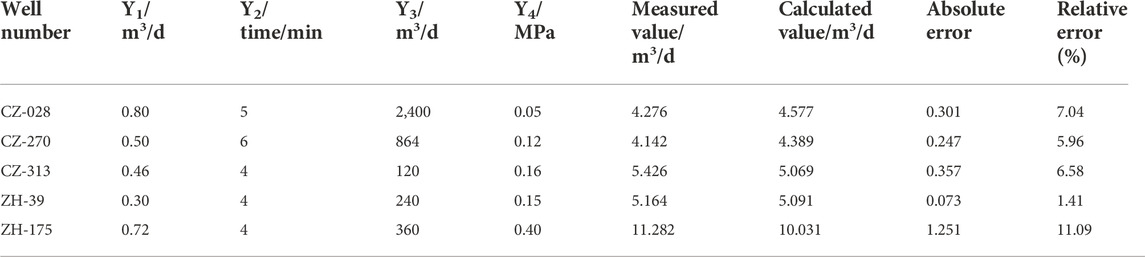
TABLE 6. Calculation results of methane emission model (the single-phase gas flow stage).
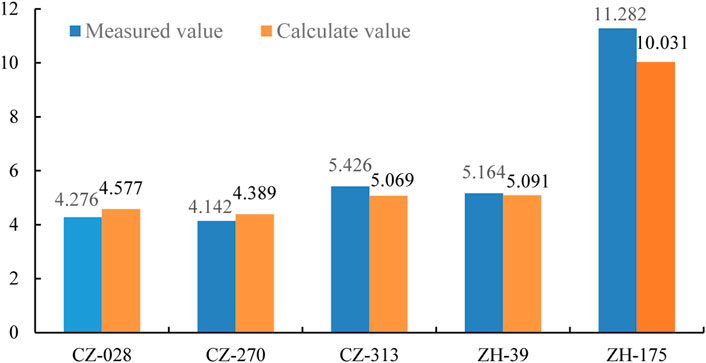
FIGURE 8. Comparison of measured and predicted (the single-phase gas flow stage).
The measured methane emission of well CZ-028, CZ-270, CZ-313, ZH-39, and ZH-175 are 4.276, 4.142, 5.426, 5.164, and 11.282 m3/d respectively. The calculated values of methane emission obtained by the model are 4.577, 4.389, 5.069, 5.091, and 10.031 m3/d respectively. Compared with the predicted value, the relative error of the measured value is 1.41%∼11.09%, and the absolute error is 0.073∼1.251 m3/d.
Conclusion
1) Methane emission is common in the drainage process of coal-bed methane wells, and the wellhead and drainage outlet are the two main points of methane emission. Among the 204 CBM wells investigated, 19%, 61% and 20% are CBM wells with no methane emission, emission between 0 and 10 m3/d and emission greater than 10 m3/d, respectively. Overall, methane emission accounts for 1.53% of the production of production wells.
2) In the process of coal-bed gas well drainage and production, the methane emission in the single-phase water flow stage is almost zero. In the gas-liquid two-phase flow stage, methane emission is positively correlated with bottom hole flow pressure, flushing times and daily gas production, and negatively correlated with pump embedment and daily water production. Among them, bottom hole flow pressure and pump embedment have the greatest impact on methane emission. In the single-phase gas flow stage, methane emission is positively related to daily gas production and casing pressure, and negatively related to the number of strokes and daily water production. Among them, casing pressure and daily water production have the greatest impact on methane emission.
3) A model of methane emission in CBM wells at different stages is established by using multiple factor regression analysis. Through the example verification, the absolute error of the prediction model for the gas water two-phase flow stage is 0.072–11.131 m3/d. Due to the complexity of the measurement in each stage, and the number of emission exceeds 20 m3/d is less, this prediction model has high accuracy for most CBM wells. Prediction model for the single-phase gas flow stage, the relative error of the measured value is 1.41%–11.09%, and the absolute error is 0.073–1.251 m3/d, the results meet the requirements of industrial calculation.
4) Methane emission from CBM well not only causes the loss of gas production, reduces economic benefits, but also increases the potential safety hazards of the well site. More importantly, it also increases the greenhouse effect, which is not conducive to environmental protection. According to the main control factor model of methane emission, targeted measures are taken to actively prevent and control methane emission.
Data availability statement
The original contributions presented in the study are included in the article/Supplementary Material, further inquiries can be directed to the corresponding author.
Author contributions
QD: Conceptualization, Investigation, Data curation, Methodology, Writing-original draft. SW: Conceptualization, Funding acquisition, Project administration. JM: Conceptualization, Formal analysis, Methodology, Writing-review, Editing, Supervision. SL: Data curation, Investigation. WL: Investigation, Software, Validation.
Funding
This work was financially supported by the National Natural Science Foundation of China (Grant No.52174230), Postdoctoral Science Foundation of China (CN) (Grant No. 2021MD703848) and Fundamental Research Program of Shanxi Province (20210302124633).
Conflict of interest
The authors declare that the research was conducted in the absence of any commercial or financial relationships that could be construed as a potential conflict of interest.
Publisher’s note
All claims expressed in this article are solely those of the authors and do not necessarily represent those of their affiliated organizations, or those of the publisher, the editors and the reviewers. Any product that may be evaluated in this article, or claim that may be made by its manufacturer, is not guaranteed or endorsed by the publisher.
References
Hou, J., and Zeng, Y. (2013). Regulation and oversight of the venting and leaking of methane in the natural gas development: A comparative study. Nat. Gas. Ind. 33 (09), 126–130. doi:10.3787/j.issn.1000-0976.2013.09.022
Jia, X., and Zhou, H. (2013). Present situation and countermeasure research for the exploitation and utilization of coal bed methane in China taking Jincheng City as an example. Saf. Environ. Eng. 20 (6), 12.
Kong, Y., and Wang, J. (2019). Research on security assessment of CBM emission with diverse leaking radius. Energy Technol. Manag. 44 (06), 120–122.
Li, J. (2014). Study on simulation and risk assessment of emission and diffusion of CBM field gathering and transportation. Xuzhou: China University of Mining and Technology, 25–34.
Li, Y., Ge, J., and Weng, W., (2019). Stoichiometry ratio of CO2 and CH4 emissions in dajiuhu peat wetlang of shennongjia. Saf. Environ. Eng. 26 (4), 21–28. doi:10.13578/j.cnki.issn.1671-1556.2019.04.004
Luo, K., Li, Y., and Wang, Z. (2019). Research on safety thickness of overlying strata in goaf under multi-factor coupling. Saf. Coal Mines 50 (12), 223–226. doi:10.13347/j.cnki.mkaq.2019.12.049
Lyu, S., Wang, S., Hongtai, L., Wang, T., and Shi, X., (2020a). Analysis of the influence of natural fracture system on hydraulic fracture propagation morphology in coal reservoir [J]. J. China Coal Soc. 45 (7), 2590–2601. doi:10.13225/j.cnki.jccs.DZ20.0859
Lyu, S., Wang, S., Chen, X., Wang, T., and Shi, X., (2020b). Natural fractures in soft coal seams and their effect on hydraulic fracture propagation: A field study. J. Petroleum Sci. Eng. 192, 1–16. doi:10.1016/j.petrol.2020.107255
Meng, S., and Zhu, S. (2019). Comparison between linear regression and nonlinear regression of Langmuir equation parameters. Saf. Coal Mines 50 (1), 188–191. doi:10.13347/j.cnki.mkaq.2019.01.046
Shang, J., Liu, H., and Sang, S., (2020). Coupling analysis on permeability and pore fracture development in high rank coal reservoirs of southern Qinshui Basin. Saf. Coal Mines 51 (6), 184–190. doi:10.13225/j.cnki.jccs.dz20.0830
Shen, P., Bai, J., and Guishan, L. I., (2020). Integrated geosteering technology of logging and orientation in deep CBM horizontal well. J. China Coal Soc. 45 (7), 2491–2499. doi:10.13225/j.cnki.jccs.dz20.0830
Sun, Q., Zhao, Q., and Jiang, X., (2021). Prospects and strategies of CBM exploration and development in China under the new situation. J. China Coal Soc. 46 (1), 65–76. doi:10.13225/j.cnki.jccs.2020.1579
Tang, J., Wu, X., and Bao, Z. H., (2006). Effect of geogenic emission of methane on the atmosphere. Geol. Sci. Technol. Inf. 25 (2), 75–82.
Tang, X. Y., and Li, J. L. (1990). Atmospheric enviromental chemistry, 48-51. Beijing: Higher Education Press, 305–306.
Wu, T., Ming, W. E. I., and Guang, L. I., (2014). Mechanism analysis of the influence of methane content on the atmospheric structure and rainstorm. Sci. Technol. Eng. 14 (23), 153–157. doi:10.3969/j.issn.1671-1815.2014.23.028
Xue, C., Xue, Y., and Ji, X. (2020). Study on dynamic evolution of social ecological system risk in CBM development based on Choquet–Brusselato. Min. Saf. Environ. Prot. 47 (4), 116–121. doi:10.19835/j.issn.1008-4495.2020.04.023
Zhang, Y. (2011). Diffusion law and security-related issues research of the coal bed methane leaking from the well. Qingdao: China University of Petroleum East China, 45.
Zheng, Q. (2020). The geological characteristics of coal seam and controls on coal gas in Yongju Coal Mine, Shanxi Province. Sci. Technol. Eng. 20 (24), 9830–9834.
Zhou, G., Lin, R., and Sun, D., (2016). Study on greenhouse gas emission factors of wellhead casing. Chem. Eng. Equip. 12 (4), 126–128.
Keywords: coalbed methane well, methane emission, gas-liquid two-phase flow, single gas phase flow, multiple linear regression
Citation: Dong Q, Wang S, Ma J, Lyu S and Lu W (2023) Methane emission characteristics and model of CBM wells. Front. Earth Sci. 10:1037985. doi: 10.3389/feart.2022.1037985
Received: 06 September 2022; Accepted: 26 October 2022;
Published: 11 January 2023.
Edited by:
Hongtu Zhang, Henan Polytechnic University, ChinaReviewed by:
Xing Yi, Nagaoka University of Technology, JapanZhu Li, Taiyuan University of Technology, China
Copyright © 2023 Dong, Wang, Ma, Lyu and Lu. This is an open-access article distributed under the terms of the Creative Commons Attribution License (CC BY). The use, distribution or reproduction in other forums is permitted, provided the original author(s) and the copyright owner(s) are credited and that the original publication in this journal is cited, in accordance with accepted academic practice. No use, distribution or reproduction is permitted which does not comply with these terms.
*Correspondence: Jinkui Ma, Mjg5MDA1NTU3QHFxLmNvbQ==