 Zhiwei Wang
 Li-Yun Fu
 Shikai Jian
 Wubing Deng1,2
94% of researchers rate our articles as excellent or good
Learn more about the work of our research integrity team to safeguard the quality of each article we publish.
Find out more
ORIGINAL RESEARCH article
Front. Earth Sci., 17 January 2023
Sec. Solid Earth Geophysics
Volume 10 - 2022 | https://doi.org/10.3389/feart.2022.1035735
This article is part of the Research TopicDigital Rock Physics and Machine LearningView all 10 articles
Synchronous prestack inversion technology has been widely used to predict the fluid and lithological properties of reservoirs. Its prediction accuracy depends on the seismic data quality. Ultra-deep carbonate reservoirs in the Shunbei area of the Tarim Basin were used as research objects. Based on the shear wave (S-wave) prediction method, petrophysical logging analysis was carried out to select the physical property-sensitive elastic parameters. A physical property indicator with porosity as the target curve was constructed to quantitatively characterize the differences in physical properties in this area. The signal-to-noise ratio (SNR) and resolution of the dataset were improved by preprocessing the seismic and logging data. P- and S-wave impedances and densities obtained from prestack synchronous inversion, which integrate the physical property indicator model. Spatial distribution and transverse variation of the physical parameters of the Ordovician carbonate reservoirs are described. The planar distribution of reservoirs can be effectively predicted.
The Shunbei Oilfield is located in the northwest of the Shuntuoguole Low Uplift, which is in the transitional zone between the central and northern regions of the Tarim Basin. Under the influence of multi-stage tectonic movements, two sets of main strike–slip faults and several secondary faults have been formed. The cave-fracture system developed in the Ordovician carbonate rocks at depths below 7,000 m is characterized by strong heterogeneity and local connectivity, which creates favorable conditions for hydrocarbon migration and accumulation. This study aims to present a method for predicting the spatial distribution of favorable reservoirs by incorporating logging, petrophysics, and seismic methods, which is of great significance for oil and gas exploration in this area.
Petrophysics is vital for helping quantitative interpretation by using seismic data; it links core sample, logging, and seismic information to reservoir properties. Rock physics allows for direct observation of the internal structure of the subsurface material by using CT and SEM (Wu et al., 2019a; b, 2020) and allows for various in situ measurements of the elastic properties of rocks and the corresponding seismic responses to establish a theoretical model that can help in reservoir characterization (Ba et al., 2017; Zhang et al., 2021, 2022). We determined the sensitive parameters related to physical properties using a crossplot of multiple elastic parameters of rock physics (e.g., Wang and Morozov, 2019), with the porosity curve as the target curve for constructing the indicator factors of physical properties, and quantitatively characterized the physical properties in this area.
The complexity of the deep Cambrian–Ordovician oil and gas transport systems makes geophysical predictions challenging (Ding et al., 2020; Wang et al., 2020; Mu et al., 2021). Prestack synchronous inversion can simultaneously obtain the P-wave impedance, S-wave impedance, and density from the CRP gather. Due to the complexity of the Zoeppritz equation, Aki and Richards (1980) proposed the Zoeppritz approximation. Yin et al. (2014) established a statistical petrophysical model to characterize the relationship between elastic impedance and reservoir physical parameters and determined the inversion of reservoir physical parameters through the Bayesian method. Lang and Grana (2018) developed a prediction method for seismic AVO physical parameters based on Bayesian linear inversion using the first-order approximation model of the Gassmann equation. At present, most of these methods are aimed at clastic reservoirs.
In this study, based on the physical indicator factors of the carbonate reservoir, a model-driven prestack synchronous inversion method is proposed to quantitatively characterize the reservoir’s physical properties. The geological background of the Shunbei Oilfield is summarized, and the complex structural characteristics of fault-karst gas reservoirs are pointed out. Second, shear wave prediction was carried out via preprocessing and analysis of logging data. A multiple elastic parameter crossplot was created, and the physical property-sensitive elastic parameters were optimized, in order to construct a physical property indicator. Finally, using the prestack synchronous inversion data of P-wave velocity, S-wave velocity, and density, combined with the constructed indicator of physical properties, we predicted the spatial and planar distribution of the 405 km2 Ordovician Yijianfang–Yingshan Formation reservoir near the Shunbei No. 5 fault zone.
As shown in Figure 1, the Shuntoguele Low Uplift is connected to the Tabei Uplift in the north, the Tazhong Uplift in the south, the Manjiaer Depression in the east, and the Awati Depression in the west, and it extends to the Shunnan Slope of the Guchengxu Uplift in the southeast (Liu et al., 2020; Lu et al., 2020; Li, 2022; Li et al., 2022). The study area comprises the dotted white box of Figure 1, covering 405 km2, and is magnified in the lower right inset. The study area contains seven wells along the Shunbei No. 5 strike–slip fault zone in the A–B section in the NW direction.
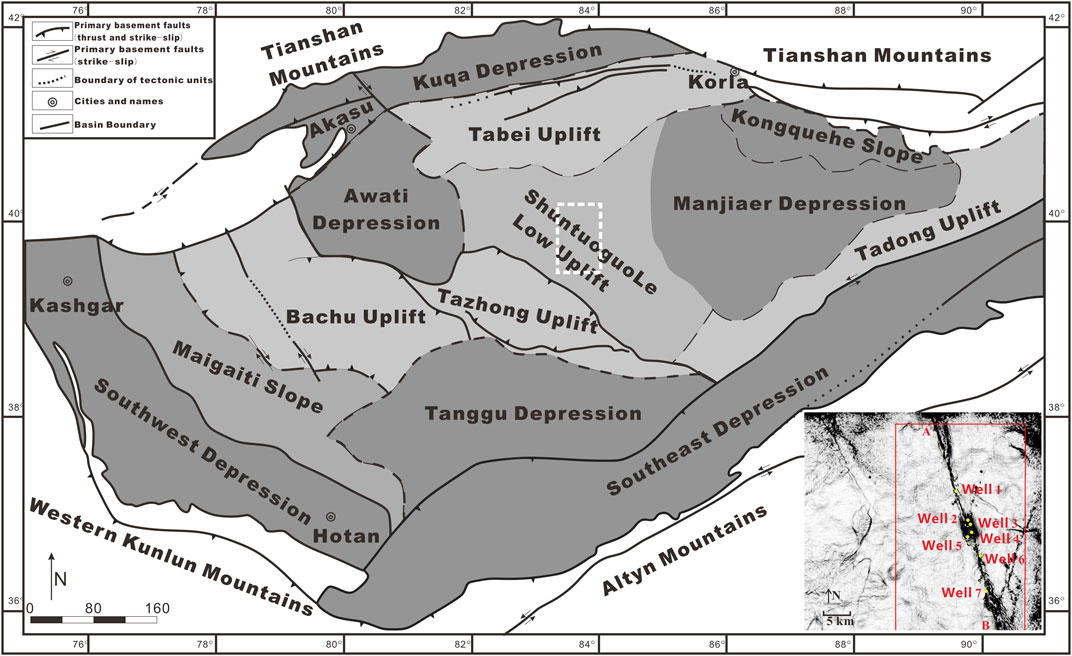
FIGURE 1. Map showing the location of the Shunbei oil field and main tectonic units in the Tarim Basin (modified by Deng et al., 2019). The inset (lower right) corresponds to the location of the white dotted box, showing the distribution of strike–slip fault zones and wells in the study area.
Recent exploration has shown that carbonate reservoirs in the Shuntuoguole area developed mainly in the upper section of the Ordovician Yijianfang–Yingshan Formation. Figure 2 shows this area’s stratigraphic, seismic horizon, and lithographic information. Due to tectonic activity, the pore geometry in these reservoirs is very complex and exhibits significant diversity in shape and size, high-angle and steep fault-related dissolution caves, high-angle structural fractures, pore-expansion dissolution fractures, partially filled fractures, dissolution pores, inter-crystalline pores, and micro-fractures. These fractures and pores are commonly unevenly distributed. Dissolution caves, secondary fractures, and solution pores along fractures are the dominant types of spaces in these reservoirs (Yu et al., 2016; Lu et al., 2017; Yuan et al., 2021).
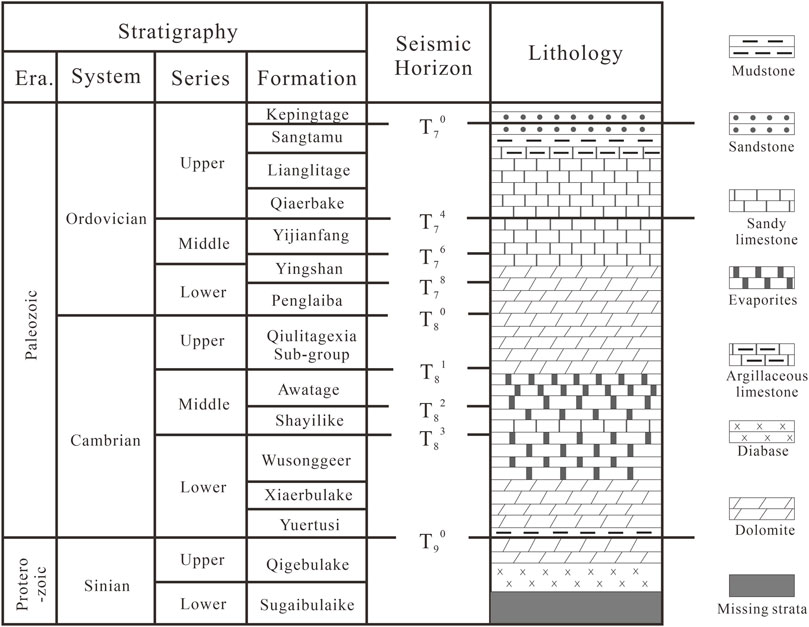
FIGURE 2. Stratigraphic, seismic horizon, and lithologic information of the Shunbei Oilfield (slightly modified from Deng et al., 2019).
High-quality well log data are a prerequisite for seismic inversion and reservoir property prediction (Jiang et al., 2014). Thus, abnormal data on well logs must be identified to allow for correction of environmental effects before using such data alongside seismic data. In addition, virtual porosity and error fusion technology (Wang et al., 2011) can be introduced to predict shear wave velocity, which provides the basic data for prestack synchronous inversion.
The petrophysical analysis is the basis for prestack inversion and enables the linking of seismic, well log, and reservoir property data. Through petrophysical analysis, crossplots of elastic parameters can be drawn to understand the seismic and logging response characteristics of oil and gas layers and aquifers. It can also help identify elastic parameters that are sensitive to lithology, physical properties, and fluid in the respective area (Ma et al., 2021; Tan et al., 2021; Figure 3).
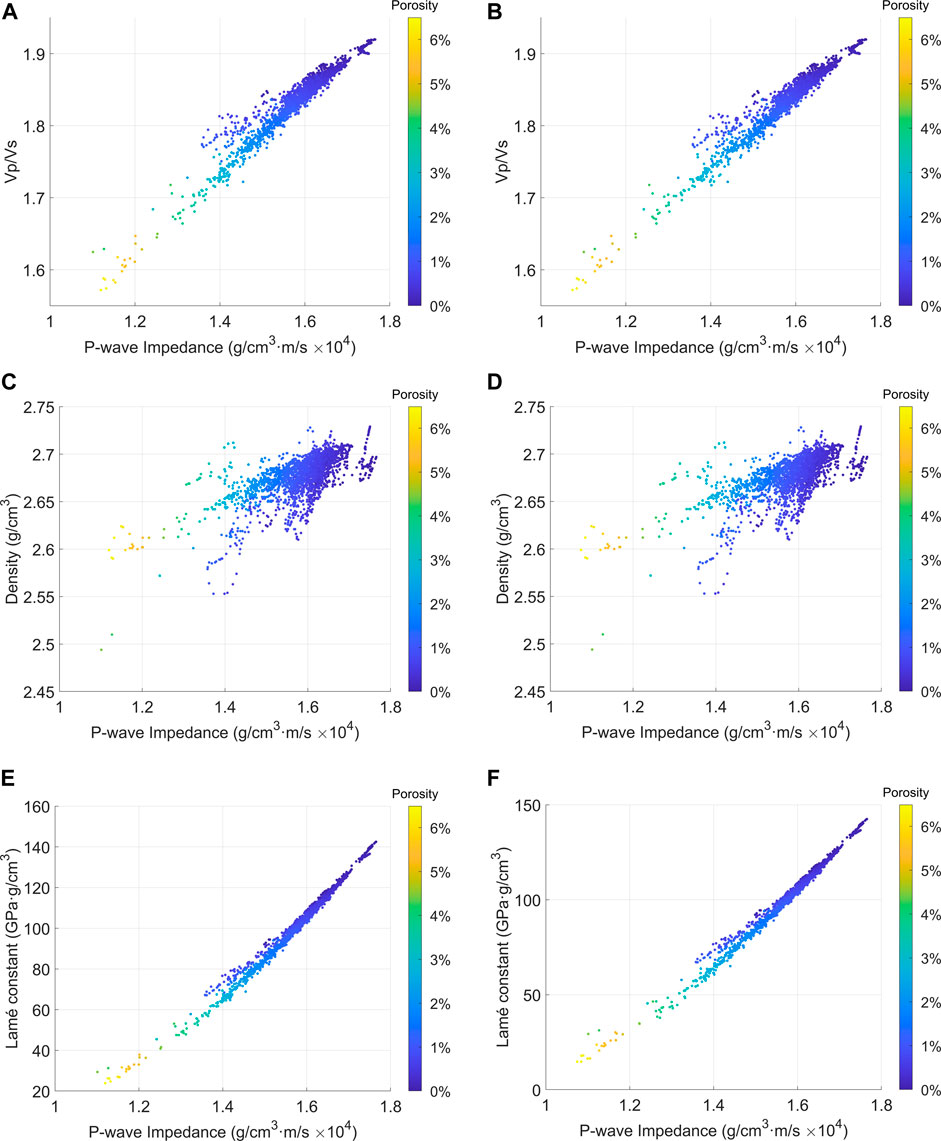
FIGURE 3. Crossplots of P-wave impedance, P-to-S-wave velocity ratio, and porosity (A) before and (B) after fluid substitution. Crossplots of P-wave impedance, density, and porosity (C) before and (D) after fluid substitution. Crossplots of P-wave impedance, Lamé constant, and porosity (E) before and (F) after fluid substitution.
This analysis is valuable for predicting the physical property distribution of a reservoir and for detecting fluids. Therefore, data from core samples and well logs were analyzed to identify carbonate reservoirs and surrounding rocks with good physical properties (e.g., high porosity). These data were then used to further distinguish the physical properties of oil-containing layers from those of aquifers. Crossplots of the P-to-S-wave velocity ratio (Vp/Vs) and P-wave impedance (PI) vs. porosity, density and PI vs. porosity, and Lamé constant and PI vs. porosity before fluid substitution are shown in Figures 3A,C,E, respectively. Carbonate reservoirs associated with good physical properties are characterized by a low P-wave impedance, S-wave impedance (SI), density, and Lamé constant.
In the process of drilling Well 1 in the study area, no effective logging curve was generated. Therefore, it is difficult to analyze fluid-sensitive elastic parameters using the measured logging curve. Due to this, Well 4 with a relatively complete curve is selected, and the aquifer is replaced by an oil layer using fluid replacement technology in a region, and the elastic parameters of the oil layer were obtained. Subsequently, a petrophysical analysis was conducted to identify elastic parameters that are sensitive to fluid properties. Crossplots of Vp/Vs and PI vs. porosity, density and PI vs. porosity, and Lamé constant and PI vs. porosity after fluid substitution are shown in Figures 3B,D,F, respectively. The Vp/Vs, density, and Lamé constant of the reservoir decreased after the fluid substitution.
A reservoir with high porosity is a good reservoir in the study area. It is difficult to determine the physical characteristics of carbonate using PI or SI alone. Therefore, PI and SI are required to conduct crossdrawing (Figure 4).
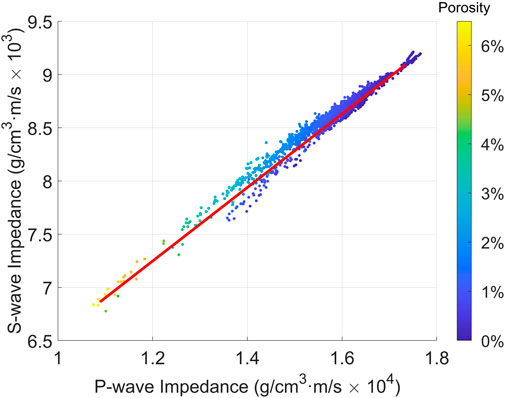
FIGURE 4. Crossplots of P-wave impedance, S-wave impedance, and porosity.
In order to better visually distinguish between good and poor reservoirs, a new physical property indicator (PPI) is proposed in this study:
where ϕ is the rotation angle (the clockwise rotation angle ϕ based on the red line in Figure 4). By changing the angle, the relationship between the porosity and the largest angle can be determined so that the physical property indicator can be determined. As an example, for Well 4, we chose a target porosity curve and a correlation curve to identify property-indicating factors and quantitatively characterize the physical properties of this area. As shown in Figure 5, the curve of the variation of the physical property indicator with depth agrees with the variation of porosity with depth.
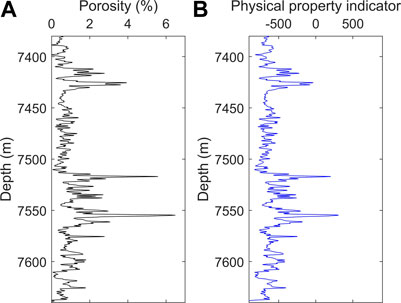
FIGURE 5. (A) Porosity and (B) the physical property indicator varied with depth in Well 4.
The crossplot of the PI, physical property indicator, and porosity curve after rotating the coordinates by a certain angle is shown in Figure 6. It can be seen that the physical property indicator is a sensitive elastic parameter that can distinguish between good and poor physical properties.
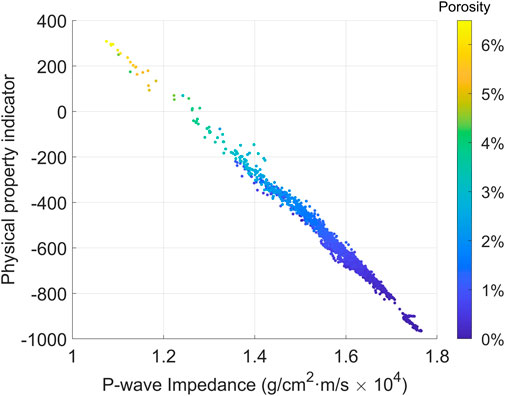
FIGURE 6. Crossplot of the PI and physical property indicator vs. porosity for Well 4.
The seismic gathers of ultra-deep layers in the Shunbei area contain multiple reflections and random noise interferences, which leads to a low SNR. We use the prestack gather optimization to eliminate most multiples to increase the SNR, align events, and increase the dominant frequency, thereby providing high-quality seismic data for subsequent prestack inversion for various physical properties. Simultaneous prestack inversion can derive P- and S-wave velocity, as well as density. These parameters enable the establishment of a physical property indicator according to Section 3.2.
Figure 7 exhibits the inversion results along the N–S direction of Well 4. Well 4 had small-scale leakages, but no large-scale reservoirs were found. The physical property indicator and density inversion results indicate that only relatively weak anomalies occurred at Well 4, which is consistent with the drilling data.
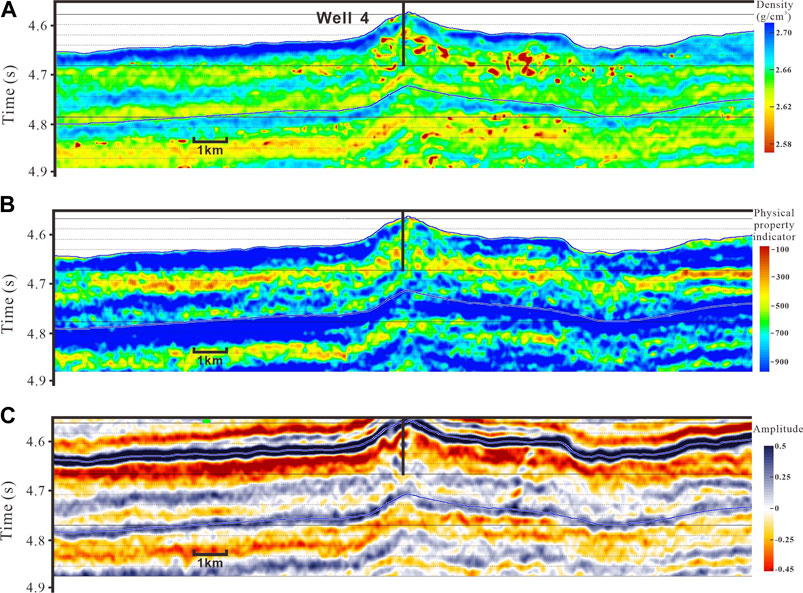
FIGURE 7. Profiles along the N–S direction of Well 4 of (A) density, (B) the physical property indicator, and (C) stack seismic traces.
Figure 8 shows the inversion results along the N–S direction of Well 6. Drilling of Well 6 resulted in large-scale leakages. From the profile of the physical property indicator and density, significant anomalies are observed near Well 6, which is consistent with the drilling data.
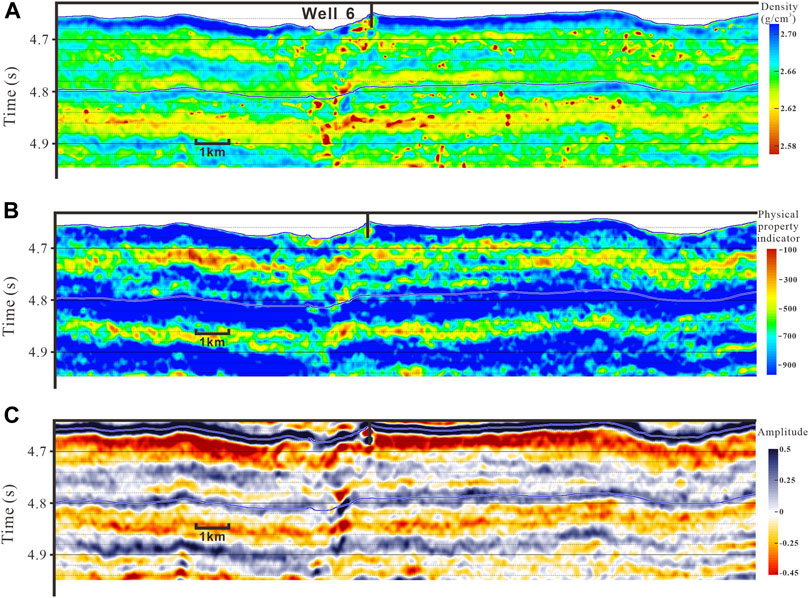
FIGURE 8. Profiles along the N–S direction of Well 6. (A) Density, (B) the physical property indicator, and (C) stack seismic traces.
Profiles of the density, physical property indicator, and stack seismic profile along the main fault zone are shown in Figure 9. Wells 1, 2, 4, and 6 were aligned in an NW–NE direction. Well 1 was partially affected by leakage in the wellbore and the profiles of the physical property indicator and density highlight severe anomalies. In Well 2, the wellbore was unaffected, and thus, profiles of the physical property indicator and density display weak anomalies. Well 4 was impacted by a minor leak in the wellbore, and no major reservoirs were found during drilling. The weak anomalies shown in the profiles of the physical property indicator and density were confirmed by the results from drilling. In Well 6, the wellbore was affected by severe leakage during drilling, and prominent anomalies were observed in the profiles of the physical property indicator and density. Overall, the inversion results are consistent with those from drilling.
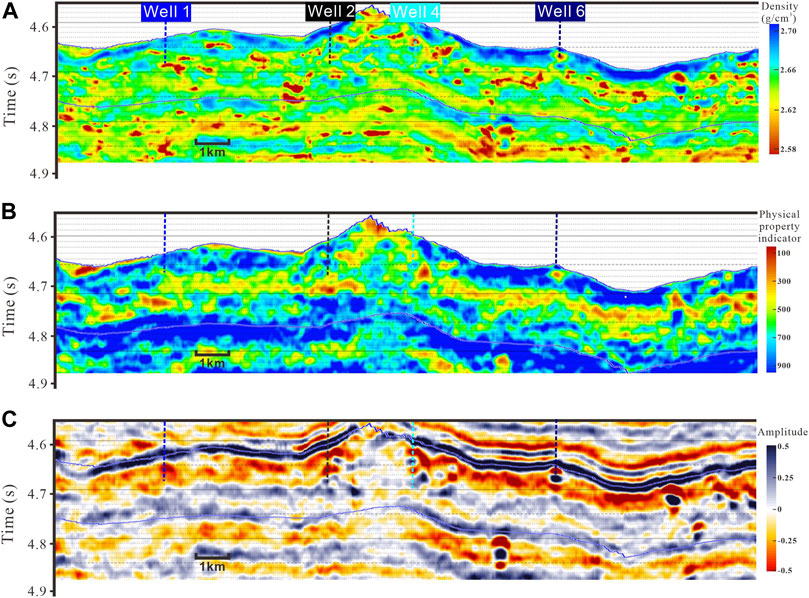
FIGURE 9. Profiles along the main fault zone based on (A) density, (B) the physical property indicator, and (C) stack seismic traces.
An average density profile for the T74–T76 formation is shown in Figure 10A. Anomalies are concentrated near the main fault zone and consistent with the geology setting of the area. A petrophysical analysis confirmed that low-density values indicate the reservoir with high-quality physical properties and the presence of oil-bearing layers, and these findings are consistent with results from drilling in the area. Figure 10B displays a physical property indicator profile for the T74–T76 formation. Sites in red represent those characterized by good physical properties. Reservoirs with good physical properties are concentrated near the main fault zone, which is also consistent with the area’s geology setting.
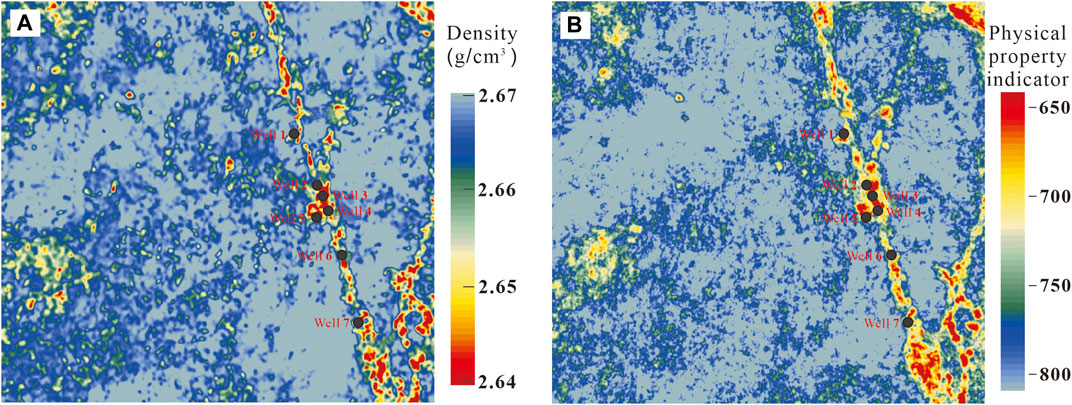
FIGURE 10. Profile of the average parameter values for the T74–T76 formation, including the (A) inversion-derived density and (B) the physical property indicator.
Petrophysical analysis of crossplots demonstrated that reservoirs with good physical properties (high porosity) have the following characteristics: low P-wave impedance, low S-wave impedance, low density, low P-to-S-wave velocity ratio, and low Lamé constant. These characteristics are sensitive indicators of the physical properties of reservoirs. Following the substitution of oil with water, the P-to-S-wave velocity ratio, density, and Lamé constant decreased. The porosity curve is selected as the target curve to construct a physical property indicator for quantification of physical properties in the study area. A petrophysical analysis confirmed that the physical property indicator is suitable for distinguishing between good and poor physical properties. The P-wave velocity, S-wave velocity, and density were obtained by using simultaneous prestack inversion. The density near the main fault zone is small. It showed that low density is indicative of a high-quality reservoir and the presence of oil-bearing layers based on the petrophysical analysis. These observations are consistent with results from drilling in the study area.
The original contributions presented in the study are included in the article/Supplementary Material; further inquiries can be directed to the corresponding author.
ZW and L-YF presented the idea and design of the research. ZW wrote the original draft manuscript; WD and SJ led the data analysis. All authors contributed to the original article revision and approved it for publication.
The research was supported by the Strategic Priority Research Program of the Chinese Academy of Sciences (Grant No. XDA14010303), the National Natural Science Foundation of China (Grant No. 42104112), 111 project “Deep-Superdeep Oil & Gas Geophysical Exploration” (B18055), the Major projects during the 14th Five-year Plan period (Grant No. 2021QNLM020001), and the Fundamental Research Funds for the Central Universities (Grant No.20CX06087A).
Author SJ was employed by Petroleum Exploration and Development Research Institute of PetroChina Tarim Oil Field Company.
The remaining authors declare that the research was conducted in the absence of any commercial or financial relationships that could be construed as a potential conflict of interest.
All claims expressed in this article are solely those of the authors and do not necessarily represent those of their affiliated organizations, or those of the publisher, the editors, and the reviewers. Any product that may be evaluated in this article, or claim that may be made by its manufacturer, is not guaranteed or endorsed by the publisher.
Aki, K., and Richards, P. G. (1980). Quantitative seismology: Theory and methods. San Francisco: Cambridge University Press.
Ba, J., Xu, W. H., Fu, L. Y., Carcione, J. M., and Zhang, L. (2017). Rock anelasticity due to patchy saturation and fabric heterogeneity: A double double-porosity model of wave propagation. J. Geophys. Res. Solid Earth 122 (3), 1949–1976. doi:10.1002/2016JB013882
Deng, S., Li, H. L., Zhang, Z. P., Zhang, J. B., and Yang, X. (2019). Structural characterization of intracratonic strike-slip faults in the central Tarim Basin. Am. Assoc. Pet. Geol. Bull. 103 (1), 109–137. doi:10.1306/06071817354
Ding, Y., Du, Q. Z., Fu, L. Y., and Jian, S. K. (2020). Reliability analysis of seismic attribute in the detection of fault-karst. Interpretation 8 (4), SP61–SP70. doi:10.1190/INT-2019-0299.1
Jiang, R., Zeng, Q. C., Huang, J. Q., Gan, L., and He, P. (2014). Application of rock physics analysis in pre-stack seismic reservoir prediction. Oil Geophys. Prospect. 49 (2), 322. doi:10.13810/j.cnki.issn.1000-7210.2014.02.016
Lang, X., and Grana, D. (2018). Bayesian linearized petrophysical AVO inversion. Geophysics 83, M1–M13. doi:10.1190/geo2017-0364.1
Li, H. (2022). Development characteristics of silurian strike-slip faults and fractures and their effects on drilling leakage in Shunbei area of Tarim Basin. Front. Earth Sci. (Lausanne). 10, 938765. doi:10.3389/feart.2022.938765
Li, Z. J., Fu, L. Y., Liu, J., Wang, Z. W., and Jian, S. K. (2022). Azimuthal P-P prestack seismic prediction of fractures for superdeep carbonate reservoirs in northwest China. Mar. Petroleum Geol. 137, 105485. doi:10.1016/j.marpetgeo.2021.105485
Liu, Y. C., Qiu, N. S., Chang, J., Jia, J. K., Li, H. L., and Ma, A. L. (2020). Application of clumped isotope thermometry to thermal evolution of sedimentary basins: A case study of Shuntuoguole area in Tarim Basin. Chin. J. Geophys. 63 (2), 597–611. doi:10.6038/cjg2020N0152
Lu, X., Wang, Y., Tian, F., Li, X. H., Yang, D. B., Li, T., et al. (2017). New insights into the carbonate karstic fault system and reservoir formation in the southern Tahe area of the Tarim Basin. Mar. Petroleum Geol. 86, 587–605. doi:10.1016/j.marpetgeo.2017.06.023
Lu, X., Wang, Y., Yang, D. B., and Wang, X. (2020). Characterization of paleo-karst reservoir and faulted karst reservoir in Tahe Oileld, Tarim Basin, China. Adv. Geo-Energy Res. 4 (3), 339–348. doi:10.46690/ager.2020.03.11
Ma, R., Ba, J., Carcione, J., Lebedev, M., and Wang, C. (2021). Experimental study on petrophysical properties as a tool to identify pore fluids in tight-rock reservoirs. Front. Earth Sci. (Lausanne). 9, 652344. doi:10.3389/feart.2021.652344
Mu, X. R., Huang, J. P., Fu, L. Y., Jian, S. K., Liu, B., and Wang, Z. Y. (2021). Diffraction imaging for the fault-karst structure by least-squares reverse time migration. Interpretation 9 (2), T385–T394. doi:10.1190/INT-2020-0146.1
Tan, W. H., Ba, J., Fu, L. Y., Carcione, J. M., and Zhou, X. (2021). 3D rock physics template analysis and “sweet spot” prediction of Longmaxi-Wufeng organic-rich shale. Chin. J. Geophys. 64 (8), 2900–2915. doi:10.6038/cjg2021O0380
Wang, J. W., Zhang, E. H., and Xie, C. L. (2011). Prediction of shear wave velocity with optimized Xu-White Model based on virtual porosity. Fault-Block Oil Gas Field 18 (4), 445
Wang, Y., and Morozov, I. B. (2019). Time-lapse acoustic impedance variations during CO2 injection in Weyburn oilfield, Canada. Geophysics 85 (1), 1–M13. doi:10.1190/GEO2019-0221.1
Wang, Z. Y., Huang, J. P., Li, Z. C., Fu, L. Y., Luo, W., and Mu, X. (2020). Velocity model estimation of karstic fault reservoirs using full-waveform inversion accelerated on graphics processing unit. Interpretation 8 (4), SP191–SP203. doi:10.1190/INT-2019-0304.1
Wu, Y., Lin, C., Yan, W., Liu, Q., Zhao, P., and Ren, L. (2020). Pore-scale simulations of electrical and elastic properties of shale samples based on multicomponent and multiscale digital rocks. Mar. Petroleum Geol. 117, 104369. doi:10.1016/j.marpetgeo.2020.104369
Wu, Y., Tahmasebi, P., Lin, C., Munawar, M. J., and Cnudde, V. (2019a). Effects of micropores on geometric, topological and transport properties of pore systems for low-permeability porous media. J. Hydrology 575, 327–342. doi:10.1016/j.jhydrol.2019.05.014
Wu, Y., Tahmasebi, P., Lin, C., Zahid, M. A., Dong, C., Golab, A. N., et al. (2019b). A comprehensive study on geometric, topological and fractal characterizations of pore systems in low-permeability reservoirs based on SEM, MICP, NMR, AND X-ray CT experiments. Mar. Petroleum Geol. 103, 12–28. doi:10.1016/j.marpetgeo.2019.02.003
Yin, X., Cui, W., Zong, Z., and Liu, X. (2014). Petrophysical property inversion of reservoirs based on elastic impedance. Chin. J. Geophys. 57 (12), 4132–4140. doi:10.6038/ejg20141224
Yu, J., Li, Z., and Yang, L. (2016). Fault system impact on paleokarst distribution in the Ordovician Yingshan formation in the central Tarim Basin, northwest China. Mar. Petroleum Geol. 71, 105–118. doi:10.1016/j.marpetgeo.2015.12.016
Yuan, H., Chen, S., Neng, Y., Zhao, H., Xu, S., Wang, X., et al. (2021). Composite strike-slip deformation belts and their control on oil and gas reservoirs: A case study of the northern part of the Shunbei 5 strike-slip deformation belt in Tarim Basin, northwestern China. Front. Earth Sci. (Lausanne). 9, 755050. doi:10.3389/feart.2021.755050
Zhang, L., Ba, J., and Carcione, J. M. (2021). Wave propagation in infinituple-porosity media. J. Geophys. Res. Solid Earth 126 (4), e2020JB021266. doi:10.1029/2020JB021266
Keywords: shear wave prediction, physical property indicator model, simultaneous prestack inversion, Shunbei ultra-deep reservoirs, rock physical analysis
Citation: Wang Z, Fu L-Y, Jian S and Deng W (2023) Application of a model-driven simultaneous prestack inversion of rock physical properties in ultra-deep Ordovician carbonate reservoirs in the Shunbei area. Front. Earth Sci. 10:1035735. doi: 10.3389/feart.2022.1035735
Received: 03 September 2022; Accepted: 31 October 2022;
Published: 17 January 2023.
Edited by:
Yuqi Wu, China University of Petroleum (East China), ChinaCopyright © 2023 Wang, Fu, Jian and Deng. This is an open-access article distributed under the terms of the Creative Commons Attribution License (CC BY). The use, distribution or reproduction in other forums is permitted, provided the original author(s) and the copyright owner(s) are credited and that the original publication in this journal is cited, in accordance with accepted academic practice. No use, distribution or reproduction is permitted which does not comply with these terms.
*Correspondence: Li-Yun Fu, bGZ1QHVwYy5lZHUuY24=
Disclaimer: All claims expressed in this article are solely those of the authors and do not necessarily represent those of their affiliated organizations, or those of the publisher, the editors and the reviewers. Any product that may be evaluated in this article or claim that may be made by its manufacturer is not guaranteed or endorsed by the publisher.
Research integrity at Frontiers
Learn more about the work of our research integrity team to safeguard the quality of each article we publish.