- 1Department of Geology and Geophysics, University of Utah, Salt Lake City, UT, United States
- 2Los Alamos National Laboratory, Los Alamos, NM, United States
Natural arches are culturally valued rock landforms common in sedimentary rocks of the Colorado Plateau and additionally occur broadly around the world. Recent notable collapses of some of these landforms have highlighted the need to better understand the mechanics of their failure. While environmentally driven weathering has been the focus of most previous studies of arch collapse, comparably little attention has been given to anthropogenic vibration sources and how these often slight- to moderate-magnitude shaking events might steadily weaken arches over time. We collected 12–15 months of continuous ambient vibration data from arches and nearby bedrock in both anthropogenically ‘noisy’ and ‘quiet’ locations and used these datasets to develop an annual model of arch peak ground velocity based on magnitude-cumulative frequency distributions. Working from these models, we added vibration events of varying magnitude or frequency of occurrence, informed by field data, imitating arch vibration in response to different anthropogenic activities such as helicopter flights or induced earthquakes. We then applied subcritical fracture mechanics principles to predict annual crack growth rates in an idealized arch under these different vibration conditions. Our results demonstrate that in a single year, cracks grow minimally longer (∼1%) in ‘noisy’ environments than in areas not experiencing anthropogenic vibration energy. Few (1+) 30-s moderate-magnitude events (∼15 mm/s) or many (>37,000) 30-s low-magnitude events (∼2 mm/s) cause markedly increased crack growth. Our approach provides a valuable new framework for assessing the range and frequency of occurrence of vibrations experienced by an arch, and for predicting arch damage. Our results, in turn, yield important new outputs applicable in support of conservation management of these and similar landforms world-wide under exposure to a range of human-induced vibration activity.
1 Introduction
Arches experience gravitational stresses that are often well below typical values of rock strength (in both compression and tension; Moore et al., 2020), yet we observe cracks and partial arch collapses in-situ (Figure 1). Notable recent collapses of culturally valued landforms include Malta’s Azure Window in 2017 (Satariano and Gauci, 2019), Arch Rock, California, United States, in 2015 (killing one person and severely injuring another; San Francisco Chronical, 2015), the partial collapse of Landscape Arch, Utah, United States, in 1991 (Deseret News, 1991), and the total collapse of Wall Arch, Utah, United States, in 2008 (Willis, 2009). Fractures of all scales permeate rock masses, and new crack growth with accompanying rockfall are often observed prior to landform collapse, driven strongly by changes in moisture (Nara et al., 2012; Voigtländer et al., 2018) and temperature (Atkinson, 1984; Gischig et al., 2011). However, aside from the contribution of climate change on crack growth in rocks (Eppes et al., 2020), few studies have quantitatively analyzed the impact of anthropogenic activity on structural degradation of rock landforms, specifically rock arches (King, 2001; King and DeMarco, 2003; Finnegan et al., 2021, Finnegan et al., 2022).
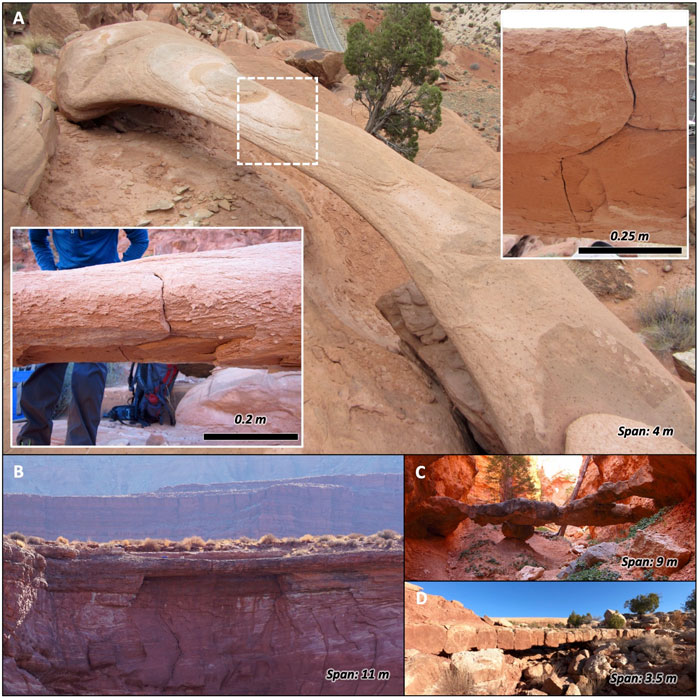
FIGURE1. Example beam-like rock arches, with various observed tensile cracks. Arch spans given in bottom corners. (A) Rainbow Arch, Arches National Park, UT (now collapsed). Scale bars shown for each inset, and dashed box shows location of inset photos. (B) Little Bridge Arch, Moab, UT. (C) Two Bridge, Bryce Canyon National Park, UT. (D) Cobblestone Natural Bridge, Arches National Park, UT.
With in-situ stresses often well below critical rock strength thresholds (Moore et al., 2020), analysis of crack propagation in rock arches requires adopting subcritical fracture mechanics concepts (Eppes and Keanini, 2017). Subcritical cracking does not employ critical equilibrium laws, but rather kinetic laws that involve description of crack geometry and stress levels to assess crack growth rates. Laboratory studies in particular show that rates of subcritical crack growth increase dramatically with increasing subcritical stress intensity factor (e.g., Eppes and Keanini, 2017; Nara et al., 2017), adhering to a power law relationship with an exponent of 60 for sandstones, possibly higher. While some discussion relates to the propagation of cracks beyond a crack-tip immediate damage accumulation zone (Brain et al., 2014), field observations from natural arches in the Colorado Plateau demonstrate that cracks in arches are present and propagating under subcritical stress conditions. These observations allow us to approximate arch stresses and crack lengths—e.g., derive stresses from displacements integrated from velocity measurements (Adams et al., 2005)—and use these data to estimate the crack intensity factor (KI), which is in turn used to estimate the rate of crack growth (e.g., Eppes and Keanini, 2017; Nara et al., 2017).
Road and railway traffic generate ground borne vibration energy across a frequency range that coincides with the natural frequencies of many rock landforms, including arches (Whiffin and Leonard, 1971; King et al., 1985; Hanson et al., 1991; Volpe National Transportation Systems Center, 2014; Díaz et al., 2017; Meng et al., 2021), and is thus capable of exciting resonance and increased amplitude vibration. Our field data indicate that trucks passing on a highway ∼175 m from an arch generate prominent spectral energy in the ∼10–30 Hz band and are able to excite resonance with peak arch velocity ∼40 μm/s; events that can occur many times per hour (Figure 2). Railways, meanwhile, generate strong ground vibration in the frequency range of ∼5–50 Hz (Quiros et al., 2016; Lavoué et al., 2020). While rail lines are less common in the Colorado Plateau than in other parts of the world, one located near Arches National Park, Union Pacific Railroad’s Cane Creek Branch, is actively used to transport potash from mining activity and uranium tailings from the bank of the Colorado River to a permanent storage area farther north (Denver and Rio Grande Western Railroad, 1970; United States Department of Energy, 2021). Helicopters, meanwhile, produce high-power airborne infrasound at frequencies that often align with the natural frequencies of arches, exciting resonance (Finnegan et al., 2021). These anthropogenic energy sources are thus able to excite resonance of rock arches and other landforms located nearby, with potentially important impacts on long-term rates of subcritical crack growth and structural degradation.
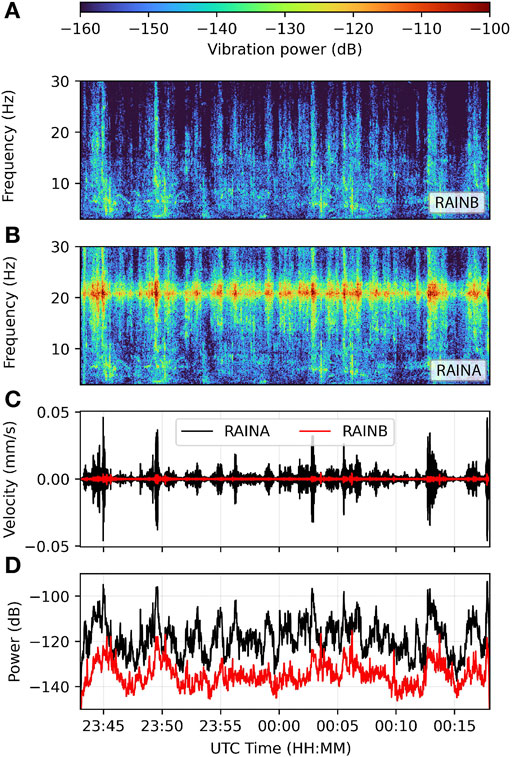
FIGURE 2. Sample of Rainbow Arch (RAINA) and Reference (RAINB) vibration data from 8 to 9 November 2017. (A) Vertical vibration velocity spectrogram of Rainbow Arch bedrock reference during a period of frequent truck passes. (B) Vertical vibration velocity spectrogram from the center-span of Rainbow Arch. (C) Vertical vibration velocity of arch and bedrock reference. (D) Vertical vibration power of arch and bedrock reference. Vibration power in panels (A), (B), and (D) is given in decibel units relative to 1 m2s−2Hz−1.
In this study, we collected continuous ambient vibration data from year-long measurements at two sites—one at the former location of a collapsed arch located near a busy highway and railroad, and another in an environment far from human activity—to compare and assess the effect of anthropogenic vibration on crack growth rates in arches. We used theory informed by field observations to compare hypothetical fracture growth in a conceptual rock arch placed in both environments and in scenarios with added anthropogenic vibration inputs. We then applied the results to understand the contribution of human activity to subcritical crack growth and progressive failure of rock landforms. We found that human-induced vibration activity can have a notable effect on crack propagation in arches, especially for events with moderately large magnitude or high frequency of occurrence.
2 Field sites
We selected two sites for continuous ambient vibration recordings: the first located at the former site of Rainbow Arch, a ∼4-m-long arch that collapsed during the winter of 2017–2018 (Figure 1), and the second located at Aqueduct Arch, spanning 24 m long (Figure 3; Geimer et al., 2022). Rainbow Arch, formed in Entrada Sandstone, was located near the Arches National Park Visitor Center parking lot near Moab, UT, ∼175 m from US Highway 191 and ∼285 m from an active railway. We measured continuous ground vibration on bedrock adjacent to the collapsed arch. Prior to collapse, we observed cracks running through the underside of the arch lintel, with a large fracture near the center where tensile stresses were anticipated to be greatest (Figure 1A; Moore et al., 2020). The other site, Aqueduct Arch, is formed in Wingate Sandstone and located far outside Moab, UT, largely isolated from human activity. At each site we deployed a 20-s Nanometrics Trillium Compact seismometer to measure continuous arch or ground vibrations sampled at 100 Hz. The seismometer recorded Aqueduct Arch vibration data from February 2017–May 2018 and from May 2019–June 2020 at the Rainbow Arch bedrock site. All seismometers were covered with a bucket to minimize wind buffeting. We did not observe a marked decrease in ground-borne vibration near the end of the Rainbow Arch site measurement due to COVID-19 pandemic lockdown responses (c.f. Lecocq et al., 2020). We also used 12 months of continuous seismic data from EarthScope Transportable Array (TA) stations S17A (Bullfrog Basin, UT) and R18A (Canyonlands National Park, UT) in 2008 for additional remote ambient vibration data, sites measured with buried Nanometrics Trillium 240 sensors sampling at 40 Hz. Arches National Park and the land therein have traditional and contemporary significance to many Native American tribes, including the Hopi, Navajo, Ute, Southern Paiute, and Zuni tribes (Stoffle et al., 2016). The landforms studied here represent a small fraction of thousands of documented arches in Utah (Van Bebber, 2013), which are an iconic part of the landscape and attract millions of visitors each year (National Park Service, 2021).
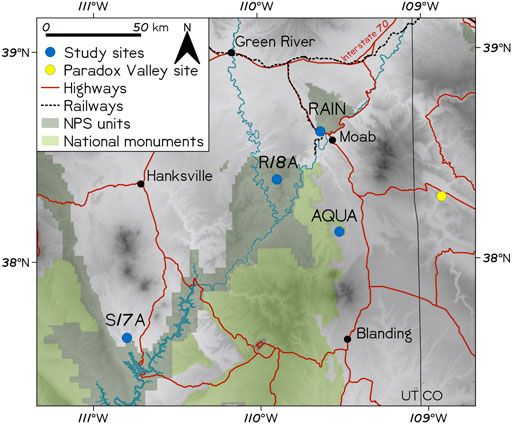
FIGURE 3. Map of field sites. RAIN: Rainbow Arch and Reference; AQUA: Aqueduct Arch; EarthScope TA stations S17A (Bullfrog Basin, UT) and R18A (Canyonlands National Park, UT); NPS: National Park Service.
3 Materials and methods
3.1 Annual arch peak ground velocity models
We began by creating peak ground velocity (PGV) magnitude-cumulative frequency (MCF) curves from continuous arch and reference vibration data. MCF curves have been traditionally used in seismology to relate the frequency of earthquakes of different magnitudes, where the relationship is a power law known as the Gutenberg-Richter Law (Gutenberg and Richter, 1954). Geologists in turn have adopted these curves for use in quantitative risk analysis for rockfall and other mass wasting events (e.g., Hungr et al., 1999). We used data from Aqueduct Arch and the former site of Rainbow Arch, along with TA stations to construct PGV MCF curves. As Rainbow Arch collapsed prior to the year-long data collection, we used arch-to-reference spectral ratios from limited ambient vibration recordings made on Rainbow Arch and nearby ground prior to its collapse in order to scale the reference MCF curve to a theoretical model representing arch vibrations over a year.
We processed vibration data in 1-h windows by detrending, demeaning, removing the instrument response, and filtering the data between 3 and 20 Hz for the ground reference datasets and 3–25 Hz for the arch datasets, in order to capture vibration at the natural frequencies (Geimer et al., 2020). We recorded the maximum instantaneous velocity within 1-min intervals over each hour and then repeated the process for all other hours in the year. Using the resulting PGV datasets, we constructed MCF curves for each station. Because the curves roll off for low-magnitude events, we fit the linear portion of each curve using a power law relationship to create a model of experienced PGV over the course of a year (Figure 4). We then applied these field results, in combination with simplified arch models that approximately describe arch geometry and modal behavior, to explore crack growth rates under different vibration conditions.
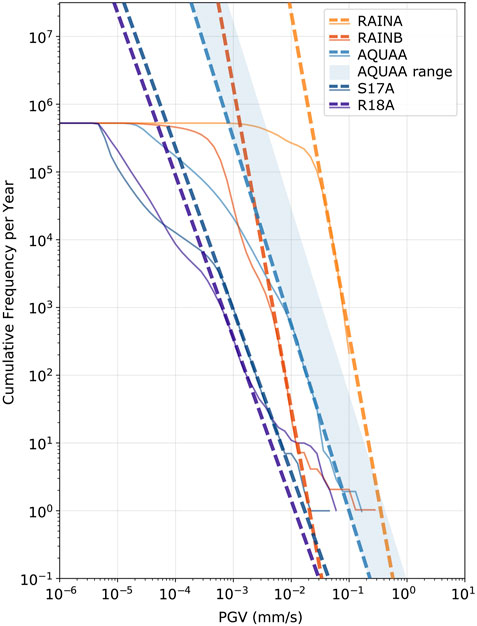
FIGURE 4. MCF curves of vibration data (solid lines) and models (dashed lines) for two arches and three bedrock reference sites. PGV is calculated at 1-min intervals from continuous ambient vibration data band-passed between 3 and 20 Hz. Aqueduct Arch (AQUAA) is the ‘quiet’ arch, located in a remote area between Moab and Blanding, UT, while Rainbow Arch (RAINA), located in Arches National Park, UT near a highway and railroad is the ‘noisy’ arch. Due to sub-optimal seismometer placement on Aqueduct Arch, the shaded area represents the range of PGV the arch experiences at the location of maximum modal displacement determined from numerical modeling (see Geimer et al., 2020; Finnegan et al., 2022). Reference data are from bedrock at the site of Rainbow Arch (RAINB) and from two TA stations located in remote areas of Southern Utah (S17A and R18A). The models are extended to estimate vibration amplitudes at longer recurrence intervals.
3.2 Conceptual crack growth model
We analyzed flat-lying arches (Figure 1) and used analytical solutions for a rectangular beam with two fixed ends (i.e., fixed-fixed supported) to compute relevant static and dynamic structural conditions. To simplify our approach, we let the beam thickness, h, and width, b, scale empirically with span, L, using measurements from real arches in our study area to constrain these approximations (Table 1; Figure 5A). We additionally selected uniform and consistent material properties, based on calibration of dynamic models (Geimer et al., 2020) and analytical expressions for the eigenfrequencies of beam-like arches; see Table 1 for all parameters used in calculations.
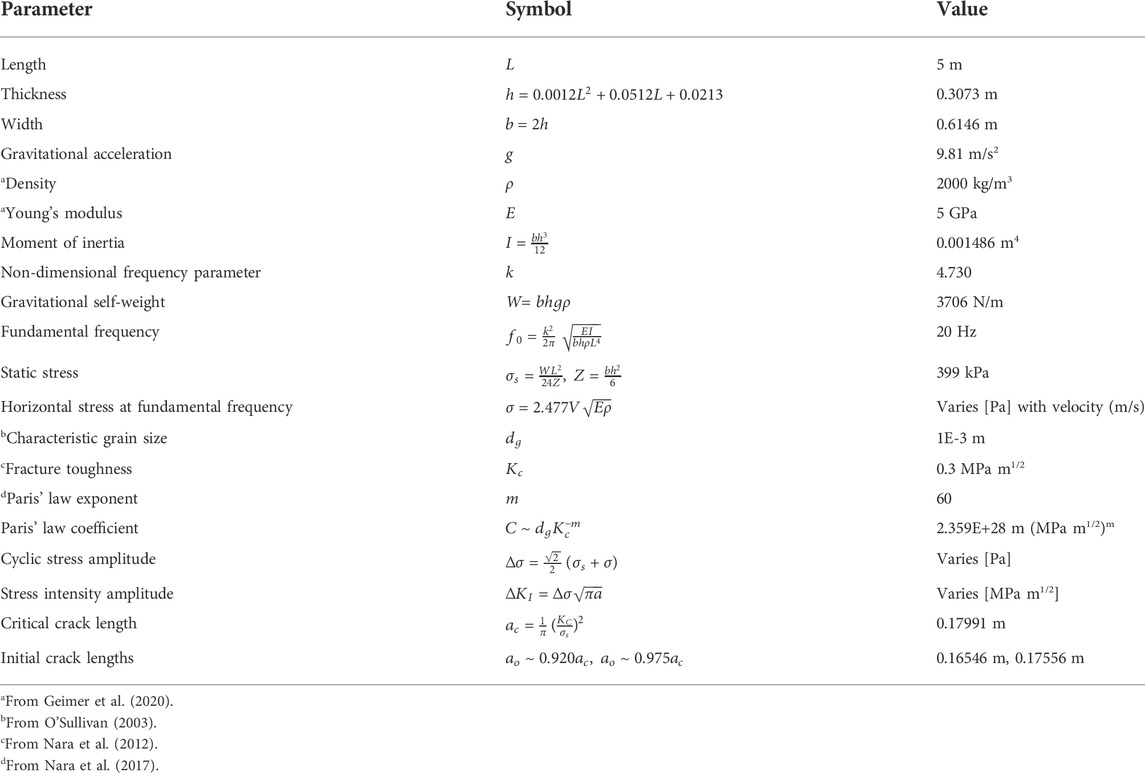
TABLE 1. Parameters used for crack growth calculations. Geometric values of length, thickness, and width developed empirically from arches in our study area.
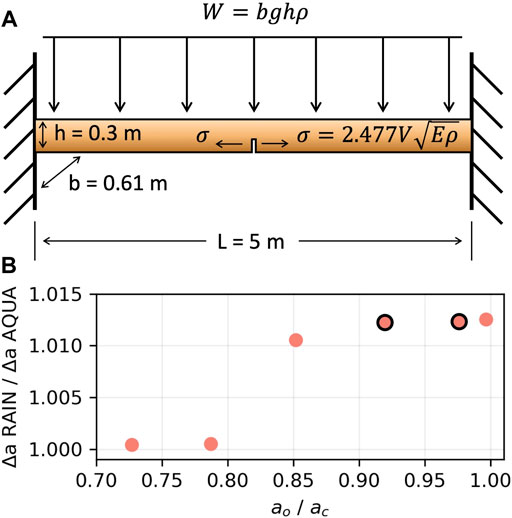
FIGURE 5. Conceptual model used for assessing the impact of anthropogenic vibration energy on crack growth. (A) Simplified arch modeled as a flat-lying fixed-fixed beam, with a tensile crack inserted in underside at center-span. W: gravitational self-weight of beam, b beam width, g: gravitational acceleration, h: beam thickness, L: beam length, V: vertical center-point vibration velocity,
We employed a pseudo-static approach to estimate dynamic stresses exerted on these beams. The approach begins by calculating the peak static stress under gravitational self-weight, then adding a load that reproduces the measured peak vibration velocity at the beam’s fundamental frequency. To calculate the static stress, we applied a distributed load, W, consisting of the weight of the beam per unit length as:
Next, we determined the pseudo-static stress,
We adopted a simplified kinetic fracture mechanics approach to compute and compare crack growth under different loading conditions. We began by varying initial crack lengths, starting with an initial crack length ∼75% of the critical crack length—the length at which failure occurs—(Gdoutos, 2005), then progressively increased the initial crack length to assess crack growth under different stages of criticality. We calculated the mode I stress intensity amplitude
We used the MCF model values for Rainbow Arch and Aqueduct Arch to create a randomized sequence of PGV of the beam in each environment for every second over 1 year, sustaining the velocity and thus added dynamic stress for the number of cycles each second corresponding to the fundamental frequency of the beam (Table 1). In a first experiment, we compared annual crack growth in a 5-m arch (Table 1) between ‘noisy’ Rainbow Arch conditions and ‘quiet’ Aqueduct Arch conditions using these annual PGV series. We employed a range of initial crack lengths, analyzing crack growth at different stages of criticality. By integrating Paris’ law and solving for number of cycles to failure using an annual average additional stress from the ‘quiet’ environment, the initial crack lengths corresponded to the beam failing in ‘quiet’ conditions in roughly 200 ky, 20 ky, 2 ky, 200 y, 20 y, and 2 y. We then considered crack growth in hypothetical situations, such as if the distance between the highway and the arch decreased in the ‘noisy’ environment. For each successive halving of the distance between the arch and road, we doubled the PGV of the beam, following a general attenuation relationship of
4 Results
4.1 Annual arch velocity models
We produced annual PGV MCF curves for five sites: Rainbow Arch reference, reconstructed Rainbow Arch at center-span, TA stations S17A and R18A, and Aqueduct Arch west abutment (Figure 4). Aqueduct Arch (
4.2 Annual crack growth
Our first crack growth comparison analyzed fracture propagation over 1 year between beams in ‘noisy’ Rainbow Arch conditions, with exposure to significant road and rail traffic, and in ‘quiet’ Aqueduct Arch conditions, where there is little human activity. We varied initial crack lengths to explore crack growth at various stages of criticality (Figure 5B), and for subsequent comparisons, we selected an initial crack length (
We next created a scenario where we analyzed the annual crack growth ratio under ‘noisy’ and ‘quiet’ conditions and considered if the highway and railroad were closer to the arch (Figure 6A). With each halving of the distance between the arch and road, we doubled the PGV of the beam. When the distance between the arch and roads was halved once, the crack growth in 1 year was ∼2.5% longer than in ‘quiet’ conditions for both initial crack lengths. When the distance was halved again, the crack growth in 1 year was ∼5.5% longer than in ‘quiet’ conditions for both initial crack lengths.
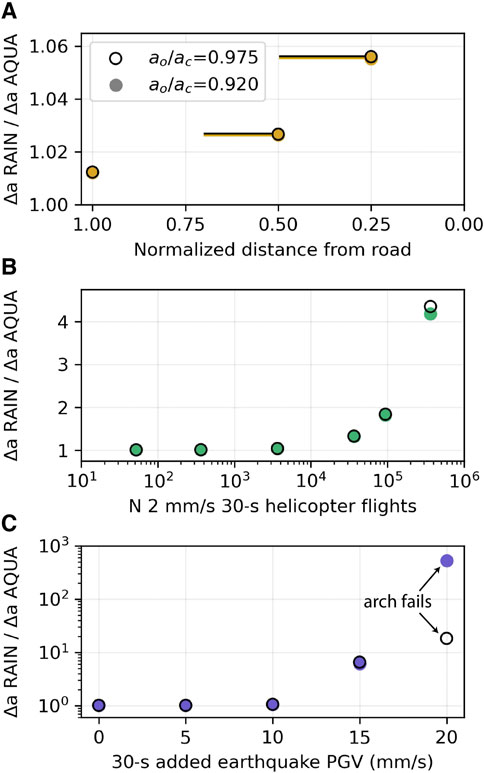
FIGURE 6. Annual crack growth ratio between ‘noisy’ Rainbow Arch (RAIN) conditions and ‘quiet’ Aqueduct Arch (AQUA) conditions under different scenarios and with different initial crack lengths. (A) Annual crack growth ratio as a function of normalized distance from road, where 1 is the current distance between the arch and the highway. Bars show range of distances for the crack growth ratios assuming different attenuation relationships. (B) Annual crack growth ratio as a function of the number of helicopter flights, beginning with 52/y (1/week) and increasing to 365,000 (1,000/day). (C) Crack growth ratio as a function of sustained PGV during a single added 30-s earthquake event. At 20 mm/s, the beam failed 15 and 2 s into the earthquake when
We then considered crack growth where in the ‘noisy’ conditions, we replaced regularly spaced 30-s vibration intervals with 2 mm/s sustained velocities to imitate arch vibration response to helicopter flights (Figure 6B). The crack began to grow substantially longer in the ‘noisy’ environment—∼33% longer than in the ‘quiet’ conditions for both initial crack lengths—when 100 flights/day were added. When 94,000 total flights were added, the annual crack growth was ∼83% longer than in ‘quiet’ conditions for both initial crack lengths. At 365,000 added helicopter flights, the annual crack growth ratio diverged slightly for the different initial conditions: crack growth in 1 year was ∼4.2 and ∼4.4 times the growth in ‘quiet’ conditions when
The final scenario we considered was replacing the last 30 s of the ‘noisy’ environment yearly PGV sequence with a single earthquake lasting 30 s (Figure 6C). When we added an earthquake which generated beam PGV of 10 mm/s, the crack growth in 1 year was ∼5.5% longer than in ‘quiet’ conditions for both initial crack lengths. With an added earthquake where the beam experienced sustained PGV of 15 mm/s for 30 s, the crack grew ∼6.1 and ∼6.5 times the growth in ‘quiet’ conditions when
5 Discussion
Our results demonstrate that moderate-magnitude single events (order cm/s) or smaller-magnitude events (order mm/s) that occur at high frequencies resulting from human activity have the ability to contribute to crack growth in, and thus structural degradation of, naturally occurring rock arches. We also found that the initial criticality of the crack, if in the range of
For the cycle-by-cycle calculations, we employed the simplest mode I stress intensity amplitude,
Comparing crack growth in a conceptual beam model over the course of a year between Rainbow Arch and Aqueduct Arch environments, we found the crack grew ∼1% more in the ‘noisy’ conditions than in ‘quiet’ conditions for both initial crack lengths analyzed. This indicates that while road and railway vibrations may have aided in the structural degradation and collapse of Rainbow Arch, the contributions were likely comparably small. When halving the distance between the arch and the road, the annual crack growth ratio doubled. However, we note that doubling the PGV with each halving of the distance between the arch and road may underestimate the change in vibration velocity. Depending on the road setting, surface, and condition, along with the speed and types of vehicles, the attenuation relationship between PGV and distance can vary from
In considering the contribution of helicopter-sourced infrasound to crack growth, results of our conceptual models indicate that compared to ‘quiet’ environments, no substantial additional crack growth occurs until there are >∼100 flights/day (∼37,000 flights/y) at sustained 2 mm/s PGV (Figure 6B). For rock arches in Arches and Canyonlands National Parks, which are exposed to several hundred helicopter overflights each year (National Park Service, 2020), our results suggest this volume of flights is not likely to modify nominal crack growth rates. However, arches in other areas, such as Rainbow Bridge, can experience >11,500 flights annually (National Park Service, 2020). Additionally, Grand Canyon National Park permits ∼94,000 flights/y (National Park Service, 2011), and the park contains many prominent landforms such as rock buttes, fins, and towers, in addition to arches. Our results demonstrate that increased crack propagation at these very high rates of occurrence could cause unwanted degradation of culturally valued rock landforms in these areas. We note that PGV levels of 2 mm/s are greater than those measured experimentally on rock towers and arches by Finnegan et al. (2021) but less than measured by King (2001) on rock towers, and we suggest these represent a relatively high level of excitation from close-proximity helicopter flights; lower PGV values are anticipated for distant overflights (Finnegan et al., 2021).
Considering the contribution of seismic activity, our results show that moderate-magnitude earthquakes can cause considerable crack growth compared to ‘quiet’ environments (Figure 6C). Adding a 30-s event with sustained beam PGV of 15 mm/s, we found the crack grew >6 times the annual crack growth under ‘quiet’ conditions. At sustained 20 mm/s PGV for 30 s, the beam failed, indicating possible arch collapse given similar initial conditions and exposure to these PGV levels. Although southern Utah, where many sandstone arches are located, is not a highly seismically active area, a nearby brine injection facility installed in the 1990s in Paradox Valley, CO (Figure 1) has induced multiple M4+ earthquakes in recent years (Block et al., 2015), with one Mw4.5. Given the natural amplification of ground motion by arches, at a distance of 85 km from the epicenter, many of these landforms could have experienced PGV of 10 mm/s during the Mw4.5 earthquake (Finnegan et al., 2022). Our results suggest that annual crack growth, in an arch similar to our conceptual model experiencing this earthquake, was likely ∼5.5% greater than in ‘quiet’ conditions without this earthquake.
Our final two scenarios where we added helicopter flights and an earthquake can also be generally applied to other situations, such as roadwork and vibrations created by construction equipment, as well as different types of blasting or possibly even sonic booms. Additionally, in considering the effects of added anthropogenic energy on arches of different sizes, we expect that smaller arches may be more susceptible to increased crack growth given an added vibrational energy than larger arches. We base this expectation on the comparably larger addition of pseudo-static stress for small arches where gravitational self-weights are lower than in larger arches with greater self-weights. As the added pseudo-static stress is independent of geometry it is unchanged from arch to arch, whereas the gravitational self-weight of an arch increases with growing dimensions, and thus larger arches may be less affected by added anthropogenic energy than smaller arches.
Our model provides valuable insight into the effects of anthropogenic activity on structural degradation of rock arches; however, some limitations are present. As the Paris’ law coefficient and exponent we selected were determined empirically and depend on factors such as temperature (Nasseri et al., 2009) and humidity (Nara et al., 2012), there can be significant variation in the absolute annual crack growth given a range of possible values. We limited our study to calculating annual crack growth ratios as a relative metric, in order to eliminate the need for precise parameters that would require laboratory testing, or an extensive sensitivity test of our model. Additionally, our model employs a flat-lying fixed-fixed beam to study crack growth in an idealized arch. Arches shaped in the form of an inverted catenary, for instance, experience a different stress state (Moore et al., 2020) and thus, our model may not be applicable in all cases and geometries. Our model also solely examines crack growth of a single crack inserted in the underside of a beam at center-span: pre-existing bedding structures and crack networks in the rock mass can control how failure occurs and add a greater level of complexity to non-theoretical crack growth (Wong et al., 2001).
More detailed studies investigating the cumulative effects of all stressors—both anthropogenic and natural—on crack growth, along with incorporating elements such as precise geometry and existing material flaws, are necessary to comprehensively understand crack growth in arches. Previous site-specific studies such as those analyzing seismic signatures of arch collapse (Galea et al., 2018), stability and stress assessments of arches (Moore et al., 2020; Leucci et al., 2021), and studies that explore arch erosion (Řihošek et al., 2018) will be helpful in this regard. Notwithstanding limitations of our model, many arches do contain observable cracks and are failing under subcritical stress conditions. Rainbow Arch is one example where a crack reached its critical length, resulting in complete collapse of the arch. Our model and results may aid conservation management decisions regarding the current and long-term impacts of various human activities on the structural health of rock arches, as well as other rock landforms.
6 Conclusion
Using a theoretical model informed by natural arch and ground vibration data, we compared annual crack growth in an idealized beam-like arch experiencing anthropogenic vibrations to annual crack growth under conditions with little-to-no added anthropogenic energy. We found that added anthropogenic vibration energy can have a minor but distinct effect on annual crack growth in arches, resulting in a crack that is approximately 1% longer than in natural, ‘quiet’ conditions. We saw an especially larger impact on the annual crack growth ratio given a moderate-magnitude shaking event (∼15 mm/s) or higher-frequency (>37,000) of lower-magnitude (2 mm/s) events. We conclude that given this effect, human activity can have a significant contribution on crack growth over short and long periods of time, potentially affecting the lifespan of these culturally valued landforms. Our study informs questions on the impacts human activity has on the rate of degradation of natural landforms, and provides a quantitative approach to assess a range of scenarios designed to be useful in land conservation management practice.
Data availability statement
The datasets generated for Aqueduct Arch and Rainbow Arch and Reference for this study are available at the International Federation of Digital Seismograph Networks (FDSN): https://doi.org/10.7914/SN/5P_2013. The Transportable Array data analyzed for this study are available from FDSN: https://doi.org/10.7914/SN/TA.
Author contributions
RF and JM conceived of the project. RF, PG, and JM collected field data. RF wrote the manuscript, with contributions from JM and PG.
Funding
The National Science Foundation (Grant No. EAR-1831283) supported this study.
Acknowledgments
We thank the Native American Consultation Committee at Rainbow Bridge National Monument and the Hopi, Navajo, Southern Paiute, Ute, and Zuni members therein, for motivating this work, and Arches National Park for permitting access to Rainbow Arch. Erin Jensen, Jackson Bodtker and Holly Walker provided invaluable field assistance. We thank the three reviewers for their careful reading and valuable comments.
Conflict of interest
The authors declare that the research was conducted in the absence of any commercial or financial relationships that could be construed as a potential conflict of interest.
Publisher’s note
All claims expressed in this article are solely those of the authors and do not necessarily represent those of their affiliated organizations, or those of the publisher, the editors and the reviewers. Any product that may be evaluated in this article, or claim that may be made by its manufacturer, is not guaranteed or endorsed by the publisher.
References
Adams, P. N., Storlazzi, C. D., and Anderson, R. S. (2005). Nearshore wave‐induced cyclical flexing of sea cliffs. J. Geophys. Res. 110 (F2), F02002. doi:10.1029/2004JF000217
Anderson, T. L. (2005). Fracture mechanics: Fundamentals and applications. Boca Raton, Fla: CRC Press.
Atkinson, B. K. (1984). Subcritical crack growth in geological materials. J. Geophys. Res. 89 (B6), 4077–4114. doi:10.1029/jb089ib06p04077
Block, L. V., Wood, C. K., Yeck, W. L., and King, V. M. (2015). Induced seismicity constraints on subsurface geological structure, Paradox Valley, Colorado. Geophys. J. Int. 200 (2), 1172–1195. doi:10.1093/gji/ggu459
Brain, M. J., Rosser, N. J., Norman, E. C., and Petley, D. N. (2014). Are microseismic ground displacements a significant geomorphic agent? Geomorphology 207, 161–173. doi:10.1016/j.geomorph.2013.11.002
Budynas, R. G., Nisbett, J. K., and Shigley, J. E. (2011). Shigley’s mechanical engineering design. New York: McGraw-Hill.
Denver and Rio Grande Western Railroad [D&RGW RR] (1970). Condensed profile of the D.&R.G.W. R.R. System. Denver, Colorado: Utah Division. Office of Chief Engineer.
Deseret News (1991). Slabs fall from Landscape Arch. Available at: https://www.deseret.com/1991/9/7/18939827/slabs-fall-from-landscape-arch (last accessed: August 10, 2022).
Díaz, J., Ruiz, M., Sánchez-Pastor, P. S., and Romero, P. (2017). Urban seismology: On the origin of Earth vibrations within a city. Sci. Rep. 7, 15296. doi:10.1038/s41598-017-15499-y
Eppes, M. C., and Keanini, R. (2017). Mechanical weathering and rock erosion by climate‐dependent subcritical cracking. Rev. Geophys. 55, 470–508. doi:10.1002/2017RG000557
Eppes, M. C., Magi, B., Scheff, J., Warren, K., Ching, S., and Feng, T. (2020). Warmer, wetter climates accelerate mechanical weathering in field data, independent of stress-loading. Geophys. Res. Lett. 47, 2020GL089062. doi:10.1029/2020GL089062
Finnegan, R., Moore, J. R., Geimer, P. R., Bessette-Kirton, E. K., and Dzubay, A. (2022). Ground motion amplification at natural rock arches in the Colorado Plateau. Seismic Rec. 2 (3), 156–166. doi:10.1785/0320220017
Finnegan, R., Moore, J. R., and Geimer, P. R. (2021). Vibration of natural rock arches and towers excited by helicopter-sourced infrasound. Earth Surf. Dynam. 9, 1459–1479. doi:10.5194/esurf-9-1459-2021
Galea, P., Bozionelos, G., D’Amico, S., Drago, A., and Colica, E. (2018). Seismic signature of the Azure Window collapse, Gozo, central Mediterranean. Seismol. Res. Lett. 89 (3), 1108–1117. doi:10.1785/0220170115
Gdoutos, E. E. (2005). “Fracture mechanics, an introduction,” in Solid mechanics and its applications. Editor G. M. L. Gladwell (Waterloo, Canada: Spinger).
Geimer, P. R., Finnegan, R., and Moore, J. R. (2022). Meteorological controls on reversible resonance changes in natural rock arches. JGR. Earth Surf. 127, e2022. doi:10.1029/2022JF006734
Geimer, P. R., Finnegan, R., and Moore, J. R. (2020). Sparse ambient resonance measurements reveal dynamic properties of freestanding rock arches. Geophys. Res. Lett. 47, e2020GL087239. doi:10.1029/2020GL087239
Gischig, V. S., Moore, J. R., Evans, K. F., Amann, F., and Loew, S. (2011). Thermomechanical forcing of deep rock slope deformation: 2. The Randa rock slope instability. J. Geophys. Res. 116, F04011. doi:10.1029/2011JF002007
Gutenberg, B., and Richter, C. F. (1954). Seismicity of the earth. Princeton, N.J: Princeton University Press.
Hanson, C. E., King, K. W., Eagan, M. E., and Horonjeff, R. D. (1991). “Aircraft noise effects on cultural resources: Review of technical literature,” in HMMH for national park Service (Lexington, MA: US Department of the Interior).
Hungr, O., Evans, S. G., and Hazzard, J. (1999). Magnitude and frequency of rock falls and rock slides along the main transportation corridors of southwestern British Columbia. Can. Geotech. J. 36 (2), 224–238. doi:10.1139/t98-106
King, K. W., Algermissen, S. T., and McDermott, P. J. (1985). Seismic and vibration hazard investigations of chaco Culture National Historical Park. Denver, CO: US Geological Survey, US Department of the Interior.
King, K. W. (2001). Chiricahua pinnacle vibration investigation, preliminary report for chiricahua national monument. Lakewood, CO: EGU.
King, K. W., and DeMarco, M. J. (2003). “Impacts of construction vibrations on rock pinnacles and natural bridges, General Hitchcock Highway,” in Proc. Third international conference on applied geophysics (Orlando, Florida: Geophysics).
Kubojima, Y., Ohsaki, H., Kato, H., and Tonosaki, M. (2006). Fixed-fixed flexural vibration testing method of beams for timber guardrails. J. Wood Sci. 52, 202–207. doi:10.1007/s10086-005-0754-3
Lavoué, F., Coutant, O., Boué, P., Pinzon‐Rincon, L., Brenguier, F., Brossier, R., et al. (2020). Understanding seismic waves generated by train traffic via modeling: Implications for seismic imaging and monitoring. Seismol. Res. Lett. 92 (1), 287–300. doi:10.1785/0220200133
Lecocq, T., Hicks, S. P., Van Noten, K., van Wijk, K., Koelemeijer, P., De Plaen, R. S. M., et al. (2020). Global quieting of high-frequency seismic noise due to COVID-19 pandemic lockdown measures. Sci. (New York, N.Y.) 369 (6509), 1338–1343. doi:10.1126/science.abd2438
Leucci, G., Persico, R., De Giorgi, L., Lazzari, M., Colica, E., Martino, S., et al. (2021). Stability assessment and geomorphological evolution of sea natural arches by geophysical measurement: The case study of Wied il-Mielah Window (Gozo, Malta). Sustainability 13 (22), 12538. doi:10.3390/su132212538
Meng, H., Ben‐Zion, Y., and Johnson, C. W. (2021). Analysis of seismic signals generated by vehicle traffic with application to derivation of subsurface Q‐values. Seismol. Res. Lett. 92 (4), 2354–2363. doi:10.1785/0220200457
Moore, J. R., Geimer, P. R., Finnegan, R., and Bodtker, J. (2020). Between a beam and catenary: Influence of geometry on gravitational stresses and stability of natural rock arches. Geomorphology 364, 107244. doi:10.1016/j.geomorph.2020.107244
Nara, Y., Morimoto, K., Hiroyoshi, N., Yoneda, T., Kaneko, K., and Benson, P. M. (2012). Influence of relative humidity on fracture toughness of rock: Implications for subcritical crack growth. Int. J. Solids Struct. 49 (18), 2471–2481. doi:10.1016/j.ijsolstr.2012.05.009
Nara, Y., Tanaka, M., and Harui, T. (2017). Evaluating long-term strength of rock under changing environments from air to water. Eng. Fract. Mech. 178, 201–211. doi:10.1016/j.engfracmech.2017.04.015
Nasseri, M. H. B., Schubnel, A., Benson, P. M., and Young, R. P. (2009). Common evolution of mechanical and transport properties in thermally cracked westerly granite at elevated hydrostatic pressure. Pure Appl. Geophys. 166, 927–948. doi:10.1007/s00024-009-0485-2
National Park Service (2021). Arches National Park annual park recreation visits. Washington, DC: NPS Stats, 45.
National Park Service (2011). Special flight rules area in the vicinity of Grand Canyon National Park: Actions to substantially restore natural quiet. Fort Collins, CO: US Department of the Interior.
National Park Service (2020). Reporting information for commercial air tour operations over units of the National Park System. Fort Collins, CO: US Department of the Interior.
O’Sullivan, R. (2003). “The middle jurassic Entrada sandstone in northeastern Arizona and adjacent areas,” in New Mexico geological society 54th annual fall field conference guidebook. Editors S. G. Lucas, S. C. Semken, W. Berglof, and D. Ulmer-Scholle (Socorro, NM: New Mexico Geological Society), 425.
Quiros, D. A., Brown, L. D., and Kim, D. (2016). Seismic interferometry of railroad induced ground motions: Body and surface wave imaging. Geophys. J. Int. 205 (1), 301–313. doi:10.1093/gji/ggw033
Řihošek, J., Slavík, M., Bruthans, J., and Filippi, M. (2018). Evolution of natural rock arches: A realistic small-scale experiment. Geology 47 (1), 71–74. doi:10.1130/G45421.1
San Francisco Chronical (2015). Hiker dies, another injured after cliff collapse in Point Reyes. Available at: https://www.sfgate.com/bayarea/article/Hiker-dies-another-injured-after-cliff-collapse-6151164.php ((last accessed: August 10, 2022).
Satariano, B., and Gauci, R. (2019). “Landform loss and its effect on health and well-being: The collapse of the Azure Window (Gozo) and the resultant reactions of the media and the Maltese community,” in Landscapes and landforms of the Maltese islands. Editors R. Gauci, and J. A. Schembri (Cham: Springer International Publishing), 289–303.
Stoffle, R., Pickering, E., Brooks, K., Sittler, C., and Van Vlack, K. (2016). Ethnographic overview and assessment for Arches National Park. Tucson, AZ: School of Anthropology, University of Arizona.
United States Department of Energy [DOE] (2021). Moab uranium project safely ships 12 million tons to disposal cell. Available at: https://www.gjem.energy.gov/newsreleases/Moab_UMTRA_Project_12_Million_Tons.pdf ((last accessed: August 16, 2022).
Van Bebber, T. (2013). World Arch Database [software]. AvaliableAt: https://arches.stonecanyonadventures.com.
Voigtländer, A., Leith, K., and Krautblatter, M. (2018). Subcritical crack growth and progressive failure in Carrara marble under wet and dry conditions. J. Geophys. Res. Solid Earth 123, 3780–3798. doi:10.1029/2017jb014956
Volpe National Transportation Systems Center (2014). Literature review: Vibration of natural structures and ancient/historical dwellings, internal report for National Park Service. Cambridge, MA: Natural Sounds and Night Skies Division.
Whiffin, A. C., and Leonard, D. R. (1971). A survey of traffic-induced vibrations, RRL report LR418. Crowthorne, England: Road Research Laboratory, 57.
Keywords: arches, fractures, vibration, highways, trains, helicopters, earthquakes
Citation: Finnegan R, Moore JR and Geimer PR (2022) Contribution of anthropogenic vibration sources to crack growth in natural rock arches. Front. Earth Sci. 10:1035652. doi: 10.3389/feart.2022.1035652
Received: 03 September 2022; Accepted: 12 October 2022;
Published: 24 October 2022.
Edited by:
Erik H. Saenger, Bochum University of Applied Sciences, GermanyReviewed by:
Eric Larose, UMR5275 Institut des Sciences de la Terre (ISTERRE), FranceSebastiano D’Amico, University of Malta, Malta
Francesco Panzera, ETH Zurich, Switzerland
Copyright © 2022 Finnegan, Moore and Geimer. This is an open-access article distributed under the terms of the Creative Commons Attribution License (CC BY). The use, distribution or reproduction in other forums is permitted, provided the original author(s) and the copyright owner(s) are credited and that the original publication in this journal is cited, in accordance with accepted academic practice. No use, distribution or reproduction is permitted which does not comply with these terms.
*Correspondence: Riley Finnegan, cmlsZXkuZmlubmVnYW5AdXRhaC5lZHU=
 Riley Finnegan
 Jeffrey R. Moore
 Paul R. Geimer