 Fode Tounkara1,2
 Muhsan Ehsan3,4*Muhammad Nasar Iqbal4
 Nadhir Al-Ansari5*
 Muhammad Iqbal Hajana3
 Ahsan Shafi6
 Ahmed Elbeltagi7
- 1State Key Laboratory of Geological Processes and Mineral Resources, School of Earth Resources, China University of Geosciences, Wuhan, China
- 2Université de Segou, Faculté du Génie et des Sciences, Segou, Mali
- 3Institute of Geophysics and Geomatics, China University of Geosciences, Wuhan, Hubei, China
- 4Department of Earth and Environmental Sciences, Bahria University, Islamabad, Pakistan
- 5Civil, Environmental and Natural Resources Engineering, Lulea University of Technology, Lulea, Sweden
- 6School of Public Administration, China University of Geosciences, Wuhan, China
- 7Agricultural Engineering Department, Faculty of Agriculture, Mansoura University, Mansoura, Egypt
The purpose of this research is to delineate the structures of the Lower Goru Formation, investigate fluid properties, and clarify the hydrocarbon-prone areas through seismic attributes analysis. First, the acquired data was matched by the interpretation datum. Structural analysis was done by performing horizon interpretation, fault interpretation, and contour mapping on the C-Interval of the Lower Goru Formation. Hydrocarbon zones were marked with the help of attribute analysis on seismic sections and were justified by petrophysical analysis. An integrated approach such as seismic structural interpretation, seismic attribute, spectral decomposition, and petrophysical analyses was used in current research to better understand geological structure and features. This research showed that normal faults are present in the area showing negative flower structure, horst and graben, and faults oriented north-west to south-east. The contour map shows structural inclination and faults bound closure near well locations. Variance attribute and spectral decomposition attribute were used to verify horizon lineation and fault behavior. Instantaneous amplitude and instantaneous phase attributes justify hydrocarbon bearing zones, and bright spots are present on seismic sections at C–Interval of Lower Goru Formation. Petrophysical analysis of the available wells showed a number of significant hydrocarbon zones having more than 55% of hydrocarbon saturation at the C-Interval of the Lower Goru Formation. The four possible reservoir zones in Sawan-02 well, two zones in Sawan-07 well, and three zones in Sawan-09 well are identified based on well data interpretation. Based on these analyses, the area of interest has a very good reservoir potential, structural closure, and visible bright spots. The current finding of this research will be helpful for future exploration and development of the Sawan area.
Introduction
The manual interpretation of the seismic data set is extremely time-consuming and requires expensive manpower. Automation based on various computer techniques is considered a dependable, quick, and highly productive alternate approach providing useful information by extracting seismic attributes from seismic data. In order to improve the accurate geological interpretation of the target horizons, the seismic attributes are employed as a technique to extract significant information and features from the seismic data set (Khayer et al., 2022a). Numerous techniques and methods for feature extraction available in the literature are provided for better interpretation and analysis of seismic images (Khayer et al., 2022b). Seismic attributes are utilizing a wide range of time frequencies on seismic data to precisely locate underground channels and structures (Khasraji-Nejad et al., 2021). Although using seismic attributes to extract useful geological features is not a novel technique but it is a challenging task to select and choose the most relevant attributes to extract the necessary data due to the large varieties of seismic attributes and their diverse range of uses (Bulat and Long, 2001; Khasraji-Nejad et al., 2021). Seismic image analysis techniques were precisely used to detect subsurface geological features and target reflectors (bed boundaries) by the addition of automatic seismic imaging techniques. Automatic seismic imaging techniques have some drawbacks were not properly working in that areas where subsurface geological structures were complex and have low-resolution data sets (Zahmatkesh et al., 2021; Hosseini-Fard et al., 2022).
The study area (Sawan area) has heterogenic lithology and facies; this may be due to differences in the environment of deposition. The reliable well logs interpretation for the estimation of reservoir properties in the study area is still a challenge due to the heterogeneity of the Lower Goru Formation (Ehsan et al., 2019; Ashraf et al., 2020; Qiang et al., 2020; Ashraf et al., 2021). The previous study indicates that the study area is one of the most promising gas fields in the Middle Indus Basin (MIB) of Pakistan with cumulative production of 850 BCF from the Lower Goru Formation (LGF) (Ashraf et al., 2019). An integrated study uses geophysical tools (seismic structural interpretation, seismic attribute, and petrophysical analysis) effectively estimated the gas-bearing zones of the C-Sand interval of LGF in MIB Pakistan (Mughal and Akhter, 2021). To identify the heterogenetic behavior of lithology and to better understand the subsurface structures and lithological variations several techniques are taken, which include reservoir characterization through well log data and seismic attribute analysis applying to seismic data (Ashraf et al., 2019; Ismail et al., 2020a; Ehsan and Gu, 2020; Mughal and Akhter, 2021). 2D seismic data that was calibrated with well logs data provides a better understanding of the subsurface structure (Radfar et al., 2019). Integration of advanced seismic methods is considered an appropriate seismic imaging method to understand complex geology and helpful to structure interpretation (Farrokhnia et al., 2018).
The established reservoir sand intervals in the Middle and Southern Indus Basin are the Lower Goru Formation sands intervals but it is difficult to identify the gas zone of these sands facies by seismic interpretation because the payable/reservoir zone ranges from 2 to 8 meters in thickness. Seismic attributes are hence applied to the seismic interpretation data to differentiate between the reservoir and non-reservoir zone (Azeem et al., 2016). Seismic attribute analysis is considered an interpretation technique that is used to enhance the spatial prediction of structural properties from seismic data (Maleki et al., 2015). Among the various seismic interpretation methods, seismic attribute analysis has proven to be the most beneficial technique to detect the reservoir structural variations away from the well (Ashraf et al., 2019). The accuracy of conventional structure and well logs interpretation has decreased because it only relies on seismic and well logs data. At the present time, geological structure interpretation has been improved with the advancement of seismic exploration and interpretation techniques as well as advanced tools that are utilized for seismic and well logs interpretation such as seismic attributes, seismic inversion, lithofacies prediction, cluster analysis approach, reservoir quality prediction, multi-attributes analysis, deep learning, and machine learning. So, multiscale seismic dip constraint geological structure interpretation copes up the issue which integrates time-frequency decomposition of seismic data and geological structure interpretation (Ali et al., 2022; Anees et al., 2022; Hussain et al., 2022; Zhang et al., 2022).
Seismic attributes and inversion are used worldwide for the prediction of reservoir lithological and petrophysical properties of extremely heterogeneous reservoirs (Abbas et al., 2019; Bashir et al., 2021; Mughal and Akhter, 2021). The application of seismic attributes can improve seismic data interpretation and consider a powerful aid to seismic data interpretation. Seismic attributes are used to derive rock characteristics from the observed seismic signal (Chopra and Marfurt., 2008; Torvela et al., 2013). Seismic attribute analysis is very useful in every aspect of seismic interpretation as it helps ease the interpretation. For example, variance is an attribute that is used to identify or measure the coherency of the horizons, this also helps to find the faults as the area of low coherency tells the breakage of the horizon. The combined interpretation of well and seismic data can be used to identify the porosity of reservoir zones as a whole and in different portions. In the case of heterogenic subsurface, the best models are generated with the help of attributes but first of all structural interpretation, fault marking, and formation identification are done through seismic data as attribute analysis is not complete without seismic interpretation (Ashraf et al., 2020; Robinson and Davis, 2012). Well-log data is also used to calculate the saturation of water and hydrocarbon, which can further guide the production rate of the field. The volume of shale and volume of sand is calculated to identify if the lithology is clean or shaly and to calculate the porosity mostly effective porosity as shale is nonporous and shale can’t let the fluid pass through it. On the other hand, sand is very porous and permeable, it can pass and store fluid. Seismic attribute analysis helps to have an accurate mapping of traps associated with formations. This technique will not only tell the information about internal characteristics but also the ambiguity present with the reservoir (Robinson and Davis, 2012).
The study area is a part of the Middle Indus Basin that is present on the southern side of the Indian Plate. The current study was performed in the Sawan area by using seismic structural interpretation, seismic attribute, spectral decomposition, and petrophysical analyses to understand reservoir potential in Lower Goru Formation, Middle Indus Basin, Pakistan. Seismic attributes and petrophysical analyses will help to a better understanding of LGF hydrocarbon potential. The current study findings will be helpful in identifying new horizons in the Lower Goru Formation. The detailed workflow is shown in Figure 1. It has been determined from this study’s findings that an integrated approach will be able to better understand the subsurface structure and detect sweet spots in sand intervals.
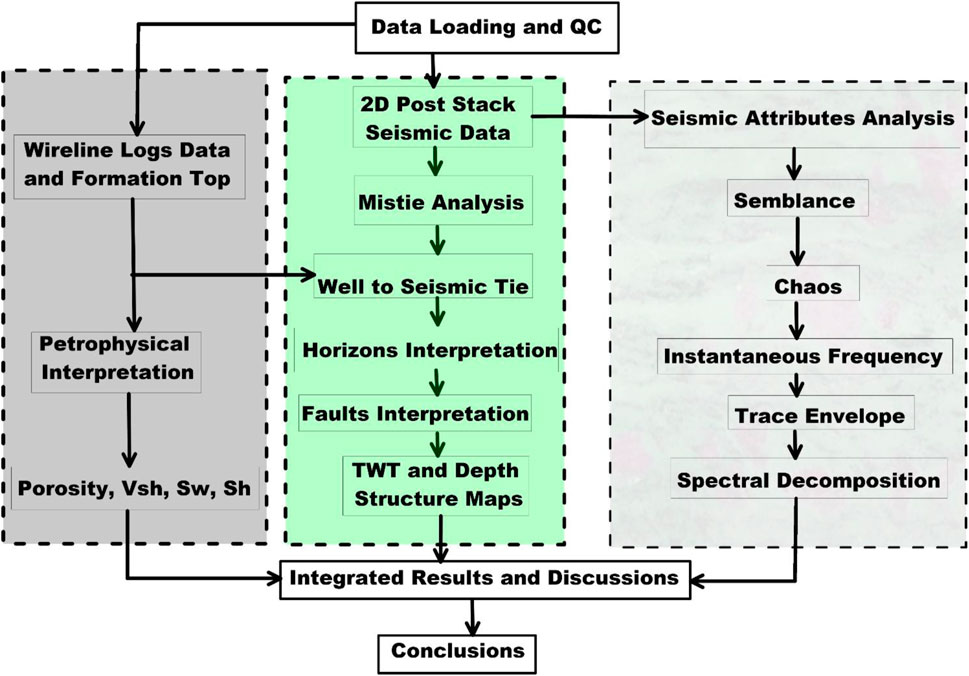
FIGURE 1. Workflow adopt for the current study.
Geological setting
The tectonic framework of Pakistan is very complex. Pakistan is divided into different tectonic zones on the basis of variations in tectonics, geology, age, and structures (Kazmi et al., 1997). The study area of the present research belongs to the Indus platform and foredeep tectonic zone (Figure 2). It is further divided into the sub-zones which include buried ridges, zones of upwarp, zones of downwrap, platform slope, and foredeeps.
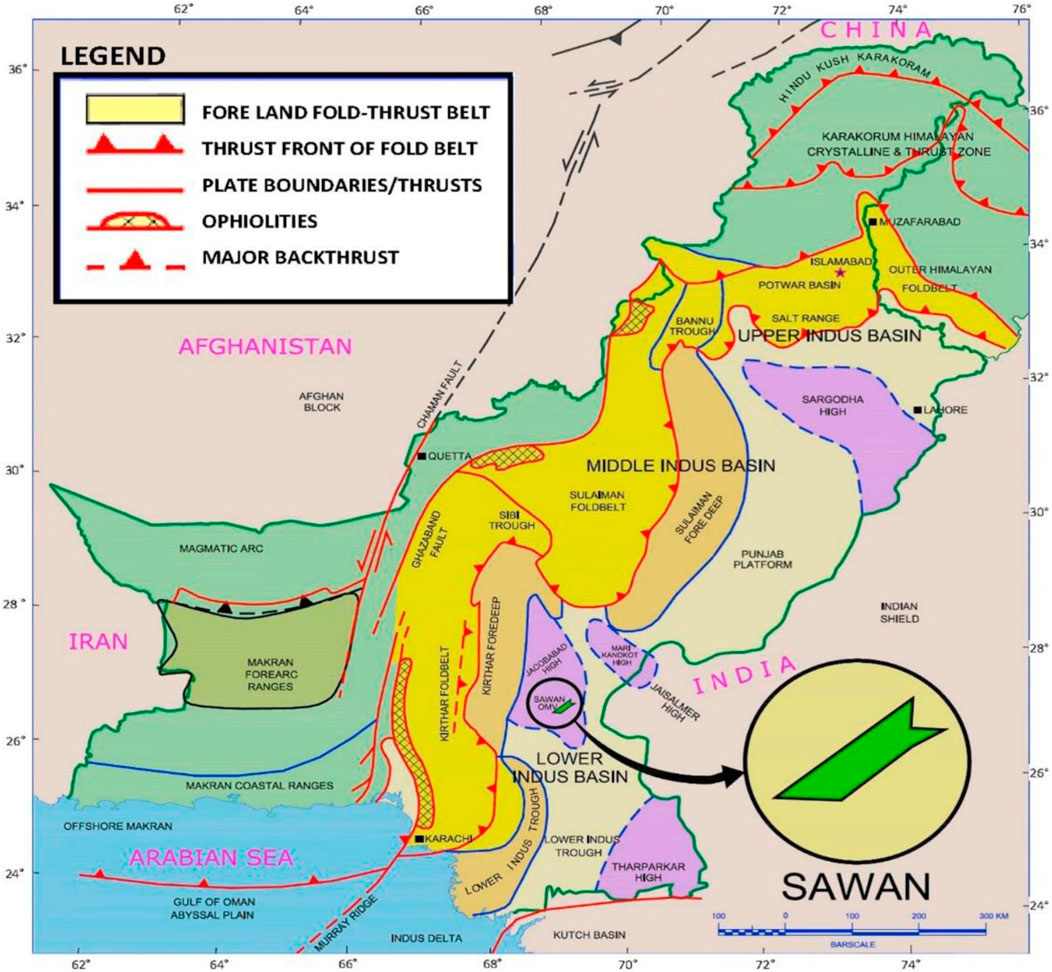
FIGURE 2. The regional structural setting with sedimentary basins of Pakistan. The location of the study area is highlighted by the black circle (Anwer et al., 2017).
Sargodha-Shahpur ridge and Nagar Parkar ridge lie in the zone of the buried ridge. Zone of upwarp contains Mari—Kandhkot high, Jacobabad—Khairpur high, Thatta—Hyderabad high, and Tharparkar high. Northern and southern Punjab monocline, Cholistan shelf, Panno Aqil graben, Nawabshah slope, lower Indus trough, and Nabisar slope are the parts of the zone downwrap and platform slope. The last tectonic sub-zone contains Sulaiman foredeep and Kirthar foredeep (Zaigham and Mallick, 2000; Kazmi and Jan, 1997; Kazmi and Rana, 1982).
The Indus Basin is a part of Gondwanan lands, and Axial Belt separates the Tethyan and Laurasian domains. The central and eastern regions of Pakistan are dedicated to the Indus Basin. The Indus Basin is situated northwest of the Indo-Pakistan subcontinent. The Lower Indus Basin (LIB) is divided into Central and Southern Indus Basins by Jacobabad High and Mari Kandhkot High. Both Jacobabad and Mari Kandhnkot highs are together termed the Sukkur Rift. The Central Indus Basin (Sulaiman sub-basin) consists of the Punjab Platform, Sulaiman Depression, and Sulaiman Fold Belt while the Southern Indus Basin includes the Thar Platform, Karachi Trough, Kirthar Foredeep, Kirthar Fold Belt, and Offshore Indus (Kadri, 1995; Aziz et al., 2020).
The discoveries in LIB associated with Lower Goru Formation (LGF) are either located on structural high or its proximity (Figure 2). These structural highs include Jacobabad-Khairpur High, Lakhra High, Mari High, and Badin uplift etc. The highs have significance for the hydrocarbon migration, charging of the reservoirs, and structural and stratigraphic structures/features for the hydrocarbon traps. In LIB, wrench faults (strike slip) are frequently present which have a general trend of northwest to southeast. The entire cretaceous strata is cut by such faults that change its character from top to bottom. The fault trend varies from multiple en echelon left lateral segments at Upper Goru and Lower Goru to a strongly linear and single fault at Chiltan Formation. It is a result of trans-tensional tectonic events associated with the first collision of the Indian Plate with the Eurasian plate and the counterclockwise rotation of the Indian Plate. Secondary hydrocarbon migration, charging and the modification of the trapping mechanism took place during Late Eocene to Oligocene, the second uplift event in Central Indus Basin and Southern Indus Basin (Ahmad et al., 2004).
A complete stratigraphic sequence of the Central Indus Basin (CIB) does not exist in the Sawan area. In the Sawan area, the known formations for the petroleum play in the study area include the Sembar Formation which acts as a regional source rock, sands of LGF act as a reservoir, and shales of the Upper Goru provide a seal for the hydrocarbon. Intercalated shales within the LGF also act as source rock in some areas of the CIB. The Goru Formation (LGF and Upper Goru) is of Cretaceous age, it consists of interbedded shale with limestone, siltstone, and sandstone units. Its lower part has mostly grey-green colored shale with irregular bedded calcareous and very thin-bedded limestone near Goru village. Mostly the formation shows a change from sand to shale e.g., from east to west sand facies change into shale and the environment of deposition varies from deltaic to deep marine (Wandrey et al., 2004; Kazmi and Jan 1997). In the study area, the upper part of the Goru Formation (Upper Goru member) consists of mostly shale, and the lower part contains interbedded sand and shale units (Kadri, 1995; Ehsan et al., 2021). In the CIB, Lower Goru Formation is a proven reservoir, but the reservoir zones are comprised of vertical compartments which are very thin (5–10 m), and only a few times such zones are greater than 1 m which may be due to the presence of interbedded shale present among them (Azeem et al., 2016).
The LGF is categorized further into different payable zones. The oil companies use different nomenclature for these sand and shale packages which are interbedded due to marine regression and transgression processes. In the LIB, the Sembar Formation and intra-formational shale units of LGF are acting as source rock. LGF is divided into five intervals: A, B, C, and D sands and a shale interval as shown in Figure 3. The first three sand intervals act is acting as a reservoir, while the shale interval acts as a seal (Ahmad et al., 2004; Azeem et al., 2016; Khan et al., 2022). Previous studies suggest that C-Sand bears a good reservoir property i.e., higher porosity and permeability, lower volume of shale, and the existence of sweet spots which make it lucrative (Ashraf et al., 2019; Mughal and Akhter, 2021).
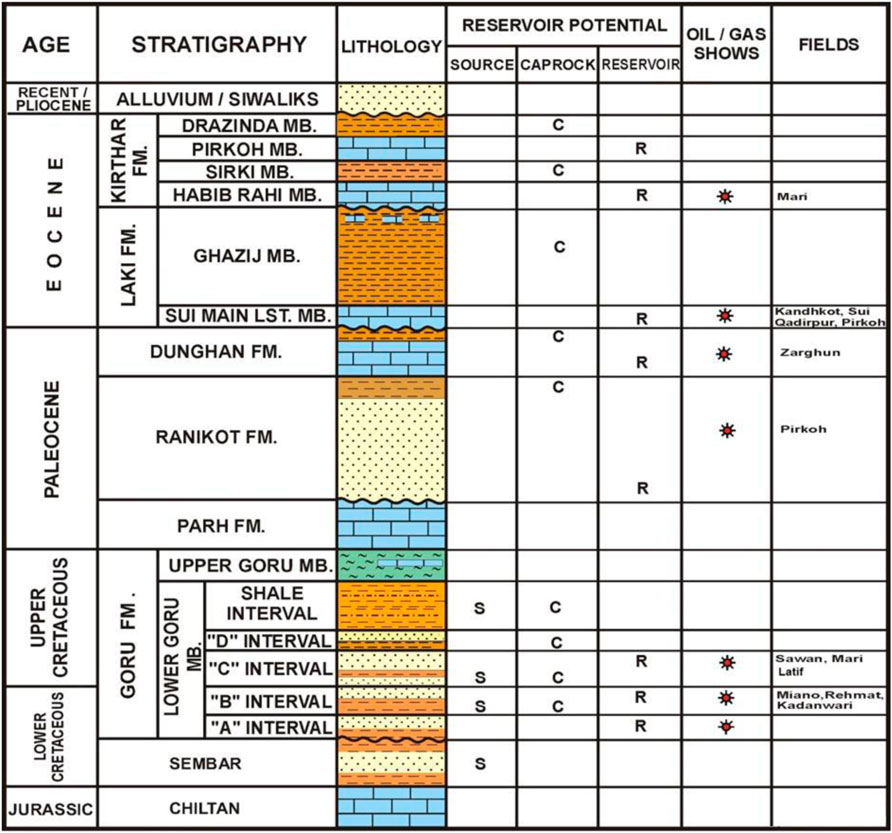
FIGURE 3. Generalized stratigraphy column of the Middle Indus Basin (Azeem et al., 2016).
Methods and materials
The selected data includes six 2D seismic lines and three well logs data. Five seismic lines were dip lines and one strike line of the Miano area all three wells (Sawan-2, Sawan-7, and Sawan-9) were in the Sawan area, MIB, Pakistan. The data was obtained from Directorate General Petroleum Concession (DGPC), Pakistan for this research. In the base map, it looks like the exact match of two wells on acquired seismic lines but there is some distance between the wells and seismic lines. In the base map, it is shown that two wells i.e., Sawan-2 and Sawan-7 were located exactly on acquired seismic lines but, the wells were not located exactly on these lines as shown in Figure 4. In actuality, the well Sawan-2 was the closest to the acquired seismic line, this was one of the reasons to choose PSM 98-201 as the control line.
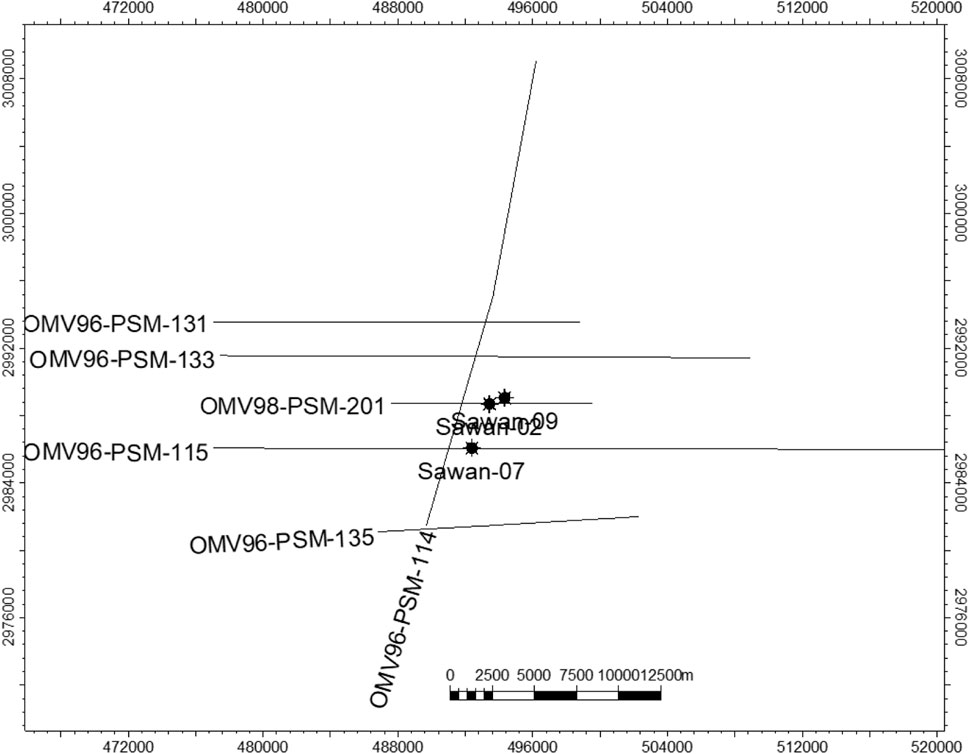
FIGURE 4. Base map of the study area.
The primary task in seismic data processing in hydrocarbon exploration is to remove noise and improve the signal of the data set to better understand the subsurface picture (Mahdavi et al., 2021; Mafakheri et al., 2022). The resolution of the seismic image is playing a key role to get the accuracy of the target for exploratory drilling by seismic data (Mahdavi et al., 2021). The seismic data was composed of 2D seismic sections. When the seismic sections correlated the horizons of similar amplitudes did not match, and there was some shift or mistie present among the seismic sections. One seismic line (PSM 98-201) was considered as the control line as the well i.e., Sawan-2 was located on this line. The well log data of Sawan-2 was used to generate a synthetic seismogram, well to seismic tie was held in this seismic line with Sawan-2. First, the amplitudes of all seismic sections were balanced, so that these lines can be shown in the mistie section. Before amplitude balancing, the mistie section had some sections missing in either of the selected seismic lines as shown in Figure 5A. Seismic line intersection issues should be noted when interpreting seismic data sections. These discrepancies, also known as misties (Chen et al., 2018), can frequently be seen visually and demonstrate wave and longitudinal time deviations of the same reflector occurrences. Such discrepancies could result from different seismic acquisition and processing; the mistie greatly impedes our interpretation job. The 2D seismic data used in this study was from the two vintages OMV98 (one seismic line) and OMV96 (five seismic lines). The seismic line OMV98-PSM-201 was the only one from a different vintage, hence other profiles from the same vintage were used to correct it. Mis-tie analysis was carried out as a phase in the data quality process, and it revealed a mistie between the profiles of OMV98-PSM-201 and OMV96-PSM-114 (Figure 5A). A constant of 100 ms shift was applied that matched the behavior of seismic reflectors on both seismic profiles (Figure 5B). After the completion of the mistie correction, a synthetic seismogram of Sawan-2 well was generated and matched with the seismic section, then horizons were marked along all seismic sections, and then synthetic seismograms of Sawan-7 and Sawan-9 wells were generated to correlate with horizon interpretations. Initially, seismic sections were matched with the marked reflector of the Chiltan Formation, but the upper part of the seismic sections did not match completely. So, the Upper Goru Formation top was used for matching the seismic lines although the shift was minor because of the previous correlation at Chiltan Formation. The Upper Goru Formation top was used for correlation because its reflector was continuous, the amplitude of this horizon was bright, and it was near the C-Interval of the Lower Goru Formation.
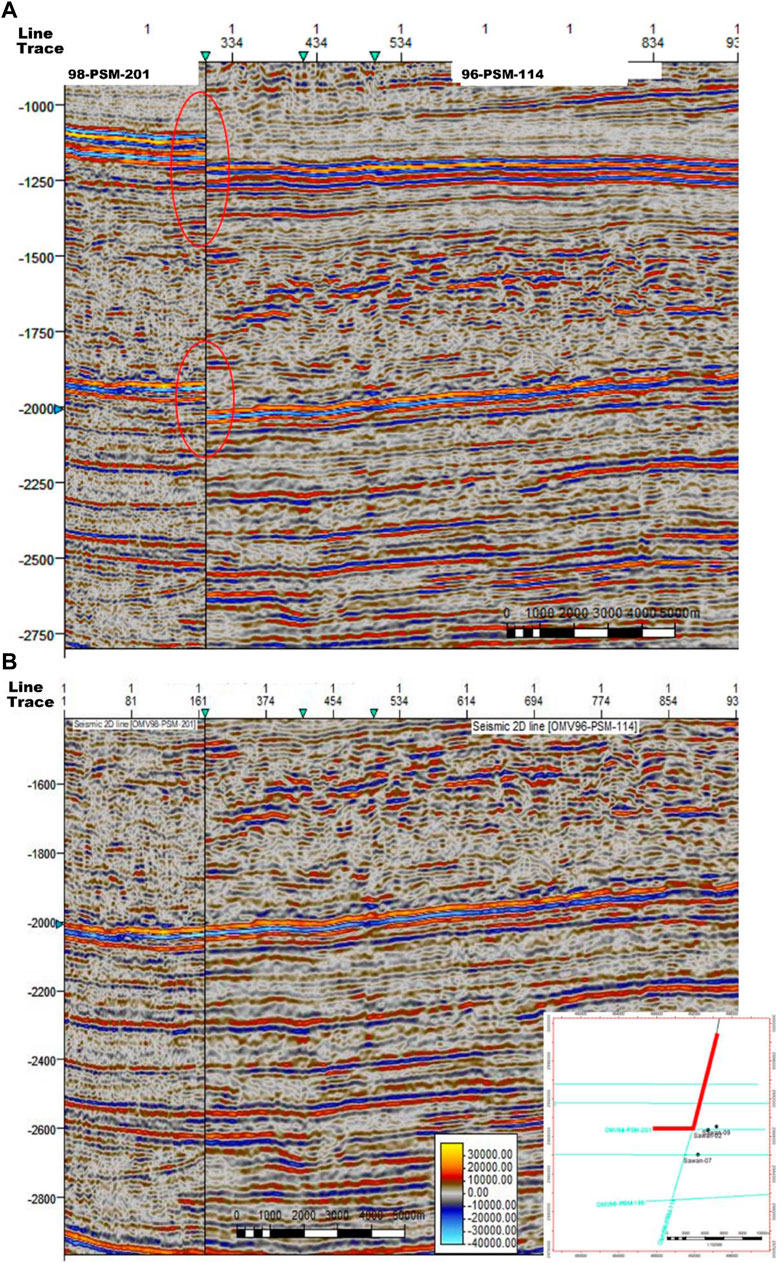
FIGURE 5. (A) Mismatch of seismic sections before (highlighted with the red oval shape) correcting Mistie (B) Image of the seismic sections after Mistie correction.
A synthetic seismogram is necessary to generate before starting any seismic interpretation project as the identification of seismic horizons and the rectification of seismic events was done in time and amplitude data. It was also used to correlate the geological data with well logs data to justify seismic trace data (Naeem et al., 2016).
Several steps were taken for petrophysical analysis, these include marking the zone of interest, the volume of shale and saturation, etc., marking of the zone of interest was done by keeping in mind the value ranges of the well logs i.e., stability of caliper log, low gamma ray values (for sand bodies), and neutron-density cross over must be present (Rider et al., 2002). After marking the zones, the volume of shale was calculated as
Where IGR is a gamma-ray index. IGR is converted into shale volume (
Calculation of the volume of sand (
For the calculation of density porosity, Eq. 4 was used
where,
For calculating neutron porosity, the Schlumberger Chart was used in the case of sandstone, but neutron log curves were used in the case of limestone. Calculation of average porosity in the case of gas-bearing formations was done using Eq. 5 (Rider et al., 2002).
Where is the average porosity,
Effective porosity is the product of average porosity and the volume of sand that is calculated from the volume of shale. The value for effective porosity is always lower than average porosity. The formula for the calculation of saturation of water used the Archie equation (Schlumberger, 1991).
The acquired information from seismic data either based on experience-based results or with the help of measurements is called seismic attributes. Seismic attribute interpretation delivers the subsurface physical parameters and the quantitative geometrical information. If physical parameters were required, then the principal element for the determination was amplitude analysis but if quantitative geometrical information is required then the phase analysis was generally applied. This resolves that the information gained from seismic parameters falls within the definition of seismic attributes. Seismic attributes applied to seismic data sets are RMS amplitude, variance, instantaneous frequency, etc. There are a number of seismic attributes for different purposes, the most common seismic attributes are variance, root mean square (RMS), instantaneous frequency and instantaneous amplitude, sweetness, etc. The physical parameters include velocity, frequency, phase, and amplitude and their changes with respect to time and space (Taner, 2001). The reflection strength of each time sample was calculated by using Eq. 6 and its strength is always positive (Azeem et al., 2016)
Results and discussions
Horizon and fault interpretation
After the mistie is corrected, horizon interpretation takes place. It is started with the help of well data as well as formation tops are given with their depths and well to seismic tie is completed. We just need to show well tops on the seismic section and start marking the horizons. In this case, 2D seismic lines are present, and wells do not lie on seismic sections, we need to choose the nearest well to any seismic section which is Sawan-2 (Well) near seismic line PSM 98-201 (∼120 m). After completing the horizon interpretation, faults are marked where the wave crest changes into a trough horizontally, throw of a horizon is encountered that is interpreted with amplitude attributes and variance attributes.
In this research, three synthetic seismograms are generated for three wells (Sawan-2, Sawan-7, and Sawan-9), and two well logs i.e., sonic log and density log are used in each well. Different wavelets were used to generate a synthetic seismogram, but the best result interpretation was with the extracted wavelet from the data. This wavelet was then matched with the surface seismic data that used five extracted traces from the neighborhood. The synthetic seismogram for the Sawan-2 well (Figure 6A) shows the correlation of synthetic wavelet and seismic trace.
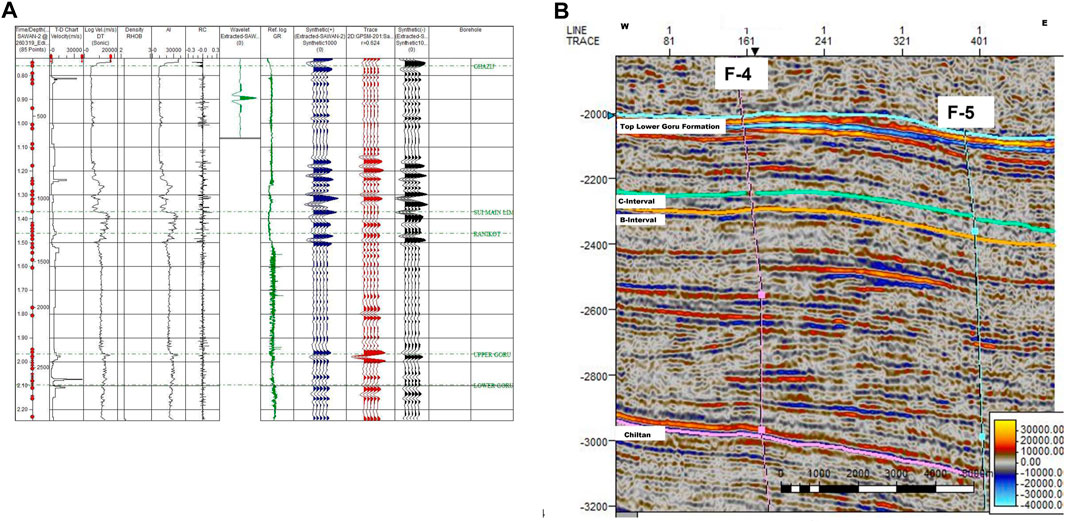
FIGURE 6. (A) Image of Synthetic seismogram of Sawan-2 well on seismic dip line PSM-201 (B) Seismic interpretation of dip line PSM 98-201.
In this seismic section (PSM 98–201) as shown in Figure 6B, only two faults (Fault 4, Fault 5) named accordingly in contour maps are present. The horizon trend is shallow north-westwards towards Jacobabad High and deepens towards Lundo Low which lies in the south-east direction.
The dip line PSM 96-115 as shown in Figure 7A is the longest seismic line in the given data, it shows differences in facies that are increasing towards the east and different fault trends towards the east including wrench faults and horst and graben structure, sadly other seismic lines are present in the west side that is mostly continuous.
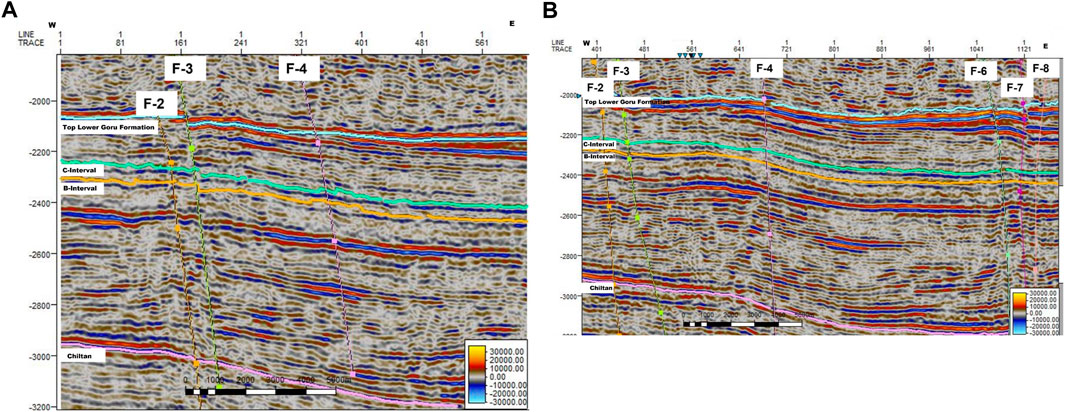
FIGURE 7. (A) Interpreted seismic section of dip line PSM 96-115 (B) Interpreted seismic section of dip line PSM 96-135.
The seismic dip line PSM 96-135 as shown in Figure 7B is the most southward line in acquired data, it is also not intersected by another acquired seismic line, so for horizon interpretation jump correlation method is used. Only those fault cuts interpreted in this section that is also present in other seismic lines and further used for creating fault polygons, the structural trend is similar to other seismic lines. The interpreted data suggests that the structure is dipping on the eastern side according to the dip lines having the direction of west-east. On the western side of the Sawan area, an anticline feature is indicated. The literature also shows that the geological structure on the southeast side of the Sawan area is a low named Lundo Low and on the northwest side is Jacobabad High. Seismic data also suggests that on the east side, the facies are more than on the west side of data that is visible in dip lines PSM 96-115 (Figure 7A). Faults present here are normal faults, wrench faults with a horst, and a graven structure that proves the extensional regime. Furthermore, details of the structure are shown in time and depth maps.
Contour maps
The formation of interest in this area is the C-Interval of the Lower Goru Formation. No other interval, member, or formation was identified as a reservoir or area of interest either in the literature review or in this research. So, both contour maps (time contour map and depth contour map) are also computed for the C-Interval of the Lower Goru Formation.
In the time contour map, time grids were generated with the interpreted horizon on the entire base map and fault polygons are generated from fault surfaces. There were fault polygons identified cutting the horizon at different points/area as shown in Figure 8A. The contour map contains: a grid map along with contours of C-Interval, faults polygons having similar directions (north-west to south-east), a color bar showing the trend of structure, and a base map.
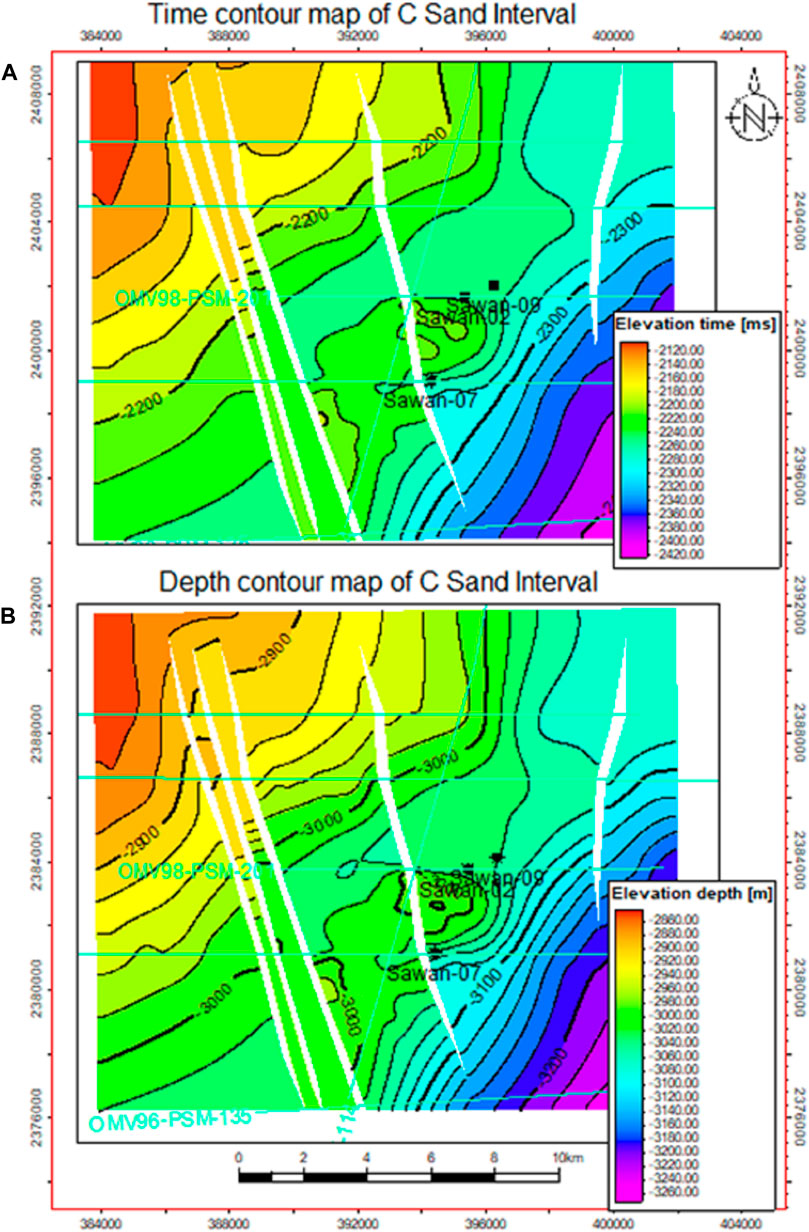
FIGURE 8. (A) Time contour map of C-Interval, Lower Goru Formation (B) Depth contour map of C-Interval, Lower Goru Formation.
In Figure 8A, the structure is deepening in the south-east towards Lundo Low, and becomes shallow in the north-west side near Jacobabad High. In between these major tectonic features petroleum play exists, all three wells are surrounded by faults, and the Sawan-7 well has a shallow contour or time. With accompanied by seismic attribute analysis, and petrophysical analysis of these wells are placed in good reservoir locations.
In the depth contour map, depth grids were generated with a time grid and velocity grid on the same area as above, and fault polygons are generated from fault surfaces as shown in Figure 8B. The contour map also contains: a grid map along of C-Interval, faults polygons having similar directions (north-west to south-east), a color bar showing the trend of structure, and a base map. The depth grid the has same generic trend as of time grid, but it shows structural throw, and the Sawan-2 and Sawan-9 wells are also located in shallow depth trends making closure for hydrocarbon.
Seismic attribute analysis
Amplitude-derived attributes are very helpful as they address problems of stratigraphy and reservoir properties i.e., bright spot, flat spot, etc. Time-derived attributes describe the detail of the structure, frequency derived attributes help disclose the additional geological layers. The hybrid attributes are the combination of amplitude and frequency thus they are very useful for the measurement of seismic characteristics. Attributes alone are very limited information so they must be correlated with petrophysical studies to build confidence in correlation with the reservoir properties and parameters (Brown, 2001).
The other name for variance is semblance although they may be two different attributes, the general phenomenon is the same as they both calculate the lateral continuity of the events. The name of these attributes suggests that variance describes discontinuity, but semblance tells the continuity of events. The color indication for both attributes is the same. Figure 9A shows the continuity of reflectors only and in the second Figure 9B well (Sawan-2) is shown with generated synthetic seismogram, and horizons are also interpreted. As variance tells the continuity so, we can see the lateral continuity, and no major faults are visible. The green horizon (B-Interval) is not clear in the margins; this is due to the reason that the reflectors are also disturbed in this area. This disturbance is resolved by another attribute called spectral decomposition (Figure 12A).
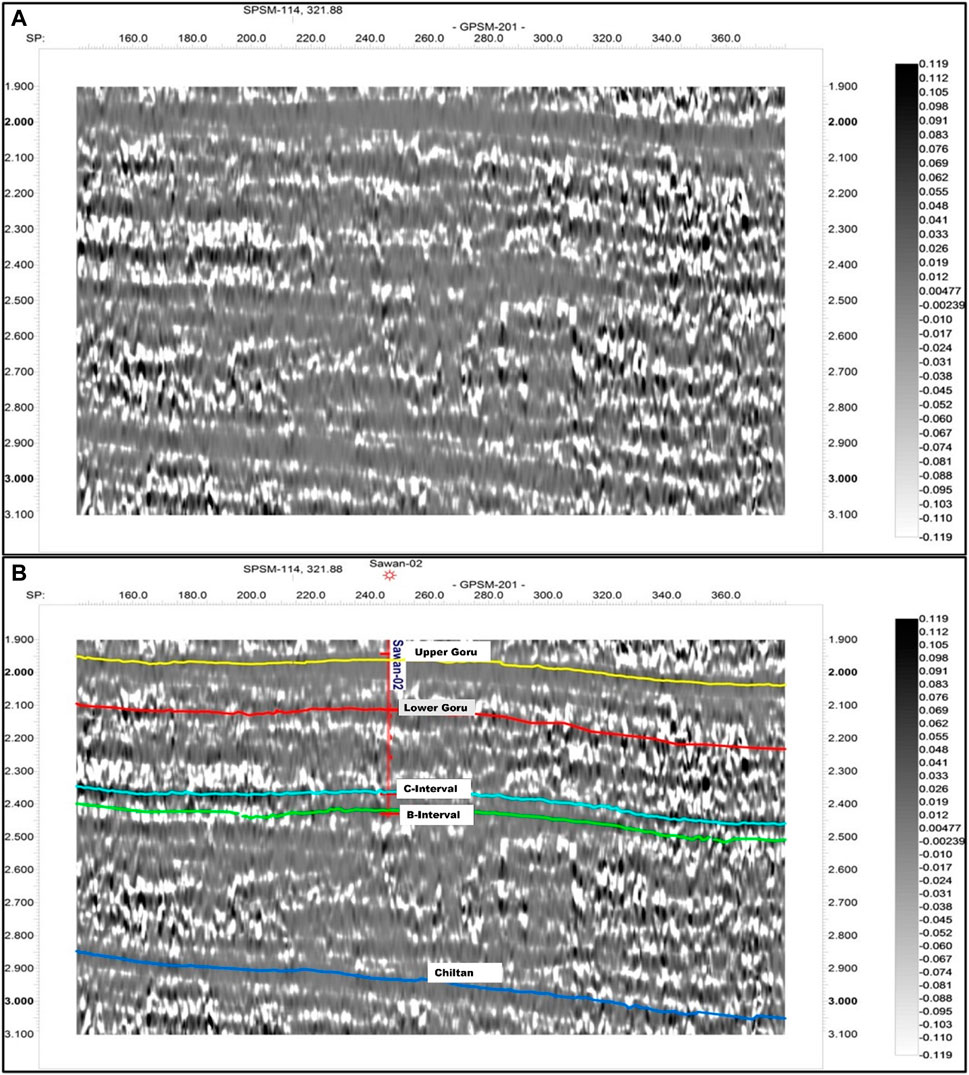
FIGURE 9. (A) Seismic attribute Semblance variance showing the continuity of seismic section PSM 98-201 (B) Seismic attribute Semblance variance showing the continuity of seismic section along the interpreted horizons.
Seismic reflections frequently exhibit sudden direction changes and change waveform signature as well as amplitude. This seismic disorder is referred to as randomness, or chaos, which can represent either seismic or geologic noise or maybe a combination of the two (Chopra and Marfurt, 2016). To get target properties from seismic data different window lengths are used to quantify the attributes of chaos, variance, and edge content (Khayer et al., 2022a). Seismic data can exhibit chaotic textures that can be used as a direct indicator of where reflector disruption is occurring. The high values of chaoticness are indicates complex geological structures such as faults, channel sand bodies, gas chimneys, and fractures, and the minimum values represent bed continuity (Ismail et al., 2020b). The irregularity of the coarse-grained sediments seen in channel infills can contribute to the chaotic signal pattern found in seismic data. Therefore, in lithology variation contexts, the chaotic attribute can be used to discriminate between distinct sediment facies (e.g., sand and shale). The high values that are represented by red arrows showed discontent reflections and are marked as faults, in the contrast less shaded represent the least amount of chaos and are consistent with the assumed bed continuity as shown in Figure 10.
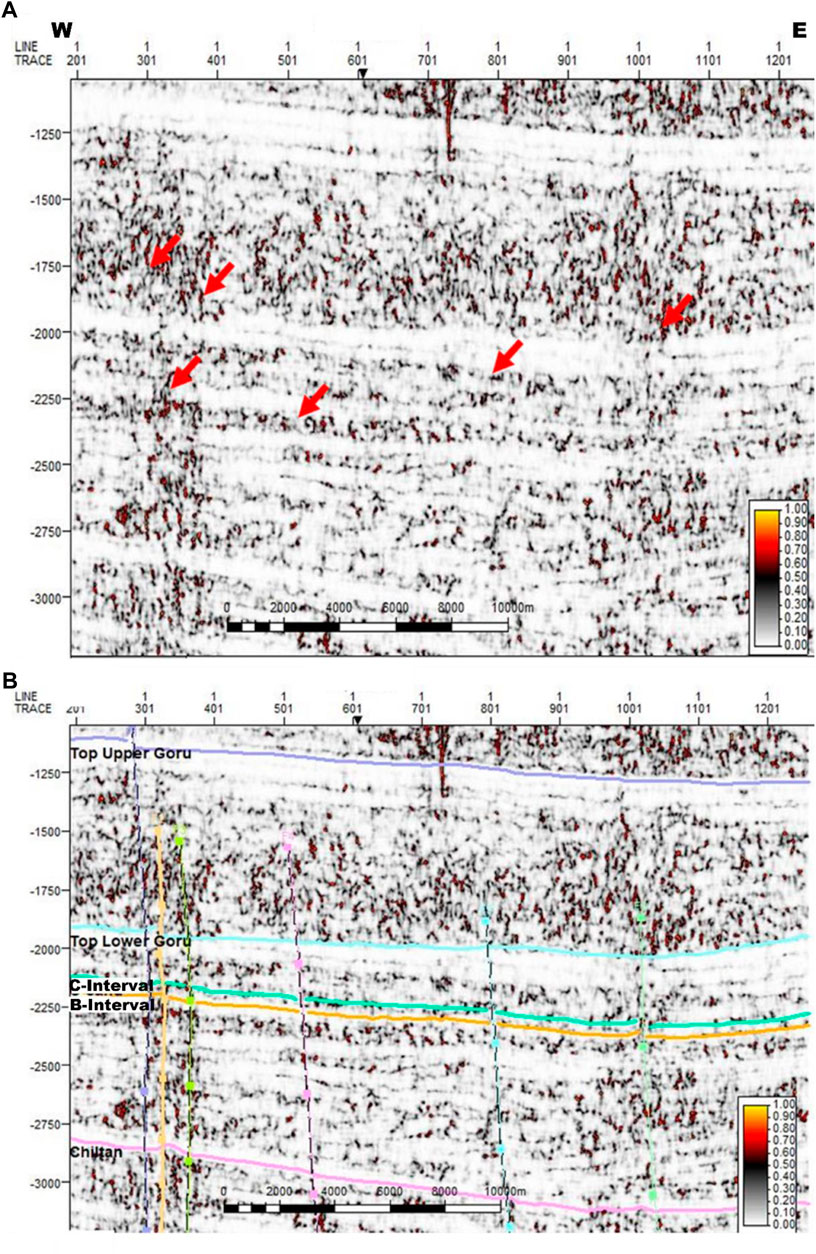
FIGURE 10. (A) Seismic attribute Chaos showing the red arrow discontinuity on seismic section PSM 96-133 (B) Seismic attribute Chaos showing the red arrow discontinuity on seismic section PSM 96-133 along the interpreted horizons.
Instantaneous Frequency is a result of the derivative of the instantaneous phase as a function of time. The color separates different zones on the basis of low to high-frequency values. This attribute is a physical attribute; it answers to both depositional characteristics and wave propagation. For this attribute, low-frequency values are associated with hydrocarbon-saturated reservoirs, gas-bearing zones, and changes in lithology. Among the values, in contrast, the lowest values represent the strongest gas absorption phenomenon, but the high-frequency values represent the thinning of reservoir zones (Azeem et al., 2016). The instantaneous frequency attribute tells/highlights the bright spots present in the section as shown in Figure 11A. In this image, we can see the bright spots in white to red color scattered throughout the seismic section. As our area of interest is only C-Interval, the Lower Goru Formation that is proved with petrophysical analysis and literature review to be a reservoir in the area of interest. In Figure 11B, we can see a bright spot between C-Interval and D-Interval that is also present in the well location.
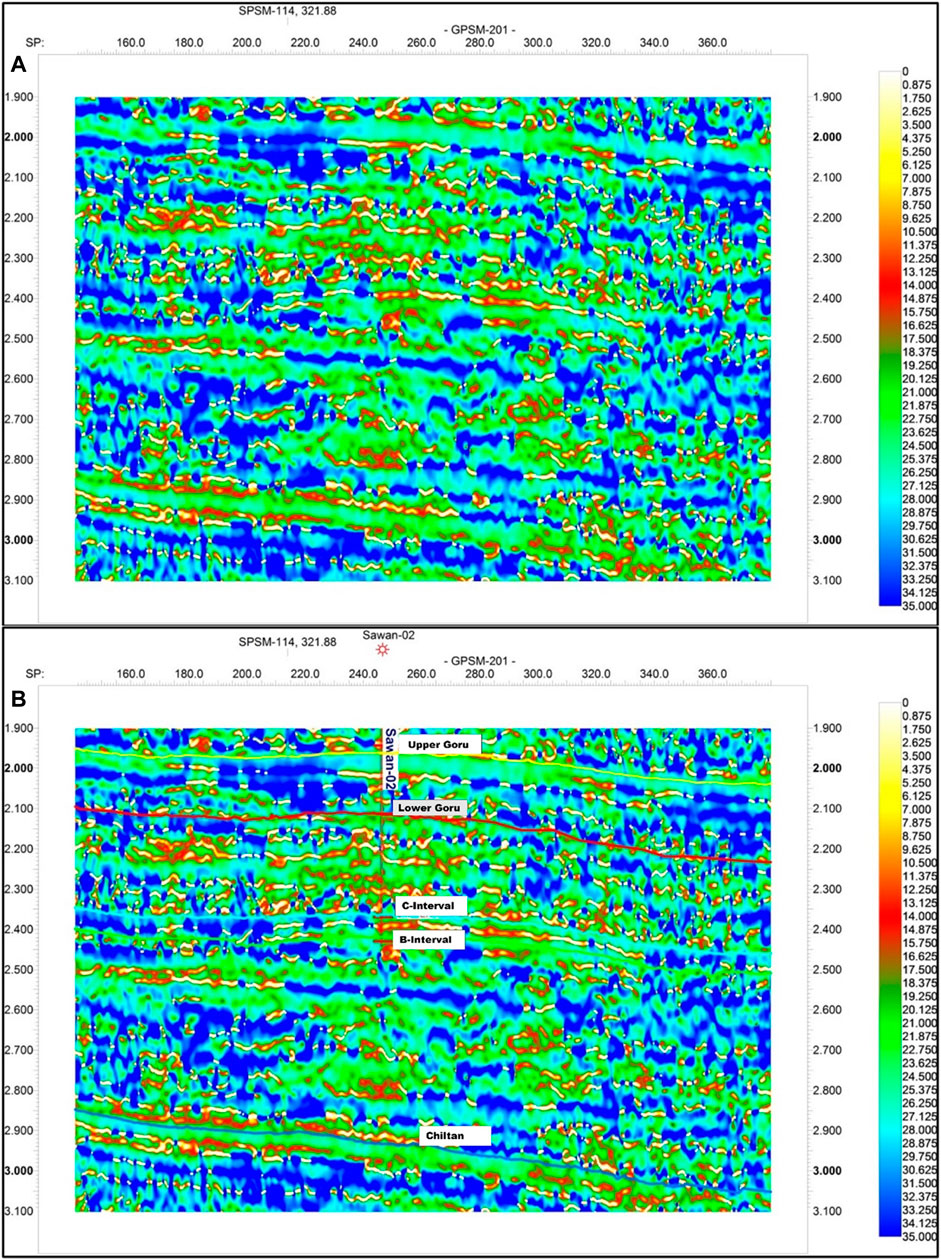
FIGURE 11. (A) Seismic attribute instantaneous frequency showing the bright spots on seismic section PSM 98-201 (B) Seismic attribute instantaneous frequency on interpreted seismic section showing the bright spots.
The attribute trace envelope is also known as instantaneous amplitude and reflection strength. It is the result of performing Hilbert transformation on the original seismic trace which is the magnitude of each pair of polar values. Instantaneous attributes can be calculated for any point in the seismic section and do not depend on any sort of interpretation (Radovich and Oliveros, 1998).
The energy attribute is independent of phase which helps in clearly seeing the amplitude anomalies and the resultant values of energy are always positive (Azeem et al., 2016). Seismic attributes showed clear hydrocarbon indications near the Sawan-2 well in seismic line PSM 98-201. Variance and spectral decomposition are used to interpret horizons, fault marking, and verify lateral continuity. Trace envelope attribute suggested that high energy area has the presence of hydrocarbon (Figures 12A,B). A similar area was marked as a low-frequency area (bright spot) in the instantaneous frequency attribute (Figures 11A,B). These results also confirm the seismic interpretation and presence of hydrocarbons in the marked area.
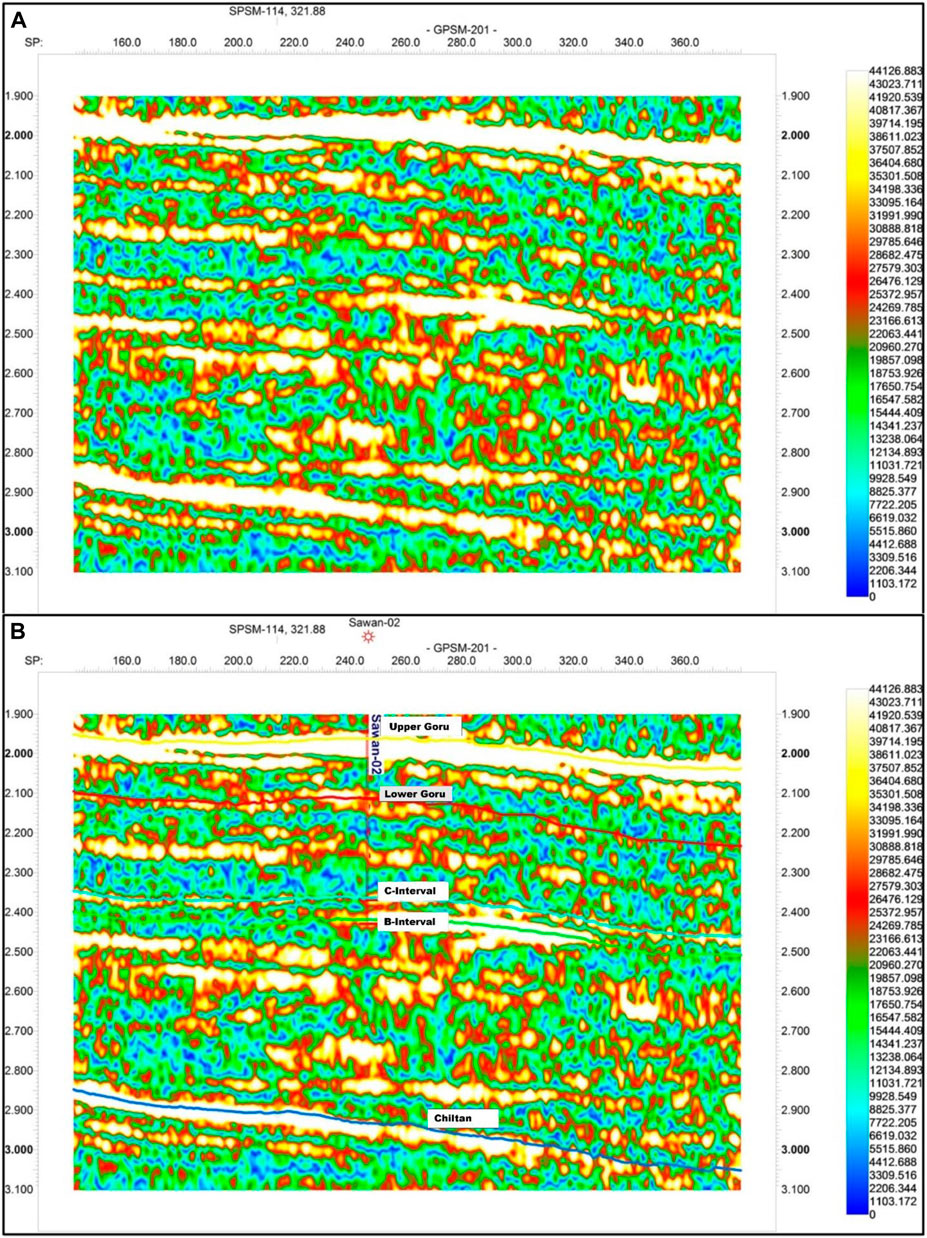
FIGURE 12. (A) Trace envelope seismic attribute showing high energy zones on seismic section (B) Trace envelope seismic attribute showing high energy zones on interpreted seismic section.
Spectral decomposition
Spectral decomposition is applied to seismic data by using Fourier transformation, it gives the lateral variability and fault trends. It also helps to separate the most important frequency content in the area of interest; it optimizes the image for direct hydrocarbon indicator (DHI) interpretation and uses specific bandwidth (Chopra and Marfurt., 2008). Spectral decomposition is effectively used to image and map bed thickness, geologic discontinuities, and channel delineation, and also consider DHI (Othman et al., 2016). The spectral decomposition used in Figure 13A is of 8 Hz, and it helped in the visibility of reflectors in disturbed areas but in this section no major faults are present. In this case, the horizons are separate, but C-Interval and B-Interval are not clear on the sides. The difference in result by using different values of frequency is shown (Figures 13A–C) as the reflectors become thinner and become easier to interpret.
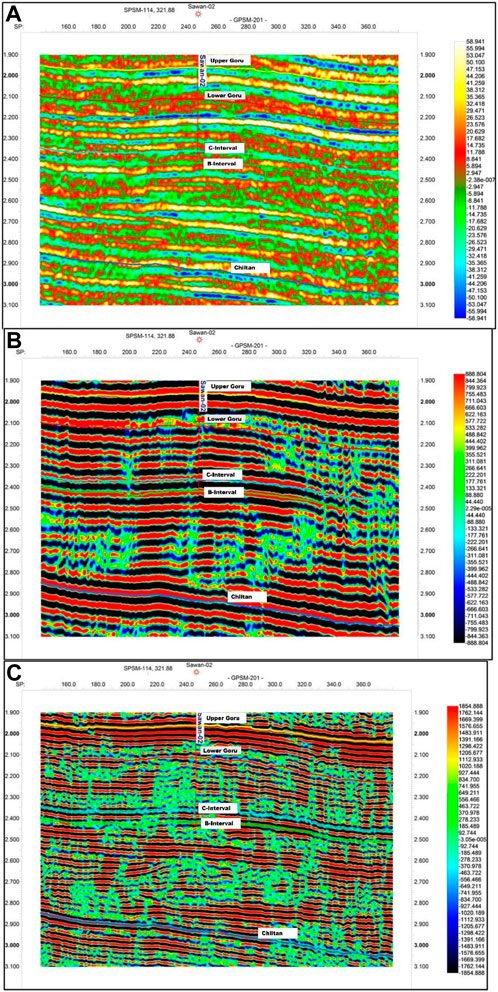
FIGURE 13. (A) The seismic attribute, spectral decomposition of 8.0 Hz showing smoothened horizons on interpreted seismic section (B) The seismic attribute, spectral decomposition of 13.3 Hz showing smoothened horizons on interpreted seismic section (C) The seismic attribute, spectral decomposition of 37.1 Hz showing smoothened horizons on interpreted seismic section.
Well log analysis
The previous study based on seismic attributes and well logs analysis indicates that the C-sand interval consists of medium sandstone with inter-beds of shale, and siltstone in the reservoir interval of the Sawan area has good reservoir properties (Ashraf et al., 2019). The well logs analysis is done on all three wells; the well logs used are caliper log, gamma ray log, resistivity logs, neutron log, density log, spontaneous potential log, and sonic log. The presence of reservoir properties through all these well logs was identified in only C-Interval and different zones are marked for a reservoir in C-Interval. Initially, many reservoir zones were marked but then the number of zones was reduced by merging small-sized zones and neglecting subtle zones as shown in Figure 14A–D. Further detail is given in Table 1.
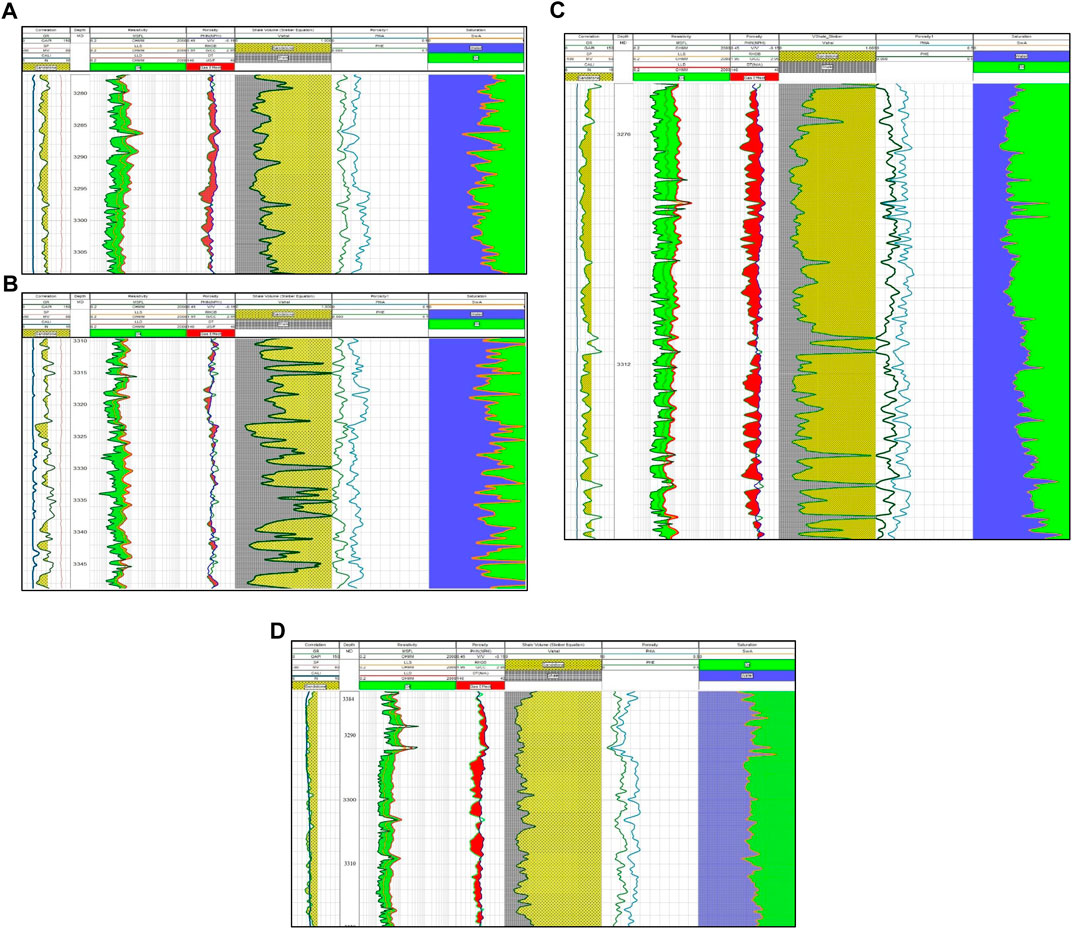
FIGURE 14. (A) Zone 1 well logs of Sawan-2 (B) Zone 2 well logs of Sawan-2 (C) Zone 1 well logs of Sawan-7 (D) Zone 1 well logs of Sawan-9.
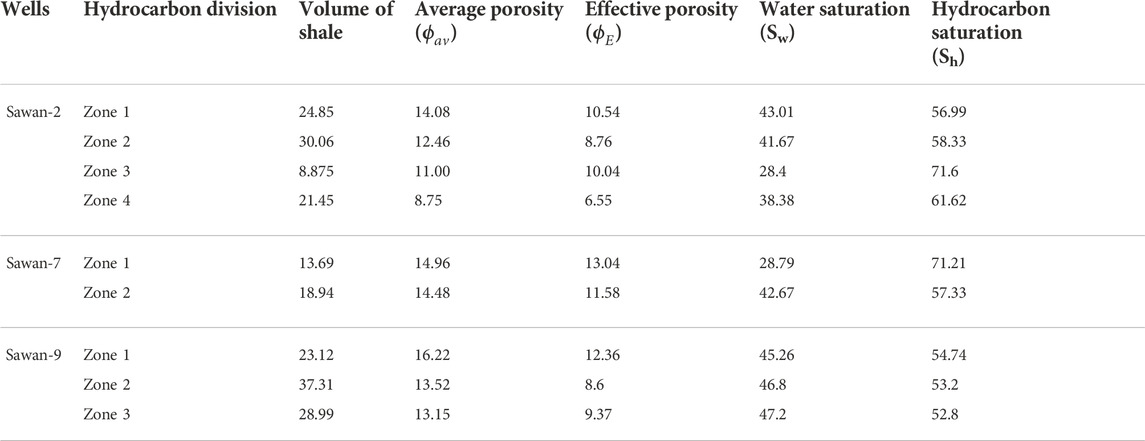
TABLE 1. Detailed petrophysics result of C-Interval (C-Sand) in given well logs data.
Conclusion
This research includes seismic structural interpretation, seismic attributes analysis, spectral decomposition, and petrophysical analysis resulting in the following conclusion:
1. The seismic interpretation tells the structural trend up dipping in the north to west and down dipping in the east to south direction, fault marking indicates the general trend of faults from Northwest to Southeast, and contour mapping shows structural traps for hydrocarbon accumulation.
2. Seismic attribute validates lateral continuity of horizons, faults interpretation, and zone of interest for hydrocarbon. Seismic attribute analysis results are confirming the seismic structural interpretation and presence of hydrocarbons in the C-Interval of the Lower Goru Formation.
3. Petrophysical analysis indicates substantial hydrocarbon possibility in the C-Interval of all three given wells (Sawan-2, Sawan-7, and Sawan-9). The four zones of the Sawan-2 well have hydrocarbon saturation from 57% to 72%. Sawan-7 has two zones: zone 1 with 71% and zone 2 with 57% hydrocarbon saturation. Three zones for the Sawan-9 well were identified each of the three zones having a hydrocarbon saturation of approximately 53%.
Data availability statement
The datasets presented in this article are not readily available because the data used for this research work is highly confidential and it is the property of the DGPC to provide this to university students for research work only. Permission will be required from DGPC to use it for research purpose.
Author contributions
All authors contributed to the literature review, methodology, formal analysis, data interpretation, writing, and reviewing of the manuscript.
Acknowledgments
We thank Directorate General Petroleum Concession (DGPC), Pakistan and for providing Seismic and Well Logs Data for this research. The authors are grateful to the Department of Earth and Environmental Sciences, Bahria University, Islamabad for providing support and a geophysical software lab facility to conduct this study. We are thankful to Petrel and Kingdom for providing free software licenses to Bahria University under their University Grant Programs.
Conflict of interest
The authors declare that the research was conducted in the absence of any commercial or financial relationships that could be construed as a potential conflict of interest.
Publisher’s note
All claims expressed in this article are solely those of the authors and do not necessarily represent those of their affiliated organizations, or those of the publisher, the editors and the reviewers. Any product that may be evaluated in this article, or claim that may be made by its manufacturer, is not guaranteed or endorsed by the publisher.
References
Abbas, A., Zhu, H., Anees, A., Ashraf, U., and Akhtar, N. (2019). Integrated seismic interpretation, 2D modeling along with petrophysical and seismic attribute analysis to decipher the hydrocarbon potential of missakeswal area: Pakistan. J. Geol. Geophys 7 (2), 1–12. doi:10.4172/2381-8719.1000455
Ahmad, N., Fink, P., Sturrock, S., Mahmood, T., and Ibrahim, M. (2004). “Sequence stratigraphy as predictive tool in lower Goru fairway, lower and Middle Indus platform, Pakistan,” in Proceedings of the PAPG annual technical conference (Islamabad, Pakistan), 85–105.
Ali, J., Ashraf, U., Anees, A., Peng, S., Umar, M. U., and Vo Thanh, H., (2022). Hydrocarbon potential assessment of carbonate-bearing sediments in a meyal oil field, Pakistan: Insights from logging data using machine learning and quanti elan modeling. Washington, DC: ACS Omega.
Anees, A., Zhang, H., Ashraf, U., Wang, R., Thanh, H. V., and Radwan, A. E., (2022), Sand-ratio distribution in an unconventional tight sandstone reservoir of Hangjinqi area, Ordos Basin: Acoustic impedance inversion-based reservoir quality prediction: Front. Earth Sci 10, p. 1018105.doi:10.3389/feart.2022.1018105
Anwer, H. M., Alves, T. M., Ali, A., and Zubair, (2017). Effects of sand-shale anisotropy on amplitude variation with angle (AVA) modelling: The Sawan gas field (Pakistan) as a key case-study for South Asia's sedimentary basins. J. Asian Earth Sci 147, 516–531. doi:10.1016/j.jseaes.2017.07.047
Ashraf, U., Zhang, H., Anees, A., Ali, M., Zhang, X., and Shakeel Abbasi, S., (2020). Controls on reservoir heterogeneity of a shallow-marine reservoir in sawan gas field, SE Pakistan: Implications for reservoir quality prediction using acoustic impedance inversion. Water 12 (11), 2972. doi:10.3390/w12112972
Ashraf, U., Zhang, H., Anees, A., Mangi, H. N., Ali, M., and Zhang, X., (2021). A core logging, machine learning and geostatistical modeling interactive approach for subsurface imaging of lenticular geobodies in a clastic depositional system, SE Pakistan. Nat. Resour. Res 30 (3), 2807–2830. doi:10.1007/s11053-021-09849-x
Ashraf, U., Zhu, P., Yasin, Q., Anees, A., Imraz, M., and Mangi, H. N., (2019). Classification of reservoir facies using well log and 3D seismic attributes for prospect evaluation and field development: A case study of sawan gas field, Pakistan. J. Pet. Sci. Eng 175, 338–351. doi:10.1016/j.petrol.2018.12.060
Azeem, T., Yanchun, W., Khalid, P., Xueqing, L., Yuan, F., and Lifang, C., (2016). An application of seismic attributes analysis for mapping of gas bearing sand zones in the sawan gas field, Pakistan. Acta Geod. geophys 51 (4), 723–744. doi:10.1007/s40328-015-0155-z
Aziz, H., Ehsan, M., Ali, A., Khan, H. K., and Khan, A., (2020). Hydrocarbon source rock evaluation and quantification of organic richness from correlation of well logs and geochemical data: A case study from the Sembar Formation, southern Indus Basin, Pakistan. J. Nat. Gas. Sci. Eng 81, 103433. doi:10.1016/j.jngse.2020.103433
Bashir, Y., Faisal, M. A., Biswas, A., Ali, S. H., Imran, Q. S., and Siddiqui, N. A., (2021). Seismic expression of miocene carbonate platform and reservoir characterization through geophysical approach: Application in central luconia, offshore Malaysia. J. Pet. Explor. Prod. Technol 11 (4), 1533–1544. doi:10.1007/s13202-021-01132-2
Bulat, J., and Long, D. (2001). Images of the seabed in the Faroe-Shetland Channel from commercial 3D seismic data. Mar. Geophys. Res. (Dordr) 22 (5), 345–367. doi:10.1023/a:1016343431386
Chen, X., Xing, T., Li, L., and Liu, S. (2018). Mistie problem and correction method of single channel seismic data in shallow sea. IOP Conf. Ser. Earth Environ. Sci 170 (2), 022062. doi:10.1088/1755-1315/170/2/022062
Chopra, S., and Marfurt, K. J. (2008). Emerging and future trends in seismic attributes. Lead. Edge 27 (3), 298–318. doi:10.1190/1.2896620
Chopra, S., and Marfurt, K. J. (2016). Understanding the seismic disorder attribute and its applications. Lead. Edge 35 (8), 695–702. doi:10.1190/tle35080695.1
Ehsan, M., Gu, H., Ahmad, Z., Akhtar, M. M., and Abbasi, S. S. (2019). A modified approach for volumetric evaluation of shaly sand formations from conventional well logs: A case study from the talhar shale, Pakistan. Arab. J. Sci. Eng 44 (1), 417–428. doi:10.1007/s13369-018-3476-8
Ehsan, M., Gu, H., Ali, A., Akhtar, M. M., Abbasi, S. S., and Miraj, M. A. F., (2021). An integrated approach to evaluate the unconventional hydrocarbon generation potential of the lower Goru Formation (cretaceous) in southern lower Indus Basin, Pakistan. J. Earth Syst. Sci 130 (2), 90. doi:10.1007/s12040-021-01584-4
Ehsan, M., and Gu, H. (2020). An integrated approach for the identification of lithofacies and clay mineralogy through Neuro-Fuzzy, cross plot, and statistical analyses, from well log data. J. Earth Syst. Sci 129 (1), 101. doi:10.1007/s12040-020-1365-5
Farrokhnia, F., Kahoo, A. R., and Soleimani, M. (2018). Automatic salt dome detection in seismic data by combination of attribute analysis on CRS images and IGU map delineation. J. Appl. Geophys 159, 395–407. doi:10.1016/j.jappgeo.2018.09.018
Hosseini-Fard, E., Roshandel-Kahoo, A., Soleimani-Monfared, M., Khayer, K., and Ahmadi-Fard, A. R. (2022). Automatic seismic image segmentation by introducing a novel strategy in histogram of oriented gradients. J. Petroleum Sci. Eng 209, 109971. doi:10.1016/j.petrol.2021.109971
Hussain, M., Liu, S., Ashraf, U., Ali, M., Hussain, W., and Ali, N., (2022). Application of machine learning for lithofacies prediction and cluster Analysis approach to identify rock type. Energies 15 (12), 4501. doi:10.3390/en15124501
Ismail, A., Ewida, H. F., Al-Ibiary, M. G., Gammaldi, S., and Zollo, A. (2020b). Identification of gas zones and chimneys using seismic attributes analysis at the Scarab field, offshore, Nile Delta, Egypt. Petroleum Res 5 (1), 59–69. doi:10.1016/j.ptlrs.2019.09.002
Ismail, A., Raza, A., Gholami, R., and Rezaee, R. (2020a). Reservoir characterization for sweet spot detection using color transformation overlay scheme. J. Pet. Explor. Prod. Technol 10, 2313–2334. doi:10.1007/s13202-020-00913-5
Kazmi, A. H., and Rana, R. A. (1982). Tectonic map of Pakistan (Islamabad, Pakistan: Geological Survey of Pakistan).
Kazmi, A. H., Jan, M. Q., Kazmi, A. H., and Rana, R. A. (1997). “Geology and tectonics of Pakistan,”. Tectonic map of Pakistan: Geological survey of Pakistan (Karachi, Pakistan: Graphic publishers), 528. scale 1:2,000,000.
Khan, H. K., Ehsan, M., Ali, A., Amer, M. A., Aziz, H., and Khan, A., (2022), Source rock geochemical assessment and estimation of TOC using well logs and geochemical data of Talhar Shale, Southern Indus Basin, Pakistan. Front. Earth Sci. (Lausanne) 10 1–15. doi:10.3389/feart.2022.969936
Khasraji-Nejad, H., Roshandel Kahoo, A., Soleimani Monfared, M., Radad, M., and Khayer, K. (2021). Proposing a new strategy in multi-seismic attribute combination for identification of buried channel. Mar. Geophys. Res 42 (4), 35–23. doi:10.1007/s11001-021-09458-6
Khayer, K., Roshandel Kahoo, A., Soleimani Monfared, M., Tokhmechi, B., and Kavousi, K. (2022b). Target-oriented fusion of attributes in data level for salt dome geobody delineation in seismic data. Nat. Resour. Res 31 (5), 2461–2481. doi:10.1007/s11053-022-10086-z
Khayer, K., Roshandel-Kahoo, A., Soleimani-Monfared, M., and Kavoosi, K. (2022a). Combination of seismic attributes using graph-based methods to identify the salt dome boundary. J. Petroleum Sci. Eng 215, 110625. doi:10.1016/j.petrol.2022.110625
Mafakheri, J., Kahoo, A. R., Anvari, R., Mohammadi, M., Radad, M., and Monfared, M. S. (2022). Expand dimensional of seismic data and random noise attenuation using low-rank estimation. IEEE J. Sel. Top. Appl. Earth Obs. Remote Sens 15, 2773–2781. doi:10.1109/jstars.2022.3162763
Mahdavi, A., Roshandel Kahoo, A., Radad, M., and Soleimani Monfared, M. (2021). Application of the local maximum synchrosqueezing transform for seismic data. Digit. Signal Process 110, 102934. doi:10.1016/j.dsp.2020.102934
Maleki, S., Ramazi, H. R., Gholami, R., and Sadeghzadeh, F. (2015), Application of seismic attributes in structural study and fracture analysis of DQ oil field, Iran. Egypt. J. Petroleum 24 (2), 119–130. doi:10.1016/j.ejpe.2015.05.001
Mughal, M. R., and Akhter, G. (2021). Predicting the gas resource potential in reservoir C-sand interval of lower Goru Formation, Middle Indus Basin, Pakistan. Open Geosci 13 (1), 49–71. doi:10.1515/geo-2020-0170
Naeem, M., Jafri, M. K., Moustafa, S. S., Al-Arifi, N. S., Asim, S., and Khan, F., (2016). Seismic and well log driven structural and petrophysical analysis of the lower Goru Formation in the lower Indus Basin, Pakistan. Geosci. J 20 (1), 57–75. doi:10.1007/s12303-015-0028-z
Othman, A. A. A., Fathy, M., and Maher, A. (2016). Use of spectral decomposition technique for delineation of channels at Solar gas discovery, offshore West Nile Delta, Egypt. Egypt. J. Petroleum 25 (1), 45–51. doi:10.1016/j.ejpe.2015.03.005
Qiang, Z., Yasin, Q., Golsanami, N., and Du, Q. (2020), Prediction of reservoir quality from log-core and seismic inversion analysis with an artificial neural network: A case study from the sawan gas field, Pakistan. Energies. 13 (2), 486. doi:10.3390/en13020486
Radfar, A., Chakdel, A. R., Nejati, A., Soleimani, M., Farid, , and Taati, (2019). New insights into the structure of the south caspian basin from seismic reflection data, gorgan plain, Iran. Int. J. Earth Sci. 108 (2), 379–402. doi:10.1007/s00531-018-1659-x
Radovich, B. J., and Oliveros, R. B. J. T. L. E. (1998). 3-D sequence interpretation of seismic instantaneous attributes from the Gorgon Field. Lead. Edge 17 (9), 1286–1293. doi:10.1190/1.1438125
Rider, M. H., Robinson, H., and Davis, T. (2002). “The geological interpretation of well logs, Sutherland, Scotland, Rider-French Consulting LtdSeismic reservoir characterization of distributary channel sandstones in the Lower Cretaceous Paluxy reservoir, Delhi Field, Louisiana,” in Proceedings SEG technical program expanded abstracts 2012 (Sutherland, Scotland: Society of Exploration Geophysicists), 2801–2806.
Robinson, H., and Davis, T. (2012). “Seismic reservoir characterization of distributary channel sandstones in the Lower Cretaceous Paluxy reservoir, Delhi Field, Louisiana,” in Proceedings SEG Technical Program Expanded Abstracts 20122012 (Sutherland, Scotland: Society of Exploration Geophysicists), 1–6. doi:10.1190/segam2012-0164.1
Schlumberger, L. (1991). Log interpretation principles/applications. Houston, Tx: Schlumberger Educational Services.
Stieber, S. (1970). “Pulsed neutron capture log evaluation-Louisiana gulf coast,” in Proceedings fall meeting of the society of petroleum engineers of AIME (Houston, Texas: Society of Petroleum Engineers), 1–7. doi:10.2118/2961-ms
Torvela, T., Moreau, J., Butler, R. W. H., Korja, A., and Heikkinen, P. (2013). The mode of deformation in the orogenic mid-crust revealed by seismic attribute analysis. Geochem. Geophys. Geosyst 14 (4), 1069–1086. doi:10.1002/ggge.20050
Wandrey, C. J., Law, B., Shah, H. A., and Reston, V. (2004). “Sembar Goru/Ghazij composite total petroleum system, Indus and Sulaiman-Kirthar geologic provinces, Pakistan and India,” in Petroleum systems and related geologic studies in region 8, south asia. Editor C. J. Wandrey, 1–23.U. S. Geol. Surv.
Zahmatkesh, I., Kadkhodaie, A., Soleimani, B., and Azarpour, M. (2021). Integration of well log-derived facies and 3D seismic attributes for seismic facies mapping: A case study from mansuri oil field, SW Iran. J. Petroleum Sci. Eng 202, 108563. doi:10.1016/j.petrol.2021.108563
Zaigham, N. A., and Mallick, K. A. (2000). Prospect of hydrocarbon associated with fossil-rift structures of the southern Indus basin, Pakistan. Am. Assoc. Pet. Geol. Bull 84 (11), 1833–1848. doi:10.1306/8626C3A7-173B-11D7-8645000102C1865D
Keywords: seismic structural interpretation, geophysical interpretation, seismic attribute analysis, petrophysical analysis, reservoir
Citation: Tounkara F, Ehsan M, Nasar Iqbal M, Al-Ansari N, Hajana MI, Shafi A and Elbeltagi A (2023) Analyzing the seismic attributes, structural and petrophysical analyses of the Lower Goru Formation: A case study from Middle Indus Basin Pakistan. Front. Earth Sci. 10:1034874. doi: 10.3389/feart.2022.1034874
Received: 02 September 2022; Accepted: 07 November 2022;
Published: 11 January 2023.
Edited by:
Mehrdad Soleimani Monfared, Karlsruhe Institute of Technology (KIT), GermanyReviewed by:
Mohammed Abdallsamed, Kordofan University, South SudanQazi Adnan Ahmad, Yonsei University, South Korea
Keyvan Khayer, Shahrood University of Technology, Iran
Amin Roshandel Kahoo, Shahrood University of Technology, Iran
Mohammad Radad, Shahrood University of Technology, Iran
Copyright © 2023 Tounkara, Ehsan, Nasar Iqbal, Al-Ansari, Hajana, Shafi and Elbeltagi. This is an open-access article distributed under the terms of the Creative Commons Attribution License (CC BY). The use, distribution or reproduction in other forums is permitted, provided the original author(s) and the copyright owner(s) are credited and that the original publication in this journal is cited, in accordance with accepted academic practice. No use, distribution or reproduction is permitted which does not comply with these terms.
*Correspondence: Muhsan Ehsan, bXVoc2FuZWhzYW45OEBob3RtYWlsLmNvbQ==; Nadhir Al-Ansari, bmFkaGlyLmFsYW5zYXJpQGx0dS5zZQ==