 Abi Stone
 Yijian Zeng
 Lianyu Yu
 Martine van der Ploeg
 Heike Wanke
95% of researchers rate our articles as excellent or good
Learn more about the work of our research integrity team to safeguard the quality of each article we publish.
Find out more
BRIEF RESEARCH REPORT article
Front. Earth Sci. , 26 October 2022
Sec. Quaternary Science, Geomorphology and Paleoenvironment
Volume 10 - 2022 | https://doi.org/10.3389/feart.2022.1034671
This article is part of the Research Topic Environmental Change in Drylands: Past, Present, Future - Volume II View all 9 articles
Time-series of dryland rainfall over 100–1000 s of years are scarce but are needed to underpin improved predictions under future climate change. Dryland sand dunes are established Quaternary geomorphic archives, which also contain pore moisture as part of the unsaturated zone (USZ), with chemical tracers that provide a novel proxy for palaeomoisture. Chloride depth profiles, converted using a mass balance approach to temporal records, are known as hydrostratigraphies. Evaporative enrichment of meteoric chloride occurs in the near-surface zone and the established signature gets transported vertically via infiltration. This study explores the potential for this approach for southern Kalahari vegetated linear dunes comparing twelve (10–12 m deep) hydrostratigraphies across space and sampled in different years (2011, 2013, and 2016). Three further profiles sampled close to an interdune pan demonstrate that additional chloride is added locally to the dune closest to the pan. The remaining hydrostratigraphies show variable trends, with four broad groupings, leading us to suggest this region is unsuitable for this approach. Insights into this variable behavior were sought from simulating liquid and vapor flux using STEMMUS (Simultaneous Transfer of Energy, Mass and Momentum in Unsaturated Soil). Simulations suggest the mixing zone can reach 10 m thick, which helps account for the variation in hydrostratigraphies. Heterogeneity may also arise from spatially-heterogenous receipt of convective rainfall events and non-uniform vegetation cover. Furthermore, the vegetated nature of the landscape leads to less uniform moisture movement within the dune sands. We call for future applications to include site-specific insights into moisture dynamics.
Continental desert rainfall records are rare. Instrumental records lack wide spatial coverage and temporal completeness, whilst historical documentary sources have uneven coverage. This is particularly notable in the Kalahari of central southern Africa, with just one rainfall station in Botswana containing data for the nineteenth century (Nicholson, 2001a), and documentary sources spatially concentrated in northern South Africa and eastern Botswana (e.g. Nash and Enfield, 2008). Understanding past precipitation patterns and how they relate to climatic forcing (e.g., Nicholson and Kim, 1997; Nicholson, 2001b; Nash and Enfield, 2008) is vitally important when assessing the future vulnerability of these regions under climatic change. Reductions in rainfall totals and increases in rainfall intensity are predicted as ‘very likely’ for many drylands (IPCC, 2021), including southwest Africa (Niang et al., 2014). Paleorecords are a key tool to improve confidence in rainfall predictions used to evaluate climate model performance (Flato et al., 2013), and as time-series data for machine learning approaches to forecasting (see Barrera-Animas et al. (2022) for a recent review). Improving rainfall reconstructions in drylands requires the development of proxy records that offer greater spatial coverage and more-complete temporal-sequences over timescales of 100–1000 s of years.
Dryland sand dunes, and particularly linear dunes, have been a focus of palaeoenvironmental reconstruction in drylands for more than 50 years based on their geomorphology and sediment accumulation history (see review by Telfer and Hesse, 2013 and the INQUA Dunes Atlas chronological database (Lancaster et al., 2016)), including in southern Africa (Stone, 2021). When considered as part of the dryland hydrogeological system, they are part of the unsaturated zone (USZ) where sediment pores are only partly saturated, and act as a conduit for moisture to the underlying groundwater table. Only a small proportion of rainfall reaches (recharges) groundwater, owing to high evapotranspirative losses. Below a recycling, or mixing, zone (where pore moisture moves upwards as well as downwards), the remaining moisture can infiltrate via a diffuse pathway via piston flow. This has been demonstrated empirically in the field using neutron probe measurements (e.g. Selaolo, 1998), using the depth position of bomb-spike tritium (e.g. Allison and Hughes, 1974; Dincer et al., 1974) and observations of wetting fronts in hand-cut sediment exposures (e.g. Stone and Edmunds, 2016). A detailed study of water percolation in Negev Desert, Israel, vegetated linear dunes (VLDs) demonstrated sub-surface flow occasionally occurs in addition to piston-flow, most commonly on south-facing dune flanks (the more irregular downwind surfaces with less-well developed surface crusts and vegetation cover) (Yair et al., 1997). Increasingly sophisticated numerical models for water flow have developed from the Philip and de Vries. (1957) model that employed the Richards approximation. For example, incorporating moisture and heat (e.g. Milly, 1982; Parlange et al., 1982; Saito et al., 2006; Sakai et al., 2009), incorporating gas-phase flow (e.g. McWhorter, 1990), two-phase flow models for heat and mass (e.g. Alonso et al., 1990; Zeng et al., 2011a, Zeng et al., 2011b; Yu et al., 2018; Yu et al., 2020), and non-equilibrium two-phase heat and mass flow (Niessner and Hassanizadeh, 2008, Niessner and Hassanizadeh, 2009). Insights into dryland USZ moisture behavior benefit greatly from simulations, such STEMMUS (Simultaneous Transfer of Energy, Mass and Momentum in Unsaturated Soil), designed for dryland sediments (Zeng and Su, 2013).
Chloride (Cl−) is an inert tracer within the USZ, well established as a tool for estimating rates of diffuse groundwater recharge via a mass balance approach (CMB) (Scanlon et al., 2006). It can also serve as a novel palaeoclimatic proxy, or hydrostratigraphy, with ∼40 applied studies from North America, North Africa, China/Mongolia, India, and Australia (see Stone and Edmunds, 2016). Variations in Cl− concentration in successive packages of water in the sand provide a record of changes to the extent of evapotranspirative enrichment in the near surface (Edmunds and Tyler, 2002; Stone and Edmunds, 2016). Hydrostratigraphies are produced from vertical profiles of pore moisture Cl− concentration, whereby: 1) Cl− enters the top of the sediment profile (within precipitation and any dry deposition) and becomes enriched as water is lost to evaporation and plant uptake; 2) this results in an established Cl− signature in pore moisture relating to evapotranspiration in the mixing zone; and 3) moisture infiltrates beyond this subsurface mixing zone, carrying its established signature. Accordingly, variations with depth record a climate-dependent signature that established when that moisture was in the recycling zone. A more detailed methodological treatment is given in Stone (2016) and Stone and Edmunds (2016). The age, or residence time, of moisture at any depth (z) is calculated using:
where: t is time, θ is volumetric moisture content, Cs is Cl− concentration in sediment (pore moisture), P is long-term average annual precipitation at the site, Cp is Cl− concentration in rainfall and Cd is Cl− concentration from dry deposition (Cook et al., 1992).
Depending on the rate of water movement (recharge) through the USZ and the vertical sediment thickness, these hydrostratigraphies have given a qualitative insight into past hydroclimate at decadal to multi-decadal resolution (e.g. Gates et al., 2008a; b; Ma et al., 2009; Chen et al., 2010) or shifts in aridity at the timescale of the Last Interglacial through to the Holocene (e.g. Tyler et al., 1996). The assumptions of successfully applying the CMB hydrostratigraphy approach include that: 1) dune pore moisture below the near-surface mixing zone is being transferred vertically, approximating piston flow; 2) the input of Cl− from meteoric sources (precipitation and dry deposition) are more-or-less consistent throughout the time period being investigated, 3) there has been no addition of Cl− sources and 4) there is no notable uptake of Cl− by vegetation. Stone and Edmunds (2016) discuss potentially problematic sites. Sediment types to avoid include heavily layered soil profiles with varying sedimentological properties (e.g. Yeh and Harvey, 1990), water-repellent soils (e.g. Wessel, 1988) and coarse-grained sediments (all screenable via laboratory analysis), which are likely to prevent piston flow (e.g. Babel et al., 1995; Razanezhad et al., 2006). Sloping surfaces should also be avoided because they encourage lateral flow (e.g. Zaslavsky and Sinai, 1981; Stephens, 1994; Yair et al., 1997). Areas with surface ponding and occluded pockets of mineralized sediments should also be avoided. The most suitable sites have a combination of sand-rich sediments that are not too-well sorted and contain some silts, there is no observed surface water ponding, and precipitation of between 80 and 250 mm/y, which facilitates some groundwater recharge (see the map within Stone and Edmunds, 2016). The crests of VLDs in the southern Kalahari (Figure 1) have these combinations of characteristics and were therefore anticipated to be a suitable region for this approach, also lacking visible soil crusts, unlike in Negev Desert VLDs (Kidron and Yair, 1997; Yair, 2008) or as reported in the Botswanan Kalahari (Dougill and Thomas, 2004). This paper presents a substantial dataset of chloride tracer hydrostratigraphies for this region. Our aims are to: 1) derive hydrostratigraphies for multiple profiles in the southwest Kalahari VLDs, 2) compare hydrostratigraphies across space taken in different field seasons (2011, 2013 and 2016) in order to assess their reproducibility, 3) explore whether dunes close to a pan display unsuitable characteristics and 4) compliment the field data with insights into mixing zone depth and moisture flux behavior from a numerical computer simulation model (STEMMUS) for USZ moisture flux.
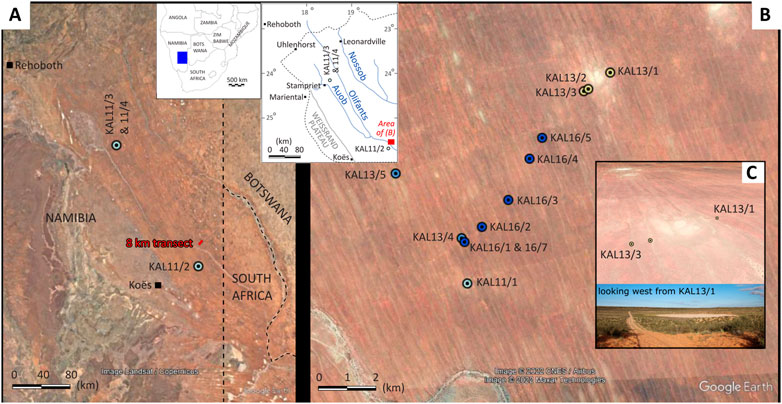
FIGURE 1. Study site, where (A) shows sample locations (with insets depicting the location in Southern Africa and the outline of the Namibian portion of the Stampriet Basin), with (B) enlarging the area of the 8 km target transect and (C) showing a GoogleEarth oblique view of the pan and a photograph of the pan taken from KAL13/1 looking west.
The southwest Kalahari VLD dunefield (∼100,000 km2) stretches from ∼23°S in Namibia to ∼28°S in South Africa, and east into Botswana (Figure 1A). The thickness of Kalahari sediments increases eastwards reaching ∼150 m (Haddon and McCarthy, 2005), with the northwest-southeast oriented VLDs (Bullard et al., 1995) reaching ∼20 m. Dunes are the landcover for ∼80% of the Stampriet Basin (Stone, 2022), the multi-layer aquifer in this region (Figure 1A, inset). Rainfall increases from southwest (Koes ∼180 mm/y) to northeast (Leonardville ∼240 mm/y), falling from September to May (most in January-March), with high inter-annual variability, e.g. the 2010–2011 rainy season had ∼3 times annual average precipitation, and the 24–25th February 1960 Uhlenhorst cloudburst had >400 mm in 12 h (Schalk, 1961). Mean Cp across 5 rain gauges (2011–2012) in the study region is 0.9 mg/L when weighted by rainfall event amount (Supplementary Information S3), with similar monthly averages in 2002 (0.3–1.2 mg/L) ∼750 km southeast in Bloemfontein (van Tonder and Bean, 2003). Variations across space and time do occur, as shown by Beekman et al. (1996) in Botswana 1987–1997, although expressed in mgm−2yr−1 for wet and dry deposition. There is a perennial cover of trees (Vachellia erioloba coverage 1%–5%) and shrubs (e.g. Rhigozum trichotomum <40% in interdune regions, 1–5% on dune flanks) and an ephemeral cover of grasses (Stipagrostis amabilis, Schmidtia kalahariensis, Aristida congesta) during the wet season (Supplementary Information S1 gives details for each sampled site). This was anticipated to be a suitable region for this approach, based on: 1) existing sedimentological data showing these are moderately-well-sorted medium sands (mean grain size 260–290 μm) (Stone and Thomas, 2008; Stone and Edmunds, 2012, Stone and Edmunds, 2014), 2) mean annual rainfall fitting within the identified 80–250 mm/y threshold of Stone and Edmunds (2016), 3) dune crests not being densely vegetated, despite this being a region of VLDs and 4) observations of a homogenous wetting front following rainfall in the field by the author (Supplementary Information S4).
Our study focusses on an 8 km transect on Terra Rouge farm (Figure 1B), with 9–16 m dunes spaced 200–500 m apart. Sampling was undertaken across the three field seasons (2011, 2013, and 2016) to assess reproducibility of obtained hydrostratigraphies. From west to east these are KAL13/5, KAL11/1, and KAL13/4 (resampled with two profiles: KAL16/1 and KAL16/7), and KAL16/2, KAL16/3, KAL16/4, and KAL16/5 (Figure 1B). These are placed into the wider regional context of a southwest-northwest precipitation gradient. KAL11/2 (south) with ∼181 mm/y (like the main transect) and KAL11/3, and duplicate profile 11/4, (200 km northwest of KAL11/2) experiencing ∼190 mm/y (Figure 1A). In addition, we sampled three dunes associated with a ∼0.15 km2 pan (KAL13/3, 13/2 and 13/1) (Figures 1B,C) with the hypothesis that these sites would not be suitable for producing hydrostratigraphies. Kalahari interdune pans may provide a non-meteoritic source of Cl−, e.g., halite (NaCl) and sylvite (KCl) have been documented at Witpan, Northern Cape, South Africa (Telfer et al., 2009) and central eastern Namibia pans (Mees, 1999; Milewski et al., 2017).
Dune sediment profiles were hand augered, with samples sediments collected in an aluminum compression head, transferred either to sections of drainpipe with moisture-tight lids or ziplock bags for transit to the laboratory. Particle size distribution was measured using laser granulometry, with statistics calculated using GRADISTAT (Blott and Pye, 2001), applying the methodology of Folk and Ward (1957). Sediment moisture contents were established using representative subsamples of each sample using a gravimetric method, oven drying at 110°C for 48 h (Black, 1965), and reported as percentage of dry sample weight.
Sediment pore moisture was extracted via a commonly applied elutriation technique, using 30 g of sediment to 12 ml of ultrapure deionized water (recorded precisely using a mass balance to facilitate a dilution correction), left in a shaker tray for ∼2 h, centrifuged to separate out the supernatant from the sediment and filtered at 0.2 µm (sometimes requiring sequential filtration from 0.8 µm to remove orange-red precipitates). Analysis of chloride was undertaken using ion chromatography (IC). 2011 and 2013 samples were measured using a Dionex IC at SoGe, University of Oxford and 2016 samples using a metrohm IC in the Department of Geography, University of Manchester, both calibrated using standard concentrations that capture the range of the supernatants, a limit of detection of 0.1 mg/L, and 5–10% analytical precision based on repeat measurements of standards and samples. For the hydrostratigraphies 181 mm/y for P (190 mm/y for the site further north) and 0.9 mg/L for Cp were used in Eq. (1).
We model moisture physics transport using the STEMMUS Programme (Zeng et al., 2011a; Zeng et al., 2011b) simulation of liquid water and vapor flux, along with dry air and heat transfer, in unsaturated sediments. It was developed specifically to describe the vapor-dominant soil water and heat transport processes in dryland areas (Zeng and Su., 2013). The sediment is modelled as sandy soil (based on particle size data), with homogeneous texture and one set of soil hydraulic parameters (soil profile: 0–50 m). The model inputs were: 1) meteorological forcing data, including air temperature, wind speed, relative humidity, air pressure, radiation, precipitation (using ECMWF Re-Analysis data) from 1979 to 2019, 2) surface soil temperature and 3) soil hydraulic parameters (saturated hydraulic conductivity of 7.87*10–4 cm s−1, saturated water content of 0.432 cm3 cm−3, residual water content of 0.045 cm3 cm−3, Van Genuchten parameter n of 1.9 and alpha of 0.045). The long-term time series of (1) and (2) are from the ERA analysis data (1979–2019, 14,700 days in total).
Figure 2 depicts moisture content and Cs alongside sediment texture. Dune sediments are predominantly moderately well-sorted medium sand (mean grain size for all samples is 278 µm), becoming finer and less well-sorted with depth with a more-marked trend in the dunes associated with the pan (Supplementary Information S2). The silt content (25–38%) below 8 m in KAL13/2 could result from incorporation of water-lain fines into this dune. Sediment texture supports the CMB hydrostratigraphy assumption that moisture will move roughly homogenously, and no preferential flow structures were observed in the wetting front appearance following rainfall in these dunes (Supplementary Information S4).
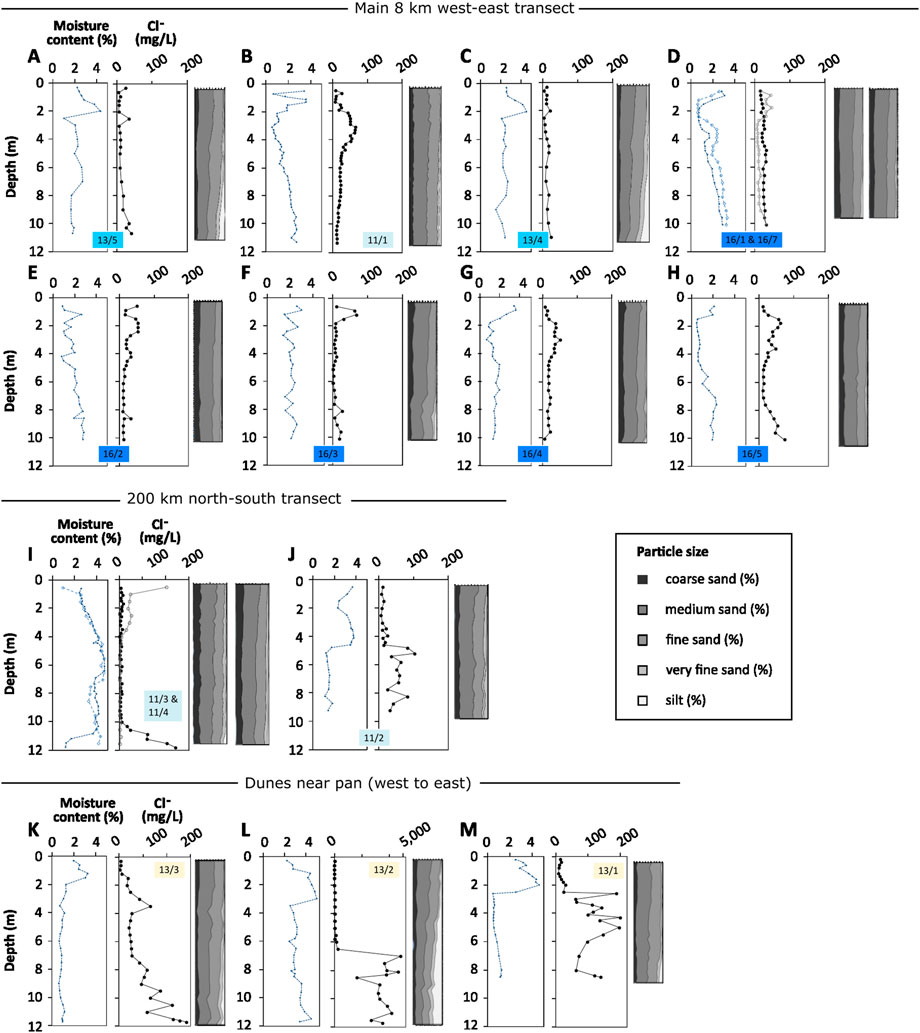
FIGURE 2. Unsaturated zone profiles of moisture content, chloride and particle size distribution. Top, for the 9 profiles along the main 8 km transect (A–H) organized from west to east (A) KAL13/5, (B) KAL11/1, (C) KAL13/4, (D) paired cores KAL16/1 & 16/7, (E) KAL16/2, (F) KAL16/3, (G) KAL16/4, (H) KAL16/5. Middle for the sites along the north-south 200 km transect (I, J), organized from north to south (I) paired cores KAL11/3 & 11/4, (J) KAL11/2. Bottom for the dunes near the pan (K–M) organized from west to east (K) KAL13/3, (L) KAL13/2, (M) KAL13/1.
Five moisture profiles from 2013 (13/5, 13/4, 13/3, 13/2, and 13/1) (Figures 2A,C,K,L,M) and one from 2011 (11/1) (Figure 2B) have a similar trend, with a peak in moisture ∼2 m, with a thicker elevated zone in 13/2 (1.5–3 m) (Figure 2L). These derive from a wetting event from rainfall prior to, or during, 2013. These moisture peaks (4.6% in 13/4 and 13/1 and 4.3% in 13/5) are not observed to have moved to a greater depth 3 years later in the 2016 profiles, which we would expect from vertical infiltration of packages of water. Moisture contents <3.3% below 2 m in all 2016 profiles suggests further evaporation, or diffusion, of 2013 moisture peaks, making it likely the recycling zone extends below 2 m, with evaporative losses of moisture that has not infiltrated below the recycling zone (e.g. Zeng et al., 2009a; Zeng et al., 2009b). There are near-surface moisture peaks in four of 2016 profiles (16/1 & 16/7 (paired cores), 16/4 and 16/5), but at shallower depths than in 2013 (0.6 m, 0.9 m, 0.9 m and 1.2 m respectively) (Figures 2D,G,H), originating from wetting events between 2013 and 2016. Paired cores KAL11/3 & 11/4 (∼165 km northwest of the main transect) (Figure 1) do not match the 2011 trend, increasing steadily with depth to ∼6 m (Figure 2I), perhaps driven by variable rainfall in a local convective rainfall regime in this semi-arid area (e.g. Taylor et al., 2012). The lack of moisture peaks in 16/2 and 16/3 (Figures 2E,F) are harder to account for by convective rainfall given their proximity to the other 2016 profiles, and have no notable difference in vegetation type or cover (Supplementary Information S1).
Mean Cs in the nine profiles along the main 8 km transect range from 12 to 31 mg/L (minimums 3–15 mg/L and maximums 24–73 mg/L) (Figures 2A–H, Supplementary Information S1, S2). All Cs is enriched compared to rainfall (Cp = 0.9 mg/L) but much lower than concentrations measured in groundwater at Terra Rouge in 2016 (232–643 mg/L) (Supplementary Information S5.1). Cs is more enriched in KAL11/3 and 11/4 (∼100 mg/L at the top of KAL11/3 and >100–241 mg/L at the base of KAL11/3) (Figure 2I). Much higher Cs (1,600–4,800 mg/L), in the profile closest to the pan (KAL13/2, which has a finer mean grain size of 187 μm and below 6.5 m 122 μm with 20–38% silt) (Figure 2L; Supplementary Information S2) suggests a sedimentary source of Cl− or remnants from times of stronger evaporatively enriched during discharge-phases in the pan. This would have been a regime different to 2013 when the pan water had low Cl− concentrations (16, 17, and 23 mg/L) (Supplementary Information S6). Therefore, as predicted, dunes close to these pans in the Kalahari are not suitable for the CMB hydrostratigraphy approach.
Figure 3 plots 5-year moving averages of 1/Cl− against moisture residence time (using Eq. (1)) for the nine profiles along the 8 km target transect (Figure 3A) and for the three dunes along the longer north-south transect (Figure 3B). Differences in Cs depth profiles between dunes (Figure 2) manifest into conflicting “apparent” hydrostratigraphies (Figure 3). There are four groups of trends: 1) increasing moisture availability through time (KAL11/2, 13/5, and 13/4 with its resampled 16/7), 2) an overall drying trend (KAL11/1, 16/2 and 16/4), 3) peaks and troughs, with different timings (paired cores KAL11/3 and 11/4 in the northwest show a moisture availability peak in the late 1990s, whilst KAL16/3 and 16/4 on the target transect show a peak ∼2010) and 4) one profile with no discernable change through time (KAL16/1, which should pair with 16/7). Group 1 is closest to tracking annual rainfall trends (Figure 3C). Data for individual rainfall events at more-detailed spatial resolution may provide further insights here.
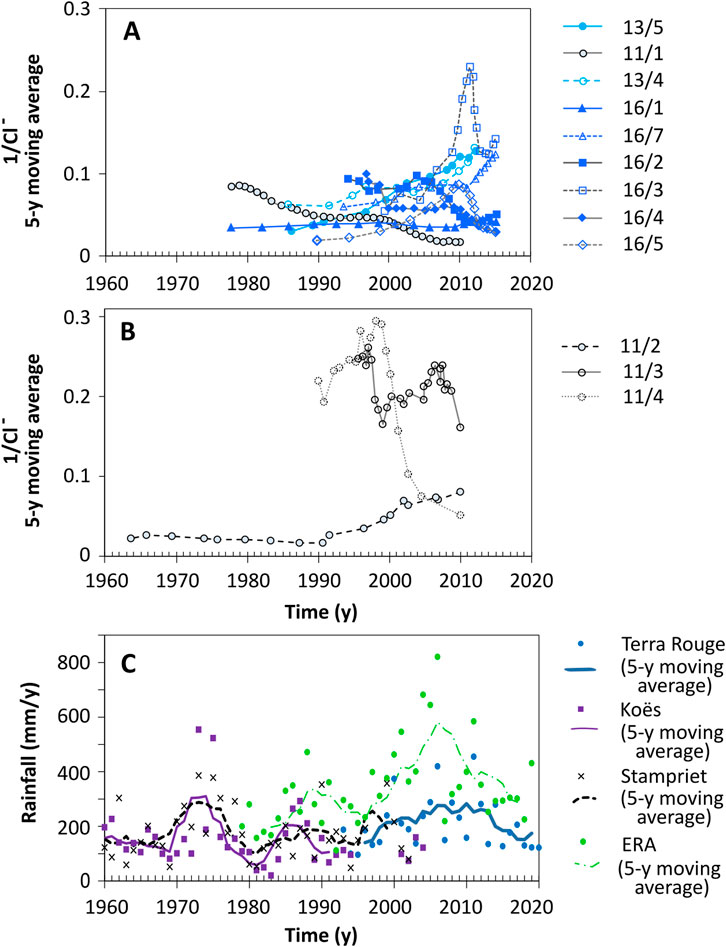
FIGURE 3. (A,B) Time-series plots of 1/Cl−, known as hydrostratigraphies, grouped into (A) the nine sites along the main 8 km transect and (B) the sites along the wider southeast-northwest precipitation gradient. These assume the top 3 m of each profile represents the recycling zone (based on depths of observed subsurface moisture elevation in Figure 2). (C) shows annual rainfall amounts and 5-year moving averages for Terra Rouge (Pieter Möller’s personal record), Koës and Stampriet (available until 1994 and 2002 respectively from the Namibian Meteorological Survey) and ECMWF Re-Analysis (ERA) data.
STEMMUS provides 5-yearly (Figures 4A–H) and 1-yearly (Supplementary Information S7) average moisture flux profiles, depicting total (solid line), liquid (dashed line) and vapor (dotted line) for 1979 to 2018. Vapor flux is consistently downwards, whilst liquid flux is upward closest to the surface, with a trend to downward flux at depth. The depth of this inflection/change varies through time. The shallowest of the shifts to downward flux occurs at about 2 m (1979–1983) (Figure 4A), whilst through until 1998, this occurs ∼10 m (Figures 4B–D), demonstrating an 8 m variation in mixing zone depth.
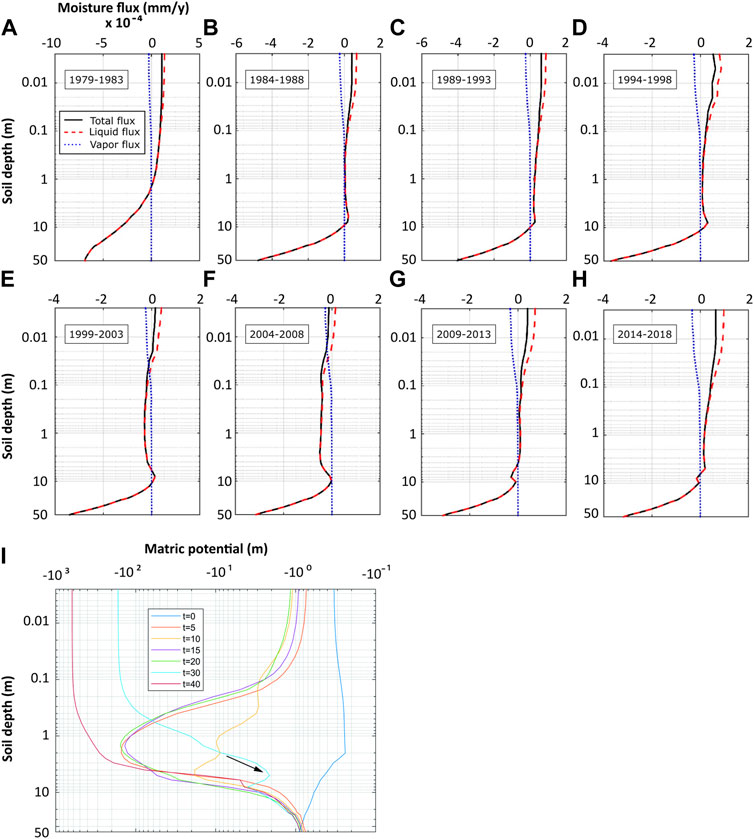
FIGURE 4. (A–H) Simulation soil moisture flux between 1979 and 2018 in 5-year averaged time-slices, where the solid line (black in online version) is total flux, the dashed line (red in online version) is liquid flux, and the dotted line (blue in online version) is vapor flux. Axis labels are the same for all plots. Negative values indicate downward fluxes. (I) Shows profiles of simulated matric potential for different years of the simulation. The arrow depicts a shift in a matric potential peak from 2 m at 10 years (1989) to 5 m in 30 years (2009), equivalent to seeing a moisture content peak (like in Figure 2) migrate downwards by that depth.
Between 1999 and 2003 there is downward total (and liquid) flux between 0.03 and 6 m (Figure 4E), whilst total flux is downward for the whole profile in 2004–2008. Supplementary Information S7 shows this is driven by years 2004–2006, with a marked change to upward flux ∼2 m in 2007, and that other wetter years with downward flux were 1998 and 2000–2006. Simulated soil matric potential (Figure 4I) depicts instantaneous matric potential profiles at the end of different years of the simulation. At t=10 years (1989) there was some infiltration, and that the shift in a peak from 2 m at that time to 5 m at t=30 years (2009) suggests a slow migration of infiltrating moisture (depicted with a black arrow in Figure 4I).
The majority of USZ Cs is very low (mostly <50 mg/L) compared to Terra Rouge groundwater (mean 398 mg/L), and the GROWAS database (24.2oS to 25.7oS, 19.5oE to 20.0oE) (mean 478 mg/L) (Supplementary Information S5). This contrasts with Kalahari sands further east in Letlhakeng-Botlhapatlou, Botswana, where mean Cs (20–430 mg/L) is similar to groundwater Cl (25–125 mg/L) (Selaolo, 1998). In our study region, most groundwater is extracted from the Auob unit (5,000 to 10,000 years old (JICA Study team, 2002)), the middle of the three aquifer units beneath the unconfined Kalahari unit. We infer that any recharge through the dunes in recent decades only reaches the Kalahari unit, with limited hydrogeological connectivity with the underlying Auob unit, which contains a more evaporated moisture source.
It is worth highlighting that variability in hydrostratigraphies within a study region is not unusual. For example, of 13 hydrostratigraphies from the Badan Jarain Desert, Inner Mongolia, seven show increasing moisture availability from 1900 to 2000, whilst four show fluctuating or decreasing trends (see Figure 9 within Gates et al. (2008b)). However, given our divergent four groupings it is prudent to suggest this approach faces challenges in the Kalahari, relating either to the behavior of moisture, or to the input of Cl− within these dune sediments.
The STEMMUS moisture simulation for 1979–2017, illustrates a potential reason. The depth of the mixing zone exceeds the 3 m assumed for the hydrostratigraphies, frequently reaching 10 m (Figure 4), with temporal fluctuations in both liquid and vapor flux occurring on multi-year, and even year-to-year (Supplementary Information S7). This contrasts with a 4 m deep zone, revealed by neutron probe data, for Kalahari sands at Letlhakeng-Botlhapatlou, Botswana (Selaolo, 1998). If the mixing zone is 10 m deep, it is nearly the entire depth of VLDs above the Stampriet Basin. In addition, small-scale heterogeneities, such as changes in slope (Yair et al., 1997), are likely to introduce heterogeneity in Cs profiles even though we targeted the crests of linear dunes at locations with the lowest levels of vegetation (Supplementary Information S1) and without surface crusts. The vegetated nature of the landscape adds further heterogeneity by influencing water behavior in the mixing zone, and in the Negev VLDs higher salt concentrations are observed beneath perennial shrubs (Felix-Henningsen et al., 2008). A study of the influence of woody vegetation on recharge processes by Uugulu (2022) demonstrates that our understanding of active rooting depth and its influence on USZ water balance is still very limited. Our study area is vegetated to a greater extent than any of the existing successful applications of the hydrostratigraphy approach reviewed by Stone and Edmunds (2016). The STEMMUS simulation used here did not incorporate vegetation, and future simulations should model different levels of vegetation cover. Furthermore, changes to vegetation through time are expected in relation to precipitation inputs, as Siegal et al. (2013) found in Negev VLDs.
A non-meteoric Cl− input is indicated in KAL13/2 (Cs >1,000 mg/L), perhaps a precipitated salt during former phases of high-evaporation in the pan, noting this is higher than groundwater Cl− in this region (Supplementary Information S5). Nothing diagnostic was revealed by preliminary XRD, or XRF analysis of KAL13/2 samples compared to other dune sands (Supplementary Information S8). This sediment is finer (mean 122 μm below 6.5 m depth, with more silt), and differences in VLD sediment texture can be accompanied by different geochemistries, relating to sediment source (e.g. in the Negev (Muhs et al., 2013)). Cd has been shown to be a problem elsewhere in Namibia, with a 22–83% contribution in September 2002 and 2003 in rain gauges (19–22oS) (Wanke, 2005), and further east in Letlhakeng-Botlhapatlou, Botswana (14–59%, mean 41%, from 1983 to 1993) (Selaolo, 1998).
This study attempted to apply chloride tracer approaches within dune pore moisture to produce unsaturated zone hydrostratigraphies in the southern Kalahari, motivated by a need for better rainfall reconstructions in this region. Linear dune crest sites with sedimentary characteristics that meet the assumptions of the approach were sampled in 2011, 2013, and 2016 to assess the reproducibility of produced hydrostratigraphies. In addition, we were able to demonstrate that dunes neighboring an interdune pan, with finer grained sediments, were not suitable for this approach, because they contain a much higher chloride concentration, which is unlike the evaporative signature of modern-rainfall-derived chloride seen elsewhere in the landscape. Away from the pan, the lack of consistency between 12 hydrostratigraphy profiles suggests that this approach faces challenges in this setting. It is as important to present “negative”, or contradictory, results in the application of a technique, as it is to present “positive” findings. We simulated liquid and vapor transport using STEMMUS to explore reasons for this. Simulations demonstrate that: 1) packages of moisture can infiltrate with depth, but only during short discrete time-slices, and that 2) over multi-decadal timescales, a moisture-mixing zone that gets as deep as 10 m is simulated (on multi-year and year-to-year timescales) and this represents most of the 10–12 m dune depths sampled, therefore, mixing chloride signatures. Further reasons for inconsistencies may include spatial heterogeneity in rainfall receipt and the vegetated nature of the southern Kalahari where grass cover varies markedly across the seasonal cycle. Learning from this study, and studies in the Negev, Israel, we call for an improved understanding of moisture dynamics in dunes, related to geomorphology, sediment texture and vegetation cover prior to the application of chloride tracer hydrostratigraphy approaches.
The original contributions presented in the study are included in the article/Supplementary Material, further inquiries can be directed to the corresponding author.
AS designed the study, undertook laboratory work, did fieldwork with support from HW for rainwater sampling, and led the writing of the manuscript with contributions from all authors. YZ, LY and MvdP provided expertise in soil moisture modelling (with LY undertaking the simulation).
This research was supported by the Royal Geographical Society, Thesiger-Oman International Fellowship (2010), a small research grant from the British Society for Geomorphology (2012), the John Fell Fund at the University of Oxford (2010) and a Research and Impact Simulation Fund from the School of Environment, Education and Development, University of Manchester (2015).
AS would like to thank colleagues for assistance in the field, Prof. Christine Lane, Dr Jerome Mayuad, and Prof. David Thomas, and for assistance in the laboratory, Dr Mona Edwards, Jon Yarwood and Dr Thomas Bishop. Fieldwork was undertaken under research/collecting permits 1524/2010, 1734/2012, 1779/2013 and extended to 2016, issued by the Ministry of Environment and Tourism, Namibia, to whom the authors are grateful. We also thank the Namibian Ministry of Agriculture, Water and Land Reform, Division of Geohydrology for providing us with data from the GROWAS database and P. Möller and the de Waal’s for allowing us to do fieldwork on their farms. We thank two reviewers for their insightful and constructive feedback, which improved the manuscript.
The authors declare that the research was conducted in the absence of any commercial or financial relationships that could be construed as a potential conflict of interest.
All claims expressed in this article are solely those of the authors and do not necessarily represent those of their affiliated organizations, or those of the publisher, the editors and the reviewers. Any product that may be evaluated in this article, or claim that may be made by its manufacturer, is not guaranteed or endorsed by the publisher.
The Supplementary Material for this article can be found online at: https://www.frontiersin.org/articles/10.3389/feart.2022.1034671/full#supplementary-material
Allison, G. B., and Hughes, M. W. (1974). “Environmental tritium in the unsaturated zone: Estimation of recharge to an unconfined aquifer,” in Isotope techniques in groundwater hydrology (Vienna: IAEA), 57–72.
Alonso, E. E., Gens, A., and Josa, A. (1990). A constitutive model for partially saturated soils. Geotechnique 40 (3), 405–430. doi:10.1680/geot.1990.40.3.405
Babel, M. S., Loof, R., and Gupta, A. D. (1995). Fingered preferential flow in unsaturated homogenous coarse sands. Hydrol. Sci. J. 40 (1), 1–17. doi:10.1080/02626669509491387
Barrera-Animas, A. Y., Oyedele, L. O., Bilal, M., Akinsho, T. D., Delgado, M. D., and Akanbi, L. A. (2022). Rainfall prediction: A comparative analysis of modern machine learning algorithms for time-series forecasting. Mach. Learn. Appl. 7, 100204. doi:10.1016/j.mlwa.2021.100204
Beekman, H. E., Gieske, A., and Selaolo, E. T. (1996). Gres – groundwater recharge studies in Botswana (1987-1996). Botswanan J. Earth Sci. III, 1–17.
Black, C. A. (1965). Methods of soil analysis: Part I physical and mineralogical properties. Madison, Wisconsin, USA: American Society of Agronomy.
Blott, S. J., and Pye, K. (2001). Gradistat: A grain size distribution and statistics package for the analysis of unconsolidated sediments. Earth Surf. Process. Landforms 26, 1237–1248. doi:10.1002/esp.261
Bullard, J. E., Thomas, D. S. G., Livingstone, I., and Wiggs, G. F. S. (1995). Analysis of linear dune morphological variability, southwest Kalahari desert. Geomorphology 11, 189–203. doi:10.1016/0169-555X(94)00061-U
Chen, F-H., Chen, J-H., Holmes, J., Boomer, I., Austin, P., Gates, J. B., et al. (2010). Moisture changes over the last millennium in arid central asia: A review, synthesis and comparison with monsoon region. Quat. Sci. Rev. 29, 1055–1068. doi:10.1016/j.quascirev.2010.01.005
Cook, P. G., Edmunds, W. M., and Gaye, C. B. (1992). Estimating paleorecharge and paleoclimate from unsaturated zone profiles. Water Resour. Res. 28, 2721–2731. doi:10.1029/92WR01298
Dincer, T., Al-Mugrin, A., and Zimmerman, U. (1974). Study of the infiltration and recharge through the sand dunes in arid zones with special reference to the stable-isotopes and thermonuclear tritium. J. Hydrol. X. 23, 79–109. doi:10.1016/0022-1694(74)90025-0
Dougill, A. J., and Thomas, A. D. (2004). Kalahari sand soils: Spatial heterogeneity, biological soil crusts and land degradation. Land Degrad. Dev. 15, 233–242. doi:10.1002/ldr.611
Edmunds, W. M., and Tyler, S. W. (2002). Unsaturated zones as archives of past climates: Toward a new proxy for continental regions. Hydrogeol. J. 10, 216–228. doi:10.1007/s10040-001-0180-6
Felix-Henningsen, P., Rummel, B., and Blume, H. P. (2008). “Soil processes and salt dynamics in dune soils,” Arid dune ecosystems. Ecological studies. Editors S. W. Breckle, A. Yair, and M. Veste (Berlin, Heidelberg: Springer-Verlag), pp225-238.
Flato, G., Marotzke, J., Abiodun, B., BraconnotChou, P. S. C., Collins, W., Cox, P., et al. (2013). “Evaluation of climate models,” in Climate change 2013: The physical science basis. Contribution of working group I to the fifth assessment report of the intergovernmental panel on climate change. Editors T. F. Stocker, D. Qin, G. K. Plattner, M. Tignor, S. K. Allen, J. Boschunget al. (Cambridge, United Kingdom and New York, NY, USA: Cambridge University Press).
Folk, R. L., and Ward, W. C. (1957). Brazos river bar: A study in the significance of grain size parameters. J. Sediment. Res. 27 (3), 3–26. doi:10.1306/74D70646-2B21-11D7-8648000102C1865D
Gates, J. B., Edmunds, W. M., Ma, J., and Sheppard, P. R. (2008a). A 700-year history of groundwater recharge in the drylands of NW China. Holocene 18 (7), 1045–1054. doi:10.1177/0959683608095575
Gates, J. B., Edmunds, W. M., and Scanlon, B. R. (2008b). Estimating groundwater recharge in a cold desert environment in northern China using chloride. Hydrogeol. J. 16, 893–910. doi:10.1007/s10040-007-0264-z
Haddon, I. G., and McCarthy, T. S. (2005). The mesozoic–cenozoic interior sag basins of central Africa: The late-cretaceous–cenozoic Kalahari and okavango basins. J. Afr. Earth Sci. 43, 316–333. doi:10.1016/j.jafrearsci.2005.07.008
IPCC (2021). “Climate change 2021: The physical science basis,” in Contribution of working group I to the sixth assessment Report of the intergovernmental Panel on climate change. Editors P. Zhai, A. Pirani, S. L. Connors, C. Péan, S. Berger, N. Caudet al. (Cambridge and New York: Cambridge University Press).
JICA study team (2002). “The study on the groundwater potential evaluation and management plan in the southeast Kalahari (Stampriet) artesian basin in the republic of Namibia,” in Department of water affairs, Ministry of agriculture, water and rural development, republic of Namibia, submitted by pacific consultants international (Tokyo: Sanyu Consultants Inc).
Kidron, G. J., and Yair, A. (1997). Rainfall–runoff relationship over encrusted dune surfaces, Nizzana, Western Negev, Israel. Earth Surf. Process. Landforms 22, 1169–1184. doi:10.1002/(sici)1096-9837(199712)22:12<1169::aid-esp812>3.0.co;2-c
Lancaster, N., Wolfe, S., Thomas, D., Bristow, O., Burrough, S., Duller, G., et al. (2016). The INQUA Dunes Atlas chronologic database. Quat. Int. 410 (B), 3–10. doi:10.1016/j.quaint.2015.10.044
Ma, J., Edmunds, W. M., He, J., and Jia, B. (2009). A 2000 year geochemical record of palaeoclimate and hydrology derived from dune sand moisture. Palaeogeogr. Palaeoclimatol. Palaeoecol. 276, 38–46. doi:10.1016/j.palaeo.2009.02.028
McWhorter, D. B. (1990). Unsteady radial flow of gas in the vadose zone. J. Contam. Hydrol. 5, 297–314. doi:10.1016/0169-7722(90)90041-E
Mees, F. (1999). Distribution patterns of gypsum and kalistrontite in a dry lake basin of the southwestern Kalahari (Omongwa pan, Namibia). Earth Surf. Process. Landforms 24, 731–744. doi:10.1002/(sici)1096-9837(199908)24:8<731::aid-esp7>3.0.co;2-0
Milewski, R., Chabrillat, D., and Behling, R. (2017). Analyses of recent sediment surface dynamic of a Namibian Kalahari salt Pan based on multitemporal landsat and hyperspectral hyperion data. Remote Sens. (Basel). 9 (2), 170. doi:10.3390/rs9020170
Milly, P. C. D. (1982). Moisture and heat transport in hysteretic, inhomogeneous porous media: A matric head-based formulation and a numerical model. Water Resour. Res. 18 (3), 489–498. doi:10.1029/WR018i003p00489
Muhs, D. R., Roskin, J., Tsoar, H., Skipp, G., Budahn, J. R., Sneh, A., et al. (2013). Origin of the sinai-negev erg, Egypt and Israel: Mineralogical and geochemical evidence for the importance of the nile and sea level history. Quat. Sci. Rev. 69, 28–48. doi:10.1016/j.quascirev.2013.02.022
Nash, D. J., and Enfield, G. H. (2008). ‘Splendid rains have fallen’: Links between el niňo and rainfall variability in the Kalahari, 1840-1900. Clim. Change 86, 257–290. doi:10.1007/s10584-007-9274-z
Niang, I., Ruppel, O. C., Abdrabo, M. A., Essel, A., Lennard, C., Padgham, J., et al. (2014). “Africa,” in Climate change (2014) impacts, adaption, and vulnerability. Part B: Regional aspects. Contributions of working group II to the fifth assessment report of the intergovernmental panel on climate change. Editors V. R. Barros, C. B. Field, D. J. Dokken, M. D. Mastrandrea, K. J. Mach, T. E. Biliret al. (Cambridge and New York: Cambridge University Press), 1199–1265.
Nicholson, S. E. (2001a). A semi-quantitative, regional precipitation data set for studying african climates of the nineteenth century: Part 1. Overview of the dataset. Clim. Change 50, 317–353. doi:10.1023/A:1010674724320
Nicholson, S. E. (2001b). Climatic and environmental change in Africa during the last two centuries. Clim. Res. 17, 123–144. doi:10.3354/cr017123
Nicholson, S. E., and Kim, J. (1997). The relationship of the el niňo-southern oscillation to african rainfall. Int. J. Climatol. 17, 117–135. doi:10.1002/(sici)1097-0088(199702)17:2<117::aid-joc84>3.0.co;2-o
Niessner, J., and Hassanizadeh, S. M. (2008). A model for two-phase flow in porous media including fluid-fluid interfacial area. Water Resour. Res. 44 (8), W08439. doi:10.1029/2007wr006721
Niessner, J., and Hassanizadeh, S. M. (2009). Modeling kinetic interphase mass transfer for two-phase flow in porous media including fluid–fluid interfacial area. Transp. Porous Media 80 (2), 329–344. doi:10.1007/s11242-009-9358-5
Parlange, J. Y., Braddock, R. D., Simpson, R. W., and Hill, D. E. (1982). Optimization principle for air and water movement. Soil Sci. 133 (1), 4–9. doi:10.1097/00010694-198201000-00002
Phillip, J. R., and de Vries, D. (1957). Moisture movement in porous materials under temperature gradient. Trans. Am. Geophys. Union 38 (2), 222–232.
Razanezhad, F., Vogel, H.-J., and Roth, K. (2006). Experimental study of fingered flow through initially dry sand. Hydrol. Earth Syst. Sci. Discuss. 3, 2595–2620. doi:10.5194/hessd-3-2595-2006
Saito, H., Simunek, J., and Mohanty, B. P. (2006). Numerical analysis of coupled water, vapor, and heat transport in the vadose zone. Vadose zone J. 5 (2), 784–800. doi:10.2136/vzj2006.0007
Sakai, M., Toride, N., and Simunek, J. (2009). Water and vapor movement with condensation and evaporation in a sandy column. Soil Sci. Soc. Am. J. 5 (2), 707–717. doi:10.2136/sssaj2008.0094
Scanlon, B. R., Keese, K. E., Flint, A. L., Gaye, C. B., Edmunds, W. M., Simmers, L., et al. (2006). Global synthesis of groundwater recharge in semi-arid and arid regions. Hydrol. Process. 20, 3335–3370. doi:10.1002/hyp.6335
Schalk, K. (1961). “The water balance of the Uhlenhorst cloudburst in south west Africa,” in Proc. Inter-african conference on hydrology (Nairobi: CCTA Publ.), 443–449.
Selaolo, E. T. (1998). Tracer studies and groundwater recharge assessment in the eastern fringe of the Botswanan Kalahari. Vrige Universiteit. PhD Thesis.
Siegal, Z., Tsoar, H., and Karnieli, A. (2013). Effects of prolonged drought on the vegetation cover of sand dunes in the NW Negev Desert: Field survey, remote sensing and conceptual modeling. Aeolian Res. 9, 161–173. doi:10.1016/j.aeolia.2013.02.002
Stephens, D. B. (1994). A perspective on diffuse natural recharge mechanisms in areas of low precipitation. Soil Sci. Soc. Am. J. 58, 40–48. doi:10.2136/sssaj1994.03615995005800010006x
Stone, A. (2021). Dryland dunes and other dryland environmental archives as proxies for Late Quaternary stratigraphy and environmental and climate change in southern Africa. South Afr. J. Geol. 124 (4), 927–962. doi:10.25131/sajg.124.0055
Stone, A., and Edmunds, W. M. (2014). Naturally-high nitrate in unsaturated zone sand dunes above the Stampriet Basin, Namibia. J. Arid. Environ. 105, 41–51. doi:10.1016/j.jaridenv.2014.02.015
Stone, A., and Edmunds, W. M. (2012). Sand, salt and water in the Stampriet Basin, Namibia: Calculating unsaturated zone (Kalahari dunefield) recharge using the chloride mass balance approach. Water sa. 38 (3), 367–378. doi:10.4314/wsa.v38i3.2
Stone, A., and Edmunds, W. M. (2016). Unsaturated zone hydrostratigraphies: A novel archive of past climates in dryland continental regions. Earth. Sci. Rev. 157, 121–144. doi:10.1016/j.earscirev.2016.03.007
Stone, A. (2022). “Landscape evolution of the Stampriet transboundary basin and relation to the groundwater system: The land of duricrusts, pans, dry valleys and dunes, and the relation to the groundwater system,” in Landscapes and landforms of Botswana. Editor F. D. Eckardt (Switzerland: Springer), pp201–221. doi:10.1007/978-3-030-86102-5_12
Stone, A. (2016). Squeezing a rainfall record out of desert sand dunes. PAGES. Mag. 24 (1), 24–25. doi:10.22498/pages.24.1.24
Stone, A., and Thomas, D. S. G. (2008). Linear dune accumulation chronologies from the southwest Kalahari, Namibia: Challenges of reconstructing late quaternary palaeoenvironments from aeolian landforms. Quat. Sci. Rev. 27, 1667–1681. doi:10.1016/j.quascirev.2008.06.008
Taylor, C. M., de Jue, R. A. M., Guichard, F., Harris, P. P., and Dorigo, W. A. (2012). Afternoon rain more likely over drier soils. Nature 489, 423–426. doi:10.1038/nature11377
Telfer, M. A., and Hesse, P. P. (2013). Palaeoenvironmental reconstructions from linear dunefields: Recent progress, current challenges and future directions. Quat. Sci. Rev. 78, 1–21. doi:10.1016/j.quascirev.2013.07.007
Telfer, M. W., Thomas, D. S. G., Parker, A. G., Walkington, H., and Finch, A. A. (2009). Optically Stimulated Luminescence (OSL) dating and palaeoenvironmental studies of pan (playa) sediment from Witpan, South Africa. Palaeogeogr. Palaeoclimatol. Palaeoecol. 273, 50–60. doi:10.1016/j.palaeo.2008.11.012
Tyler, S. W., Chappman, J. B., Conrad, S. H., Hammermeister, D. P., Blout, D. O., Miller, J. J., et al. (1996). Soil-water flux in the southern great basin, United States: Temporal and spatial variations over the last 120, 000 years. Water Resour. Res. 32, 1481–1499. doi:10.1029/96WR00564
Uugulu, S. (2022). Estimation of groundwater recharge along a precipitation gradient for savannah aquifers in Namibia. University of Namibia. PhD thesis.
Van Tonder, G. J., and Bean, J. (2003). “Challenged in estimating groundwater recharge,” in Groundwater recharge estimation in southern Africa. Editors Y. Xu, and H. E. Beekman (Cape Town: UNESCO Paris).
Wanke, H. (2005). Abschätzung der Grundwasserneubildung in Namibia mittels der Chlorid-Bilanz-Methode: Ist die trockene Deposition vernachlässigbar? Hydrogeol. Umw. 33 (10), 1–14.
Wessel, A. T. (1988). On using the effective contact angle and the water drop penetration time for classification of water repellency in dune soils. Earth Surf. Process. Landf. 13 (6), 555–561. doi:10.1002/esp.3290130609
Yair, A. (2008). “Effects of surface runoff and subsurface flow on the spatial variability of water resources in longitudinal dunes,” in Arid dune ecosystems. Ecological studies. Editors S.-W. Breckle, A. Yair, and M. Veste (Berlin, Heidelberg: Springer-Verlag), 251–269.
Yair, A., Lavee, H., and Greitser, N. (1997). Spatial and temporal variability of water percolation and movement in a system of longitudinal dunes, Western Negev, Israel. Hydrol. Process. 11 (1), 43–58. doi:10.1002/(sici)1099-1085(199701)11:1<43::aid-hyp402>3.0.co;2-d
Yeh, T. C., and Harvey, D. J. (1990). Effective unsaturated hydraulic conductivity of layered sands. Water Resour. Res. 26, 1271–1279. doi:10.1029/wr026i006p01271
Yu, L., Zeng, Y., and Su, Z. (2020). Understanding the mass, momentum, and energy transfer in the frozen soil with three levels of model complexities. Hydrol. Earth Syst. Sci. 24 (10), 4813–4830. doi:10.5194/hess-24-4813-2020
Yu, L., Zeng, Y., Wen, J., and Su, Z. (2018). Liquid-vapor-air flow in the frozen soil. J. Geophys. Res. Atmos. 123 (14), 7393–7415. doi:10.1029/2018JD028502
Zaslavsky, D., and Sinai, G. (1981). Surface hydrology: III°Causes of lateral flow. J. Hydr. Div. 107, 37–52. doi:10.1061/jyceaj.0005605
Zeng, Y., Su, Z., Wan, L., and Wen, J. (2011a). A simulation analysis of the advective effect on evaporation using a two-phase heat and mass flow model. Water Resour. Res. 47 (10), W10529. doi:10.1029/2011WR010701
Zeng, Y., and Su, Z. (2013). Stemmus: Simultaneous transfer of engery, mass and Momentum in unsaturated soil. Enschede: University of Twente, Faculty of Geo-Information and Earth Observation ITC.
Zeng, Y., Su, Z., Wan, L., and Wen, J. (2011b). Numerical analysis of air-water-heat flow in the unsaturated soil is it necessary to consider air flow in land surface models. J. Geophys. Res. 116 (D20), D20107. doi:10.1029/2011JD015835
Zeng, Y., Su, Z., Wan, L., Yang, Z., Zhang, T., Tian, H., et al. (2009a). Diurnal pattern of the drying front in desert and its application for determining the effective infiltration. Hydrol. Earth Syst. Sci. 13, 703–714. doi:10.5194/hess-13-703-2009
Keywords: dryland dunes, rainfall reconstruction, unsaturated zone aquifer, chemical tracers, hydrogeology, Quaternary science, Kalahari, Namibia
Citation: Stone A, Zeng Y, Yu L, van der Ploeg M and Wanke H (2022) Reconstructing rainfall using dryland dunes: Assessing the suitability of the southern Kalahari for unsaturated zone hydrostratigraphies. Front. Earth Sci. 10:1034671. doi: 10.3389/feart.2022.1034671
Received: 01 September 2022; Accepted: 12 October 2022;
Published: 26 October 2022.
Edited by:
Kathryn Elizabeth Fitzsimmons, University of Tübingen, GermanyCopyright © 2022 Stone, Zeng, Yu, van der Ploeg and Wanke. This is an open-access article distributed under the terms of the Creative Commons Attribution License (CC BY). The use, distribution or reproduction in other forums is permitted, provided the original author(s) and the copyright owner(s) are credited and that the original publication in this journal is cited, in accordance with accepted academic practice. No use, distribution or reproduction is permitted which does not comply with these terms.
*Correspondence: Abi Stone, YWJpLnN0b25lQG1hbmNoZXN0ZXIuYWMudWs=
Disclaimer: All claims expressed in this article are solely those of the authors and do not necessarily represent those of their affiliated organizations, or those of the publisher, the editors and the reviewers. Any product that may be evaluated in this article or claim that may be made by its manufacturer is not guaranteed or endorsed by the publisher.
Research integrity at Frontiers
Learn more about the work of our research integrity team to safeguard the quality of each article we publish.