- 1Center for Rock Instability and Seismicity Research, Northeastern University, Shenyang, China
- 2Heilongjiang Ground Pressure and Gas Control in Deep Mining Key Lab, Heilongjiang University of Science and Technology, Harbin, China
The temporal domain of dissipated energy during rock damage and failure is commonly quantified using loading and unloading tests or elastic mechanics-based theoretical calculation methods. However, these approaches cannot be applied to obtain the spatial distribution of rock dissipated energy. This paper presents a novel model to estimate rock dissipated energy based on acoustic emission measurements. The proposed model is used to estimate the temporal and spatial distribution of dissipated energy in a sandstone specimen under uniaxial compression conditions. The results indicate that the model well describes the energy dissipation evolution trend in the temporal domain with an error of 38.63% compared with results calculated using the traditional method. The dissipated energy concentration area estimated by the model is located near the macroscopic fractures, which indicates that the model can describe the evolution process of rock energy dissipation in the spatial domain.
1 Introduction
The work performed by the external loads on the rock not only causes a change in reversible elastic strain energy of the rock but also is irreversibly dissipated, resulting in damage accumulation and ultimately failure of the rock (Xie et al., 2011; Cui et al., 2021; Zhou et al., 2021). From the viewpoint of thermodynamics, the damage evolution of rock is an irreversible process of energy dissipation, and the failure of rocks is attributed to energy-driven state instability (Brady and Brown, 2006; Wang et al., 2020; Li et al., 2022; Wu et al., 2022). Therefore, quantization of dissipated energy is very important to study the damage and failure process of rock.
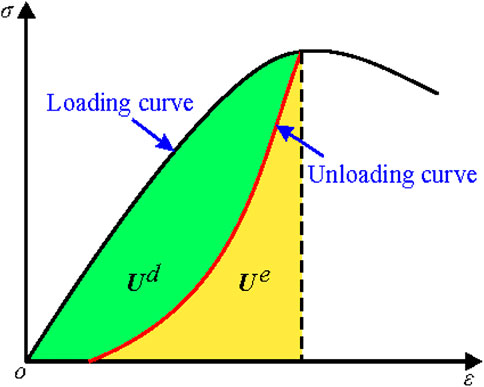
Loading and unloading tests, elastic mechanics-based theoretical calculations, and indirect measurements have been used to quantify rock dissipated energy. Loading and unloading tests are the most common of these methods, in which the dissipated energy is represented by the area enclosed by the loading curve, unloading curve, and strain axis owing to the release of elastic strain energy after complete unloading (Kidybiński, 1981; Liu et al., 2016; He and Kusiak, 2017; Li et al., 2021a; Li et al., 2021b). Using this quantification method (Meng et al., 2016), investigated the characteristics of rock energy dissipation under uniaxial compression condition and found the energy densities increase nonlinearly with increasing axial loading stress and then rapidly increases after rock failure, the dissipated energy is generally less than the elastic energy at the peak phase, and exceeds the elastic energy at some point after the peak. Similar energy dissipation characteristics were also observed in rock under triaxial compression condition (Zhang et al., 2017; Zhang et al., 2019). However, in actual rock uniaxial compression tests, due to the uncertainty of peak strength of rock, it is hard to unload at or near the peak strength of the rock specimen. As a result, the evolution process of dissipated energy at or near the peak strength cannot be obtained by loading and unloading tests. In order to quantify the change of dissipated energy completely (Gong et al., 2019), proposed a new method based on the linear relationship between the dissipated and input energy density. With this method, the dissipated energy density at any stress levels (including peak strength) can be obtained by calculating input energy density.
Theoretical calculation methods can be used to quantify dissipated energy without unloading. The elastic strain energy is first determined under a certain stress state using an elastic mechanics formula based on the elastic modulus and Poisson’s ratio (Xie et al., 2011). The work performed by the external load over the area enclosed by the loading curve and strain axis is then calculated, and the dissipated energy can be expressed as the difference between the work done by the external loads and the elastic strain energy. In this method, Young’s modulus of the loading curve (Munoz et al., 2016) and unloading secant modulus (Huang and Li, 2014) are usually used as elastic modulus. Due to natural rock materials linear elastomer, these moduli are not equal. For example (Huang and Li, 2014), found unloading secant modulus are about 5%–8% greater than the Young’s modulus. Although choosing different moduli will result in different quantization results of dissipative energy, this difference will not affect the variation trend of dissipated energy. The dissipated energy evolution characteristics similar to the loading and unloading tests can be obtained by this method (Jiang and Xu, 2018; Qin et al., 2019; Zhang et al., 2020a).
Electromagnetic radiation (Frid, 1999; Wang et al., 2014), electric currents (Stavrakas et al., 2004), infrared radiation (Shen et al., 2020; Huang et al., 2022), and acoustic emission (AE, Wang et al., 2019) radiation monitoring have also been used to indirectly measure rock dissipated energy. As part of the total dissipated energy, the variation trend of dissipated energy can be estimated using these indirect measurement methods (Song et al., 2012) carried out a series of cyclic loading experiments using coal samples and found the cumulative values of electromagnetic radiation energy and corresponding total dissipated energy well subject to a logarithmic function (Li et al., 2021) conducted progressive loading and step-like loading experiments on sandstone samples and found the peak current increases exponentially with stress rate with a negative exponent, the accumulated charge increases linearly with the relative stress, but the charge increasing rate are different in different deformation stages. However, due to the limitation of monitoring equipment, the actual electric and magnetic fields caused by loading rock can bot be obtained, but just the voltage amplitude or currents of the induced voltage or analog signals. 2D temperature field can be obtained by infrared radiation (Wu et al., 2002) experimentally explored that the average temperature of the rock surface is proportional to rock stress and is cubic curvilinear to the mechanical work input before failure and the temperature anomaly occurs with rock fracturing after its elastic deformation stage.
The rock failure process proceeds from localized energy dissipation to local failure and eventually to global catastrophic failure, and the dissipated energy is characterized by an uneven distribution in 3D space. AE monitoring is therefore highly suitable for studying the spatio-temporal distribution characteristics of dissipated energy because it can be used to locate the localized damage and fractures in the temporal and 3D spatial domains (Cui et al., 2021). Based on AE monitoring data (Chang and Lee, 2004), and (Zhang et al., 2020b) calculated the AE source radiation energy and found the AE sources with high radiation energy were generally located near the potential macroscopic fracture surfaces. However, an approach to quantify dissipated energy based on AE measurements remains unresolved.
To address this issue, this study proposes a model for estimating rock dissipated energy based on AE measurements. We assume that the rock is elastic-brittle on the mesoscopic scale, and that the microfracture is discoidal and occurs instantaneously. We use the model to analyze the spatio-temporal evolution of dissipated energy during the failure process of a sandstone specimen under uniaxial loading conditions, as discussed in detail below.
2 Dissipated energy estimation model
2.1 Energy conservation law during rock failure
We assume here that the rock is elastic-brittle on the mesoscopic scale and that macroscopic plastic deformation is caused by the progressive failure of meso-scale elements (Tang, 1997). This implies that the essence of rock fracture is the process from microfracture initiation and propagation to macroscopic fracture formation. We also assume that the microfractures occur instantaneously (i.e., at an infinite rupture velocity) inside a disk of radius a.
Ignoring the temperature effect, the energy conservation law for rock deformation and failure under loading can be expressed as (Figure 1):
where
The total work done by external forces on the rock can be calculated by the load curve according to:
where
According to elastic mechanics, the elastic strain energy stored in a rock can be deduced as:
where
The dissipated energy can be expressed by substituting Eqs 2, 3 into Eq. 1:
2.2 Dissipated energy estimation based on AE measurement
According to a simplified green’s function for the moment tensor inversion method (Grosse and Ohtsu, 2021), the far field first motion induced by a microfracture can be determined as follows:
where u is the far field first motion displacement of the p wave at the AE sensor, Cs is the magnitude of the AE sensor response including the material constants,
Then, the moment tensor can be decomposed as follows:
where
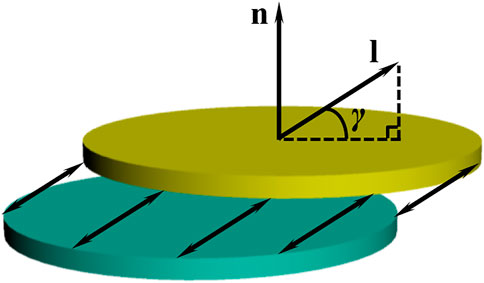
The unit motion vector and unit normal vector of the microfracture plane can be deduced as follows (Vavryčuk, 2015):
where
The tensile angle
Figure 2Coseismic volume variations induced by an AE source can be expressed as (Grosse and Ohtsu, 2021):
where
Furthermore, the average displacement of a microfracture in the direction of unit motion vector l can be calculated as:
The dissipated energy induced by the microfracture can then be expressed as:
where
2.3 Modification of the dissipated energy estimation model
The ratio between the cumulative microfracture volume variation calculated by the AE data and the microfracture volume variation calculated by the strain data can be expressed as:
where
where
If the moment tensors of all microfractures are accurately calculated, the RV value should be equal to 1. However, the ratio of microfractures capable of moment tensor inversion is less than 1% (Lockner, 1993), which results into an RV value that is considerably less than 1. The RV value can thus be used to modify the dissipated energy estimation model.
The modified cumulative dissipated energy of all the microfractures can be expressed as:
The essence of this modification method is to add the dissipated energy that cannot be estimated from the AE measurement to the microfractures whose dissipated energy can be estimated from the AE measurement. The modified dissipated energy of a particular microfracture is therefore substantially higher than its actual dissipated energy, whereas the modified cumulative dissipated energy is closer to the actual cumulative rock dissipated energy.
3 AE test
3.1 Test set-up
The sandstone specimen (ϕ50 mm ×100 mm) was used in our AE test. Our test set-up consists of a loading device, a strain measuring device and a monitoring apparatus.
The loading device is a computer control electro-hydraulic servo press (TOP INDUSTRIE Rock 600-50). The uniaxial loading test of sandstone was carried out. The loading rate was 0.2 mm/min. The physical and mechanical parameters of the sandstone are listed in Table 1.
The strain measuring device consists of two linear variable differential transformers (LVDT) and a circum-directional electronic strain gauge. The LVDT were used to monitor axial strain of the rock specimen, and the circum-directional electronic strain gauge was used to monitor circum-directional strain of the rock specimen.
We used an SH-II AE monitoring apparatus to collect the AE signals. Each waveform was digitized into 2,048 samples at a sampling rate of 2 MHz. 40 dB (amplified 100 times) preamplifier gain was used to improve the signal to noise ratio (SNR). The threshold is set to 30 dB (approximately 0.0032 V) which is slightly above the noise level.
We placed twelve Nano30 AE sensors on the specimen surfaces (black cylinders in Figure 3). We used Akaike’s information criterion (AIC) approach to compute P-wave arrival times and P-wave first motion amplitudes at each AE sensor. The AE source locations were determined based on the differences between P-wave arrival times via a combined least square method and Geiger procedure (Kang et al., 2017). The rock was assumed to be isotropic. The location errors were found to be within 3.5 mm based on pencil break test results (Figure 3).
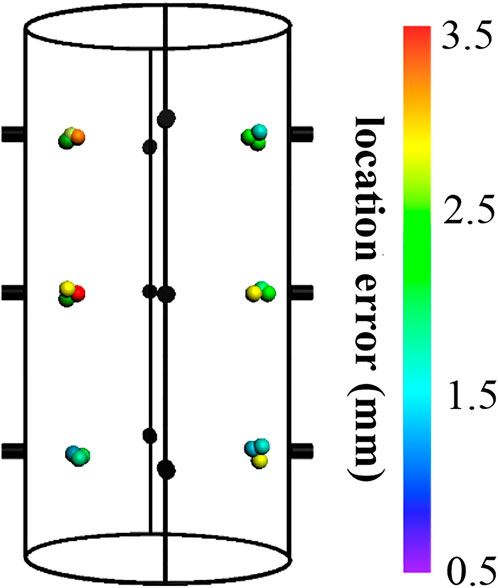
FIGURE 3. AE sensor array and location error from pencil break tests. Black cylinders represent AE sensors; spheres represent AE sources; different colors of spheres indicate different location errors.
3.2 Failure mode and mechanical parameters
Four macroscopic fractures formed (1–4 in Figure 4) upon failure of the sandstone specimen. Fracture 1 cut through the specimen from the top left to the right bottom. Fractures 2–4 intersected with fracture 1 in the middle, lower, and upper parts of the specimen, respectively, but did not cut through the specimen. Fractures 1 and 2 formed a typical X-shaped conjugate shear fracture.
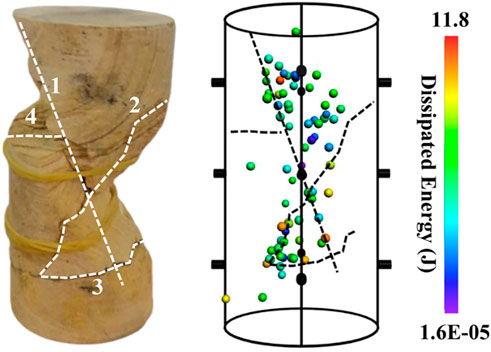
FIGURE 4. Failure mode and spatial distribution of the AE sources. Macroscopic fractures 1–4 are marked with dashed lines and the different colored spheres indicate the range of dissipated energy.
A comparison of the failure mode with the spatial distribution and dissipated energy of the AE sources shows that the AE sources with high dissipated energy were located near the macroscopic fractures.
3.3 Deformation characteristics
The fracture process of sandstone under uniaxial compression can be divided into the following five stages according to the deformation characteristics, as shown in Figure 5 (Martin and Chandler, 1994).
(1) Crack closure (0–0.31σf). Preexisting microfractures in the rock gradually close with increasing axial stress and induce some AE activity, and the rock and microfractures volumetric strain decrease.
(2) Elastic region (0.31σf–0.65σf). The stress-strain curve is approximately linear, the change in the volumetric strain of microfractures is very small and AE activity was very low.
(3) Stable crack growth (0.65σf–0.81σf). New microfractures begin to appear and expand, the volumetric strain of microfractures and the accumulative AE hit begins to increase, and the reduction rate of the rock volume strain gradually decreases until the dilatancy point.
(4) Unstable cracking (0.81σf–σf). After the dilatancy point, the axial strain, lateral strain, and volumetric strain of the rock and microfractures significantly increase, and the accumulative AE hit obviously increase.
(5) Post-peak (σf–0). Microfractures are interconnected and lead to the formation of macroscopic cracks and a stress drop. At this stage, the growth rate of the lateral strain notably exceeds that of the axial strain, the volumetric strain of the rock and microfractures rapidly increase, and the rock changes from a contraction state to a dilation state. Although the strain varies widely in this stage, its duration is very short (less than 7 s).
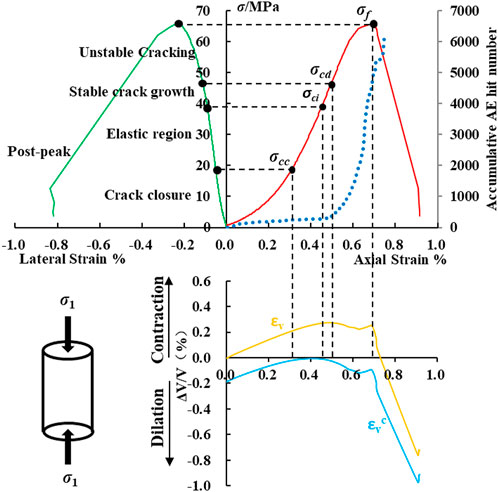
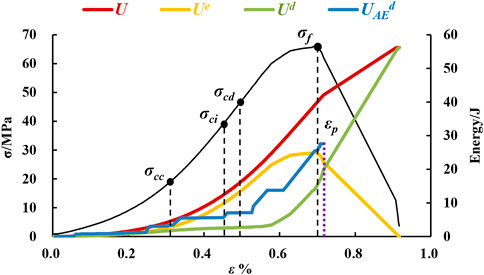
FIGURE 5. Stress-strain curves of the sandstone specimen, where σf is the peak strength, σcc is the crack closure stress level (0.31σf), σci is the crack initiation stress level (0.65σf), and σcd is the dilatancy stress level (0.81σf).
4 Dissipated energy estimation model application
4.1 Energy conversion process
The energy conversion process under uniaxial loading conditions is shown in Figure 6. Here we assume that the work done by external forces U, elastic strain energy Ue, and dissipated energy Ud obtained by the theoretical calculation method (Eqs 2–4) are accurate.
The work done by external forces U (red line in Figure 6) increases with increasing axial strain until the rock loses its bearing capacity. The elastic strain energy Ue (orange line in Figure 6) increases with increasing axial strain until reaching the peak stress and then rapidly decreases to 0 in the post-peak stage. The elastic strain energy at peak stress is greater than the dissipated energy Ud (green line in Figure 6), which shows that work done by the external forces is mostly converted into elastic strain energy in the pre-peak stage.
The dissipated energy Ud (green line in Figure 6) rapidly increases near the peak stress and exceeds the elastic strain energy shortly after reaching the peak stress. When the rock loses its bearing capacity, the total work done by the external forces are completely converted to dissipated energy.
The dissipated energy estimated by the model UAEd (blue line in Figure 6) increases in multiple steps, whereas the actual dissipated energy Ud change is very smooth. The main reason for this difference is that the number of AE sources that satisfy the dissipated energy estimation condition is limited, which leads to a discrete increase of the dissipated energy in the time domain. When the dissipated energy of a certain AE source is high, there will be a sudden increase in the cumulative dissipated energy curve.
AE waveforms are often superimposed on each other and difficult to identify in the time domain owing to the short post-peak stage duration and frequent AE activity in this stage. This results in the absence of an AE source that satisfies the estimation condition of dissipated energy after εp. The microfracture volume variation at point εp (i.e., strain point of the last AE source satisfied by the estimation condition of the dissipated energy) is therefore used to modify the dissipated energy UAEd estimated by the model.
The dissipated energy and its proportion during different deformation stages prior to reaching point εp is shown in Table 2. The order of dissipated energy estimated by the model from high to low is consistent with that calculated using the theoretical method: unstable cracking > crack closure > elastic region > stable crack growth. This demonstrates that the dissipated energy estimation model well describes the variation trend of energy dissipation in the temporal domain.

TABLE 2. Dissipated energy and its proportion in different deformation stages before reaching point εp.
The dissipated energy during the stable crack growth stage is generally higher than that in the elastic region stage, whereas the opposite is observed in the studied sandstone specimen. This can be attributed to the following two points. 1) The dilatancy stress level of the sandstone specimen is very close to the crack initiation stress level (Figure 5), and the short duration leads to a small amount of dissipated energy during the stable crack growth stage. 2) The volumetric strain of the microfractures initially decreases and then increases in the elastic region (blue line in Figure 5), which indicates that the closure and initiation of microfractures continues to occur and energy continues to be dissipated during this stage.
Up to point εp, the dissipated energy estimated by the model is approximately 38.63% higher than the actual dissipated energy, which reflects the model error. The causes of this relatively high error are discussed in Section 5.
4.2 Spatial evolution of dissipated energy
The spatial evolution of the dissipated energy estimated by the model under uniaxial loading conditions is shown in Figure 7. Under low stress, several relative concentration areas of dissipated energy occur in the upper and lower parts of the sandstone specimen (Figure 7A). The AE signal and energy dissipation are caused by the friction between pre-existing microfracture surfaces during the crack closure stage. If the pre-existing microfractures are randomly distributed, the dissipated energy estimated by the model will be evenly distributed in space; otherwise, there will be an uneven distribution of dissipated energy. The relative concentration areas are therefore likely caused by relatively large pre-existing defects in the rock. Furthermore, the friction between most of the pre-existing microfractures does not satisfy the dissipated energy estimation condition, and their dissipated energy is therefore added to the friction between the pre-existing microfractures that satisfies the estimation condition through model modification, which further increases the spatial dissipated energy concentration. Nevertheless, the maximum energy density during the crack closure stage is 13.76 aJ/m2, which is only 1.1% of the maximum energy density at the time of rock failure.
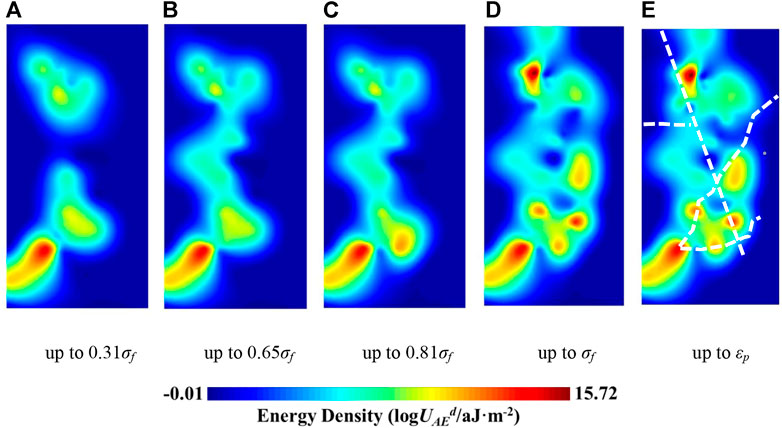
FIGURE 7. Spatial evolution of the total dissipated energy under uniaxial loading conditions. Macroscopic fractures are marked with white dashed lines.(A) up to 0.31σf | (B) up to 0.65σf. (C) up to 0.81σf. (D) up to σf. (E) up to εp.
With increasing stress level, energy dissipation occurred in the middle of the specimen and connected the upper and lower concentration areas (Figure 7B). Although interconnected energy dissipation zones formed, the energy density of the entire region was still too low to form macroscopic fractures. From 0.65σf to 0.81σf, the energy basically ceased to dissipate in the upper and middle parts, whereas the lower concentration area began to expand downward (Figure 7C). From 0.81σf to σf, several new dissipated energy concentration areas appeared in the upper, middle, and lower parts of the rock (Figure 7D).
When the rock entered the post-peak stage, the dissipated energy concentration areas in the upper part tended to expand downward (Figure 7E). No AE source satisfied the estimation condition of the dissipated energy after εp, thus the energy dissipation process of the macroscopic crack formation was not completely recorded.
Energy dissipation is closely related to the fracture evolution process. The dissipated energy concentration areas estimated by the model are located near the macroscopic fractures, indicating that the model can describe the evolution process of energy dissipation in the spatial domain. The analysis of the spatial and temporal variations of the dissipated energy distribution can therefore be used to better understand the fracture evolution process.
The spatial evolution of the dissipated energy indicates that the microfractures began from the initial defects in the upper and lower parts of the rock, gradually developed to the middle part of the rock, and ultimately connected to form macroscopic fractures.
5 Discussion
As mentioned, the error of the dissipated energy estimated by the model is approximately 38.63%. We consider the error to be attributed to the following four aspects.
(1) Rock heterogeneity is not considered in the dissipated energy estimation model. The size of the microfractures that form prior to reaching the peak stress is generally related to the mineral particle size. Different mineral particles in sandstone will have different mechanical properties, and the heterogeneity of mechanical properties will lead to a heterogeneous stress distribution. However, for simplicity, the dissipated energy estimation model assumes uniform macroscopic mechanical parameters (Lame constant λ and μ, friction coefficient μf) and stress field parameters (stress component along the motion direction of the microfracture σui).
(2) Some assumptions and simplifications are made to facilitate the calculation. For example, the microfracture morphology is simplified to a disk with a uniform opening. Only geometric attenuation is considered in the propagation of AE waves. The frequency response curve of the AE sensor is simplified to a horizontal line, in which is the sensor sensitivity at different frequencies is not considered.
(3) The dissipated energy estimation model has not been completely modified. The modification method described in Section 2.3 modifies the (M1+M2+M3)/sinγ portion of the model based on the microfracture volume variation. However, the modified portion must be combined with the stress component along the motion direction of the microfracture σui and sine of the tension angle sinγ to obtain the dissipated energy. The calculation errors of these two parameters (due to the first two reasons) are introduced into the final estimation results.
(4) Only the geometric attenuation during the AE wave propagation is considered. In the process of AE wave propagation, the actual AE wave amplitude released by the AE source is larger than that collected by the AE system, considering the attenuation effect of the plastic properties of the rock, the interface between particles, the new cracks, and the contact surface between the sensor and the specimen. Ignoring these factors will inevitably lead to certain errors.
6 Conclusion
The spatial distribution of dissipated energy cannot be obtained using traditional calculation methods, such as loading and unloading tests and elastic mechanics-based theoretical calculations. A new model is established in this study to estimate the temporal and spatial distribution of dissipated energy based on the assumption that rock is elastic-brittle on the mesoscopic scale and that microfractures occur instantaneously inside a disk.
We conducted AE tests on a sandstone specimen under uniaxial compression and applied the proposed model to analyze the temporal and spatial distribution of the dissipated energy. The results indicate that the model can describe the dissipated energy evolution trend in the temporal domain with an error of 38.63% compared with the results calculated using the traditional method.
During the sandstone failure process, the spatial concentration areas of dissipated energy form, increase, and tend to connect. Compared with the rock failure mode, we find that the dissipated energy concentration area estimated by the model is located near the macroscopic fractures, which indicates that the model can also describe the evolution process of energy dissipation in the spatial domain (McGarr, 1976; Boatwright and Fletcher, 1984).
Data availability statement
The original contributions presented in the study are included in the article/supplementary material, further inquiries can be directed to the corresponding author.
Author contributions
PZ contributed the experimental design and the writing of the draft, KG contributed the data analysis and writing of the draft, WD and XL contributed to the revision of the draft, TQ and QM contributed the discussion and implementation of the experimental scheme.
Funding
The work presented in this paper is financially supported by National Key R&D Program of China (Grant Nos. 2022YFC2903903), the National Natural Science Foundation of China (Grant Nos. 52004053 and U21A20106), Natural Science Foundation of Liaoning Province (Grant No. 2021-BS-052), and the Fundamental Research Funds for the Central Universities of China (N2201015 and N2101028).
Conflict of interest
The authors declare that the research was conducted in the absence of any commercial or financial relationships that could be construed as a potential conflict of interest.
Publisher’s note
All claims expressed in this article are solely those of the authors and do not necessarily represent those of their affiliated organizations, or those of the publisher, the editors and the reviewers. Any product that may be evaluated in this article, or claim that may be made by its manufacturer, is not guaranteed or endorsed by the publisher.
Abbreviations
a, Microfracture radius; U, Ue, Ud, UAEd, Work done by external forces on the rock, elastic strain energy stored in rock, dissipated energy calculated from U minus Ue, dissipated energy estimated from AE measurement; σ1, σ2, σ3, Maximum, medium, and minimum principal stress; ε1, ε2, ε3, Strains corresponding to major stresses; εvc, εv, Volumetric strain of microfractures, volumetric strain of rock; V, ΔVAEc, ΔVc, Rock volume, crack volume variation estimated from AE measurement, crack volume variation calculated based on strain data; E, ν, Elasticity modulus, Poisson’s ratio; u, Far field first motion displacement of the P wave; Cs, Magnitude of the sensor response including the material constants; Re (t,r), Reflection coefficient; t, Direction vector of AE sensor; r, Direction vector from the microfracture to the sensor; L, Distance between the AE source (microfracture) and AE sensor; M1, M2, M3, Three eigenvalues of the moment tensor; e1, e2, e3, Eigenvectors of the eigenvalues M1, M2, and M3; n, l, Unit motion vector and unit normal vector of the microfracture plane; γ, Tensile angle; λ, μ, Lame constant of rock;
References
Boatwright, J., and Fletcher, J. B. (1984). The partition of radiated energy between P and S waves. Bull. Seismol. Soc. Am. 74 (74), 361–376. doi:10.1785/bssa0740020361
Brady, B. H. G., and Brown, E. T. (2006). Rock mechanics: For underground mining. Berlin, Germany: Springer science & business media.
Chang, S. H., and Lee, C. I. (2004). Estimation of cracking and damage mechanisms in rock under triaxial compression by moment tensor analysis of acoustic emission. Int. J. Rock Mech. Min. Sci. 41 (7), 1069–1086. doi:10.1016/j.ijrmms.2004.04.006
Cui, S., Pei, X., Jiang, Y., Wang, G., Fan, X., Yang, Q., et al. (2021). Liquefaction within a bedding fault: Understanding the initiation and movement of the Daguangbao landslide triggered by the 2008 Wenchuan Earthquake (Ms = 8.0). Eng. Geol. 295, 106455. doi:10.1016/j.enggeo.2021.106455
Derek, M. C. (1997). Seventeenth Canadian geotechnical colloquium: The effect of cohesion loss and stress path on brittle rock strength. Can. Geotech. J. 34 (5), 698–725. doi:10.1139/t97-030
Frid, V. (1999). Electromagnetic radiation associated with induced triaxial fracture in granite. Philos. Mag. Lett. 79 (2), 79–86. doi:10.1080/095008399177570
Gong, F., Yan, J., Luo, S., and Li, X. (2019). Investigation on the linear energy storage and dissipation laws of rock materials under uniaxial compression. Rock Mech. Rock Eng. 52 (11), 4237–4255. doi:10.1007/s00603-019-01842-4
C. U. Grosse, and M. Ohtsu (Editors) (2021), Acoustic emission testing: Basics for research–applications in engineering, (Berlin, Germany: Springer Nature).
He, Y., and Kusiak, A. (2017). Performance assessment of wind turbines: Data-derived quantitative metrics. IEEE Trans. Sustain. Energy 9 (1), 65–73. doi:10.1109/tste.2017.2715061
Huang, D., and Li, Y. (2014). Conversion of strain energy in triaxial unloading tests on marble. Int. J. Rock Mech. Min. Sci. (1997). 66, 160–168. doi:10.1016/j.ijrmms.2013.12.001
Huang, J., Song, L., Yu, M., Zhang, C., Li, S., Li, Z., et al. (2022). Quantitative spatial analysis of thermal infrared radiation temperature fields by the standard deviational ellipse method for the uniaxial loading of sandstone. Infrared Phys. Technol. 123, 104150. doi:10.1016/j.infrared.2022.104150
Jiang, J., and Xu, J. (2018). Investigation of energy mechanism and acoustic emission characteristics of mudstone with different moisture contents. Shock Vib. 2018, 1–11. doi:10.1155/2018/2129639
Kang, Y., Ni, P., Fu, C., and Zhang, P. (2017). Estimation of damage location of rock based on denoised acoustic emission signals using wavelet packet algorithm. Geotech. Test. J. 40 (6), 20170029–20170977. doi:10.1520/gtj20170029
Kidybiński, A. (1981). Bursting liability indices of coal. Int. J. Rock Mech. Min. Sci. Geomechanics Abstr. 18 (4), 295–304.
Li, D., Wang, E., Li, Z., Ju, Y., Wang, D., and Wang, X. (2021). Experimental investigations of pressure stimulated currents from stressed sandstone used as precursors to rock fracture. Int. J. Rock Mech. Min. Sci. 145, 104841. doi:10.1016/j.ijrmms.2021.104841
Li, H., Deng, J., Feng, P., Pu, C., Arachchige, D., and Cheng, Q. (2021a). Short-term nacelle orientation forecasting using bilinear transformation and ICEEMDAN framework. Front. Energy Res. 9, 780928. doi:10.3389/fenrg.2021.780928
Li, H., Deng, J., Yuan, S., Feng, P., and Arachchige, D. (2021b). Monitoring and identifying wind turbine generator bearing faults using deep belief network and EWMA control charts. Front. Energy Res. 9, 799039. doi:10.3389/fenrg.2021.799039
Li, H., He, Y., Xu, Q., Deng, j., Li, W., and Wei, Y. (2022). Detection and segmentation of loess landslides via satellite images: A two-phase framework. Landslides 19, 673–686. doi:10.1007/s10346-021-01789-0
Liu, X. S., Ning, J., Tan, Y., and Gu, Q. (2016). Damage constitutive model based on energy dissipation for intact rock subjected to cyclic loading. Int. J. rock Mech. Min. Sci. 85, 27–32. doi:10.1016/j.ijrmms.2016.03.003
Lockner, D. (1993). The role of acoustic emission in the study of rock fracture. Int. J. Rock Mech. Min. Sci. Geomechanics Abstr. 30 (7), 883–899. doi:10.1016/0148-9062(93)90041-B
Martin, C. D., and Chandler, N. A. (1994). The progressive fracture of Lac du Bonnet granite. Int. J. rock Mech. Min. Sci. geomechanics Abstr. 31 (6), 643–659.
McGarr, A. (1976). Seismic moments and volume changes. J. Geophys. Res. 81 (8), 1487–1494. doi:10.1029/jb081i008p01487
Meng, Q., Zhang, M., Han, L., Pu, H., and Nie, T. (2016). Effects of acoustic emission and energy evolution of rock specimens under the uniaxial cyclic loading and unloading compression. Rock Mech. Rock Eng. 49 (10), 3873–3886. doi:10.1007/s00603-016-1077-y
Munoz, H., Taheri, A., and Chanda, E. K. (2016). Rock drilling performance evaluation by an energy dissipation based rock brittleness index. Rock Mech. Rock Eng. 49 (8), 3343–3355. doi:10.1007/s00603-016-0986-0
Qin, T., Duan, Y., Sun, H., Liu, H., and Wang, L. (2019). Energy evolution and acoustic emission characteristics of sandstone specimens under unloading confining pressure. Shock Vib. 2019, 1612576. doi:10.1155/2019/1612576
Shen, R., Li, H., Wang, E., Chen, T., Li, T., Tian, H., et al. (2020). Infrared radiation characteristics and fracture precursor information extraction of loaded sandstone samples with varying moisture contents. Int. J. Rock Mech. Min. Sci. 130, 104344. doi:10.1016/j.ijrmms.2020.104344
Song, D., Wang, E., and Jie, L. (2012). Relationship between EMR and dissipated energy of coal rock mass during cyclic loading process. Saf. Sci. 50 (4), 751–760. doi:10.1016/j.ssci.2011.08.039
Stavrakas, I., Triantis, D., Agioutantis, Z., Maurigiannakis, S., Saltas, V., Vallianatos, F., et al. (2004). Pressure stimulated currents in rocks and their correlation with mechanical properties. Nat. Hazards Earth Syst. Sci. 4 (4), 563–567. doi:10.5194/nhess-4-563-2004
Tang, C. (1997). Numerical simulation of progressive rock failure and associated seismicity. Int. J. Rock Mech. Min. Sci. 34 (2), 249–261. doi:10.1016/s0148-9062(96)00039-3
Vavryčuk, V. (2015). Moment tensor decompositions revisited. J. Seismol. 19 (1), 231–252. doi:10.1007/s10950-014-9463-y
Wang, C., He, B., Hou, X., Li, J., and Lu, L. (2020). Stress–energy mechanism for rock failure evolution based on damage mechanics in hard rock. Rock Mech. Rock Eng. 53 (3), 1021–1037. doi:10.1007/s00603-019-01953-y
Wang, E., Jia, H., Song, D., Li, N., and Qian, W. (2014). Use of ultra-low-frequency electromagnetic emission to monitor stress and failure in coal mines. Int. J. Rock Mech. Min. Sci. 70, 16–25. doi:10.1016/j.ijrmms.2014.02.004
Wang, Q., Chen, J., Guo, J., Luo, Y., Wang, H., and Liu, Q. (2019). Acoustic emission characteristics and energy mechanism in karst limestone failure under uniaxial and triaxial compression. Bull. Eng. Geol. Environ. 78 (3), 1427–1442. doi:10.1007/s10064-017-1189-y
Wu, L. X., Liu, S. J., Wu, Y. H., and Wu, H. P. (2002). Changes in infrared radiation with rock deformation. Int. J. Rock Mech. Min. Sci. (1997). 39 (6), 825–831. doi:10.1016/s1365-1609(02)00049-7
Wu, N., Liang, Z., Zhang, Z., Li, S., and Lang, Y. (2022). Development and verification of three-dimensional equivalent discrete fracture network modelling based on the finite element method. Eng. Geol. 306 (5), 106759. doi:10.1016/j.enggeo.2022.106759
Xie, H., Yang, J., Li, Y., Peng, R. D., and Yang, Y. (2011). Energy analysis for damage and catastrophic failure of rocks. Sci. China Technol. Sci. 54 (1), 199–209. doi:10.1007/s11431-011-4639-y
Zhang, M., Meng, Q., and Liu, S. (2017). Energy evolution characteristics and distribution laws of rock materials under triaxial cyclic loading and unloading compression. Adv. Mater. Sci. Eng. 2017, 1–16. doi:10.1155/2017/5471571
Zhang, P., Yu, Q., Li, L., Xu, T., Yang, T., and Zhu, W. (2020). The radiation energy of AE sources with diferent tensile angles and implication for the rock failure process. Geophys, Pure Appl. 177, 3407–3419. doi:10.1007/s00024-020-02430-2
Zhang, Y., Zhao, T., Taheri, A., Tan, Y., and Fang, K. (2019). Damage characteristics of sandstone subjected to pre-peak and post-peak cyclic loading. Acta Geodyn. Geomaterialia 2019, 143–150. doi:10.13168/AGG.2019.0011
Zhang, Z., Deng, M., Bai, J., Yu, X., Wu, Q., and Jiang, L. (2020). Strain energy evolution and conversion under triaxial unloading confining pressure tests due to gob-side entry retained. Int. J. Rock Mech. Min. Sci. 126, 104184. doi:10.1016/j.ijrmms.2019.104184
Zhao, Y., Yang, T., Zhang, P., Xu, H., and Wang, S. (2020). Inversion of seepage channels based on mining-induced microseismic data. Int. J. Rock Mech. Min. Sci. 126, 104180. doi:10.1016/j.ijrmms.2019.104180
Keywords: AE, dissipated energy, crack volume, moment tensor, energy conversion
Citation: Zhang P, Guan K, Deng W, Liu X, Qin T and Ma Q (2023) A model for rock dissipated energy estimation based on acoustic emission measurements. Front. Earth Sci. 10:1033012. doi: 10.3389/feart.2022.1033012
Received: 31 August 2022; Accepted: 27 September 2022;
Published: 10 January 2023.
Edited by:
Huajin Li, Chengdu University, ChinaReviewed by:
Liang Song, Information Engineering University, ChinaJianyong Han, Shandong Jianzhu University, China
Jianwei Huang, Hefei University of Technology, China
Copyright © 2023 Zhang, Guan, Deng, Liu, Qin and Ma. This is an open-access article distributed under the terms of the Creative Commons Attribution License (CC BY). The use, distribution or reproduction in other forums is permitted, provided the original author(s) and the copyright owner(s) are credited and that the original publication in this journal is cited, in accordance with accepted academic practice. No use, distribution or reproduction is permitted which does not comply with these terms.
*Correspondence: Kai Guan, Z3VhbmthaUBtYWlsLm5ldS5lZHUuY24=
 Penghai Zhang1
 Kai Guan
 Xige Liu