 Yiran Yang
 Yanzhong Li3*
 Kekuo Yuan
95% of researchers rate our articles as excellent or good
Learn more about the work of our research integrity team to safeguard the quality of each article we publish.
Find out more
ORIGINAL RESEARCH article
Front. Earth Sci. , 09 January 2023
Sec. Structural Geology and Tectonics
Volume 10 - 2022 | https://doi.org/10.3389/feart.2022.1031604
This article is part of the Research Topic Multiple Field/Scale Rock Mechanics in Coordinated Exploitation of Coal and its Associated Resources View all 11 articles
The creep and failure mode of stratified coal is complex and challenging to predict. This is highly attributed to the internal stratified structure generated during coal forming. In this study, the inner stratified structure of coal during creep failure was explored. The evolution relationship between the key creep parameters and the inner stratified structure was evaluated through creep tests. The creep failure characteristics of coal under complex stress were determined. A neural network model was established to predict the creep failure modes, and the output results were subjected to smoothing and tracking to reduce the error. The results showed distinct creep characteristics of coal with various types of stratified structure. Key parameters such as creep variable, steady creep state and creep rate exhibited a nonlinear relationship with stress. The dual control neural network model constructed in the study showed high accuracy and stability. This model can be used as a guidance and reference for the study of creep failure mechanism and elucidation of creep behavior prediction of stratified coal.
Creep damage and coal failure significantly affects safe mining (Hoek and Brown, 1997). Creep failure of the coal body is more common when the mining depth increases. The disaster management methods previously used do not alleviate new disasters due to the complexity and variability of the coal creep mechanism. This results in the significant increase in disaster risk and low efficiency of disaster relief strategies, ultimately threatening safe mining of coal resources. Therefore, it is imperative to explore the coal creep formation process to lay a basis for safety coal mining.
Experimental studies are currently the main approaches used to study the creep characteristics of coal. Advances in experimental procedures in the recent past has promoted the development of experimental coal creep research. Previous researchers modified experimental equipment according to their needs and upgraded the original single experimental equipment to multi-functional intelligent control devices, which enhanced the process of coal creep research.
A study was previously conducted to explore the creep behavior and characteristics of saturated rock under high stress and in situ stress under the mode of uniaxial single-stage loading and graded incremental cyclic loading (Liu et al., 2013). The findings provided a basis for control of coal deformation and alleviated deep saturated rock mass risks. Dubey and Gairola (2005) evaluated the effect of internal structural anisotropy of rock salt on the creep behavior through experimental methods. The findings indicated that structural anisotropy significantly modulated the instantaneous strain, transient strain, steady strain and enhanced strain development in rock salt. The effect of structural anisotropy on rock salt deformation is negatively correlated with stress. Pellet and Fabre (2007) conducted static, quasi-static, and cyclic creep experiments on sedimentary rocks. The results showed that clay particles significantly affected the creep behavior, and the particle creep markedly affected the overall creep behavior. Rahimi and Hosseini (2014) conducted triaxial creep tests using thick-walled hollow columnar salt rock specimens, and explored the effects of confining pressure, deviating stress and strain rate on salt rock creep behavior. The results indicated that strain rate increased with increase in deviating stress and confining pressure, and the lateral pressure had higher effect on tangential strain rate changes compared with deviating stress. Grgic and Amitrano (2009) conducted by uniaxial creep experiment to explore the effect of water saturation on rock creep. Analysis of strain and acoustic emission monitoring data showed that micro-fracture plays an essential role in the creep process.
Nadimi et al. (2011) conducted a triaxial creep test using rock samples to evaluate the aging characteristics of rock mass, and estimated the dynamic constitutive creep model parameters of rock mass using creep test and experimental data. The test results were consistent with the experimental data. These findings thus provide a theoretical basis for the support design of underground engineering. Herrmann et al. (2020) explored the creep behavior of shale by conducting a creep experiment under high confining pressure and varying temperature. The creep strain was enhanced under high temperature, axial differential pressure stress and low confining pressure. The initial creep strain was associated with the mechanical properties determined by short-term constant strain rate experiment. Bhat and Bhandary (2013) improved the torsional ring shear device, determined the change in displacement over time and under constant creep stress, explored the residual state creep behavior of typical cohesive soil. A residual state creep failure prediction curve was generated for determination of the failure time and prediction of displacement of the creep landslide. Bagheri et al. (2015) conducted triaxial creep experiments under different shear stresses and strain rates using clay samples, evaluated the volumetric strain rates, and explored the relationship between initial volumetric strain and time. The volumetric strain–time and volumetric strain rate–time responses were found to be in good agreement with the literature, the observed time- and stress-level-dependency of the were found to be in contradiction with the general assumption as a material constant.
Fabre and Pellet (2006) carried out creep experiments on argillite under multiple stresses. The findings indicated that the overall mechanical properties of the argillite rapidly deteriorated when the cracks of argillite were unstable, and the creep process of clay particles caused viscoplastic strain of the argillite. Brantut et al. (2012) constructed a micromechanical model for simulation of brittle creep of rock under triaxial stress. Davis et al. (2008) conducted triaxial compression experiments on dolomite under varying temperature conditions. The results revealed the differences in creep mechanisms between coarse-grained dolomite and fine-grained dolomite with different grain sizes.
Several scholars have widely explored the mechanical properties of coal with significant findings. Cao et al. (2016) established a nonlinear damage creep constitutive model of soft rock under high stress based on the nonlinear damage creep characteristics and damage variables of rock to explore the creep deformation of soft rock. Tomanovic (2006) conducted experiments on the creep of soft rock at room temperature, and established a rheological model of soft rock. The rheological model was used to evaluate the creep process after loading, full unloading or partial unloading. It is imperative to explore the creep process of tunnel surrounding rock. Fahimifar et al. (2015) modified a viscoplastic model originally established under high stress during the extrusion state. The numerical finite-difference method was used to solve the equation of the model by approximating derivatives with finite differences. The model was applied to a series of indoor creep experiments and it exhibited high accuracy.
Nazary Moghadam et al. (2013) established creep process numerical models to determine dilatancy, short-term failure and long-term failure of salt rock samples during transient and steady creep processes in underground cavern. The validity and applicability of the proposed model were evaluated by finite element analysis. Firme et al. (2018) optimized the DM creep model using different methods and the optimized model effectively expressed the transient creep process. Hajiabadi and Nick (2020) established a rate-dependent constitutive model for accurately predicting the change in axial yield stress as a power function of applied axial strain rate. The model reproduced the rate-dependent behavior of porous rock under various loading conditions. Sterpi and Gioda (2009) evaluated the effect of viscoelasticity (primary) and viscoplastic (secondary) on the rheological model, performed finite element analysis on the strain of deep circular tunnel, and determined the effect of creep on tunnel shrinkage the finite element results show that the contribution of tertiary creep is crucial in the prediction of the short-term closure of the tunnel. This could have a notable negative effect in case of TBM driven tunnels. Pellet et al. (2005) established a rock constitutive model that considered the viscoplastic behavior and damage evolution over time. The model was used to simulate the creep delay instability of the third stage, which represented simulation of the evolution of the damage zone during underground cavern excavation. Nedjar and Le Roy (2013) constructed a local damage model based on the concept of yield surface and verified its applicability through numerical simulation. Heusermann et al. (2003) constructed a constitutive model for exploring the nonlinear creep behavior of rock salts and verified its stability and validity. Olivella and Gens (2002) established a creep constitutive model based on transfer creep and dislocation creep, which accurately predicted the creep strain rate of rock.
Coal is characterized by several micro-cracks, voids and defects, which cause nonlinear mechanical behavior. Currently, the rheological behavior model is commonly used idealized analysis model in studying coal creep behavior. The mechanical properties of coal have high variability. Therefore, study of the mechanical properties of coal using an idealized model is challenging.
Several constitutive models have been established to explore the creep behavior characteristics of coal under different stress. Constitutive models have been used to obtain the deformation features of underground space such as tunnel or chamber surface (Zhifa et al., 2001; Kontogianni et al., 2006; Fahimifar et al., 2010). Different properties and the behavior characteristics of the same material under different mechanical parameters have been elucidated. Previous findings indicate that the classical viscoelastic model has limitations. Several rheological models have been proposed in different studies to simulate the creep damage-failure mechanical behavior of coal (Guan et al., 2007). Previous experimental results exhibited an unrecoverable creep of rock even under minimal stress. Therefore, scholars assumed that the first, second and third stages of creep curve were completely irreversible deformation stages. A model with different characteristics compared with the viscoelastic model was constructed based on this assumption to evaluate the long-term stability of surrounding rock after underground chamber excavation (Parsapour and Fahimifar, 2016). (Li and Xia, 2000) studied the influence of strain history on rock specimen deformation during multi-level loading and unloading cyclic uniaxial compression creep tests. Results show that the creep of rock usually undergoes the three stages of deceleration, steady, and accelerated for a given constant stress, whether each stage is evident and the duration of every stage depends on the behavior of the rock material observed and the load level applied.
Construction of creep model requires accurately describing the creep and failure characteristics of rock under varying stress. The coal creep prediction model based on artificial neural network is currently used to determine the creep characteristics of coal. Neural network has be used in previous studies to explore coal creep characteristics and good results have been obtained. However, the results from previous studies are not consistent.
In this study, the failure characteristics of coal under complex stress were studied based on the underground stress path. In addition, artificial neural network was utilized to explore the creep-damage-failure characteristics of coal, and for simulation of the creep characteristics and instability mechanism of coal. A BP neural network model was established and optimized using creep test data, then, the Lyapunov function was used to verify the stability of the model.
The creep test under uniaxial static load used in this study adopts the method for measurement of rock creep characteristics recommended by ISRM (2014). Saturated sodium nitrate solution infiltration was used during the test to maintain a stable relative humidity. The relative humidity was maintained at 40% at 20°C. The range of relative humidity and temperature was maintained at ±5.0% and ±1.0°C, respectively.
The rock THMC rheological test method was used in this study. A calibration curve was generated to evaluate the relationship between the effective stress of the equipment and the applied stress, which was expressed as (y=0.244x-0.511) (Figure 1). Other equipment used in the study included strain gauge, digital Micro II-Express multi-channel acoustic emission device, and high-speed digital camera. Strain gauge and DD1 cantilever strain sensor were used to determine the axial and radial strain to obtain various signal forms generated by the sample under stress.
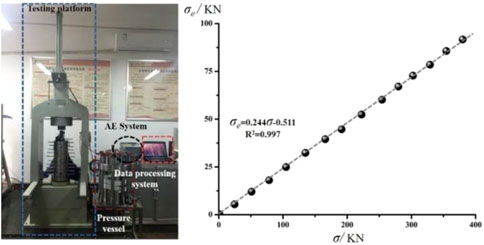
FIGURE 1. THMC multi-field coupled rheological test system.
The test samples were assigned to four groups according to the differences in the internal structure (Table 1). In the current study, 30%, 40%, 50%, 60%, 70%, 75%, 80% and 85% compressive stresses of the uniaxial compressive strength were applied to simulate the effect of comprehensive in situ stress caused by overburden geological body and tectonic stress. The unstructured samples were subjected to compressive stress equivalent to 50%, 60%, 70%, 80% of the respective uniaxial compressive strength. The stress control method was used for sample loading, and the loading rate was 0.01 kN/s. Experimental parameters were determined at the initial stages of the creep test at intervals of 1.0 min, 5.0 min, and 10.0 min, and then the interval was extended to 0.5–1.0 h at the course of the experiment. At the end of the experiment, the interval of recording the parameters were changed to 10.0 min, 5.0 min and 1.0 min when the samples approached the failure mode.
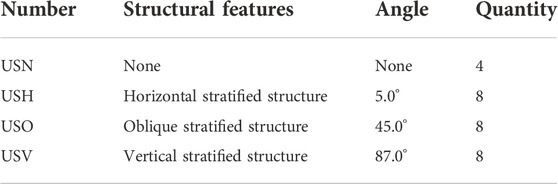
TABLE 1. Sample grouping list.
Static creep tests for rock specimens without stratified structures were performed at stress levels comparable to the average σAID of CI threshold σCI and CD threshold σCD. The constant stress was applied in this test and maintained by controlling the axial load. Increase in strain (axial and transverse) was monitored as the sample progressed to the failure mode.
The strain-time evolution and failure characteristics of USN-1 under a loading stress of 50% UCS are presented in Figure 2A. The results showed that the specimen underwent three typical creep stages. The creep experiment lasted for about 43.1 h. In the initial stage, cracks developed and evolved inside the specimen when the force was applied to the specimen. The acoustic emission signal gradually increased and reached the initial peak value. The creep then progressed to the second creep stage. The AE signal weakened gradually, however, the AE signal did not progress to the silent stage and was stable and active during the entire experiment. The cracks significantly changed as the experiment progressed to the third creep stage. The second peak value of AE signals was caused by emergence of new cracks and the development of original cracks, and the specimen was markedly deformed and fractured. The entire specimen was ultimately destroyed. Fracture development and evolution of the sample during the experiment exhibited random characteristics, and the final failure mode was not predictable.
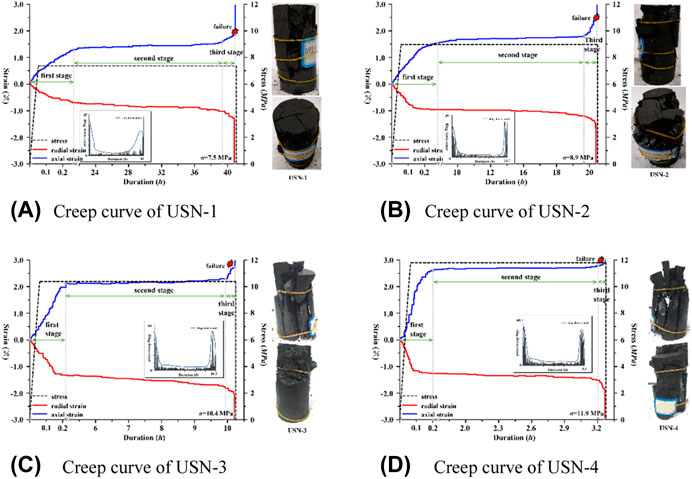
FIGURE 2. Laboratory findings of USN group samples.
The strain-time evolution and failure characteristics of USN-2 under a stress load of 60% UCS are shown in Figure 2B. The creep stage duration of USN-2 was shorter compared with USN-1, and the behavior of the three typical creep stages was predictable. The number of acoustic emission signals of USN-2 was higher. The number of signals significantly increased when the creep progressed to the second peak. This finding indicates that more energy was stored in the failure mode of the sample under relatively high stress state. The energy was released immediately after destruction of the sample resulting in evident failure characteristics. The specimen exhibited irregular failure development path. The blocks in some positions were completely detached from the sample and exhibited fragmentation phenomenon.
The failure characteristics of USN-3 under a stress load of 70% UCS are shown in Figure 2C. The duration of the overall creep stage was about 11.7 h, and the maximum axial creep before failure was 2.1%. The acoustic emission signal was restored to the normal state when the sample progressed to the second creep stage, and the sample exhibited a relatively strong signal. Medium and large cracks were observed on the surface of the sample at a creep time of 8.3 h. In addition, acoustic emission signals increased at this point, and the sample progressed to the stable creep state and the third creep stage. The sample exhibited completely detached and scattered blocks, accompanied by significant slagging phenomenon. The crack development path was irregular, which was attributed to the occurrence of impurities and the sample mechanical properties.
The USN-4 creep stage was 3.3 h long (Figure 2C). The maximum axial deformation of specimen before failure was 2.7%. The intensity and quantity of AE signals enhanced the phenomenon of energy concentration and significant energy release was observed. The overall failure of the sample ultimately occurred under the synergistic action of transverse and longitudinal cracks. The USN-4 exhibited a crumpled bulk structure and had essentially no bearing capacity. The longitudinal cracks played a dominant role in the failure process, whereas the transverse cracks mainly accelerated the failure process and caused loss in residual strength. Loss in residual strength markedly affected the overall failure of the sample.
The fracture development and evolution of the sample exhibited evident random characteristics since the samples had random structures, and the final failure mode was unpredictable.
Compressive stresses equivalent to 30%, 40%, 50%, 60%, 70%, 75%, 80%, and 85% of the UCS were applied in analysis of stratified coal samples. The relationships between the stress and strain of USH, USO and USV samples are shown in Figures 3.
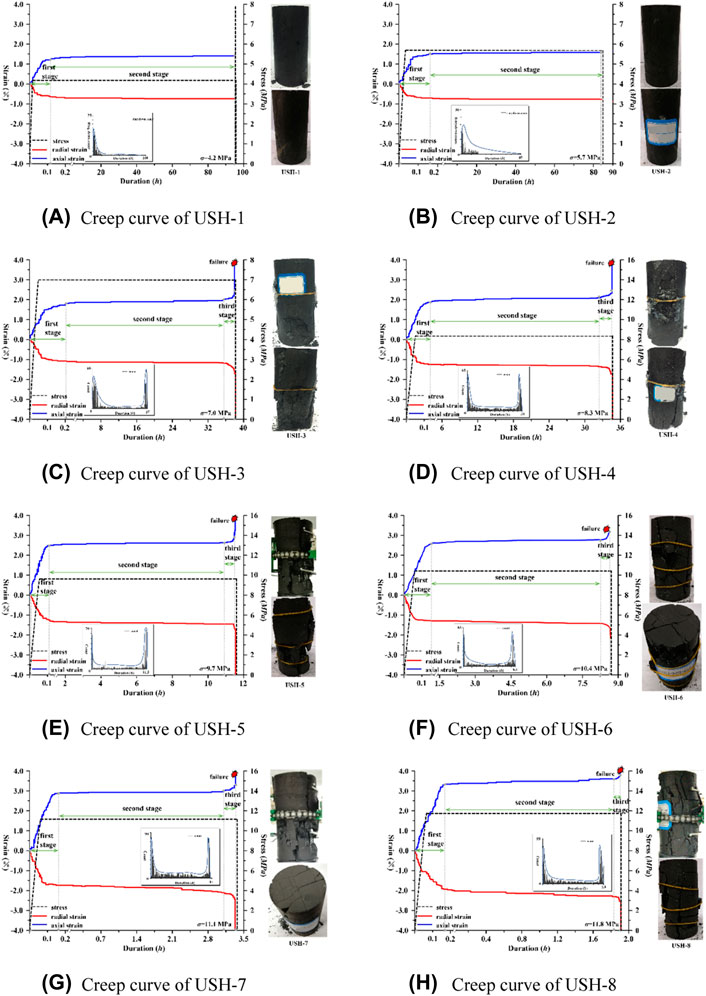
FIGURE 3. Laboratory findings of USH group samples.
The evolution of stress and strain of USH-1 and USH-2 under static loading are presented in Figures 3A,B. The axial strain and radial strain of the sample primarily occurred in the first creep stage. The strain slightly increased when the samples progressed to the second stage. The axial strain and radial strain exhibited a static state at 71.5 h, and the samples progressed to the stress equilibrium stage. Acoustic emission monitoring indicated that the samples had abundant acoustic emission signals in the initial stage of loading. The acoustic emission signals were gentle with a continuous downward trend as the sample progressed to the second stage. The samples then progressed to the stress equilibrium stage, and the acoustic emission signals gradually decreased to a value less than the threshold value. Notably, the specimen remained intact.
The creep curves of USH-3 and USH-8 are presented in Figures 3C–H. The results showed that all samples ultimately exhibited the failure mode, and had distinct failure parameters. The creep durations of USH-3 and USH-4 samples were 38.1 h and 34.3 h, respectively. The axial strains of the two samples were approximately 2.0% at the second creep stage. The final failure modes of the two samples were similar. The two samples were characterized by failure of small wedge-shaped blocks and vertical multi-crack breakdown of stratified structure. The general failure mode was a top-bottom penetrating failure. The shear development of transverse structure was not significant, thus there was no the phenomenon of large coal body detaching from the main body. The creep test durations of USH-5 to USH-8 samples were 9.5 h, 8.6 h, 3.3 h and 1.9 h, respectively. The failure of each sample occurred within a relatively short time (Figure 4). Energy accumulated in the sample during the creep process due to the large load. Therefore, energy was rapidly released in the failure stage, resulting in fragmentation or complete transfixion failure mode of all the samples at varying degrees. The damaged samples were scattered, and the residual strength was approximately zero. Development of cracks in the samples did not exhibit clear directivity. The statistics showed that the number of transverse and longitudinal fractures which significantly influenced the strength of the sample was relatively equal. This finding indicates that the structural characteristics of the coal samples did not exhibit distinct effect on the creep deformation and failure characteristics under relatively high stress.
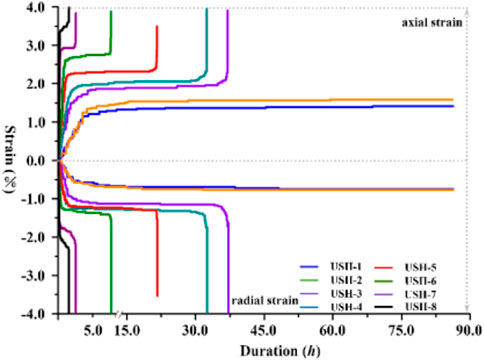
FIGURE 4. Strain-time curve of USH group samples.
USO-1 exhibited a state of stress equilibrium, and the sample did not undergo damage at final stage (Figure 5A).
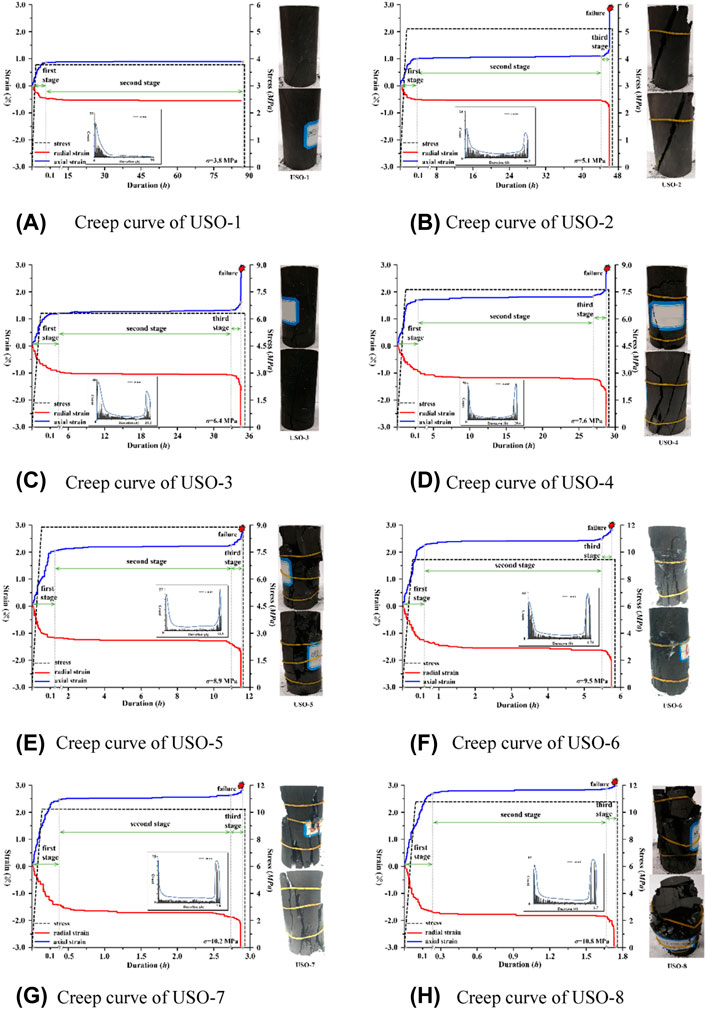
FIGURE 5. Laboratory findings of USO group samples.
The creep curves of USO-2, USO-3 and USO-4 are presented in Figures 5B–D, respectively. The final failure mode was observed in all samples, but the failure time and morphology were significantly different. The experimental duration of USO-2 under an axial stress of 5.1 MPa was 45.9 h. The axial strain and radial strain at the second creep stage were 1.06% and 0.57%, respectively. The sample failure mode was characterized by top-bottom shear failure along the stratified structural plane, as well as fragmentation and shedding of small wedge-shaped blocks at the top. The stratified structural plane played a key control and induction role during the failure process of the sample. The results showed that it was a typical structure-dominated sample. The constant load of USO-3 was 6.4 MPa, the creep duration was about 34.6 h, and the axial strain and radial strain were approximately 1.18% and 0.95%, respectively, at the second creep stage. The sample failure mode was mainly characterized by a stratified structure, with the failure plane relatively along the stratified structure plane. The laminar failure phenomenon occurred locally, with a small range and relatively weak bedding plane. The stress load for USO-4 was 7.6 MPa and the creep duration was 28.8 h. The axial strain significantly increased by 1.67% and the radial strain increased to 1.04%. The sample failure mode was mainly characterized by stratified structures. Medium and large block cracks and detached blocks were generated on one side of the failure plane. The acoustic emission exhibited peak signals at both ends and weak signals at the middle, which was attributed to the internal structure of the sample.
Creep curves of USO-5—USO-8 samples are shown in Figures 5E–H, respectively. The creep duration of the USO-5 sample under 8.9 MPa stress was 11.4 h, and the axial strain and radial strain were 2.11% and 1.28%, respectively. The failure mode of the sample was characterized by co-dominant failure mode with stratified structure and random fracture. Most of the failure planes were distributed along the direction of the stratified structure, and some dominant fractures were caused by the random occurrence of the primary fracture after development for a long time. The final failure mode of the sample exhibited a cataclactic structure. Increase in axial and radial strain of USO-6 coal sample was smaller compared with that of USO-5, but the failure mode of USO-6 coal sample significantly changed. USO-6 coal sample exhibited a large block splitting failure mode dominated by stratified structure. Shear failure along the stratified structure and large block splitting failure were observed near the free surface, and the superposition of the two failures caused the overall strength to decline. USO-7 and USO-8 exhibited similar strain evolution and failure modes. In the second creep stage, the axial and radial strains of USO-7 and USO-8 were approximately 2.55% and 1.68%, respectively. Acoustic emission monitoring showed that the two samples had similar acoustic emission energy characteristics, with peak signals at the sides and low signals at the middle. The failure mode of USO-7 was characterized by a stratified structure dominated failure, accompanied by local block structure exfoliation. The creep duration of USO-8 was 1.77 h, and the sample exhibited random cracks. The sample showed a fragmentation state after the failure, and the dominant failure structure was not distinct. This observation was mainly because the sample was in an energy-absorbing state in the early stage, and energy was released when the sample was destroyed at the final stage. This caused complete breakdown damage to the internal structure of the sample, resulting in overall fragmentation failure of the sample (Figure 6).
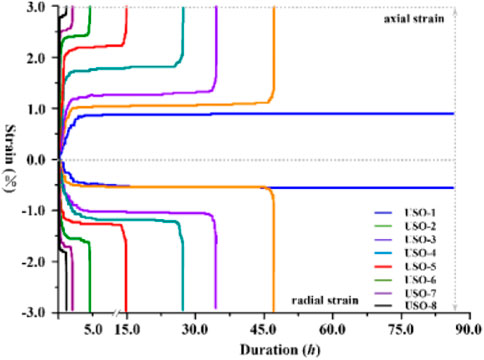
FIGURE 6. Strain-time curve of USO group samples.
The creep curves of USV-1 and USV-2 samples under 30% UCS and 40% UCS loads are shown in Figures 7A,B. The two samples progressed to the stress equilibrium stage at approximately 50–60 h loading time, and no damage was observed in the two samples.
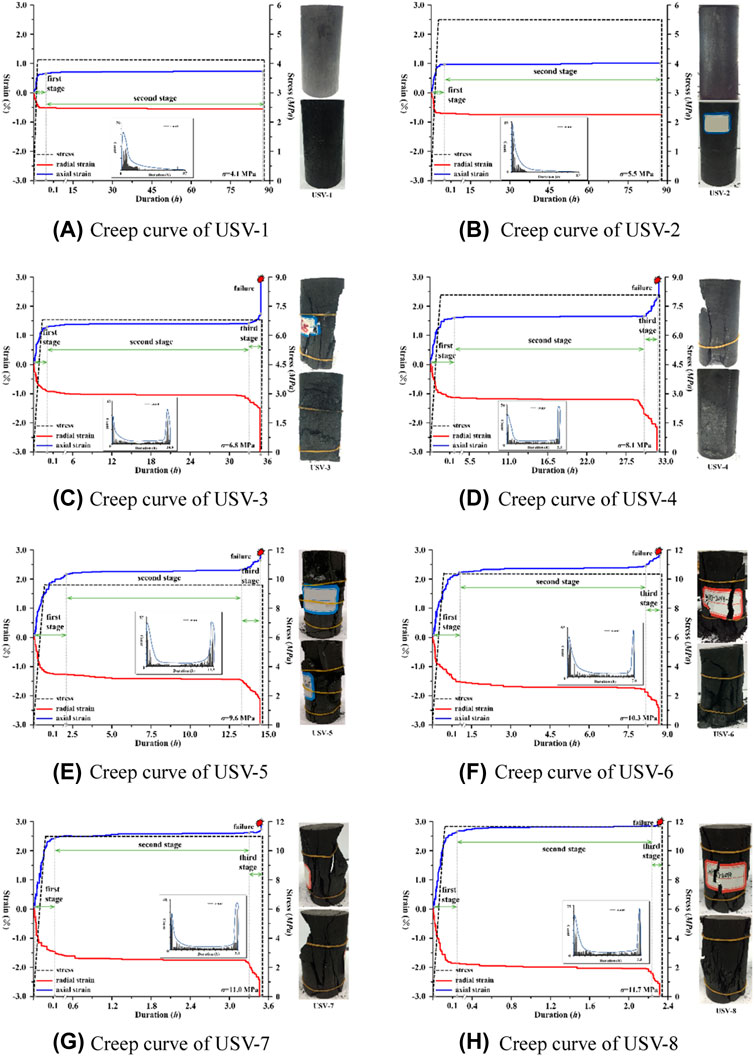
FIGURE 7. Laboratory findings of USV group samples.
The creep curves of USV-3 and USV-4 samples under 50% UCS and 60% UCS loads are presented in Figures 7C,D. The two samples underwent the three typical creep stages. The samples showed partial splitting and failure characterized by stratified structure. The local splitting phenomenon was observed near the free surface causing splitting failure locally. The USV-2 sample exhibited three medium and large cracks, which did not penetrate into the sample. USV-3 samples had two large cracks. One of the cracks traversed the upper and lower surfaces of the sample. This crack was the main cause of failure in the USV-3 sample. The other fracture developed along the stratified structure and did not penetrate into the sample. Therefore, it played a secondary role in the failure process.
The creep curves of USV-5—USV-8 samples at 70%–85% UCS load are shown in Figures 7E–H. The failure process in of USV-5—USV-8 samples is presented in Figure 8. The failure modes of these samples were not limited to the failure type dominated by the stratified structure. The failure type of most of the samples exhibited mixed failure modes. Acoustic emission monitoring showed that the evolution pattern was characterized by high peaks at both ends and low peaks at the middle, which corresponded to the general evolution mode of fracture development at the early stage, energy accumulation during the middle stage and energy release in the late stage.
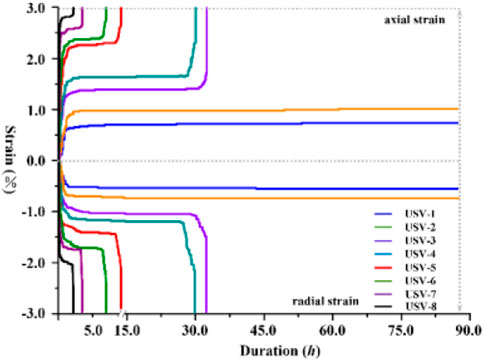
FIGURE 8. Strain-time curve of USV group samples.
The results showed that the strain of the USV sample was the highest, followed by that of USO samples, whereas the strain of the USH was the lowest. The strain of the samples increased with increase in creep stress (Figure 9). The strain can be expressed as a logarithmic function as shown below:
where, εin represents the creep strain and σ denotes the creep stress.
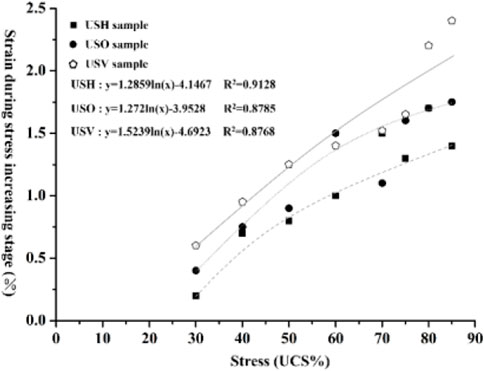
FIGURE 9. Strain-constant stress curve of coal samples.
The duration of the steady-state creep stage decreased with increase in creep stress as the load was increased (Figure 10). The duration of the steady-state creep stage can be expressed as a logarithmic function:
Where, ts represents the duration of the steady-state creep stage and σ indicates the constant load.
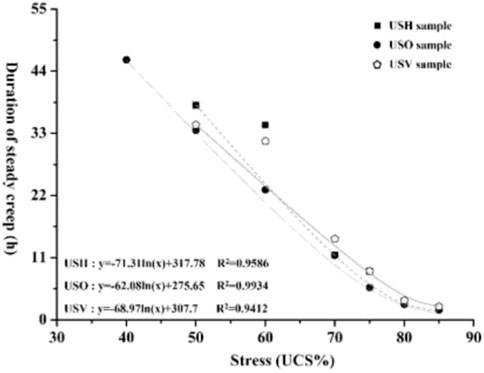
FIGURE 10. Duration-constant stress curve during load increasing stage.
The steady-state creep duration decreased with increase in stress load. This finding indicates that the effect of structural anisotropy on the steady-state creep duration decreased with increase in the stress load. The steady creep stage only lasted for a short time after application of 70% UCS stress load, and the accelerated creep stage significantly modulated deformation of the stratified structure samples.
Statistical data analysis showed that the creep rates of all the samples were not significantly different under a 60% UCS load. The creep rates of the samples significantly changed when the load was more than 60% of UCS. The creep rate of the USV sample was the lowest among the three kinds of samples, whereas the creep rates of USH and USO samples exhibited a significant fluctuation. Increase in stress load caused an increase in the incremental creep rate (Figure 11). The relationship between the creep rate and the load can be expressed as an exponential function with base e as shown below:
where, Vs. denotes the creep rate and σ represents the creep stress.
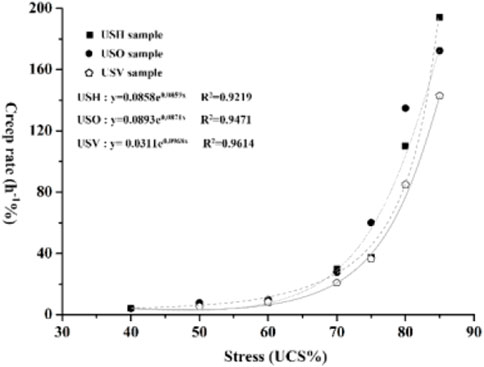
FIGURE 11. Curve of creep rate-constant stress.
Advances in artificial intelligence (AI) has significantly revolutionized geotechnical engineering research. Artificial neural network (ANN) has been widely applied in this field. Application of neural network model is effective in solving multi-parameter problems whereby the process and results are not fully elucidated. BP neural network is an artificial neural networks method widely used for construction of neural network models. BP network comprises an input layer, hidden layer and output layer, and all layers are completely connected. The binding strength (weight) between the layers is adjusted in cases whereby the actual output on the output layer is inconsistent with the given output until the given input-output relationship is finally satisfied. The learning process of BP network can be grouped in four stages: pattern propagation → error propagation → memory training → learning convergence. The steps of the algorithm are explained below.
(1) The connection weights and node thresholds of nodes at each layer are initialized with random numbers between [−1, +1].
(2) Assume the input xi and the expected output yi.
(3) Figure up the input of each layer node.
The output
Where, ωij is the connection weight between input node i and output node ij, θj is the node threshold, f is the Sigmoid function,
(4) Define the cumulative error function.
Where, K is the sequence of input and output mode pairs.
(5) The revised weight
Where, t is the training times, η is the learning rate,
Output layer
Hidden layer
BP algorithm is prone to fall into local minimum and slow convergence in iterative calculation. In this study, additional momentum method and adaptive learning rate improved BP algorithm were used to overcome the above two problems. The additional momentum method is based on the inverse propagation method in each weight change to add a value proportional to the previous weight change (momentum term), and according to the inverse propagation method to produce a new weight change. The weight adjustment formula with additional momentum factor can be expressed as
Where, ∆ωij is the weight change, ∆bj is the threshold change, δi is the error term, Pj is the input variable, η is the learning rate, t is the training times, mC is the momentum factor.
The output error of BP neural network can be reduced by tracking control method, which is as follows:
Neural network system output is
The system input
To avoid the controller’s non-smoothness, define the following functions
The
Where,
To track y(k) with x(k), we set up the controller here. Define the tracking error
Where,
Since the system function
Substitute (23) into (22), we can get
Where,
The expression of the constructed controller is
Substitute (25) into (24), we can get
The renewal rate of the constructed neural network is
Therefore, the error system can be expressed as
The following part is the stability analysis.
Construct Lyapunov function for stability analysis, and its function expression is
Its difference can be expressed as
Insert (28) into (30), we can get
The Eq. 28 can be converted into
The Eq. 32 can be rewritten as
Due to
Substitute (34) into (31), we can get,
Eq. 36 can be obtained by transforming (35),
Construct a design parameter σ whose range is
According to Lyapunov theorem, the tracking error of the system is small enough to meet the accuracy requirement.
The BP neural network has robust nonlinear mapping ability and flexible network structure compared with other neural networks. In this study, the output data from the BP neural network was compared with the creep test results to verify the accuracy and stability of the BP neural network. Analysis of the rock strain data from the BP neural network and creep test showed that the mean values were 0.611 and 0.627, and the median values were 0.703 and 0.715, respectively. The K-fold was used to classify the dataset into the training dataset and the testing dataset. The testing dataset was used for evaluation of the model. A portion of the training data was set aside as the validation dataset to evaluate the training effectiveness of the model to solve the overfitting problem. The validation dataset obtained from the training dataset was used to validate the model.
The average relative errors of the data from BP neural network and the viscoelastic–viscoplastic model were 0.51 and 0.57%, respectively, relative to the creep test data, which shows a high degree of consistency. This finding further showed that the BP neural network had high accuracy and stability and indicates that the viscoelastic–viscoplastic model was scientifically viable and accurate.
The following conclusion were drawn from the present study:
(1) The crack paths of the USN coal samples were random causing significant irregularity of the failure characteristics. The failure modes of the USH coal samples were mainly characterized by oblique shear failure mode with a stratified structure and failure that traversed from the top to bottom surfaces. The angle between the failure surface and the horizontal plane was greater than 60°. The failure modes of the USO coal samples were mainly shear failure type and a stratified structure dominated the block splitting failure. The failure modes of coal samples in the USV group were not limited to failure mode dominated by the stratified structure. These samples mainly exhibited mixed failure mode.
(2) A positive correlation was observed between strain and creep stress during stress loading, which can be expressed as a logarithmic function. In addition, the steady-state creep time and creep stress can be expressed as a logarithmic function. The relationship between the creep rate and creep stress before failure can also be expressed as an exponential function.
(3) A BP neural network model was established and optimized using the creep test data. The Lyapunov function was constructed to validate the stability and accuracy of the model.
The original contributions presented in the study are included in the article/supplementary material, further inquiries can be directed to the corresponding author.
YY: project administration, supervision. YL, writing-reviewing and editing. KY and GL: software, validation. ZL: visualization, investigation.
This research was funded by the General Project of Shaanxi Provincial Department of Science and Technology, grant number 2022JQ-463, the General Project of Shaanxi Provincial Department of Education, grant number 21JK0952, the High-level Talents Special Fund of Xijing University, grant number XJ21B12.
The handling editor YZ declared a shared affiliation with the author YY at the time of review.
The authors declare that the research was conducted in the absence of any commercial or financial relationships that could be construed as a potential conflict of interest.
All claims expressed in this article are solely those of the authors and do not necessarily represent those of their affiliated organizations, or those of the publisher, the editors and the reviewers. Any product that may be evaluated in this article, or claim that may be made by its manufacturer, is not guaranteed or endorsed by the publisher.
Bagheri, M., Rezania, M., and Mousavi Nezhad, M. (2015). An Experimental study of the initial volumetric strain rate effect on the creep behaviour of reconstituted clays. IOP Conf. Ser. Earth Environ. Sci. 26, 012034. doi:10.1088/1755-1315/26/1/012034
Bhat, D. R., Bhandary, N., and Yatabe, R. (2013). Residual-state creep behavior of typical clayey soils. Nat. Hazards (Dordr). 69, 2161–2178. doi:10.1007/s11069-013-0799-3
Brantut, N., Baud, P., Heap, M. J., and Meredith, P. (2012). Micromechanics of brittle creep in rocks. J. Geophys. Res. 117, 8412. doi:10.1029/2012JB009299
Cao, P., Youdao, W., Wang, Y., Haiping, Y., and Yuan, B. (2016). Study on nonlinear damage creep constitutive model for high-stress soft rock. Environ. Earth Sci. 75, 900. doi:10.1007/s12665-016-5699-x
Davis, N. E., Kronenberg, A. K., and Newman, J. (2008). Plasticity and diffusion creep of dolomite. Tectonophysics 456, 127–146. doi:10.1016/j.tecto.2008.02.002
Dubey, R., and Gairola, V. (2005). Influence of stress rate on rheology – an experimental study on rocksalt of simla himalaya, India. Geotech. Geol. Eng. (Dordr). 23, 757–772. doi:10.1007/s10706-003-2596-3
Fabre, G., and Pellet, F. (2006). Creep and time dependent damage in argillaceous rocks. Int. J. Rock Mech. Min. Sci. 43, 950–960. doi:10.1016/j.ijrmms.2006.02.004
Fahimifar, A., Karami, M., and Fahimifar, A. (2015). Modifications to an elasto-visco-plastic constitutive model for prediction of creep deformation of rock samples. Soils Found. 55, 1364–1371. doi:10.1016/j.sandf.2015.10.003
Fahimifar, A., Tehrani, F., Hedayat, A., and Vakilzadeh, A. (2010). Analytical solution for the excavation of circular tunnels in a visco-elastic Burger’s material under hydrostatic stress field. Tunn. Undergr. Space Technol. 25, 297–304. doi:10.1016/j.tust.2010.01.002
Firme, P., Brandao, N., Roehl, D., and Romanel, C. (2018). Enhanced double-mechanism creep laws for salt rocks. Acta Geotech. 13, 1329–1340. doi:10.1007/s11440-018-0689-7
Grgic, D., and Amitrano, D. (2009). Creep of a porous rock and associated acoustic emission under different hydrous conditions. J. Geophys. Res. 114, B10201. doi:10.1029/2006JB004881
Guan, Z., Jiang, Y., Tanabashi, Y., and Huang, H. (2007). A new rheological model and its application in mountain tunnelling. Tunn. Undergr. Space Technol. 23, 292–299. doi:10.1016/j.tust.2007.06.003
Hajiabadi, M., and Nick, H. (2020). A modified strain rate dependent constitutive model for chalk and porous rock. Int. J. Rock Mech. Min. Sci. 134, 104406. doi:10.1016/j.ijrmms.2020.104406
Herrmann, J., Rybacki, E., Sone, H., and Dresen, G. (2020). Deformation experiments on bowland and posidonia shale—Part II: Creep behavior at in situ pc–T conditions. Rock Mech. Rock Eng. 53, 755–779. doi:10.1007/s00603-019-01941-2
Heusermann, S., Rolfs, O., and Schmidt, U. (2003). Nonlinear finite-element analysis of solution mined storage caverns in rock salt using the LUBBY2 constitutive model. Comput. Struct. 81, 629–638. doi:10.1016/S0045-7949(02)00415-7
Hoek, E., and Brown, E. (1997). Practical estimates of rock mass strength. Int. J. Rock Mech. Min. Sci. 34, 1165–1186. doi:10.1016/S1365-1609(97)80069-X
Kontogianni, V., Psimoulis, P., and Stiros, S. (2006). What is the contribution of time-dependent deformation in tunnel convergence? Eng. Geol. 82, 264–267. doi:10.1016/j.enggeo.2005.11.001
Li, Y., and Xia, C. (2000). Time-dependent tests on intact rocks in uniaxial compression. Int. J. Rock Mech. Min. Sci. 37, 467–475. doi:10.1016/S1365-1609(99)00073-8
Liu, L., Wang, G.-m., Chen, J.-h., and Yang, S. (2013). Creep experiment and rheological model of deep saturated rock. Trans. Nonferrous Metals Soc. China 23, 478–483. doi:10.1016/S1003-6326(13)62488-7
Nadimi, S., Shahriar, K., Sharifzadeh, M., and Moarefvand, P. (2011). Triaxial creep tests and back analysis of time-dependent behavior of Siah Bisheh cavern by 3-Dimensional Distinct Element Method. Tunn. Undergr. Space Technol. 26, 155–162. doi:10.1016/j.tust.2010.09.002
Nazary Moghadam, S., Mirzabozorg, H., and Noorzad, A. (2013). Modeling time-dependent behavior of gas caverns in rock salt considering creep, dilatancy and failure. Tunn. Undergr. Space Technol. 33, 171–185. doi:10.1016/j.tust.2012.10.001
Nedjar, B., and Le Roy, R. (2013). An approach to the modeling of viscoelastic damage. Application to the long-term creep of gypsum rock materials. Int. J. Numer. Anal. Methods Geomech. 37, 1066–1078. doi:10.1002/nag.1138
Olivella, S., and Gens, A. (2002). A constitutive model for crushed salt. Int. J. Numer. Anal. Methods Geomech. 26, 719–746. doi:10.1002/nag.220
Parsapour, D., and Fahimifar, A. (2016). Semi-analytical solution for time-dependent deformations in swelling rocks around circular tunnels. Geosci. J. 20, 517–528. doi:10.1007/s12303-015-0050-1
Pellet, F., and Fabre, G. (2007). Damage evaluation with P-wave velocity measurements during uniaxial compression tests on argillaceous rocks. Int. J. Geomech. 7, 431–436. doi:10.1061/(asce)1532-3641(2007)7:6(431)
Pellet, F., Hajdu, A., Deleruyelle, F., and Besnus, F. (2005). A viscoplastic model including anisotropic damage for the time dependent behaviour of rock. Int. J. Numer. Anal. Methods Geomech. 29, 941–970. doi:10.1002/nag.450
Rahimi, S., and Hosseini, M. (2014). Laboratory studies of creep behavior on thick-walled hollow cylindrical salt rock specimens. Arab. J. Geosci. 8, 5949–5957. doi:10.1007/s12517-014-1622-5
Sterpi, D., and Gioda, G. (2009). ViscoPlastic behaviour around advancing tunnels in squeezing rock. Rock Mech. Rock Eng. 42, 319–339. doi:10.1007/s00603-007-0137-8
Tomanovic, Z. (2006). Rheological model of soft rock creep based on the tests on marl. Mech. Time. Depend. Mat. 10, 135–154. doi:10.1007/s11043-006-9005-2
Keywords: experimental study, creep model, stratified structure, BP neural network, prediction model
Citation: Yang Y, Li Y, Yuan K, Lu Z and Li G (2023) Experimental study on creep failure characteristics of coal mass under multistage stress and construction of prediction model. Front. Earth Sci. 10:1031604. doi: 10.3389/feart.2022.1031604
Received: 30 August 2022; Accepted: 28 September 2022;
Published: 09 January 2023.
Edited by:
Yun Zhang, Xi’an University of Science and Technology, ChinaReviewed by:
Feiyong Wang, China University of Geosciences, ChinaCopyright © 2023 Yang, Li, Yuan, Lu and Li. This is an open-access article distributed under the terms of the Creative Commons Attribution License (CC BY). The use, distribution or reproduction in other forums is permitted, provided the original author(s) and the copyright owner(s) are credited and that the original publication in this journal is cited, in accordance with accepted academic practice. No use, distribution or reproduction is permitted which does not comply with these terms.
*Correspondence: Yanzhong Li, bGl5YW56aG9uZzQxNUAxNjMuY29t
Disclaimer: All claims expressed in this article are solely those of the authors and do not necessarily represent those of their affiliated organizations, or those of the publisher, the editors and the reviewers. Any product that may be evaluated in this article or claim that may be made by its manufacturer is not guaranteed or endorsed by the publisher.
Research integrity at Frontiers
Learn more about the work of our research integrity team to safeguard the quality of each article we publish.