 Su Young Kang1
 Kwang-Hee Kim
 Byungmin Kim
- 1Institute of Geohazard Research, Pusan National University, Busan, Korea
- 2Department of Geological Sciences, Pusan National University, Busan, Korea
- 3School of Earth System Science, Kyungpook National University, Daegu, Korea
- 4Department of Urban and Environmental Engineering, Ulsan National Institute of Science and Technology, Ulsan, Korea
An MW 5.5 earthquake occurred in Pohang, Korea, on 15 November 2017 and caused large damage. In and around the epicentral area the earthquake also remained numerous sand boils, which is a surface representation of soil liquefaction at shallow depth during the earthquake. Soil liquefaction is one of the most dangerous consequences of an earthquake. Here we show that the spatial distribution of the ground vulnerability index (Kg), which we estimate via ambient noise analysis, correlates very well with the distribution of sand boils. Our Kg model based on the dense microtremor surveys at differing geological conditions and urbanizations indicates that only 28.4% of the study area is vulnerable to ground shaking (Kg > 20), with 91.1% of the observed sand boils occurring in these vulnerable areas. We also observed that Kg values estimated in the study correlate well with both VS30 values and geologic units in the study area. This case report confirmed that the Kg can be an affordable supplement to traditional, but expensive and time-consuming, geotechnical/geophysical techniques for the initial screening and regional evaluations. Such a Kg map can assist stakeholders in earthquake-prone regions in identifying areas more susceptible to liquefaction and bring a recommendation to consider seismic hazard mitigation.
1 Introduction
Earthquake-induced soil liquefaction has been considered one of the most destructive consequences of earthquakes since the 1964 moment magnitude (MW) 9.2 Alaska and MW 7.6 Niigata earthquakes (e.g., Youd 1978; Ishihara and Koga 1981), which resulted in massive liquefaction-induced damage including slope failure, bridge and building foundation failure, and the flotation of buried structures. Geotechnical engineers and seismologists have since made great efforts to identify and evaluate the liquefaction potential of a given region and mitigate the damage in areas that are prone to liquefaction. Soil liquefaction occurs when saturated or partially saturated soil loses its strength and behaves more like a viscous liquid than a solid in response to applied stress due to earthquake shaking (e.g., National Academies of Sciences and Engineering, 2016). This phenomenon is most often observed in saturated, uncompacted sandy soils. The occurrence of liquefaction-induced deformation during earthquakes is dependent on the shaking intensity and duration, and the presence of liquefiable sediments (Kramer 1996; Obermeier 2009). Although liquefaction frequently occurs within the epicentral areas of moderate or large earthquakes, it can also happen within the epicentral areas of smaller earthquakes and even at distal sites. This indicates that local conditions play an important role in liquefaction and may significantly lower the necessary earthquake magnitude of the trigger threshold.
Empirical stress-based liquefaction triggering assessment was first proposed by Whitman (1971) and Seed and Idriss Izzat, 1971. This method remains the most commonly used, although it has undergone a series of modifications. Several variants have been proposed on the basis of historical case studies. For example, Youd and Idriss (2001) and Boulanger and Idriss (2007) used standard penetration test N values, Robertson and Wride (1998) and Moss et al. (2006) used cone penetration test measurements, and Andrus and Stokoe (2000) used shear-wave velocities as variants. Each variant has its own assumptions, including associated adjustment factors, empirical correlations, and parametric relationships. Consequently, subjective judgments are required to choose and implement an optimal method among multiple variants, as well as to interpret the results, which may possess considerable uncertainties (National Academies of Sciences and Engineering, 2016). Some of these approaches were already validated using the geotechnical and geophysical data and sand boil inventory in Pohang city. Kim et al. (2021) utilized borehole data in Pohang city to estimate liquefaction potential indices (LPIs) and liquefaction severity numbers (LSNs). Ji et al. (2022) measured shear-wave velocities using the multi-channel analyses of surface waves (MASW) to estimate LPIs in Pohang city due to the Pohang earthquake.
Furthermore, this method is expensive and time-consuming because it requires intensive fieldwork, including drilling. This method is appropriate for the detailed evaluation of site-specific projects, particularly for designing structures and infrastructures. However, it may not be the best option for regional liquefaction evaluations because such borehole data are usually not prevalently available in specific regions. Therefore, some researchers proposed liquefaction geospatial probability models that are not based on geotechnical borehole data. Zhu et al. (2015) developed regional models for Japan and New Zealand, using predictive variables such as peak ground acceleration (PGA), slope-derived average shear wave velocity of the upper 30 m (VS30), compound topographic index (CTI), normalized distance, and distance to a river (dr). Bozzoni et al. (2021) developed a model for Europe, using three variables (i.e., VS30, CTI, and PGA). Note that these studies did not use borehole data such as soil type and unit weight, and used the variables that can be obtained from surficial data and are readily available for most of regions. We also propose the use of ambient noises on the ground surface that can be recorded anytime. While borehole data are still required for the site-specific detailed liquefaction evaluation, the method proposed in this study can be of use for the initial screening for the liquefaction susceptibility analysis and regional liquefaction assessment.
It is well known that the horizontal-to-vertical spectral ratio (HVSR) of ambient noises is strongly correlated with the stiffness of the ground. Numerous researchers have validated relationships between HVSR and shear-wave velocity (e.g., Stephenson 2007; Gallipoli and Mucciarelli 2009; Stanko and Markušić, 2020). The ground vulnerability index (Kg), estimated by the amplification factor and fundamental frequency of the HVSR curve, was further proposed by Nakamura (1996, 1997, 2019 and references therein) to evaluate the risk of soil liquefaction. Recent studies have used Kg to identify sites that are susceptible to strong ground shaking by assessing the correlations between Kg and the distributions of structural damage, liquefaction, and ground amplification effects (or site effects) in regions that have experienced strong ground shaking (e.g., Huang and Tseng 2002; Hardesty et al., 2010; Singh et al., 2017; Farid and Mase 2020; Kang et al., 2021). We also validate the use of HVSR in assessing liquefaction potential based on the case study of the 2017 Pohang earthquake. Furthermore, the method only requires ambient noise, which exists everywhere, thereby making this method a promising and extremely useful approach in field applications.
A moderate earthquake (MW 5.5) occurred in Pohang, Korea, on 15 November 2017, and caused severe damage in the epicentral area. The Bank of Korea (Pohang branch office) estimated economic losses of as much as USD 297 million, including direct (USD 229 million) and indirect (USD 68 million) losses (Kim and Do 2018). This earthquake, which is the second largest Korean earthquake recorded, was the most damaging earthquake in modern Korean history (Ministry of the Ministry of the Interior and Safety, 2018). Various factors contributed to the extensive damage, including the large magnitude of this event, its shallow focal depth (4.3 km), its proximity to highly populated and urbanized areas, site conditions with soft sediments that promote ground amplification, and vulnerable structures. Detailed studies of the cause of this earthquake have suggested that it was induced by fluid injections down to 4–5 km depth by an enhanced geothermal system (e.g., Grigoli et al., 2018; Kim et al., 2018; Geological Society of Korea 2019; Lee et al., 2019; Lee et al., 2022a; Lim et al., 2020).
Sand boils with diverse shapes were observed up to 15 km from the epicenter immediately after the earthquake (Gihm et al., 2018). The earthquakes that cause liquefaction are largely limited to MW > 5.8 events (Brandenberg et al., 2020). Most case studies of earthquake-induced liquefaction are located in plate boundary regions, where large earthquakes frequently occur. These observations indicate that the Pohang earthquake is one of the smallest earthquakes documented to cause liquefaction, and that it is a rare example of earthquake-induced liquefaction in a stable continental environment.
This study analyzes ambient noise via the horizontal-to-vertical spectral ratio (HVSR) technique to estimate Kg. The spatial Kg distributions are compared with the sand boils that were induced by this moderate earthquake. The strong correlation between Kg and the sand boil distribution indicates that this technique is an effective approach for evaluating the liquefaction potential in a given area. The use of ambient noise in this non-invasive technique supplements the methodology to estimate the liquefaction potential at local and regional scales.
2 Seismicity and geological background
The Korean Peninsula has experienced relatively few earthquakes during the instrumental earthquake observation period compared with the neighboring countries of Japan, China, and Taiwan. This low contemporary seismicity and long recurrence interval of damaging earthquakes for the peninsula is typical of an intraplate earthquake setting (Scholz 2002; Gangopadhyay and Talwani 2003). Geodetic observations at continuous global positioning system sites have also revealed a very modest horizontal deformation rate of less than 3 mm/yr in the peninsula (Jin et al., 2006).
Southeastern Korea has experienced more earthquakes than any other part of the peninsula, including two damaging events; i.e., the 2016 Gyeongju and 2017 Pohang earthquakes. This region hosts ∼70% of the South Korean seismicity in the instrumental record (Figure 1A, Korea Meteorological Administration 2022). Historical earthquake studies have also indicated that the Korean Peninsula experienced numerous felt earthquakes during its approximately 1900-year historical record (Chiu and Kim 2004; Lee and Yang 2006; Kyung et al., 2010). Historical and instrumental seismic records indicate that the Pohang area had not previously experienced significant earthquakes despite the relatively high seismicity of the southeastern Korean Peninsula.
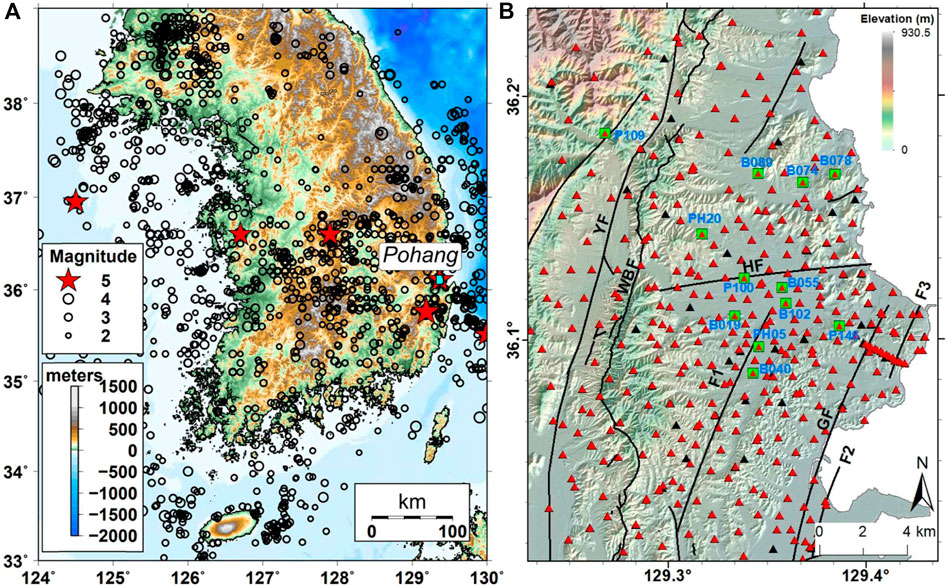
FIGURE 1. Topographic map of the southern Korean Peninsula and distribution of the noise observation sites. (A) Earthquake epicenters between January 1978 and October 2017. ML > 2.0 and ML > 5.0 events are indicated by open circles and red stars, respectively. Open circles for earthquake epicenters are scaled by magnitude. The cyan rectangle in the Pohang area shows the location of the detailed figure in (B). (B) Distribution of the noise observation sites for HVSR analysis in the Pohang area are shown by red triangles. Some stations do not produce reliable result and shown by black triangles. The background image is an elevation map of the area. YF, Yangsan Fault; WBF, western border fault of the Pohang Basin; HF, Heunghae Fault; GF, Gokgang Fault; F1, F2, and F3, unnamed and inferred faults (Song et al., 2015). Green squares indicate the stations whose HVSR curves are presented in Figure 3.
The Pohang earthquake was the most damaging and first induced earthquake in Korea (Grigoli et al., 2018; Kim et al., 2018; Geological Society of Korea 2019; Lee et al., 2019; Woo et al., 2019; Lim et al., 2020). It was induced by five phases of hydraulic stimulation at ∼4.3 km depth between January 2016 and September 2017. The mainshock ruptured a N36E-striking blind fault that dips to the NW at 64°. The spatial and temporal distributions of the aftershocks revealed a complex subsurface fault geometry that consisted of a main fault and four subsidiary segments with diverse orientations, northwestward and southeastward propagations of the rupturing faults, and rupture arrests (Kim et al., 2020; Ree et al., 2021). Although the earthquake was not associated with surface ruptures, numerous sand boils and significant surface deformation have been reported from field surveys (Gihm et al., 2018; Choi et al., 2019; Gahng 2019). Detailed studies of Interferometric Synthetic Aperture Radar observations have estimated a 5 km × 6 km rupture (width × length) with a mean slip of 15 cm and a maximum slip of 25 cm in the northeastern part of the mainshock hypocenter (Song and Lee 2018).
The ground motion’s peak acceleration and the duration recorded at the closest station (PHA2 located ∼10 km from the epicenter) were approximately 0.37 g and 12 s, respectively (Korea Meteorological Administration, 2022). Aftershocks continue in the region and consist predominantly of earthquakes with ML < 3. Residents reported feeling tremors associated with earthquakes as small as magnitude 2.6 on 26 September 2019. Given that feeling earthquakes with such small magnitudes is unusual in Korea, it seems likely that the local site effects (including the thick and soft sedimentary layers at the shallow subsurface) amplified earthquake vibrations and contributed to the felt reports. The spatial distribution of damage to structures and sand boils (Korea Meteorological Administration 2022; Kang et al., 2018; Gihm et al., 2018) in the region also does not follow the assumption that seismic intensity monotonically decreases with distance as seismic energy attenuates along the ray path, which rephrases the significance of site-specific effects.
The study area is located in the Miocene Pohang Basin, southeastern Korea, and bounded to west by the western border faults (WBFs), which are located 2–5 km to the east of the Yangsan Fault, and to east by the East Sea (or Japan Sea; Figure 1B). The Pohang Basin consists of >1-km-thick, non-marine to deep-marine sedimentary strata that were deposited during the early Miocene (Hwang et al., 2021). The Pohang Basin formed as a result of normal faulting of the WBFs and concomitant block subsidence during the opening of the East Sea. The basin fills were mainly fed with sediment from the footwall blocks through six fan-delta systems (Chough et al., 2000). These Miocene basin fills are now unconformably overlain by Quaternary unconsolidated colluvium and alluvium, as well as coastal sediments along the shoreline areas.
3 Methods and data processing
The HVSR technique characterizes the local site effect by analyzing ambient vibrations. HVSR exploits the empirical and ubiquitous observations that the background noise levels of the horizontal seismogram components are consistently higher than the vertical seismogram components at soft ground sites, whereas they are equivalent at hard ground sites. This technique measures the ambient noise using a three-component seismometer and estimates the resonance frequency and corresponding amplification factor from the ratio of the horizontal to vertical components of the Fourier amplitude spectra. HVSR has been successfully employed in a wide range of geological and environmental settings (e.g. Liu et al., 2014; Picotti et al., 2017; Singh et al., 2017; Mase et al., 2020; Singh et al., 2020; Kang et al., 2021; Mase and Sugianto Refrizon, 2021). The advantages of this technique in real-world applications include its low-cost implementation, non-invasive data collection approach, flexible and straightforward instrumentation requirements, relatively short data collection and processing times, and the generation of results that are easily interpreted. Furthermore, HVSR is well-suited for use in a range of environments, including low-seismicity areas, since this technique only requires relatively short noise observations and does not require a seismic source.
The ground motions in response to an earthquake at a given seismic site are proportional to the dynamic strain, such that the fragility of the site under consideration can be expressed as Kg = A2/Fr, where A and Fr are the amplification factor and fundamental frequency estimated by the HVSR technique, respectively (for details, see Nakamura 1997, 2019, 2000; Farid and Mase 2020 and references therein). Kg is therefore an intrinsic index that represents the vulnerability of the ground to earthquake shaking. Here we confirm that Kg correlate with the triggering of liquefaction following an earthquake, whereby a larger Kg value in a given region indicates a higher degree of ground vulnerability and a higher chance of triggering liquefaction.
The most damaging earthquake (MW 5.5) in southeastern Korea over the past century occurred in the city of Pohang on 15 November 2017 (e.g., Kim et al., 2018; Kim et al., 2020). We acquired noise observations from 446 sites where three-component geophones were deployed between January 2018 and December 2020 to construct our Kg model (Figure 1B). Ambient noise measurement was performed by a field equipment of Smart Solo IGU-16HR 3C, which is a compact all-in-one 3-channel sensor and datalogger with onboard GPS timing, and a self-contained power supply. It has a corner frequency of 5 Hz and a 24-bit ADC resolution (DTCC 2022). The duration of noise measurement varies from a couple of hours to 6 months. The all-in-one equipment is buried ∼0.3 m below the surface to ensure a good coupling and to avoid undesirable noises due to meteorological variations including wind and precipitation (Foti et al., 2018; Kang et al., 2020b). The observation times at an individual site varied from a couple of hours to 6 months. We note that the HVSR technique only requires data collected over several tens of minutes to obtain reliable estimates of the fundamental frequency and amplification factors. Some sites did not produce reliable fundamental frequency (F) and/or peak amplification (A) information, but they did provide valuable insights into the Kg assessment since most of these sites were situated on hard-rock sites, where the liquefaction potential is negligible. We selected 354 sites (Figure 1B) for the Kg model based on the selection criteria developed by the SESAME group (SESAME 2004; Chatelain et al., 2008).
Sand blows are surface representations of subsurface liquefaction. The first sand boils since the instrumental observation of earthquakes in Korea were observed in and around the epicentral area of the Pohang MW 5.5 earthquake (Figure 2). The Korea Institute of Geoscience and Mineral Resources undertook a comprehensive field survey, including satellite and drone imagery analyses, to characterize the nature and extent of these sand boils. They identified 597 sand boils, most of which were observed in rice paddies within 3 km of the mainshock epicenter (Gihm et al., 2018). The farthest sand boil was located ∼15 km to the southwest of the epicenter, which is two to ten times further than previous estimates of the maximum distance from the source (Kuribayashi and Tatsuoka 1975; Papadopoulos and Lefkopoulos 1993; Galli 2000). This distal sand boil highlights the importance of local effects in estimating liquefaction hazards. Furthermore, the liquefaction field survey noted several sand boils in residential areas in the southeastern corner of the study area, which is ∼9 km from the epicenter. We therefore compared our Kg distribution with the sand boil inventory compiled by Gihm et al. (2018) to validate the effectiveness of Kg as a proxy for identifying areas that are highly vulnerable to liquefaction.
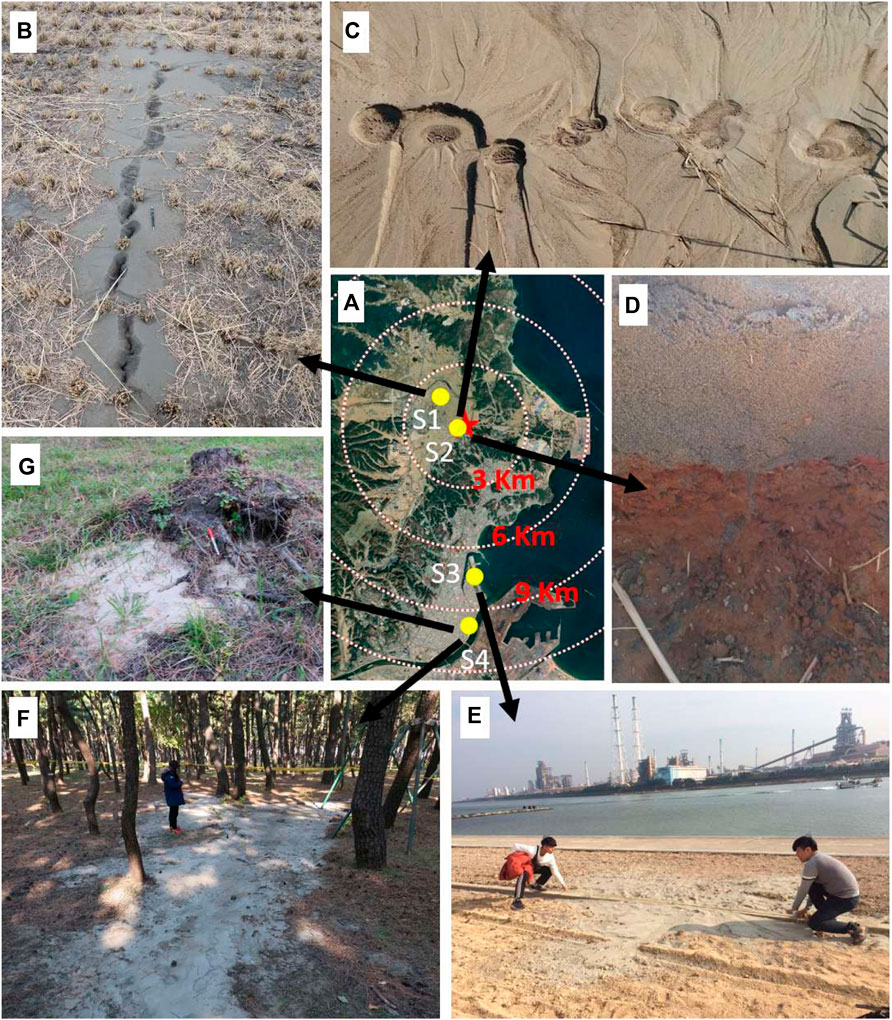
FIGURE 2. Examples of liquefaction following the 2017 MW 5.5 Pohang earthquake. (A) Aerial map showing the selected locations (S1–S4; yellow circles) of the sand boil photographs. The Pohang earthquake epicenter is shown by a red star. White dotted circles represent 3-km distances from the epicenter. (B) Photograph of lateral spreading and sand boils at a rice paddy (site S1) (C,D) Photographs of sand boils, ejected soils, and a cross-sectional view at site S2. Image (C) is approximately 2 m across. (E) Photograph of a sand boil at site S3 (F,G) Photographs of sand boils in a pine forest at site S4.
4 Results
Ninety-two of the 446 HVSR curves were eliminated because they either did not comply with the SESAME standard (SESAME 2004) or did not yield clear F and/or A information. We examined the details of their raw data, HVSR curves, instrumentation, and weather conditions during data acquisition, and excluded their HVSR curves from further analysis and interpretation based on the weather conditions (e.g., heavy rain or high wind speed during data collections) and/or instrument malfunctions due to improper installation (e.g., tilted sensor orientations). Many sites did not produce reliable F or A information because they were located on hard rock exposed to the surface. Although these hard rock sites are ideal for earthquake monitoring, they are not preferred for HVSR analysis. However, such typical HVSR results (i.e., lack of dominant frequency or amplification) provide additional constraints for identifying hard rock sites or thin soil layers. Thus, they provide valuable information for generating the Kg map in this study. Some sites yielded complex HVSR curves. We visited many of those sites more than twice to collect ambient noise data; they consistently produced complex HVSR curves (oscillating peaks, broad peaks, or plateau-like shapes), which may be attributed to either substantial lateral variations in the sedimentary thickness or heterogeneities in the subsurface materials (Guillier et al., 2006).
Three hundred fifty-four sites produced reliable HVSR curves. They, except those from hard rock sites, exhibited one clear peak or multiple peaks (Figure 1B and Figure 3). We picked the resonance frequency at the highest HVSR amplitude of each HVSR curve with a single clear peak. We selected the resonance frequencies and amplitudes of each HVSR curve with multiple peaks based on a priori information, including the local geology, topography, and resonance frequencies at adjacent sites. In many cases, we preferentially chose the spectral peaks at lower frequencies for multiple HVSR peaks. The estimated resonance frequencies were as low as 0.33 Hz, with H/V amplitudes as large as 10.8 (Figure 4).
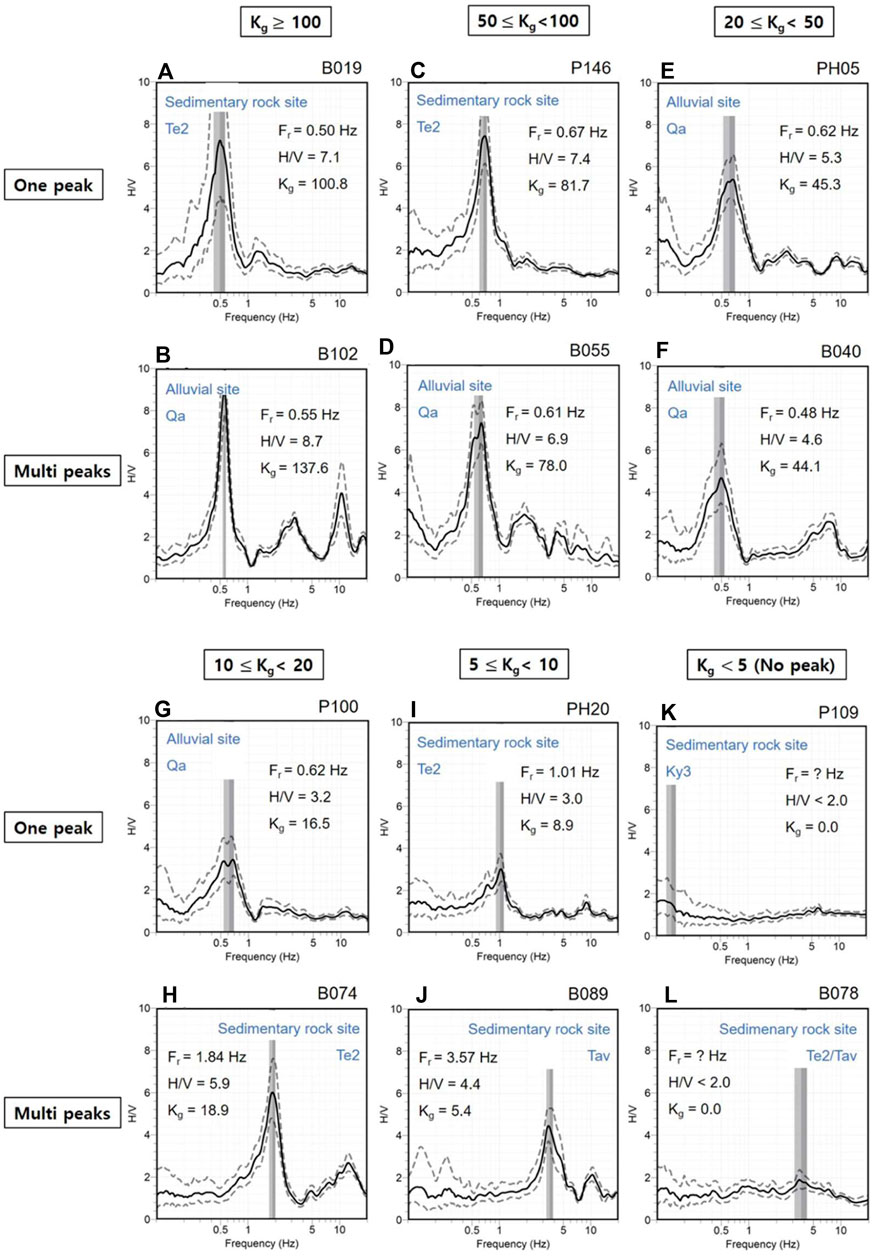
FIGURE 3. Examples of the representative HVSR curves for different geological formations and Kg values. The station name is shown in the upper right corner of each figure. Solid and dotted lines are the average spectral curves and their 1-σ standard deviations, respectively. The fundamental frequency (Fr), which is associated with the amplification factor (H/V) and Kg value, is also shown for each station. The station locations are indicated by the green squares in Figure 1B.
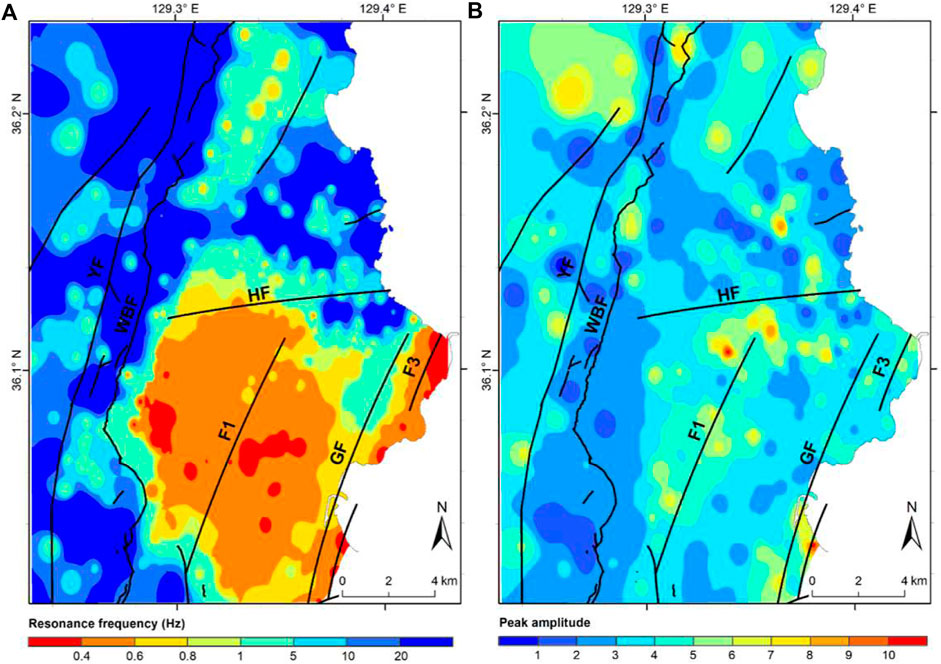
FIGURE 4. (A) Resonance frequency and (B) peak amplitude distributions across the study area. Solid lines indicate major faults. YF, Yangsan Fault; WBF, western border fault of the Pohang Basin; HF, Heunghae Fault; GF, Gokgang Fault; F1, F2, and F3, unnamed and inferred faults.
The HVSR curves from selected sites are shown in Figure 3. The provided examples have been selected to illustrate HVSR curves that possess a clear single peak, multiple peaks, and no peaks from different geological environments that experienced varying degrees of liquefaction. HVSR curves with a single peak or multiple peaks are related to one or more impedance contrasts beneath the observation sites, respectively, with the resonance frequencies possessing lower H/V amplitudes representing minor impedance contrasts. A given site with no discernable HVSR peak is indicative of very weak impedance contrasts beneath the site (e.g., Kang et al., 2020a; Singh et al., 2020). We note that the HVSR curves at liquefaction sites (Figures 3B,D–F) have relatively low (0.48–0.62 Hz) resonance frequencies and high (4.6–8.7) corresponding H/V amplitudes in the provided examples, which may be due these measurements being taken from Quaternary alluvial sites.
The Kg model (Figure 5) that is proposed in this study is based on the resonance frequency and amplification estimates of the noise observations from 354 sites using the HVSR technique. Kg varies as large as 301, and the model provides insight into the ground vulnerability at a high resolution. The model reveals that 55.1% of the study area possesses Kg values that are <10. The western third of the study area possesses low Kg values, as do the coastal areas in the northeast. The areas with low Kg values are characterized by either hard rocks or very thin soil layers. Kg values of >20 span 28.4% of the study area. Kg values as high as 100 are observed in the Heunghae area, near the epicenter of the Pohang earthquake, which is largely underlain by >200 m of unconsolidated Quaternary sediments (Kang et al., 2020a). The southeastern corner of the study area, which is far from the epicenter, also exhibits very high Kg values (>50).
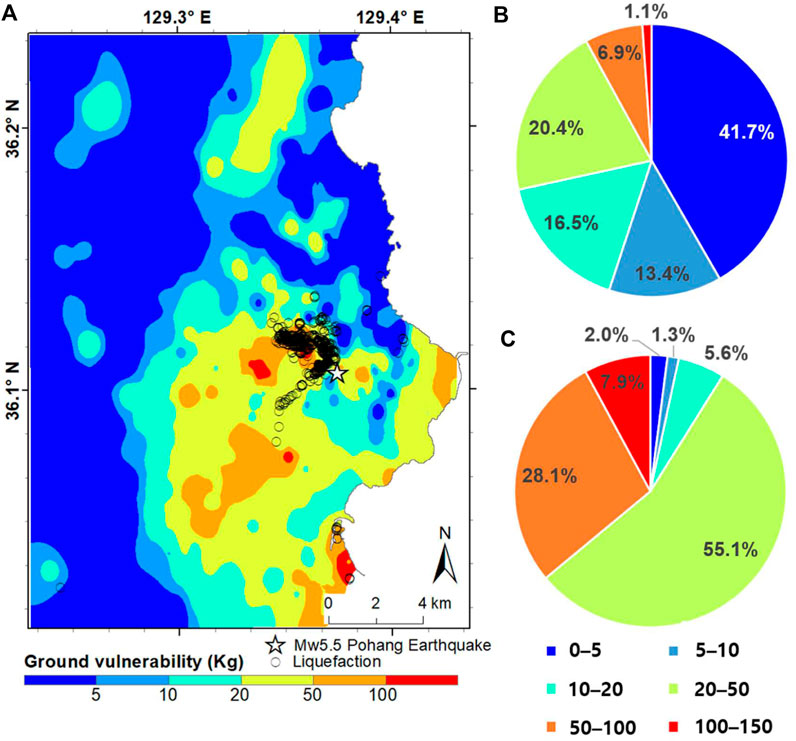
FIGURE 5. Soil vulnerability index (Kg) model for the Pohang area. (A) The locations of 597 sand boils are shown on the Kg model as circles. (B) Pie chart of the areal Kg composition. (C) Pie chart of the Kg composition of the sand boils. Approximately 91.1% of the sand boils occurred in areas with Kg > 20.
5 Discussions
A comparison of the sand boil sites and our vulnerability model highlights that 91.1% of the sand boils occurred in areas with high Kg values (>20), and that they were not limited to the epicentral area. Many sand boils also occurred in a heavily urbanized area in the southeastern corner of the study area and possessed Kg values of >50, which is defined as an isolated and highly vulnerable area on our Kg map. Our study suggests that Kg is a valuable parameter for assessing the ground vulnerability in a given area since our Kg values successfully identified the liquefaction sites in both rural and urban settings. Our study also shows that the HVSR technique only requires background noise and is applicable in areas where large earthquakes are infrequent.
The liquefaction following the Pohang earthquake provides a unique opportunity to study and characterize the liquefaction that results from an induced earthquake. Liquefaction case studies associated with MW < 5.5 earthquakes are rare. The smallest earthquake known to cause surface manifestations of liquefaction (i.e., sand boils) was a March 1991 local magnitude (ML) 4.6 aftershock following the 1989 MW 6.9 Loma Prieta earthquake, with the sand boils that occurred during the March 1991 earthquake erupting through pre-existing vents (Sims and Garvin 1995). It is highly likely that no surface manifestations would have occurred without these pre-existing pathways. The smallest documented mainshock to have triggered liquefaction is a M ∼ 5.0 event (National Academies of Sciences and Engineering, 2016; Green and Bommer 2019). Most of the earthquakes in the liquefaction case study database are M > 5.8 events (Brandenberg et al., 2020), which makes the Pohang earthquake one of the smallest documented earthquakes to cause liquefaction.
The liquefaction database mainly includes case studies from plate boundary settings (National Academies of Sciences and Engineering, 2016), with very few case studies from earthquakes in stable continental regions. The earthquake motions in stable continental settings are expected to be higher in amplitude, shorter in duration, and characterized by higher frequencies than those occurring near plate boundaries since the bedrock in stable continental settings is denser, cooler, and less fractured than that in plate boundary settings (National Academies of Sciences and Engineering, 2016). The ability to trigger liquefaction in regions with stable continental crust may require different behaviors to those in plate boundaries settings. The extremely low frequency of earthquakes causing liquefaction in stable continental regions compared to that in plate boundary settings indicates that the number of case studies in stable continental regions will remain limited. This issue therefore adds to the importance of our case study and its applicability to liquefaction potential assessments in intraplate regions.
Lee et al. (2022b) generated a time-averaged shear-wave velocity map for the upper 30-m soil deposits (VS30) across Pohang based on VS30 values that were estimated via the compressional-wave seismogram method and multi-channel analysis of surface waves (MASW). We compared these VS30 estimates and measurements with our Kg values, as shown in Figure 6, and observed that Kg generally decreased with increasing VS30. This demonstrates that the Kg values estimated by the ambient noises can represent the subsurface site conditions. Note that the scatters in this comparison are attributed to the indirect estimation of VS30 values, as opposed to measurements through direct tests such as downhole test, cross-hole test, and ps logging test. Furthermore, these scatters could be induced by the complex basin structure as can be guessed by the Kg map shown in Figure 5. Figure 7 shows the geologic unit distributions (KIGAM 2020) of the Kg sites for 4 Kg intervals. The locations with Kg values less than 20 are distributed across various geologic units, including Cretaceous granites and Quaternary deposits, with a concentration of Kg sites in Tertiary volcanic and sedimentary rocks. The locations with Kg values between 20 and 50 are found primarily in Tertiary and Quaternary deposits, and those with Kg values greater than 100 are found only in Tertiary sedimentary or Quaternary unconsolidated deposits, which are considered highly vulnerable to liquefaction. Note that the shear-wave velocity and geology affect the liquefaction occurrence. These two comparisons (i.e., Kg vs VS30 and geology) validate the Kg estimates that were obtained in this study.
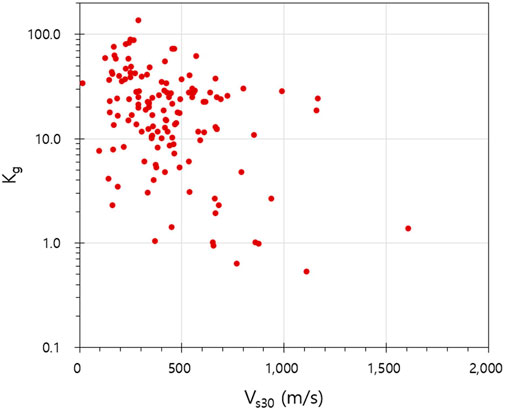
FIGURE 6. Estimated Kg values versus the VS30 values that were estimated and measured by Lee et al. (2022b).
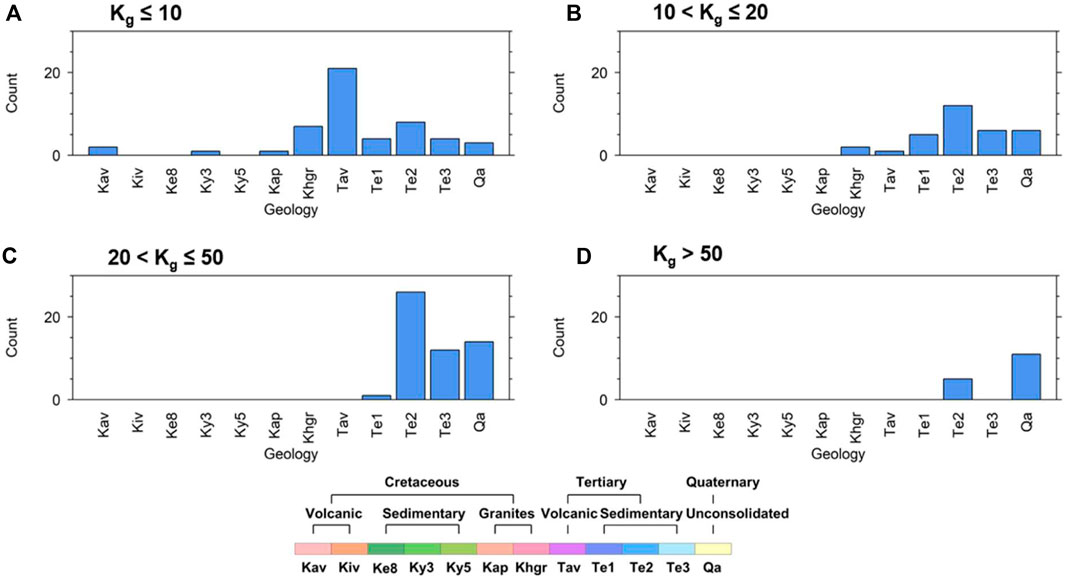
FIGURE 7. Geologic unit distributions (KIGAM 2020) of the Kg sites for 4 Kg intervals.
A few sites with high Kg values in our model have also been investigated using common geotechnical approaches, namely the liquefaction potential index and liquefaction severity number, to assess the liquefaction potential (Kim et al., 2021). Although the results of these studies are comparable to our model results, they have restricted spatial coverage that is limited to the immediate vicinity of each borehole. Furthermore, such data acquisition is expensive and difficult to perform in densely urbanized areas. This highlights the benefit of using Kg to estimate the ground vulnerability, as ambient noise exists everywhere, data acquisition is simple and inexpensive, and the data processing and interpretation are intuitive.
We note that discretion is required when employing the HVSR technique. Our review of the literature has revealed that the Kg threshold for triggering liquefaction varies over a wide range and may be as low as 5 (Choobbasti et al., 2015). However, all of the case studies we reviewed exhibited positive correlations between Kg and liquefaction, with an increase in the number of sand boils at sites possessing higher Kg values (e.g., Huang and Tseng 2002; Herrera et al., 2018; Kusumawardani et al., 2019; Yulianur et al., 2020; Arango-Serna et al., 2021). This correlation even holds for the case study of the historic 1811–1812 New Madrid earthquake sequence (Hardesty et al., 2010). Some HVSR curves exhibit multiple peaks, whereby the minor peaks can be correlated with the stratigraphic boundaries of lower impedance contrasts in the subsurface. However, information on these stratigraphic boundaries and their contributions to the HVSR peaks is lacking. Furthermore, our HVSR analysis and interpretation, and its application for ground vulnerability are limited to the fundamental peaks and their corresponding amplitudes of the HVSR curves, such that any contributions from other peaks require further investigation. Additional studies that capture the positive correlations between Kg and liquefaction under various geologic and tectonic settings are also needed to better elucidate the liquefaction potential in a given region.
6 Conclusion
We applied the HVSR method to obtain a ground vulnerability (Kg) map using observed resonance frequencies and peak amplification factors from 354 sites in Pohang, Korea, with large lateral variations observed across the study area. A comparison of this ground vulnerability map with the sand boil distributions during the 2017 MW 5.5 Pohang earthquake indicated that the observed liquefaction occurred mainly in areas where Kg > 20, with 5.6% of the confirmed sand boils occurring in areas with Kg values between 10 and 20. An additional encouraging observation was the occurrence of sand boils in distal areas where Kg > 20. A further comparison of the Kg distribution with the local geology and VS30 highlighted that the observed liquefaction occurred mainly in unconsolidated sediments, and that there appeared to be an inverse correlation between Kg and VS30. Therefore, this study demonstrates a potential solution using this rare case study of liquefaction following a relatively low-magnitude induced intraplate earthquake. National and local authorities could adopt this information for improved mitigation of earthquake risk, as this approach does not require constraints on the seismic source. This study highlights the merit of implementing an affordable approach to identify and map areas that are vulnerable to ground shaking-induced liquefaction, and of focusing on developed or developing urban areas that possess the greatest liquefaction potential.
Data availability statement
The original contributions presented in the study are included in the article/supplementary material, further inquiries can be directed to the corresponding author.
Author contributions
SK applied the methodology and drafted the manuscript. SK and K-HK revised the paper and supervised the study. SK, YG, and BK collected and analysed ambient noise, liquefaction, and VS30 data for the study. SK, K-HK, YG, and BK provided suggestions on results and interpretations. All authors contributed to the article and approved the submitted version.
Funding
This work was supported by the Korea Meteorological Administration (KMA) Research Development Program under Grant KMI 2022-00910 and the Basic Science Research Program through the National Research Foundation of Korea (NRF) funded by the Ministry of Education (NRF-2020R1I1A1A01053989).
Acknowledgments
We thank the editor and reviewers for their careful and constructive reviews. We also thank the Geopsy group for providing their software package for the study.
Conflict of interest
The authors declare that the research was conducted in the absence of any commercial or financial relationships that could be construed as a potential conflict of interest.
Publisher’s note
All claims expressed in this article are solely those of the authors and do not necessarily represent those of their affiliated organizations, or those of the publisher, the editors and the reviewers. Any product that may be evaluated in this article, or claim that may be made by its manufacturer, is not guaranteed or endorsed by the publisher.
References
Andrus, R. D., and Stokoe II, K. H. (2000). Liquefaction resistance of soils from shear-wave velocity. J. Geotech. Geoenviron. Eng. 126126 (11), 101511–111025. doi:10.1061/(asce)1090-0241(2000)126:11(1015)
Arango-Serna, S., Herrera, M., Cruz, A., Sandoval, E., Thomson, P., and Ledezma, C. (2021). Use of ambient noise records in seismic engineering: An approach to identify potentially liquefiable sites. Soil Dyn. Earthq. Eng. 148, 106837. doi:10.1016/j.soildyn.2021.106837
Boulanger, R. W., and Idriss, I. (2007). Evaluation of cyclic softening in silts and clays. J. Geotech. Geoenviron. Eng. 133 (6), 6416–6452. doi:10.1061/(asce)1090-0241(2007)133:6(641)
Bozzoni, F., Bonì, R., Conca, D., Lai, C. G., Zuccolo, E., and Meisina, C. (2021). Megazonation of earthquake-induced soil liquefaction hazard in continental Europe. Bull. Earthq. Eng. 19, 4059–4082. doi:10.1007/s10518-020-01008-6
Brandenberg, S. J., Zimmaro, P., Stewart, J. P., Kwak, D. Y., Franke, K. W., and Moss, R. E. S., fnm 2020. Next-generation liquefaction database. Earthq. Spectra. 36:939–959, doi:10.1177/8755293020902477
Chatelain, J-L., Guillier, B., Cara, F., Duval, A-M., Atakan, K., and Bard, P-Y., and The WP02 SESAME team (2008). Evaluation of the influence of experimental conditions on H/V results from ambient noise recordings. Bull. Earthq. Eng. 6, 33–74. doi:10.1007/s10518-007-9040-7
Chiu, J-M., and Kim, S. G. (2004). Estimation of regional seismic hazard in the Korean Peninsula using historical earthquake data between A.D. 2 and 1995. Bull. Seismol. Soc. Am 94, 269–284. doi:10.1785/0120010256
Choi, J-H., Ko, K., Gihm, Y. S., Cho, C. S., Lee, H., and Song, S. G., (2019). Surface deformation and rupture processes associated with the 2017 MW 5.4 Pohang, Korea, earthquake. Bull. Seismol. Soc. Am. 109, 756–769. doi:10.1785/0120180167
Choobbasti, A. J., Naghizadehrokni, M., and Rezaei, S. (2015). Liquefaction assessment by microtremor measurements in Babol city. Fifth International Conference on Geotechnique, Construction Materials and Environment, Osaka, Japan.
Chough, S. K., Kwon, S-T., Ree, J-H., and Choi, D. K. (2000). Tectonic and sedimentary evolution of the Korean peninsula: A review and new view. Earth. Sci. Rev. 52, 175–235. doi:10.1016/s0012-8252(00)00029-5
DTCC (2022). IGU-16HR 3C technical specifications. Available from https://smartsolo.com/wp-content/uploads/2020/07/smartsolo-igu-16hr-3c_en-brochure.pdf.
National Academies of SciencesEngineering, Medicine (2016). State of the art and practice in the assessment of earthquake-induced soil liquefaction and its consequences. Washington, DC: The National Academies Press.
Farid, M., and Mase, L. Z. (2005). Implementation of seismic hazard mitigation on the basis of ground shear strain indicator for spatial plan of Bengkulu city, Indonesia. GEOMATE J. 18, 199–207. doi:10.21660/2020.69.24759
Foti, S., Hollender, F., Garofalo, F., Albarello, D., Asten, M., and Bard, P-Y., (2018). Guidelines for the good practice of surface wave analysis: A product of the InterPACIFIC project. Bull. Earthq. Eng. 16, 2367–2420. doi:10.1007/s10518-017-0206-7
Gahng, G. (2019). Characteristics of liquefaction phenomena induced by 2017. 11. 15 Pohang earthquake Pusan. Busan: Pusan National University.
Galli, P. (2000). New empirical relationships between magnitude and distance for liquefaction. Tectonophysics 324, 169–187. doi:10.1016/s0040-1951(00)00118-9
Gallipoli, M. R., and Mucciarelli, M. (2009). Comparison of site classification from VS30, VS10, and HVSR in Italy. Bull. Seismol. Soc. Am. 99, 340–351. doi:10.1785/0120080083
Gangopadhyay, A., and Talwani, P. (2003). Symptomatic features of intraplate earthquakes. Seismol. Res. Lett. 74, 863–883. doi:10.1785/gssrl.74.6.863
Geological Society of Korea (2019). Summary report of the Korean Government Commission on relations between the 2017 Pohang earthquake and EGS project. Seoul: Geological Society of Korea.
Gihm, Y. S., Kim, S. W., Ko, K., Choi, J-H., Bae, H., and Hong, P. S., (2018). Paleoseismological implications of liquefaction-induced structures caused by the 2017 Pohang Earthquake. Geosci. J 22, 871–880. doi:10.1007/s12303-018-0051-y
Green, R. A., and Bommer, J. J. (2019). What is the smallest earthquake magnitude that needs to be considered in assessing liquefaction hazard? Earthq. Spectra 35, 1441–1464. doi:10.1193/032218eqs064m
Grigoli, F., Cesca, S., Rinaldi, A. P., Manconi, A., López-Camino, J. A., and Clinton, J. F., (2018). The november 2017 MW 5.5 Pohang earthquake: A possible case of induced seismicity in South Korea. Science 360, 1003–1006. doi:10.1126/science.aat2010
Guillier, B., Cornou, C., Kristek, J., Moczo, P., Bonnefoy-Claudet, S., and Bard, P-Y. (2006), Simulation of seismic ambient vibrations: Does the H/V provide quantitative information in 2D-3D structures?, (30 August–1 September 2006). Proceedings of the third international symposium on the effects of surface geology on seismic motion.
Hardesty, K., Wolf, L. W., and Bodin, P. (2010). Noise to signal: A microtremor study at liquefaction sites in the new Madrid seismic zone. Geophysics 75, B83–B90. doi:10.1190/1.3374357
Herrera, M., Arango, S., Cruz, A., Sandoval, E., and Thomson, P. (2018). Assessment of Nakamura methodology for evaluating soil liquefaction potential. Geotechnical Earthquake Engineering and Soil Dynamics V. Austin, TX.
Huang, H-C., and Tseng, Y-S. (2002). Characteristics of soil liquefaction using H/V of microtremors in Yuan-Lin area, Taiwan. Terr. Atmos. Ocean. Sci. 13, 325–338. doi:10.3319/tao.2002.13.3.325(cce)
Hwang, I. G., Son, J., and Cho, S. (2021). Event stratigraphy of Yeonil Group, Pohang Basin: Based on correlation of 21 deep cores and outcrop sections. jgsk. 57, 649–678. doi:10.14770/jgsk.2021.57.5.649
Ishihara, K., and Koga, Y. (1981). Case studies of liquefaction in the 1964 Niigata earthquake. Soils Found. 21, 35–52. doi:10.3208/sandf1972.21.3_35
Ji, Y., Seo, H., Kang, S., Kim, H-S., Kim, J., and Kim, B. (2022). MASW-Based shear wave velocities for predicting liquefaction-induced sand boils caused by the 2017 M5.4 Pohang, South Korea earthquake. J. Geotech. Geoenviron. Eng 148, 04022004. doi:10.1061/(asce)gt.1943-5606.0002738
Jin, S., Li, Z. C., and Park, P-H. (2006). Seismicity and GPS constraints on crustal deformation in the southern part of the Korean Peninsula. Geosci. J 10, 491–497. doi:10.1007/bf02910442
Kang, S. Y., Kim, K-H., Chiu, J-M., and Liu, L. (2020a). Microtremor HVSR analysis of heterogeneous shallow sedimentary structures at Pohang, South Korea. J. Geophys. Eng. 15 (5), 861–869. doi:10.1093/jge/gxaa035
Kang, S. Y., Kim, K-H., Choi, M., and Park, S-C. (2021). Ground vulnerability derived from the horizontal-to-vertical spectral ratio: Comparison with the damage distribution caused by the 2017 ML 5.4 Pohang earthquake, Korea. Near Surf. Geophys. 19, 155–167. doi:10.1002/nsg.12150
Kang, S. Y., Kim, K-H., Kim, D., Jeon, B-U., and Lee, J-W. (2020b). Effects of meteorological variations and sensor burial depths on HVSR analysis. J. Korean Earth Sci. Soc. 41, 658–669. doi:10.5467/jkess.2020.41.6.658
KIGAM (2020). Geological map of Korea (1:250,000). Multiplatform geoscience information system, Available at: http://mgeo.kigam.re.kr, (accessed August 28, 2020).
Kim, H-S., Kim, M., Baise, L. G., and Kim, B. (2021). Local and regional evaluation of liquefaction potential index and liquefaction severity number for liquefaction-induced sand boils in Pohang, South Korea. Soil Dyn. Earthq. Eng. 141, 106459. doi:10.1016/j.soildyn.2020.106459
Kim, J. H., and Do, Y. W. (2018). Estimation of economic impact and policy implications of the Pohang earthquake. Pohang: Bank of Korea.
Kim, K-H., Ree, J-H., Kim, Y., Kim, S., Kang, S. Y., and Seo, W. (2018). Assessing whether the 2017 ML 5.4 Pohang earthquake in South Korea was an induced event. Science 360, 1007–1009. doi:10.1126/science.aat6081
Kim, K-H., Seo, W., Han, J., Kwon, J., Kang, S. Y., and Ree, J-H., (2020). The 2017 ML 5.4 Pohang earthquake sequence, Korea, recorded by a dense seismic network. Tectonophysics 774, 228306. doi:10.1016/j.tecto.2019.228306
Korea Meteorological Administration (2022). List of earthquakes in Korea. Available from https://www.weather.go.kr/weather/earthquake_volcano/domesticlist.jsp.
Kramer, S. L. (1996). Geotechnical earthquake engineering upper. Saddle River, New Jersey, USA: Prentice-Hall.
Kuribayashi, E., and Tatsuoka, F. (1975). Brief review of liquefaction during earthquakes in Japan. Soils Found. 15, 81–92. doi:10.3208/sandf1972.15.4_81
Kusumawardani, R., Nugroho, U., Handayani, S., and Fananda, M. A. (1906/01). The analysis of liquefaction phenomenon of the flexible pavement using seismic monitoring equipment. IIUM Eng. J. 20, 70–78. doi:10.31436/iiumej.v20i1.1031
Kyung, J. B., Jung, M. K., Baek, J. J., Im, Y. J., and Lee, K. (2010). Historic earthquake catalog in the Korea peninsula. Seoul: Korea Meteorological Administration.
Lee, C-H., Park, J-H., Kim, S-Y., Kim, D-K., and Jun, S-C. (2022a). Structural damage potentials and design implications of 2016 Gyeongju and 2017 Pohang earthquakes in Korea. Earthquakes Struct. 22, 305–318.
Lee, J., Kim, K-H., Kang, S. Y., Son, M., and Kim, B. (2022b). Shear-wave velocity map for Pohang Basin, South Korea, based on the P-wave seismogram method. Earthq. Spectra 38, 2162–2182. doi:10.1177/87552930221076532
Lee, K., and Yang, W-S. (2006). Historical seismicity of Korea. Bull. Seismol. Soc. Am. 96, 846–855. doi:10.1785/0120050050
Lee, K-K., Ellsworth, W. L., Giardini, D., Townend, J., Ge, S., and Shimamoto, T., (2019). Managing injection-induced seismic risks. Science 364, 730–732. doi:10.1126/science.aax1878
Lim, H., Deng, K., Kim, Y. H., Ree, J. H., Song, T. R. A., and Kim, K-H. (2020). The 2017 MW 5.5 Pohang earthquake, South Korea, and poroelastic stress changes associated with fluid injection. J. Geophys. Res. Solid Earth 125, e2019JB019134. doi:10.1029/2019jb019134
Liu, L., Chen, Q-F., Wang, W., and Rohrbach, E. (2014). Ambient noise as the new source for urban engineering seismology and earthquake engineering: A case study from beijing metropolitan area. Earthq. Sci. 27, 89–100. doi:10.1007/s11589-013-0052-x
Mase, L. Z., Likitlersuang, S., Tobita, T., Chaiprakaikeow, S., and Soralump, S. (2020). Local site investigation of liquefied soils caused by earthquake in northern Thailand. J. Earthq. Eng. 24, 1181–1204. doi:10.1080/13632469.2018.1469441
Mase, L. Z., and Sugianto Refrizon, N. (2021). Seismic hazard microzonation of Bengkulu city, Indonesia. Geoenvironmental Disasters 8, 5. doi:10.1186/s40677-021-00178-y
Moss, R., Seed, R. B., Kayen, R. E., Stewart, J. P., Der Kiureghian, A., and Cetin, K. O. (2006). CPT-based probabilistic and deterministic assessment of in situ seismic soil liquefaction potential. J. Geotech. Geoenviron. Eng. 132132 (8), 10328–10351. doi:10.1061/(asce)1090-0241(2006)132:8(1032)
Nakamura, Y. (2000), Clear identification of fundamental idea of Nakamura's technique and its applications. Proceedings of the 12thWorld conference on earthquake and engineering.
Nakamura, Y. (1996). Research and development of intelligent earth-quake disaster prevention systems UrEDAS and HERAS. Proceeding of Japan Society of Civil Engineers (Doboku Gakkai Ronbunshu). doi:10.2208/JSCEJ.1996.531_1
Nakamura, Y. (1997). Seismic vulnerability indices for ground and structures using microtremor. Florence: World Congress on Railway Research.
Nakamura, Y. (2019). What is the Nakamura method? Seismol. Res. Lett. 90, 1437–1443. doi:10.1785/0220180376
Obermeier, S. F. (2009). “Chapter 7 Using liquefaction-induced and other soft-sediment features for paleoseismic analysis,” in International geophysics (Academic Press), 497–564. doi:10.1016/s0074-6142(09)95007-0
Papadopoulos, G. A., and Lefkopoulos, G. (1993). Magnitude-distance relations for liquefaction in soil from earthquakes. Bull. Seismol. Soc. Am. 83, 925–938. doi:10.1785/BSSA0830030925
Picotti, S., Francese, R., Giorgi, M., Pettenati, F., and Carcione, J. M. (2017). Estimation of glacier thicknesses and basal properties using the horizontal-to-vertical component spectral ratio (HVSR) technique from passive seismic data. J. Glaciol 63, 229–248. doi:10.1017/jog.2016.135
Ree, J-H., Kim, K-H., Lim, H., Seo, W., Kim, S., and An, X., (2021). Fault reactivation and propagation during the 2017 Pohang earthquake sequence. Geothermics 92, 102048. doi:10.1016/j.geothermics.2021.102048
Robertson, P., and Wride, C. (1998). Evaluating cyclic liquefaction potential using the cone penetration test. Can. Geotech. J. 35 (3), 442–459. doi:10.1139/t98-017
Scholz, C. H. (2002). The mechanics of earthquakes and faulting. 2 ed. Cambridge, United Kingdom: Cambridge University Press.
Seed, H. B., and Idriss Izzat, M. (1971). Simplified procedure for evaluating soil liquefaction potential. J. Soil Mech. Found. Div. 97, 1249–1273. doi:10.1061/jsfeaq.0001662
SESAME (2004). Guidelines for the implementation of the H/V spectral ratio technique on ambient vibrations measurements, processing and interpretation. SESAME. ECRG Directorate. (Project No. EVG1-CT-2000-00026 SESAME.
Sims, J. D., and Garvin, C. D. (1995). Recurrent liquefaction induced by the 1989 Loma Prieta earthquake and 1990 and 1991 aftershocks: Implications for paleoseismicity studies. Bull. Seismol. Soc. Am. 85, 51–65.
Singh, A. P., Sairam, B., Pancholi, V., Chopra, S., and Kumar, M. R. (2020). Delineation of thickness of intrabasaltic rocks beneath the Deccan Volcanic province of Western India through microtremor analysis. Soil Dyn. Earthq. Eng. 138, 106348. doi:10.1016/j.soildyn.2020.106348
Singh, A. P., Shukla, A., Kumar, M. R., and Thakkar, M. G. (2017). Characterizing surface geology, liquefaction potential, and maximum intensity in the Kachchh seismic zone, Western India, through microtremor analysis. Bull. Seismol. Soc. Am. 107, 1277–1292. doi:10.1785/0120160264
Song, C. W., Son, M., Sohn, Y. K., Han, R., Shinn, Y. J., and Kim, J-C. (2015). A study on potential geologic facility sites for carbon dioxide storage in the Miocene Pohang Basin, SE Korea. jgsk. 51, 53–66. doi:10.14770/jgsk.2015.51.1.53
Song, S. G., and Lee, H. (2018). Static slip model of the 2017 MW 5.4 Pohang, South Korea, earthquake constrained by the InSAR data. Seismol. Res. Lett. 90, 140–148. doi:10.1785/0220180156
Stanko, D., and Markušić, S. (2020). An empirical relationship between resonance frequency, bedrock depth and VS30 for Croatia based on HVSR forward modelling. Nat. Hazards (Dordr). 103, 3715–3743. doi:10.1007/s11069-020-04152-z
Stephenson, W. R. (2007). HVSR, SSR, and VS30 values at three New Zealand Basin arrays. J. Earthq. Eng. 11, 987–1009. doi:10.1080/13632460701385358
Whitman, R. V. (1971). Resistance of soil to liquefaction and settlement. Soils Found. 11, 59–68. doi:10.3208/sandf1960.11.4_59
Woo, J-U., Kim, M., Sheen, D-H., Kang, T-S., Rhie, J., and Grigoli, F., (2019). An in-depth seismological analysis revealing a causal link between the 2017 MW 5.5 Pohang earthquake and EGS project. J. Geophys. Res. Solid Earth 124, 13060–13078. doi:10.1029/2019jb018368
Youd, T. L. (1978). Major cause of earthquake damage is ground failure, 48. Civil Engineering-American Society of Civil Engineers, 47–51.
Youd, T. L., and Idriss, I. M. (2001). Liquefaction resistance of soils: Summary report from the 1996 NCEER and 1998 NCEER/NSF workshops on evaluation of liquefaction resistance of soils. J. Geotech. Geoenviron. Eng. 127 (4), 2974–3313. doi:10.1061/(asce)1090-0241(2001)127:4(297)
Yulianur, A., Saidi, T., Setiawan, B., Sugianto, S., and Rusdi, M. (2020). Microtremor measurement at liquefaction-induced ground deformation area. J. Eng. Sci. Technol. 15, 2871–2889.
Keywords: earthquakes, soil liquefaction, seismic hazard, ground vulnerability, horizontal-to-vertical spectral ratio
Citation: Kang SY, Kim K-H, Gihm YS and Kim B (2022) Soil liquefaction potential assessment using ambient noise: A case study in Pohang, Korea. Front. Earth Sci. 10:1029996. doi: 10.3389/feart.2022.1029996
Received: 28 August 2022; Accepted: 26 October 2022;
Published: 10 November 2022.
Edited by:
Yih-Min Wu, National Taiwan University, TaiwanReviewed by:
Lindung Zalbuin Mase, University of Bengkulu, IndonesiaJyun-Yan Huang, National Center for Research on Earthquake Engineering, Taiwan
Copyright © 2022 Kang, Kim, Gihm and Kim. This is an open-access article distributed under the terms of the Creative Commons Attribution License (CC BY). The use, distribution or reproduction in other forums is permitted, provided the original author(s) and the copyright owner(s) are credited and that the original publication in this journal is cited, in accordance with accepted academic practice. No use, distribution or reproduction is permitted which does not comply with these terms.
*Correspondence: Kwang-Hee Kim, a3dhbmdoZWVAcHVzYW4uYWMua3I=