 Haimeng Liu
 Lu Xing
 Chengxin Wang4
 Haiyan Zhang
94% of researchers rate our articles as excellent or good
Learn more about the work of our research integrity team to safeguard the quality of each article we publish.
Find out more
ORIGINAL RESEARCH article
Front. Earth Sci., 07 October 2022
Sec. Geoscience and Society
Volume 10 - 2022 | https://doi.org/10.3389/feart.2022.1025787
This article is part of the Research TopicLand use/cover changes and ecosystems: coupling human and nature systems for sustainabilityView all 7 articles
The sustainability of coupled human and natural systems (CHANS), linked to several of the United Nation’s Sustainable Development Goals, affects both global sustainable development and human wellbeing. However, few studies have explored the relationship between the whole human system and the natural system from the perspective of supply and demand. Based on ecosystem service concept and Maslow’s hierarchy of needs, we constructed an ecosystem services supply index (ESSI) and a human demand index (HMDI) and then analyzed the spatial mismatch of the ESSI and HMDI in 338 prefecture cities in China. We propose a supply-demand balance index inspired by the doughnut theory and demonstrate the conflicts and synergies between ecosystems and human systems. Our results show that the ESSI decreased from 2000 to 2010, but remained almost unchanged from 2010 to 2020. The low ESSI values were mainly distributed over the North China Plain, the Yangtze River Delta, and the Sichuan Basin. The HMDI increased from 2000 to 2020, but the rate of increase has slowed since 2010. The high HMDI values were mainly distributed over the east coast of China, Inner Mongolia, and part of Xinjiang province. From 2000 to 2020, the cities with spatial mismatches of the ESSI and HMDI showed a significant increase and spatial agglomeration. The sustainability of most regions showed a decreasing trend, and the higher the value of the supply-demand balance index, the faster the speed of decrease. Overall, there were more regions in a state of conflict between the natural ecosystem and humans than in a synergistic state, although this number has decreased since 2010. Urban agglomerations and western regions should receive more attention for their ecological health. This study provides a new methodology to assess the sustainability of CHANS that could be applied to other locations. Our findings could support the Chinese government in regional ecosystem governance and territorial space planning.
Harmony between humans and nature is at the core of the sustainable development of human societies (Giddings et al., 2002; Fang et al., 2020). Many ancient civilizations and city states failed because they did not find a good balance between human activities and natural ecology (Diamond, 2005; Degroot et al., 2021). The industrial revolution in the late 18th century accelerated the effects of humans on the natural world. The destruction and occupation of the eco-environment by humans have increased exponentially since the middle of the 20th century (Steffen et al., 2015a). Some planetary boundaries have been exceeded in terms of biodiversity, climate change and nitrogen cycles (Steffen et al., 2015b). Many researchers now believe that the Earth has entered the Anthropocene (Waters et al., 2016; Folke et al., 2021). Changing human–nature conflicts into more synergistic relationships is essential for global sustainable development. The Stockholm Declaration on the Human Environment adopted by the United Nations in 1972 was a landmark event. Since then, the global society has paid increasing attention to the eco-environment. In 2015, the United Nations put forward 17 Sustainable Development Goals; several of them, including Goals 6, 7, 11, 12, 13, 14, and 15, aim to balance socioeconomic development with the eco-environment (Liu et al., 2018; Cheng et al., 2021). In recent years, many global research organizations or programs—such as Future Earth, the Intergovernmental Panel on Climate Change, and the Intergovernmental Science-Policy Platform on Biodiversity and Ecosystem Services—have also committed to exploring the coupling mechanisms and rules between humans and nature, with the aim of seeking solutions to mitigate and adapt to climate change (Liu et al., 2020a). Coupled human and natural systems (CHANS) have become one of the main areas of research in Earth system science and sustainability science in recent years (Clark, 2007; Steffen et al., 2020). Measuring the sustainability of CHANS is therefore in important scientific issue related to the fate and wellbeing of humans and has great practical significance.
The sustainability of CHANS has been evaluated from various dimensions, perspectives, and methods (Lu et al., 2019; Moallemi et al., 2020). Environmental footprints and the human appropriation of net primary production have been proposed as measures of human pressure or resource occupation (Krausmann et al., 2013; Vanham et al., 2019; Bowler et al., 2020). Theories such as the resource and environmental carrying capacity (Gao et al., 2021), planetary boundaries (Brown, 2017), and ecosystem services (Fu et al., 2022) have been developed to explore the supply or service capacity of nature to human society at different spatial scales. The sustainability of CHANS has been measured using comprehensive indicator systems—for example, the indicator system of the Sustainable Development Goals, the Environmental Performance Index (Hsu et al., 2013), and the Happy Planet Index (Abdallah et al., 2009). The sustainability and complexity of CHANS have been simulated using systems dynamics and multiagent modeling approaches (Ostrom, 2009; Fang et al., 2019; Yoon et al., 2021; Jiang et al., 2022). However, it is lacking to explore the relationship between the whole human system and the natural system from the perspective of supply and demand.
Ecosystem services are an important perspective in researching the relationship between humans and the natural world (Costanza et al., 2017). Ecosystem services refer to the direct and indirect benefits people obtain from natural ecosystems, and they have a fundamental role in supporting and sustaining human survival and wellbeing (Costanza et al., 1997). The ecosystem service supply (ESS) represents the total amount of ecosystem service products provided within a specific area and can be seen as the upper limit of the natural world’s carrying capacity for human activities. More attention has recently been paid to ecosystem services demand (ESD), which refers to the ecosystem service products consumed or utilized within a certain area. Many human activities (e.g., industrialization, urbanization, and the development of agriculture and animal husbandry) rely on a bundle of ecosystem service products (Cumming et al., 2014; Wang C. et al., 2022; Chen and Chi, 2022). However, with the intensification of human–nature interactions worldwide, the ESS is increasingly struggling to meet human demands (Cord et al., 2017a; Wei et al., 2017), especially in developing countries such as China (Chen et al., 2021; Liu et al., 2022). For example, continuing population growth and urban expansion pose a significant risk to food production services (Qiao et al., 2022) and affect the maintenance of biodiversity (Cao et al., 2022). Measuring the supply–demand status of ecosystem services may therefore be a feasible way to evaluate the sustainability of CHANS.
The supply and demand for diverse ecosystem services can be measured by a number of different methods. For provisioning services, food and water yield are often used to represent ESS (Boithias et al., 2014; Liu et al., 2022), whereas food and water consumption by people indicates the ESD (Quintas-Soriano et al., 2014; Feurer et al., 2021). For other services (including regulation, maintenance, and cultural services), models based on ecological processes—such as the revised universal soil loss equation (Ouyang et al., 2016; Li M. et al., 2022), the i-Tree Canopy (Baró et al., 2015), the habitat quality model (Wang L.-J. et al., 2022), and the recreation opportunity spectrum framework (Paracchini et al., 2014)—are often applied to evaluate the ESS of soil conservation, carbon sequestration, the maintenance of biodiversity, and recreation potential. Both qualitative and quantitative methods are used to evaluate ESDs, such as the revealed preference method, the expert scoring, ecological footprint, text analysis of the social media, and the carbon emission accounting method (Peña et al., 2015; Wei et al., 2017; Deng et al., 2021; Pan and Wang, 2021). The expert-based land use ranking matrixes proposed by Burkhard et al. (2012) have been widely used to assess the supply-demand status of ecosystem services. However, the constructed matrixes rely highly on local expertise, which cannot be directly applied between regions with heterogeneous ecological and economic characteristics (Peng et al., 2020; Jiang et al., 2021). The trade-offs and synergies between the different types of ecosystem services are increasingly being incorporated into important societal decisions (Goldstein et al., 2012; Cord et al., 2017b; Xu et al., 2020).
The research on ecosystem service supply and demand in China is increasing (Wang et al., 2019; Liu and Wu, 2021; Pan and Wang, 2021). Researchers often select several typical ecosystem services based on the study area (Ni et al., 2022). The land use ranking matrixes were also used to quantify the relevant capacity of the ecosystem service supply, demand, and balance in China (Wu et al., 2019). Although these studies can be used to explore spatiotemporal mismatches in the supply-demand of certain ecosystem service functions, they are less suitable for measuring conflicting or synergistic relationships between whole human systems and ecosystems, which are essential in appraising the sustainability of CHANS. Another major challenge is how to construct a comprehensive measurement framework for ESD. Currently, several simple indicators (e.g., population density and economic output) are used as a proxy for ESD in China (Peng et al., 2017; Wang et al., 2019; Zhai et al., 2021). However, the needs of human systems for ecosystem services are diverse and multifaceted, ranging from basic physiological needs (e.g., food and water) to aesthetic needs (e.g., natural scenery and cultural heritage). Simple indicators cannot fully encompass the diverse needs of human systems. In addition, current research mainly investigates the supply-demand status of ecosystem services in a local area or river basin at a particular time (Zhang H. et al., 2022; Zhou et al., 2022), whereas few studies have explored the dynamic interactions of this status on large spatial scales.
This research aims to fill these research gaps and evaluate the sustainability of CHANS from the perspective of supply and demand. We firstly constructed an ecosystem services supply index (ESSI) and a human demand index (HMDI) based on ecosystem service concept and Maslow’s hierarchy of needs. These indices reflect the per capita supply and demand of ecosystem services in one place. Based on these two indices, we then analyzed the change in the spatial mismatch of ESS and the human demands of 338 prefecture cities in China between 2000 and 2020. We propose a supply-demand balance index of CHANS to measure the sustainability of all cities, and analyzed the conflicts and synergies between ESS and human demands in this 20-year period. We make some suggestions from the supply and demand sides to realize both ecological protection and meet local development needs.
Research on CHANS highlights reciprocal interactions (or feedbacks) between natural and socioeconomic subsystems to explain systems dynamics and resilience (Kline et al., 2017). There is a natural supply and demand relationship between the two subsystems. The challenge of meeting the growing demands of humans for natural resources while sustaining essential ecosystem functions and resilience requires an in-depth understanding of the complex relationships between human and natural systems. Nature provides the materials and services humans depend on for survival, most of which are directly or indirectly supplied to us by natural ecosystems (Daily, 2003; Ellis et al., 2019). Nature’s supply in this study is therefore focused on the supply of ecosystem services, including the supporting, provisioning, regulating, and cultural services of different land types, such as forests, grasslands, farmland, wetlands, and areas of water (Millennium ecosystem assessment, 2005). The last three types of services are directly related to human demands. Supporting is the basis for all other ecosystem services and essentially refers to ecosystem processes and functions. Figure 1 details the four types of service in CHANS.
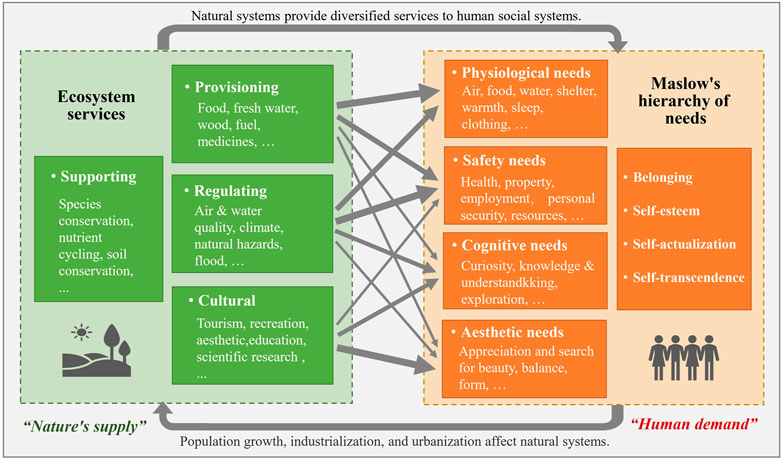
FIGURE 1. Relations between supply and demand in coupled human and natural systems. Note: Arrow’s width represents the intensity of linkages between ecosystem services and human needs.
The dimension of human demand in this study is different from that used in previous studies of ESD, which simplified human demand as the size of the population or economy, and from economics, which abstracts humans as rational people buying products. According to Maslow’s hierarchy of needs, we consider people’s comprehensive needs for the ecosystem. This psychological theory, often depicted as hierarchical levels within a pyramid, was first presented as a five-tier model of human needs, which was then extended to eight levels. It explains that people’s needs are closely related to human wellbeing from an individual perspective and has been widely recognized and applied in a number of different fields (Maslow, 1958; Maslow et al., 1987; Kaur, 2013). Maslow believed that human beings are motivated by a hierarchy of needs and that most behaviors have multiple motivations. Human needs lead to various types of effects on the natural environment. In the eight-stage model hierarchy, the human needs closely related to ecosystem services include four levels, from low to high: physiological needs (e.g., food, clean water, and air, and clothing); safety needs (e.g., health, property, employment, and personal security); cognitive needs (e.g., knowledge and understanding, curiosity, and exploration); and aesthetic needs (e.g., an appreciation and search for beauty, balance, and form) (Figure 1). The other four types of needs, belonging, self-esteem, self-actualization, self-transcendence, can only be obtained on the basis of meeting the physiological and safety needs.
These human needs are closely related to the different types of ecosystem services, but they do not strictly correspond to each other. For example, ecosystem provision services provide physiological needs (e.g., food, wood, and fuel) and safety needs (e.g., medicinal materials and shelter). People’s aesthetic needs come not only from biodiversity and ecosystem diversity but also from the cultural services (e.g., tourism and recreation) provided by the ecosystem. The supply and demand sides therefore form a complex network relationship in the CHANS. Different ecosystem services may have different impacts on human demand. Referring to previous studies, we use the arrow’s width to represent the intensity of linkages between ecosystem services and human demands (Millennium ecosystem assessment, 2005; Dominati et al., 2010; Wu, 2013).
Human demands and nature’s supply exist as reciprocal interactions and feedbacks. Ecosystems provide diversified services to human social systems, and their carrying capacity to a large extent determines the quality of human survival and development. The impacts of humans on ecosystems are mainly through population growth, industrialization, and urbanization (Liu et al., 2022a). Most of these effects are negative, but humans can also generate positive feedback through better investment, technology, and management. For example, investment in the restoration and preservation of natural capital has improved most of the major ecosystem services measured in China (Ouyang et al., 2016).
A large body of literature has evaluated the supply of ecosystem services at different spatiotemporal scales using various methods, such as the InVEST model (Ouyang et al., 2016), the benefit transfer method (de Groot et al., 2012; Costanza et al., 2014), and the equivalent factor method (Xie et al., 2017). We used the equivalent factor method to calculate the ESSI in the prefecture cities in China, which has recently been applied in many areas (Ketema et al., 2021; Sun et al., 2022; Zhou et al., 2022). This method has the advantages of expert-based matrixes and can be easily extended to large spatial scales through appropriate spatiotemporal adjustments of the factors (Xie et al., 2017; Xing et al., 2021). This study focuses on the stock of ecosystem services. The calculation results reflect the service capacity, which is an ecosystem’s potential to deliver services based on biophysical properties, social conditions, and ecological functions (Villamagna et al., 2013). Our purpose is to investigate the severity of human-nature conflict in a city by comparing the total capacity to the total demand without relying on the flows from other areas. Thus, we assume that all ecosystem services in a city come from local sources and do not consider the ecosystem service flows across cities, to compare better with the local people’s needs.
The equivalent factor table adopted here refers to the research of Xie et al., 2017. To match the ecosystem classification in this study, we averaged the coefficients of the secondary classification of forests and grasslands in the study of Xie et al. (2017). The final table is shown in Table 1, which includes four primary ecosystem service types and 11 specific ecosystem services. The coefficients in Table 1 represent the ESS coefficient per unit area. However, the coefficients are static and therefore cannot reflect the spatiotemporal heterogeneity of ecological processes and functions (Richardson et al., 2015).
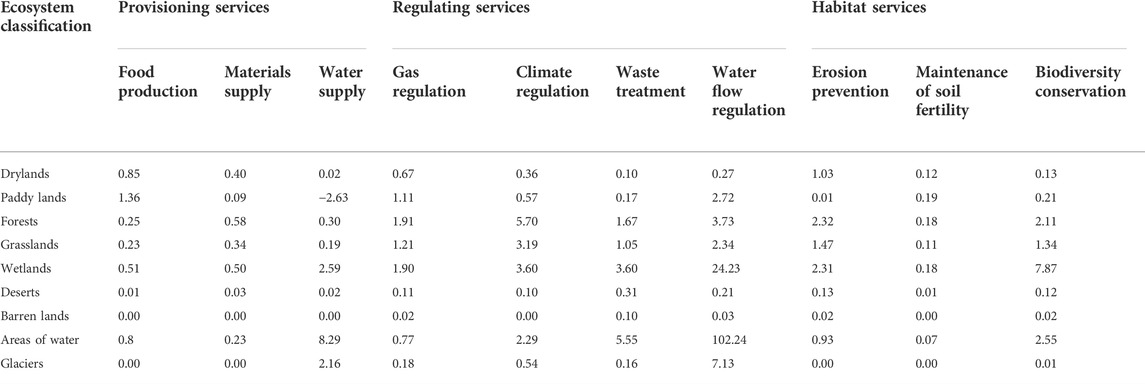
TABLE 1. Static ecosystem services supply coefficients per unit area.
Referring to the research of Xing et al., 2021, we selected five indicators (the net primary productivity, precipitation, migration resistance level, soil erosion level, and road density) to adjust the coefficients in space and time. We then took the average net profits of rice, wheat, and corn as the economic value of one standard equivalent coefficient. Given that grain yield and price are subject to climate and market fluctuations, we averaged the net profits over 5 years from 2010 to 2014. The formula is as follows:
where SV is the economic value of one standard equivalent coefficient;
We then obtained the total ESS value of Chinese cities using the following formula:
where
where
where
Following Maslow’s hierarchy of needs and the availability of data, we selected 14 relevant indicators to reflect the human demand for natural ecology. The principle is that these indicators should be able to reflect Maslow’s four levels of needs, and the needs reflected by these indicators should also be closely related to the ecosystem. Through a multicollinearity test, smoke dust emissions and pesticide use intensity were deleted to ensure that all the variance inflation factors were <10. Table 2 lists the remaining 12 human demand indicators. To make a better horizontal comparison, the indicators used were the per capita or relative value. Most of these indicators reflect people’s physiological and safety needs. The cognitive and aesthetic needs of human beings in the information era are increasingly dependent on electricity and some indoor space. Parkland green space can provide a place to recognize nature directly and can also meet the aesthetic needs of citizens. Water can be drunk directly and also experienced as a landscape for entertainment and viewing. Population density and urban population share both represent the total human demand.
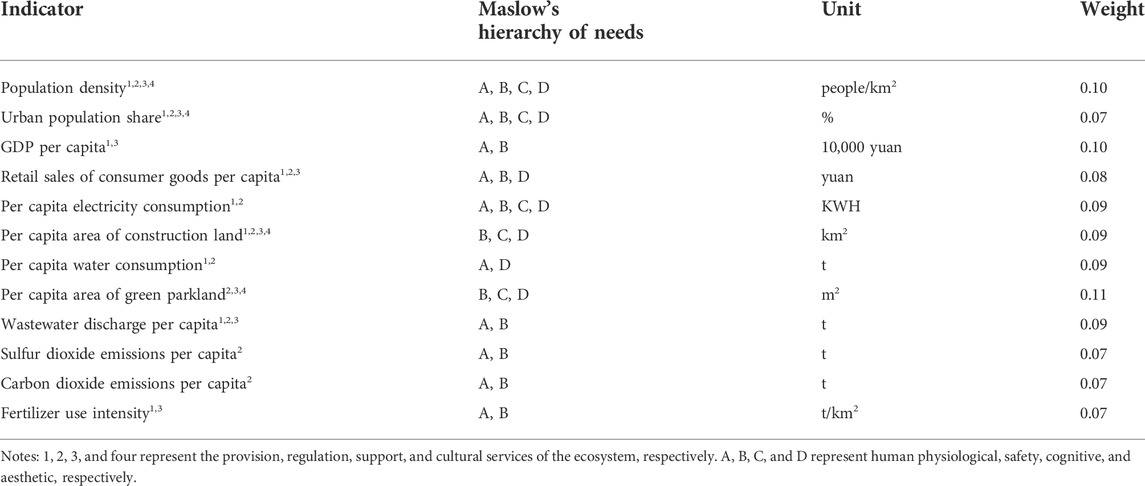
TABLE 2. Human demand indicator system.
These indicators also correspond to one or more ecosystem services. Population growth is the most direct cause of increasing human pressures on regional ecosystems. Many researchers use population density as a proxy variable for human activities or ESD (Wei et al., 2021; Cheng et al., 2022). The ecological footprint of urban populations is significantly higher than that of rural inhabitants (Rees and Wackernagel, 1996). The urban population share is also an important indicator reflecting the relative pressure of populations on ecosystems. A large number of products depend on ecosystem services, GDP can reflect the overall production of a region, and the social consumption of goods can reflect overall consumption. We consume water, electricity (fossil fuels), land, and other resources in our daily production and life, which are also directly related to ecosystems. Many kinds of pollution produced by production and consumption activities significantly impact ecosystems. For example, the discharge of wastewater and sulfur dioxide directly causes water and air pollution, and carbon dioxide emissions are the most crucial factor leading to climate warming. Excessive fertilizer applications cause soil pollution and a decline in fertility. These are closely related to ecosystem regulation and support services.
Because the order of magnitude and units of each indicator are different, the data are standardized using the minimax standardization method:
where
We used two methods to determine the weights of each indicator. One is a subjective approach—the analytic hierarchy process method (Okoli and Pawlowski, 2004)—and we invited 10 scholars in the fields of geography, ecology, and sociology to score the weights anonymously. The weight
The proportion of the jth indicator of ith city:
The information entropy e of the jth indicator:
The entropy redundancy d of the jth indicator:
The weight of the jth indicator:
The average values of the subjective weight and objective weight were calculated in the following way (Wang et al., 2014) and the results are listed in Table 2:
The HMDI could then be calculated as:
According to the World Commission on Environment and Development, sustainable development meets the needs of the present without compromising the ability of future generations to meet their own needs (Brundtland, 1987). Based on this idea, the global-scale planetary boundaries concept was developed. This presents a set of nine planetary boundaries within which humanity can continue to develop and thrive for generations to come (Rockström et al., 2009). Raworth (2012) proposed a doughnut theory, which combines the boundary of the human socioeconomic system with the planetary boundary. He believed that human development should lie between the two circles to simultaneously achieve ecological safety, social equity and justice, and inclusive and sustainable economic development. This theory indicates that the essence of sustainable development is to achieve a balance between nature’s supply and human demands. We believe that if the human demand in a region exceeds the nature’s supply without considering the ecosystem service flows across regions, it indicates that the regional system (CHANS) is unsustainable.
Inspired by the idea of this doughnut theory, based on the ESSI and the HMDI, we constructed a supply-demand balance index (SDBI) of the CHANS to measure the sustainability of an area:
The SDBI expresses a relative value calculated based on comprehensive indexes. The larger the value, the more sustainable the region’s state, and vice versa.
The trade-offs (conflicting) and synergies (synergistic) between ecosystem services and human demands decide the future evolution direction of CHANS. Especially in the early and middle stages of industrialization and urbanization, people destroy or change the original ecosystem to pursue development, such as deforestation, overgrazing, and the disordered discharge of pollutants. Human needs grow continuously, while the ecosystem services supply is diminishing. During this period, human demand for nature is disorderly and unbridled, and the trade-offs are mostly at the expense of ecosystems without any thought of sustainability. There is also a secondary form, in which human needs decrease while the ecosystem services tend to increase. Decreases in human demand usually occur in shrinking areas with a declining birth rate, economic downturns, or during natural disasters and wars. If the system is in trade-off evolution for a long time, the human-Earth system is likely to cross the two boundaries of the doughnut, leading to the collapse of the whole system. The two trade-off types are therefore undesirable and unsustainable. Recent research shows that socially successful countries often do not operate in an environmentally sustainable way, while environmentally sustainable ones suffer from serious social shortfall (Fanning et al., 2022).
Synergy evolution could ensure that the system stays within the boundaries of the doughnut, leading to sustainable development. This requires the proper control of those excessive human demands that come at the cost of ecosystem destruction, and an improvement in resource utilization efficiency, such as improving the natural resources property rights system and laws, developing low-carbon and circular economies, and reducing industrial and domestic pollution emissions. It is also necessary to actively increase the supply of ecosystem services, such as afforestation, water purification, and air quality improvement. The collaborative and positive development of human social systems and ecosystems can be realized to achieve a win-win situation. In addition, there may be, to a lesser extent, an opposite scenario in which both human demand and ESS tend to decrease.
Trade-off evolution implies a negative association between the ESS and human demand. We can therefore identify trade-off development regions where the product of the change rate of the two systems is negative in a certain time period (Pradhan et al., 2017). There are two theoretical types: trade-off I (the change rate of the ESSI is negative and the change rate of the HMDI is positive) and trade-off II (the change rate of the ESSI is positive and the change rate of the HMDI is negative). In Figure 2, the horizontal axis represents the change rate of the ESSI within a certain time period and the vertical axis represents the change rate of the HMDI. Trade-off I lies in the second quadrant and trade-off II is in the fourth quadrant. Synergy evolution implies a positive association between the changes in the ESSI and the HMDI. Therefore, we identify a synergy development region where the product of the rate of change of the two systems is positive in a given period. Theoretically, there are two types: synergy I (the change rates of the ESSI and HMDI are both positive) and synergy II (the change rates of the ESSI and HMDI are both negative). Synergy I lies in the first quadrant and synergy II in the third quadrant (Figure 2). In addition, if the change rate of the ESSI or HMDI is <1% during the given period, we consider the change to be insignificant.
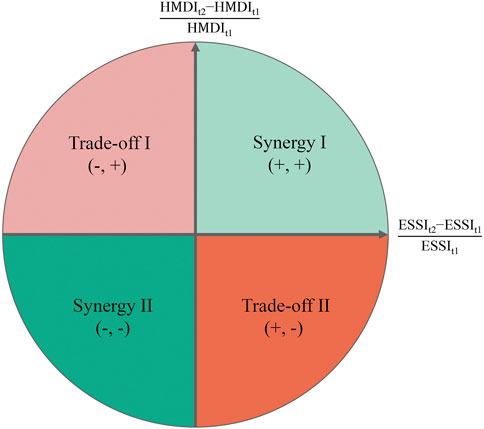
FIGURE 2. Quadrant identifying the trade-offs and synergies between ecosystem services and human demands.
The research area includes 338 prefecture-level cities, autonomous prefectures, and leagues in China, covering most of mainland China. Taiwan, Hong Kong, Macao, and some parts of Hainan Province were not included in this study because no data was available (Figure 3).
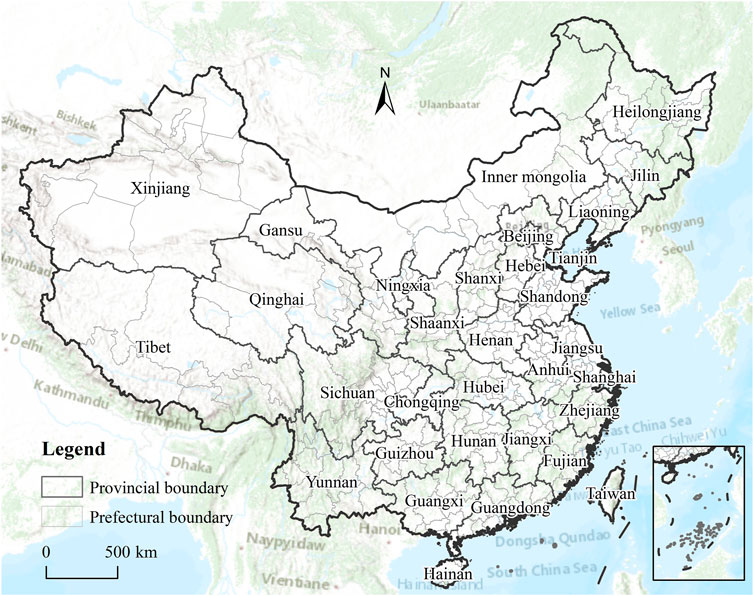
FIGURE 3. Map of the research area.
Land use and cover data with a resolution of (1 km × 1 km) were obtained for 2000, 2010, and 2020 from the Resource and Environmental Science and Data Center, Chinese Academy of Sciences (http://www.resdc.cn). We further classified these data into 10 types: drylands, paddy lands, forests, grasslands, wetlands, deserts, barren lands, areas of water, glaciers, and construction land. The total resident population and the urban population were from the China census database. The GDP, retail sales of consumer goods, electricity consumption, water consumption, area of green parkland, waste water discharge, and sulfur dioxide emissions were obtained from the China Urban Statistics Yearbook. The data on agricultural fertilizer use were obtained from the statistical yearbooks of each province. Precipitation, net primary productivity, and soil erosion data with a resolution of (1 km × 1 km) were obtained from the Resource and Environmental Science and Data Center. Road and railway vector data were provided by DIVA-GIS (http://swww.diva-gis.org/). Carbon dioxide emissions were calculated based on energy consumption data and the Intergovernmental Panel on Climate Change’s carbon emission coefficients for different kinds of energy (Yona et al., 2020; Li T. et al., 2022), and the data for 2020 were replaced by the data for 2019. There were no prefecture-level statistics on wastewater and sulfur dioxide emissions in Tibet and Qinghai, so the average value for the whole province was used instead.
Figure 4Ashows the evolutionary trend of the average ESSI and HMDI in China. The per capita ecosystem services level decreased slightly from 2000 to 2010, but remained almost unchanged from 2010 to 2020. The per capita human demand level increased from 2000 to 2020, but the rate of increase has slowed down in the last 10 years. It should be noted that there is some uncertainty in using the data of three individual years to reflect the changing trend, especially for HMDI. For example, due to the impact of COVID-19 in 2020, the intensity of human activities and human needs in some cities decreased compared to a normal year (Liu et al., 2020b). Figure 4B shows the regional differences in the ESSI and HMDI. Overall, the regional difference in the ESSI is more significant than that of the HMDI, and the differences in the ESSI show an increasing trend, whereas the HMDI shows a decreasing trend. This evolving trend may lead to an increase in the spatial imbalance between supply and demand.
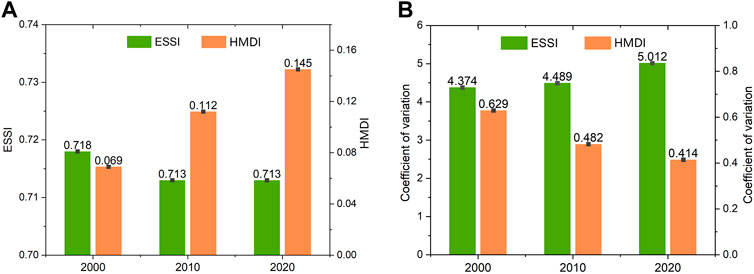
FIGURE 4. Trends and regional differences in the ESSI and HMDI in China, 2000–2020 (A) Temporal variations and (B) coefficients of variation.
Figure 5 shows the spatial patterns of the ESSI and HMDI in 2000 and 2020. The high values of the ESSI were mainly distributed over the Qinghai-Tibetan Plateau, the Yunnan-Guizhou Plateau, the Southeast Hills, the Greater Khingan Mountains, and other regions. The low values of the ESSI were mainly distributed over the North China Plain, the Yangtze River Delta, and the Sichuan Basin. The areas with a low value of the ESSI increased significantly in 2020 compared with 2000 and were distributed in Xinjiang, Gansu, Ningxia, and other places. The spatial pattern of the HMDI changed considerably more than that of the ESSI from 2000 to 2020, increasing in most areas. The number of cities with an HMDI >0.1 was 54 in 2000 and 272 in 2020. The high HMDI values were mainly distributed on the east coast of China, Inner Mongolia, and parts of Xinjiang, whereas the low HMDI values were distributed primarily in Qinghai, Tibet, Gansu, and Yunnan. The HMDI reflects the per capita state. With the low population density of Inner Mongolia and Xinjiang, many cities of the two provinces, such as Erdos, Baotou, Alxa, Hami, have very developed mining and chemical industries, large per capita construction land area, and high per capita sulfur dioxide and carbon dioxide emissions, which leads to the more per capita demand for ecosystem services in these areas.
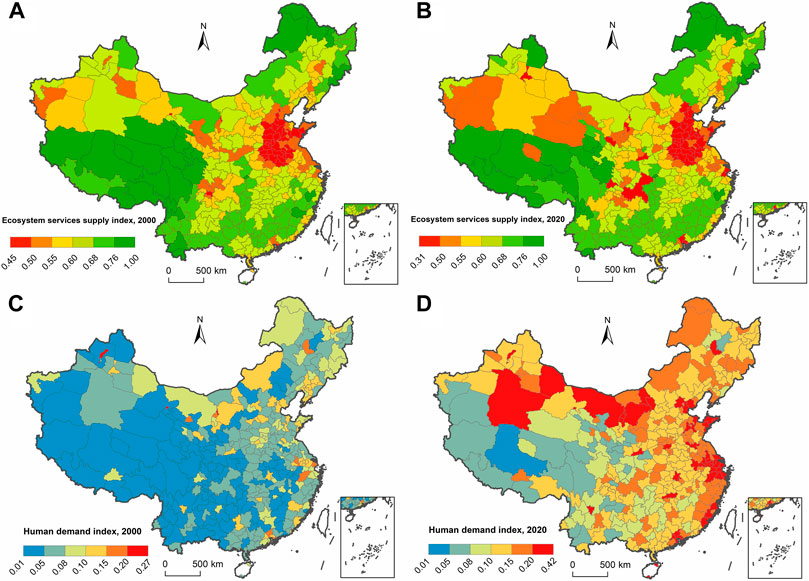
FIGURE 5. Spatial evolution of the ESSI and HMDI in China from 2000 to 2020.
Referring to the research of Wang et al. (2019), the ESSI and HMDI were taken as the horizontal and vertical axes, respectively, of the plane Cartesian coordinate system and the 3-year average of the two indexes (0.614 and 0.237) was taken as the original point (Figure 6). The coordinate system was divided into four quadrants: high ESS and high human demand (H, H); low ESS and high human demand (L, H); low ESS and low human demand (L, L); and high ESS and low human demand (H, L).
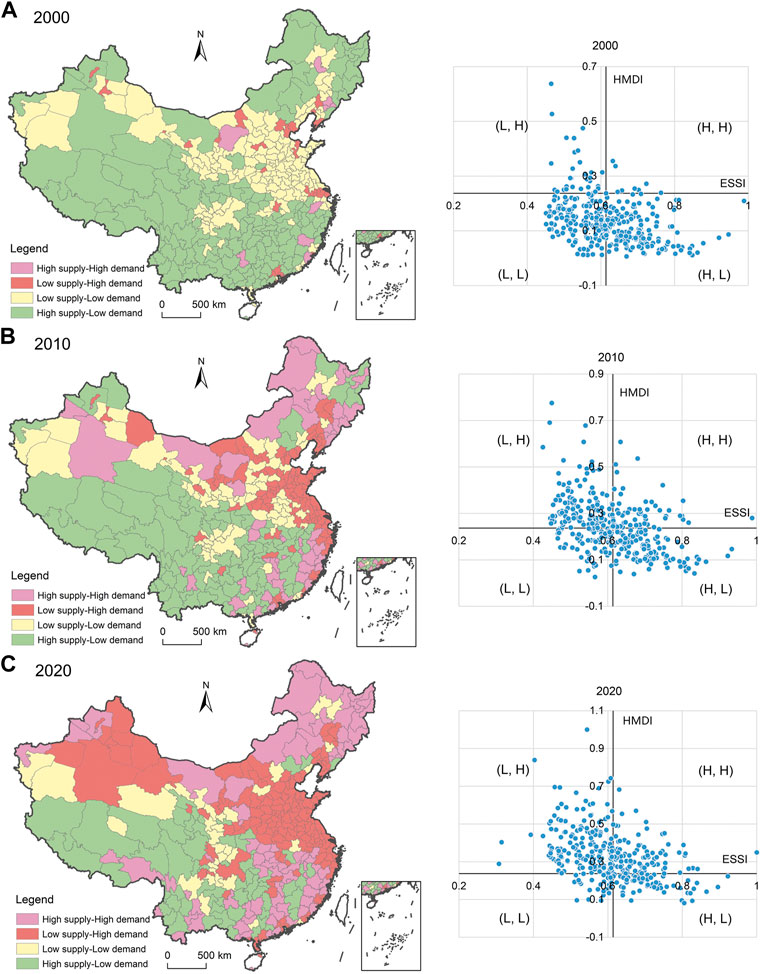
FIGURE 6. Spatial mismatches of ecosystem services supply and human demand.
The number of cities in the first and second quadrants gradually increased from 2000 to 2020, whereas the number of cities in the third and fourth quadrants decreased. In 2000, there were only 30 cities in the (L, H) category, including megacities (e.g., Beijing, Shanghai, Guangzhou, Nanjing, and Tianjin) and heavy industrial cities in the north (e.g., Jiayuguan, Wuhai, and Jinchang). By 2020, the number of (L, H) cities had reached 157, mainly distributed in Shandong, Shanxi, Hebei, Henan, and Xinjiang provinces. The cities with an uncoordinated relationship between the ESS and human demand showed a significant increase and spatial agglomeration. The (H, L) type was the weakest contradiction between ESS and HD. In 2000, most areas in China belonged to this type and, by 2020, this type was mainly distributed in the Qinghai–Tibetan Plateau and southwest China.
Figure 7Ashows the average SDBI from 2000 to 2020. Most of the high-value areas were distributed in the southwestern half of China, whereas the low-value regions were mainly distributed in the northeastern half. Although Lhasa is located on the Qinghai–Tibetan Plateau, its SDBI is relatively low (<5). In addition, in northeast China, only Suihua and Chengde are >5. Figure 7B shows the growth rate of the SDBI from 2000 to 2020. The SDBI shows a decreasing trend in most regions—that is, the sustainability of these regions is constantly decreasing. It is worth noting that the higher the SDBI value, the faster the decrease, and the cities with the most rapid rate of reduction include Qingyang, Pingliang, Dingxi, Longnan, Pu’er, and Lincang. The possible reason is that increasing heavy industry and manufacturing have moved from the eastern regions to the west, and these western cities with rapid industrialization and urbanization do not have enough financial support to protect and restore the ecology. Moreover, most of these areas are ecologically fragile, and ecosystems are more vulnerable to damage under the same human pressures. Thus, more attention should be paid to the health of the ecosystems of these cities in the future.
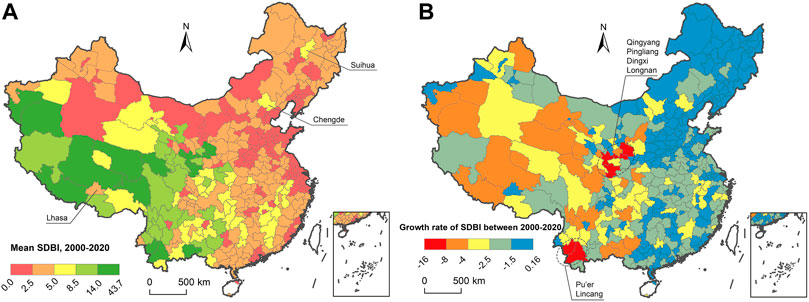
FIGURE 7. Sustainability assessment of coupled human and natural systems, 2000–2020.
We identified the conflicting or synergistic status of various cities based on the rate of change of ecosystem services and human demand. Overall, there were more trade-offs than synergies, although the number of synergy areas has increased since 2010. From 2000 to 2010, trade-off I accounted for 67% and synergy I accounted for 26%, mainly distributed in the Yangtze River basin, Gansu Province, and some cities in northeast China; the evolution status of 7% of the areas was not significant (Figure 8A). From 2010 to 2020, the number of trade-off areas decreased and there were six trade-off II cities (Wuhai, Anshan, Dandong, Liaoyang, Daqing, and Qitaihe), all in northeast China. The number of synergy areas has increased, but these are not concentrated, with many in border areas and Sanjiangyuan region (the sources of the Yangtze, Yellow, and Lancang rivers). Three synergy II cities appeared, including Siping, Hechi, and Shaoguan. However, the situation in many cities along the middle and lower reaches of the Yangtze River has changed from synergy to conflict (Figure 8B).
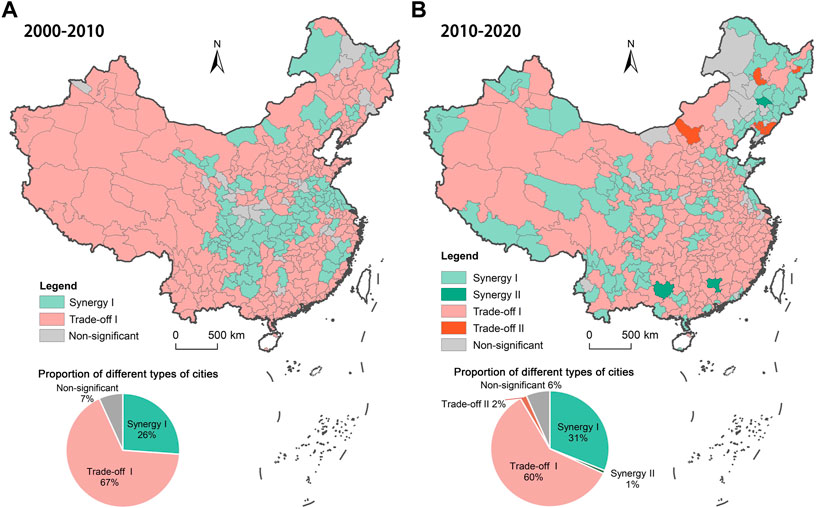
FIGURE 8. Trade-offs and synergies between ecosystem services and human demand.
This research provides a new perspective for evaluating CHANS based on the idea of supply-demand balance. Previous research frameworks have focused on the supply or support functions of natural systems (Zhang Z. et al., 2022)—for example, resource and environmental carrying capacity and ecosystem services. Some have focused on the pressure or damage on natural systems caused by human activities (Fan and Fang, 2022)—for example, the environmental and ecological footprints. Other methods are mainly applied at the global or national scale—for example, planetary boundaries and the doughnut theory. The methodology of this study integrates the supply and demand sides well and can be applied at the city scale.
Previous studies focused on the trade-offs and synergies between different ecosystem services (including supporting, provisioning, regulating, and cultural services), indicating the way one ecosystem service responds to the changes in another service that result in the increasing provision of one ecosystem service at the cost of the other services (Haase et al., 2012; Deng et al., 2016). Our horizon was broadened to the trade-offs and synergies between the whole human system and natural systems. These trade-offs are mainly reflected in the conflict between the development of the two systems. We proposed a supply–demand balance index for the CHANS and a method for identifying the trade-offs and synergies between two systems. Among them, nature’s supply is based on the concept of ecosystem services, and the theoretical basis of human demand is Maslow’s hierarchy of needs. Compared with previous trade-off analyses of ecosystem services, this approach could better judge the harmonious degree of the human–nature relationship in different cities, which could provide a reference for local governments to make decisions about sustainable urban development and ecological environment governance.
The methodology has some limitations. Although we referred to Maslow’s hierarchy of needs theory, it is challenging to find entirely consistent indicators with this theory. The HMDI system constructed in this work is to some extent subjective. The quantitative evaluation results in this research are some relative values to reflect the sustainability of the CHANS and can be used for horizontal and longitudinal comparisons and analyses, but the specific value has no physical significance.
Figure 6 shows that the supply and demand of ecosystem services in China are significantly unbalanced, with the southwestern half of China being better than the northeastern half. In many areas, it is difficult for people to meet their needs from the local ecosystem alone. This spatial imbalance facilitates the increasing flow of ecosystem services across regions. On a national scale, for example, China’s South-to-North Water Diversion Project directs the rich water resources in the south to the north (Liu et al., 2016), and the West-to-East Power Transmission Project transfers the power generated by the abundant energy in central and western regions to China’s coastal areas (Chen et al., 2010). At the watershed scale, the upstream regions provide more quality ecological products for the downstream regions through water protection and afforestation schemes (Foley et al., 2007; Zhai et al., 2021). Human activities can also affect remote ecosystems, such as the impact of urbanization on remote air quality and forest health (Liu et al., 2020a) and the effects of local human activities on global land use (Yu et al., 2013). As a consequence, the trade-off results are often felt at a distant location (Rodríguez et al., 2006). Some areas of population agglomeration can maintain sustainable development as a result of this telecoupling effect (Liu et al., 2016).
Although some ecosystem services (e.g., food, water, and energy supplies) can be deployed remotely to address supply–demand conflicts in a particular region, this service mobility comes with the loss of ecosystem services and distance costs: the further the distance, the higher the cost (Shi et al., 2020). Some services flow out at the expense of local residents (Schröter et al., 2018) and many supporting and cultural services are not mobile. To solve the imbalance between supply and demand, we need to combine improvements in the supply capacity of local ecosystems with the deployment of remote services to achieve sustainable development of CHANS at the lowest cost. Moreover, if feedbacks between regions are considered across time horizons, such as when short-term decisions affect long-term ecosystem services, the situation becomes more complex (Carpenter et al., 2009; Liu et al., 2022c). Therefore, how to integrate both long-range and long-term effects into the research framework and form a more long-term and systematic ecological management thinking should be considered in the future.
The key to the sustainable transformation of CHANS is to realize the harmony between humans and nature from conflict to synergy, so that a supply-demand balance can be achieved even if human needs continue to grow and the whole system can be maintained within the doughnut. On the supply side, measures such as ecological restoration, pollution emissions reduction, and improving natural protected areas can be adopted by the government to improve the supply ability and level of the ecosystem in areas with prominent supply–demand conflicts. For example, the Three-North Shelter Forest System Program, the Natural Forest Conservation Program, and the Grain for Green Program in China have significantly improved the supply of ecosystem services, especially in northern China (Cao et al., 2021). From the demand side, the ecological transformation of industries is an integral approach to achieve supply-demand balance, including promoting the circular economy mode, improving energy efficiency, and controlling pollution emissions. The government should exert the role of territorial space planning in managing land use and strictly define red lines for ecological protection and urban construction land (Bai et al., 2016). It is also essential to raise citizens’ awareness of ecological protection and resource conservation (Liu et al., 2022b).
Figure 6 shows that the regions with high ESS and low human demand are mostly underdeveloped regions, among which the Qinghai–Tibetan Plateau and the Yangtze River basin are considered to be the ecological security barriers of China and have ecological service functions on national and even global scales. Realizing the win-win situation of ecological protection and local development in these areas is therefore related to the sustainable development of the whole country. First, based on the suppliers and receivers of ecosystem services, a cross-regional horizontal compensation mechanism for ecosystem services can be established. In addition to financial compensation, we can explore more compensation approaches by industries, projects, technologies, and talents. Second, we could promote the reform of the property rights of water, forestry, mining, and other natural resources, monetize part of the mobile ecosystem services, and explore the cross-regional transactions of different types of ecosystem services. Third, we could strengthen the construction of a green financial system and focus on supporting projects with ecological benefits, such as green agriculture and animal husbandry, green energy, understory industries, and ecotourism.
For the urban agglomeration areas with low SDBI scores (Figure 7), more active intervention policies tailored to local conditions should be implemented, including optimizing the urban system structure, designing applicable ecological corridors, and curbing the land sprawl of big cities (Fang et al., 2017; Huang and Liao, 2021). As an essential way, the remote service deployment should be coordinated to make up for the shortage of local ecosystem services in urban agglomerations. Figure 8 shows that from 2000 to 2020, the status of many cities in the middle and lower reaches of the Yangtze River has changed from synergy to conflict. This is due to rapid economic and population growth in these areas, as well as shrinking wetlands and lakes, serious non-point source pollution, soil erosion, and biodiversity loss (Fang et al., 2006; Wang et al., 2015). Therefore, the local governments should strengthen the protection of water ecology and environment, enhance the comprehensive management of the watershed, reduce the intensity of pesticide and fertilizer use, and follow the nature-based solutions in constructing artificial facilities (Liquete et al., 2016; Tozer et al., 2020).
This study has made the following contributions to research. First, inspired by the doughnut theory, we propose a supply-demand balance index of CHANS based on ecosystem services to measure the sustainability of an area. Second, from the perspective of the system dynamics, we put forward a method to judge the trade-offs (conflicting) and synergies (synergistic) between ecosystem services and human demand. Third, we quantified the dynamic evolution of CHANS at the city scale in China over the past 20 years and identified the areas with severe human–natural conflict and possible risk. Overall, this study provides a new methodology to assess the sustainability of CHANS, which can be applied to other places. The results could support the Chinese government in regional ecosystem governance and territorial space planning. Our main conclusions are as follows.
The ESSI decreased from 2000 to 2010 in China, but remained almost unchanged from 2010 to 2020. The low ESSI values were mainly distributed over the North China Plain, the Yangtze River Delta, and the Sichuan Basin. The HMDI increased from 2000 to 2020, but the rate of increase has slowed down in the last 10 years. The high HMDI values were mainly distributed over the east coast, Inner Mongolia, and part of Xinjiang. From 2000 to 2020, the cities with spatial mismatches of the ESSI and HMDI showed a significant increase and spatial agglomeration. The sustainability of most regions showed a decreasing trend, and the higher the SDBI value, the faster the speed of decrease. Overall, there are more regions in a conflicting state than in a synergy state between ecosystem and humans, although this number has decreased since 2010. The ecological health of urban agglomerations and western regions should be paid more attention.
The original contributions presented in the study are included in the article/supplementary material, further inquiries can be directed to the corresponding author.
HL: Conceptualization, methodology, investigation, visualization, formal analysis, writing—original draft, writing—review, and editing; LX: Methodology, software, data preparation, writing—review, and editing; CW: Supervision, project administration, writing—review, and editing; HZ: Investigation, validation, writing—review, and editing.
This research was funded by National Natural Science Foundation of China (42171210, 72004093) and the Second Tibetan Plateau Scientific Expedition and Research Program (2019QZKK1005).
The authors declare that the research was conducted in the absence of any commercial or financial relationships that could be construed as a potential conflict of interest.
All claims expressed in this article are solely those of the authors and do not necessarily represent those of their affiliated organizations, or those of the publisher, the editors and the reviewers. Any product that may be evaluated in this article, or claim that may be made by its manufacturer, is not guaranteed or endorsed by the publisher.
Abdallah, S., Thompson, S., Michaelson, J., Marks, N., and Steuer, N. (2009). The Happy Planet Index 2.0: Why good lives don’t have to cost the Earth.
Bai, Y., Jiang, B., Wang, M., Li, H., Alatalo, J. M., and Huang, S. (2016). New ecological redline policy (ERP) to secure ecosystem services in China. Land Use Policy 55, 348–351. doi:10.1016/j.landusepol.2015.09.002
Baró, F., Haase, D., Gómez-Baggethun, E., and Frantzeskaki, N. (2015). Mismatches between ecosystem services supply and demand in urban areas: A quantitative assessment in five European cities. Ecol. Indic. 55, 146–158. doi:10.1016/j.ecolind.2015.03.013
Boithias, L., Acuna, V., Vergonos, L., Ziv, G., Marce, R., and Sabater, S. (2014). Assessment of the water supply:demand ratios in a Mediterranean basin under different global change scenarios and mitigation alternatives. Sci. Total Environ. 470–471, 567–577. doi:10.1016/j.scitotenv.2013.10.003
Bowler, D. E., Bjorkman, A. D., Dornelas, M., Myers‐Smith, I. H., Navarro, L. M., Niamir, A., et al. (2020). Mapping human pressures on biodiversity across the planet uncovers anthropogenic threat complexes. People Nat. 2 (2), 380–394. doi:10.1002/pan3.10071
Brown, K. (2017). Global environmental change II: Planetary boundaries–A safe operating space for human geographers? Prog. Hum. Geogr. 41 (1), 118–130. doi:10.1177/0309132515604429
Brundtland, G. H. (1987). Our common future—call for action. Environ. Conserv. 14 (4), 291–294. doi:10.1017/s0376892900016805
Burkhard, B., Kroll, F., Nedkov, S., and Müller, F. (2012). Mapping ecosystem service supply, demand and budgets. Ecol. Indic. 21, 17–29. doi:10.1016/j.ecolind.2011.06.019
Cao, S., Xia, C., Suo, X., and Wei, Z. (2021). A framework for calculating the net benefits of ecological restoration programs in China. Ecosyst. Serv. 50, 101325. doi:10.1016/j.ecoser.2021.101325
Cao, Y., Wang, F., Tseng, T.-H., Carver, S., Chen, X., Zhao, J., et al. (2022). Identifying ecosystem service value and potential loss of wilderness areas in China to support post-2020 global biodiversity conservation. Sci. Total Environ. 846, 157348. doi:10.1016/j.scitotenv.2022.157348
Carpenter, S. R., Mooney, H. A., Agard, J., Capistrano, D., DeFries, R. S., Díaz, S., et al. (2009). Science for managing ecosystem services: Beyond the Millennium Ecosystem Assessment. Proc. Natl. Acad. Sci. U. S. A. 106 (5), 1305–1312. doi:10.1073/pnas.0808772106
Chen, D., Jiang, P., and Li, M. (2021). Assessing potential ecosystem service dynamics driven by urbanization in the Yangtze River Economic Belt, China. J. Environ. Manag. 292, 112734. doi:10.1016/j.jenvman.2021.112734
Chen, W., and Chi, G. (2022). Urbanization and ecosystem services: The multi-scale spatial spillover effects and spatial variations. Land Use Policy 114, 105964. doi:10.1016/j.landusepol.2021.105964
Chen, W., Li, H., and Wu, Z. (2010). Western China energy development and west to east energy transfer: Application of the western China sustainable energy development model. Energy Policy 38 (11), 7106–7120. doi:10.1016/j.enpol.2010.07.029
Cheng, Y., Liu, H., Chen, D., and Liu, H. (2022). Human activity intensity and its spatial-temporal evolution in China’s border areas. Land 11 (7), 1089. doi:10.3390/land11071089
Cheng, Y., Liu, H., Wang, S., Cui, X., and Li, Q. (2021). Global action on SDGs: Policy review and outlook in a post-pandemic era. Sustainability 13 (11), 6461. doi:10.3390/su13116461
Clark, W. C. (2007). Sustainability science: a room of its own. Proceedings of the National Academy of Sciences. National Academy of Sciences 104 (6), 1737–1738. doi:10.1073/pnas.0611291104
Cord, A. F., Bartkowski, B., Beckmann, M., Dittrich, A., Hermans-Neumann, K., Kaim, A., et al. (2017b). Towards systematic analyses of ecosystem service trade-offs and synergies: Main concepts, methods and the road ahead. Ecosyst. Serv. 28, 264–272. doi:10.1016/j.ecoser.2017.07.012
Cord, A. F., Bartkowski, B., Beckmann, M., Dittrich, A., Hermans-Neumann, K., Kaim, A., et al. (2017a). Towards systematic analyses of ecosystem service trade-offs and synergies: Main concepts, methods and the road ahead. Ecosyst. Serv. 28, 264–272. doi:10.1016/j.ecoser.2017.07.012
Costanza, R., d’Arge, R., de Groot, R., Farber, S., Grasso, M., Hannon, B., et al. (1997). The value of the world’s ecosystem services and natural capital. Nature 387, 253–260. doi:10.1038/387253a0
Costanza, R., de Groot, R., Braat, L., Kubiszewski, I., Fioramonti, L., Sutton, P., et al. (2017). Twenty years of ecosystem services: How far have we come and how far do we still need to go? Ecosyst. Serv. 28, 1–16. doi:10.1016/j.ecoser.2017.09.008
Costanza, R., de Groot, R., Sutton, P., van der Ploeg, S., Anderson, S. J., Kubiszewski, I., et al. (2014). Changes in the global value of ecosystem services. Glob. Environ. Change 26, 152–158. doi:10.1016/j.gloenvcha.2014.04.002
Cui, X., Fang, C., Liu, H., and Liu, X. (2019). Assessing sustainability of urbanization by a coordinated development index for an urbanization-resources-environment complex system: A case study of jing-jin-ji region, China. Ecol. Indic. 96, 383–391. doi:10.1016/j.ecolind.2018.09.009
Cumming, G. S., Buerkert, A., Hoffmann, E. M., Schlecht, E., von Cramon-Taubadel, S., and Tscharntke, T. (2014). Implications of agricultural transitions and urbanization for ecosystem services. Nature 515, 50–57. doi:10.1038/nature13945
Daily, G. (2003). “What are ecosystem services,” in Global environmental challenges for the twenty-first century: Resources, consumption and sustainable solutions. Editor D. E. Lorey (Wilmington, DE: Scholarly Resources Inc.), 227–231.
de Groot, R., Brander, L., van der Ploeg, S., Costanza, R., Bernard, F., Braat, L., et al. (2012). Global estimates of the value of ecosystems and their services in monetary units. Ecosyst. Serv. 1, 50–61. doi:10.1016/j.ecoser.2012.07.005
Degroot, D., Anchukaitis, K., Bauch, M., Burnham, J., Carnegy, F., Cui, J., et al. (2021). Towards a rigorous understanding of societal responses to climate change. Nature 591 (7851), 539–550. doi:10.1038/s41586-021-03190-2
Deng, C., Liu, J., Liu, Y., Li, Z., Nie, X., Hu, X., et al. (2021). Spatiotemporal dislocation of urbanization and ecological construction increased the ecosystem service supply and demand imbalance. J. Environ. Manag. 288, 112478. doi:10.1016/j.jenvman.2021.112478
Deng, X., Li, Z., and Gibson, J. (2016). A review on trade-off analysis of ecosystem services for sustainable land-use management. J. Geogr. Sci. 26 (7), 953–968. doi:10.1007/s11442-016-1309-9
Dominati, E., Patterson, M., and Mackay, A. (2010). A framework for classifying and quantifying the natural capital and ecosystem services of soils. Ecol. Econ. 69 (9), 1858–1868. doi:10.1016/j.ecolecon.2010.05.002
Ellis, E. C., Pascual, U., and Mertz, O. (2019). Ecosystem services and nature’s contribution to people: Negotiating diverse values and trade-offs in land systems. Curr. Opin. Environ. Sustain. 38, 86–94. doi:10.1016/j.cosust.2019.05.001
Fan, Y., and Fang, C. (2022). Measuring Qinghai-Tibet plateau's sustainability. Sustain. Cities Soc. 85, 104058. doi:10.1016/j.scs.2022.104058
Fang, C., Cui, X., Li, G., Bao, C., Wang, Z., Ma, H., et al. (2019). Modeling regional sustainable development scenarios using the Urbanization and Eco-environment Coupler: Case study of Beijing-Tianjin-Hebei urban agglomeration, China. Sci. Total Environ. 689, 820–830. doi:10.1016/j.scitotenv.2019.06.430
Fang, C., Pang, B., and Liu, H. (2017). Global city size hierarchy: Spatial patterns, regional features, and implications for China. Habitat Int. 66, 149–162. doi:10.1016/j.habitatint.2017.06.002
Fang, C., Wang, Z., and Liu, H. (2020). Beautiful China Initiative: Human-nature harmony theory, evaluation index system and application. J. Geogr. Sci. 30 (5), 691–704. doi:10.1007/s11442-020-1750-7
Fang, J., Wang, Z., Zhao, S., Li, Y., Tang, Z., Yu, D., et al. (2006). Biodiversity changes in the lakes of the central Yangtze. Front. Ecol. Environ. 4 (7), 369–377. doi:10.1890/1540-9295(2006)004[0369:bcitlo]2.0.co;2
Fanning, A. L., O’Neill, D. W., Hickel, J., and Roux, N. (2022). The social shortfall and ecological overshoot of nations. Nat. Sustain. 5 (1), 26–36. doi:10.1038/s41893-021-00799-z
Feurer, M., Rueff, H., Celio, E., Heinimann, A., Blaser, J., Htun, A. M., et al. (2021). Regional scale mapping of ecosystem services supply, demand, flow and mismatches in Southern Myanmar. Ecosyst. Serv. 52, 101363. doi:10.1016/j.ecoser.2021.101363
Foley, J. A., Asner, G. P., Costa, M. H., Coe, M. T., DeFries, R., Gibbs, H. K., et al. (2007). Amazonia revealed: Forest degradation and loss of ecosystem goods and services in the amazon basin. Front. Ecol. Environ. 5 (1), 25–32. doi:10.1890/1540-9295(2007)5[25:ARFDAL]2.0.CO;2
Folke, C., Polasky, S., Rockström, J., Galaz, V., Westley, F., Lamont, M., et al. (2021). Our future in the Anthropocene biosphere. Ambio 50 (4), 834–869. doi:10.1007/s13280-021-01544-8
Fu, B., Wu, X., Wang, Z., Wu, X., and Wang, S. (2022). Coupling human and natural systems for sustainability: Experience from China's loess plateau. Earth Syst. Dyn. 13 (2), 795–808. doi:10.5194/esd-13-795-2022
Gao, Q., Fang, C., Liu, H., and Zhang, L. (2021). Conjugate evaluation of sustainable carrying capacity of urban agglomeration and multi-scenario policy regulation. Sci. Total Environ. 785, 147373. doi:10.1016/j.scitotenv.2021.147373
Giddings, B., Hopwood, B., and O'brien, G. (2002). Environment, economy and society: Fitting them together into sustainable development. Sust. Dev. 10 (4), 187–196. doi:10.1002/sd.199
Goldstein, J. H., Caldarone, G., Duarte, T. K., Ennaanay, D., Hannahs, N., Mendoza, G., et al. (2012). Integrating ecosystem-service tradeoffs into land-use decisions. Proc. Natl. Acad. Sci. U. S. A. 109 (19), 7565–7570. doi:10.1073/pnas.1201040109
Haase, D., Schwarz, N., Strohbach, M., Kroll, F., and Seppelt, R. (2012). Synergies, trade-offs, and losses of ecosystem services in urban regions: An integrated multiscale framework applied to the leipzig-halle region, Germany. Ecol. Soc. 17 (3), art22. doi:10.5751/es-04853-170322
Hsu, A., Lloyd, A., and Emerson, J. W. (2013). What progress have we made since rio? Results from the 2012 environmental performance index (EPI) and pilot trend EPI. Environ. Sci. Policy 33, 171–185. doi:10.1016/j.envsci.2013.05.011
Huang, Y., and Liao, R. (2021). Polycentric or monocentric, which kind of spatial structure is better for promoting the green economy? Evidence from Chinese urban agglomerations. Environ. Sci. Pollut. Res. 28 (41), 57706–57722. doi:10.1007/s11356-021-14655-2
Jiang, C., Yang, Z., Wen, M., Huang, L., Liu, H., Wang, J., et al. (2021). Identifying the spatial disparities and determinants of ecosystem service balance and their implications on land use optimization. Sci. Total Environ. 793, 148472. doi:10.1016/j.scitotenv.2021.148472
Jiang, H., Simonovic, S. P., and Yu, Z. (2022). ANEMI_Yangtze v1.0: A coupled human–natural systems model for the Yangtze economic belt – model description. Geosci. Model Dev. 15 (11), 4503–4528. doi:10.5194/gmd-15-4503-2022
Kaur, A. (2013). Maslow’s need hierarchy theory: Applications and criticisms. Glob. J. Manag. Bus. Stud. 3 (10), 1061–1064.
Ketema, H., Wei, W., Legesse, A., Wolde, Z., and Endalamaw, T. (2021). Quantifying ecosystem service supply-demand relationship and its link with smallholder farmers’ well-being in contrasting agro-ecological zones of the East African Rift. Glob. Ecol. Conservation 31, e01829. doi:10.1016/j.gecco.2021.e01829
Kline, J. D., White, E. M., Fischer, A. P., Steen-Adams, M. M., Charnley, S., Olsen, C. S., et al. (2017). Integrating social science into empirical models of coupled human and natural systems. Ecol. Soc. 22 (3), art25. doi:10.5751/ES-09329-220325
Krausmann, F., Erb, K.-H., Gingrich, S., Haberl, H., Bondeau, A., Gaube, V., et al. (2013). Global human appropriation of net primary production doubled in the 20th century. Proc. Natl. Acad. Sci. U. S. A. 110 (25), 10324–10329. doi:10.1073/pnas.1211349110
Li, M., Liu, H., Yu, S., Wang, J., Miao, Y., and Wang, C. (2022a). Estimating the decoupling between net carbon emissions and construction land and its driving factors: Evidence from Shandong province, China. Int. J. Environ. Res. Public Health 19 (15), 8910. doi:10.3390/ijerph19158910
Li, T., Wang, H., Fang, Z., Liu, G., Zhang, F., Zhang, H., et al. (2022b). Integrating river health into the supply and demand management framework for river basin ecosystem services. Sustain. Prod. Consum. 33, 189–202. doi:10.1016/j.spc.2022.06.025
Liquete, C., Udias, A., Conte, G., Grizzetti, B., and Masi, F. (2016). Integrated valuation of a nature-based solution for water pollution control. Highlighting hidden benefits. Ecosyst. Serv. 22, 392–401. doi:10.1016/j.ecoser.2016.09.011
Liu, H., Cui, W., and Zhang, M. (2022a). Exploring the causal relationship between urbanization and air pollution: Evidence from China. Sustain. Cities Soc. 80, 103783. doi:10.1016/j.scs.2022.103783
Liu, H., Fang, C., and Fang, K. (2020a). Coupled human and natural cube: A novel framework for analyzing the multiple interactions between humans and nature. J. Geogr. Sci. 30 (3), 355–377. doi:10.1007/s11442-020-1732-9
Liu, H., Fang, C., and Gao, Q. (2020b). Evaluating the real-time impact of COVID-19 on cities: China as a case study. Complexity 2020, 11. doi:10.1155/2020/8855521
Liu, H., Liu, H., and Cheng, Y. (2022b). Illustrating the multi-stakeholder perceptions of environmental pollution based on big data: Lessons from China. Reg. Sustain. 3 (1), 12–26. doi:10.1016/j.regsus.2022.03.003
Liu, H., Wang, C., Zhang, M., and Wang, S. (2022c). Evaluating the effects of air pollution control policies in China using a difference-in-differences approach. Sci. Total Environ. 845, 157333. doi:10.1016/j.scitotenv.2022.157333
Liu, J., Hull, V., Godfray, H. C. J., Tilman, D., Gleick, P., Hoff, H., et al. (2018). Nexus approaches to global sustainable development. Nat. Sustain. 1 (9), 466–476. doi:10.1038/s41893-018-0135-8
Liu, J., Yang, W., and Li, S. (2016). Framing ecosystem services in the telecoupled Anthropocene. Front. Ecol. Environ. 14 (1), 27–36. doi:10.1002/16-0188.1
Liu, L., and Wu, J. (2021). Ecosystem services-human wellbeing relationships vary with spatial scales and indicators: The case of China. Resour. Conservation Recycl. 172, 105662. doi:10.1016/j.resconrec.2021.105662
Liu, W., Zhan, J., Zhao, F., Zhang, F., Teng, Y., Wang, C., et al. (2022). The tradeoffs between food supply and demand from the perspective of ecosystem service flows: A case study in the pearl River Delta, China. J. Environ. Manag. 301, 113814. doi:10.1016/j.jenvman.2021.113814
Lu, Z., Broesicke, O. A., Chang, M. E., Yan, J., Xu, M., Derrible, S., et al. (2019). Seven approaches to manage complex coupled human and natural systems: A sustainability toolbox. Environ. Sci. Technol. 53 (16), 9341–9351. doi:10.1021/acs.est.9b01982
Maslow, A. H., Frager, R., Fadiman, J., McReynolds, C., and Cox, R. (1987). Motivation and personality. New York. 3rd.
Meng, S., Huang, Q., Zhang, L., He, C., and Inostroza, L. (2020). Matches and mismatches between the supply of and demand for cultural ecosystem services in rapidly urbanizing watersheds: A case study in the Guanting Reservoir basin, China. Ecosystem Services 45, 101156. doi:10.1016/j.ecoser.202
Millennium ecosystem assessment, M. (2005). Ecosystems and human well-being. Washington, DC: Island press.
Moallemi, E. A., Kwakkel, J., de Haan, F. J., and Bryan, B. A. (2020). Exploratory modeling for analyzing coupled human-natural systems under uncertainty. Glob. Environ. Change 65, 102186. doi:10.1016/j.gloenvcha.2020.102186
Ni, Y., Wei, J., Wu, T., Guo, M., Han, Q., and Zhang, M. (2022). Mapping and assessing ecosystem service supply–demand to identify critical areas: A case study of a waterside area in Shanghai metropolitan area. Front. Earth Sci. (Lausanne). 10. doi:10.3389/feart.2022.943910
Okoli, C., and Pawlowski, S. D. (2004). The delphi method as a research tool: An example, design considerations and applications. Inf. Manag. 42 (1), 15–29. doi:10.1016/j.im.2003.11.002
Ostrom, E. (2009). A general framework for analyzing sustainability of social-ecological systems. Science 325 (5939), 419–422. doi:10.1126/science.1172133
Ouyang, Z., Zheng, H., Xiao, Y., Polasky, S., Liu, J., Xu, W., et al. (2016). Improvements in ecosystem services from investments in natural capital. Science 352 (6292), 1455–1459. doi:10.1126/science.aaf2295
Pan, Z., and Wang, J. (2021). Spatially heterogeneity response of ecosystem services supply and demand to urbanization in China. Ecol. Eng. 169, 106303. doi:10.1016/j.ecoleng.2021.106303
Paracchini, M. L., Zulian, G., Kopperoinen, L., Maes, J., Schagner, J. P., Termansen, M., et al. (2014). Mapping cultural ecosystem services: A framework to assess the potential for outdoor recreation across the EU. Ecol. Indic. 45, 371–385. doi:10.1016/j.ecolind.2014.04.018
Peña, L., Casado-Arzuaga, I., and Onaindia, M. (2015). Mapping recreation supply and demand using an ecological and a social evaluation approach. Ecosyst. Serv. 13, 108–118. doi:10.1016/j.ecoser.2014.12.008
Peng, J., Wang, X., Liu, Y., Zhao, Y., Xu, Z., Zhao, M., et al. (2020). Urbanization impact on the supply-demand budget of ecosystem services: Decoupling analysis. Ecosyst. Serv. 44, 101139. doi:10.1016/j.ecoser.2020.101139
Peng, J., Yang, Y., and Xie, P. (2017). Zoning for the construction of green space ecological networks in Guangdong Province based on the supply and demand of ecosystem services. Acta Ecol. Sin. 37, 4562–4572.
Pradhan, P., Costa, L., Rybski, D., Lucht, W., and Kropp, J. P. (2017). A systematic study of sustainable development goal (SDG) interactions. Earth's. Future 5 (11), 1169–1179. doi:10.1002/2017ef000632
Qiao, J., Cao, Q., Zhang, Z., Cao, Z., and Liu, H. (2022). Spatiotemporal changes in the state of food security across mainland China during 1990–2015: A multi‐scale analysis. Food Energy Secur. 11 (1), e318. doi:10.1002/fes3.318
Quintas-Soriano, C., Castro, A. J., García-Llorente, M., Cabello, J., and Castro, H. (2014). From supply to social demand: A landscape-scale analysis of the water regulation service. Landsc. Ecol. 29, 1069–1082. doi:10.1007/s10980-014-0032-0
Rees, W., and Wackernagel, M. (1996). Urban ecological footprints: Why cities cannot be sustainable—and why they are a key to sustainability. Environ. Impact Assess. Rev. 16 (4), 223–248. doi:10.1016/S0195-9255(96)00022-4
Richardson, L., Loomis, J., Kroeger, T., and Casey, F. (2015). The role of benefit transfer in ecosystem service valuation. Ecol. Econ. 115, 51–58. doi:10.1016/j.ecolecon.2014.02.018
Rockström, J., Steffen, W., Noone, K., Persson, Å., Chapin, F. S., Lambin, E. F., et al. (2009). A safe operating space for humanity. Nature 461 (7263), 472–475. doi:10.1038/461472a
Rodríguez, J. P., Beard, T. D., Bennett, E. M., Cumming, G. S., Cork, S. J., Agard, J., et al. (2006). Trade-offs across space, time, and ecosystem services. Ecol. Soc. 11 (1), art28. doi:10.5751/es-01667-110128
Schröter, M., Koellner, T., Alkemade, R., Arnhold, S., Bagstad, K. J., Erb, K.-H., et al. (2018). Interregional flows of ecosystem services: Concepts, typology and four cases. Ecosyst. Serv. 31, 231–241. doi:10.1016/j.ecoser.2018.02.003
Shi, Y., Shi, D., Zhou, L., and Fang, R. (2020). Identification of ecosystem services supply and demand areas and simulation of ecosystem service flows in Shanghai. Ecol. Indic. 115, 106418. doi:10.1016/j.ecolind.2020.106418
Steffen, W., Broadgate, W., Deutsch, L., Gaffney, O., and Ludwig, C. (2015a). The trajectory of the Anthropocene: The great acceleration. Anthropocene Rev. 2 (1), 81–98. doi:10.1177/2053019614564785
Steffen, W., Richardson, K., Rockström, J., Cornell, S. E., Fetzer, I., Bennett, E. M., et al. (2015b). Sustainability. Planetary boundaries: Guiding human development on a changing planet. science 347 (6223), 1259855. doi:10.1126/science.1259855
Steffen, W., Richardson, K., Rockström, J., Schellnhuber, H. J., Dube, O. P., Dutreuil, S., et al. (2020). The emergence and evolution of Earth system science. Nat. Rev. Earth Environ. 1 (1), 54–63. doi:10.1038/s43017-019-0005-6
Sun, R., Jin, X., Han, B., Liang, X., Zhang, X., and Zhou, Y. (2022). Does scale matter? Analysis and measurement of ecosystem service supply and demand status based on ecological unit. Environ. Impact Assess. Rev. 95, 106785. doi:10.1016/j.eiar.2022.106785
Tozer, L., Hörschelmann, K., Anguelovski, I., Bulkeley, H., and Lazova, Y. (2020). Whose city? Whose nature? Towards inclusive nature-based solution governance. Cities 107, 102892. doi:10.1016/j.cities.2020.102892
Vanham, D., Leip, A., Galli, A., Kastner, T., Bruckner, M., Uwizeye, A., et al. (2019). Environmental footprint family to address local to planetary sustainability and deliver on the SDGs. Sci. Total Environ. 693, 133642. doi:10.1016/j.scitotenv.2019.133642
Villamagna, A. M., Angermeier, P. L., and Bennett, E. M. (2013). Capacity, pressure, demand, and flow: A conceptual framework for analyzing ecosystem service provision and delivery. Ecol. Complex. 15, 114–121. doi:10.1016/j.ecocom.2013.07.004
Wang, C., Wang, L., Zhan, J., Liu, W., Teng, Y., Chu, X., et al. (2022a). Spatial heterogeneity of urbanization impacts on ecosystem services in the urban agglomerations along the Yellow River, China. Ecol. Eng. 182, 106717. doi:10.1016/j.ecoleng.2022.106717
Wang, J., Zhai, T., Lin, Y., Kong, X., and He, T. (2019). Spatial imbalance and changes in supply and demand of ecosystem services in China. Sci. Total Environ. 657, 781–791. doi:10.1016/j.scitotenv.2018.12.080
Wang, L.-J., Gong, J.-W., Ma, S., Wu, S., Zhang, X., and Jiang, J. (2022b). Ecosystem service supply–demand and socioecological drivers at different spatial scales in Zhejiang Province, China. Ecol. Indic. 140, 109058. doi:10.1016/j.ecolind.2022.109058
Wang, S.-r., Meng, W., Jin, X.-c., Zheng, B.-h., Zhang, L., and Xi, H.-y. (2015). Ecological security problems of the major key lakes in China. Environ. Earth Sci. 74 (5), 3825–3837. doi:10.1007/s12665-015-4191-3
Wang, S., Ma, H., and Zhao, Y. (2014). Exploring the relationship between urbanization and the eco-environment—a case study of beijing–tianjin–hebei region. Ecol. Indic. 45, 171–183. doi:10.1016/j.ecolind.2014.04.006
Waters, C. N., Zalasiewicz, J., Summerhayes, C., Barnosky, A. D., Poirier, C., Gałuszka, A., et al. (2016). The Anthropocene is functionally and stratigraphically distinct from the Holocene. Science 351 (6269), aad2622. doi:10.1126/science.aad2622
Wei, H., Fan, W., Wang, X., Lu, N., Dong, X., Zhao, Y., et al. (2017). Integrating supply and social demand in ecosystem services assessment: A review. Ecosyst. Serv. 25, 15–27. doi:10.1016/j.ecoser.2017.03.017
Wei, Y., Wu, S., Jiang, C., and Feng, X. (2021). Managing supply and demand of ecosystem services in dryland catchments. Curr. Opin. Environ. Sustain. 48, 10–16. doi:10.1016/j.cosust.2020.08.007
Wu, J. (2013). Landscape sustainability science: Ecosystem services and human well-being in changing landscapes. Landsc. Ecol. 28 (6), 999–1023. doi:10.1007/s10980-013-9894-9
Wu, X., Liu, S., Zhao, S., Hou, X., Xu, J., Dong, S., et al. (2019). Quantification and driving force analysis of ecosystem services supply, demand and balance in China. Sci. Total Environ. 652, 1375–1386. doi:10.1016/j.scitotenv.2018.10.329
Xie, G., Zhang, C., Zhen, L., and Zhang, L. (2017). Dynamic changes in the value of China’s ecosystem services. Ecosyst. Serv. 26, 146–154. doi:10.1016/j.ecoser.2017.06.010
Xing, L., Zhu, Y., and Wang, J. (2021). Spatial spillover effects of urbanization on ecosystem services value in Chinese cities. Ecol. Indic. 121, 107028. doi:10.1016/j.ecolind.2020.107028
Xu, J., Chen, J., and Liu, Y. (2020). Partitioned responses of ecosystem services and their tradeoffs to human activities in the Belt and Road region. J. Clean. Prod. 276, 123205. doi:10.1016/j.jclepro.2020.123205
Yona, L., Cashore, B., Jackson, R. B., Ometto, J., and Bradford, M. A. (2020). Refining national greenhouse gas inventories. Ambio 49 (10), 1581–1586. doi:10.1007/s13280-019-01312-9
Yoon, J., Klassert, C., Selby, P., Lachaut, T., Knox, S., Avisse, N., et al. (2021). A coupled human–natural system analysis of freshwater security under climate and population change. Proc. Natl. Acad. Sci. U. S. A. 118 (14), e2020431118. doi:10.1073/pnas.2020431118
Yu, Y., Feng, K., and Hubacek, K. (2013). Tele-connecting local consumption to global land use. Glob. Environ. Change 23 (5), 1178–1186. doi:10.1016/j.gloenvcha.2013.04.006
Zhai, T., Zhang, D., and Zhao, C. (2021). How to optimize ecological compensation to alleviate environmental injustice in different cities in the Yellow river basin? A case of integrating ecosystem service supply, demand and flow. Sustain. Cities Soc. 75, 103341. doi:10.1016/j.scs.2021.103341
Zhang, H., Jiang, C., Wang, Y., Zhao, Y., Gong, Q., Wang, J., et al. (2022a). Linking land degradation and restoration to ecosystem services balance by identifying landscape drivers: Insights from the globally largest loess deposit area. Environ. Sci. Pollut. Res. Int. doi:10.1007/s11356-022-21707-8
Zhang, Z., Hu, B., and Qiu, H. (2022b). Comprehensive evaluation of resource and environmental carrying capacity based on SDGs perspective and Three-dimensional Balance Model. Ecol. Indic. 138, 108788. doi:10.1016/j.ecolind.2022.108788
Zhou, L., Zhang, H., Bi, G., Su, K., Wang, L., Chen, H., et al. (2022). Multiscale perspective research on the evolution characteristics of the ecosystem services supply-demand relationship in the chongqing section of the three gorges reservoir area. Ecol. Indic. 142, 109227. doi:10.1016/j.ecolind.2022.109227
Keywords: coupled human and natural systems, sustainability assessment, ecosystem service values, human demand, social-ecological systems, human-environment complexity, trade-off and synergy, China
Citation: Liu H, Xing L, Wang C and Zhang H (2022) Sustainability assessment of coupled human and natural systems from the perspective of the supply and demand of ecosystem services. Front. Earth Sci. 10:1025787. doi: 10.3389/feart.2022.1025787
Received: 23 August 2022; Accepted: 26 September 2022;
Published: 07 October 2022.
Edited by:
Qingxu Huang, Beijing Normal University, ChinaReviewed by:
Jingwei Li, Shanghai Normal University, ChinaCopyright © 2022 Liu, Xing, Wang and Zhang. This is an open-access article distributed under the terms of the Creative Commons Attribution License (CC BY). The use, distribution or reproduction in other forums is permitted, provided the original author(s) and the copyright owner(s) are credited and that the original publication in this journal is cited, in accordance with accepted academic practice. No use, distribution or reproduction is permitted which does not comply with these terms.
*Correspondence: Lu Xing, c2hpbmdsdTEyMDVAbmp1c3QuZWR1LmNu
Disclaimer: All claims expressed in this article are solely those of the authors and do not necessarily represent those of their affiliated organizations, or those of the publisher, the editors and the reviewers. Any product that may be evaluated in this article or claim that may be made by its manufacturer is not guaranteed or endorsed by the publisher.
Research integrity at Frontiers
Learn more about the work of our research integrity team to safeguard the quality of each article we publish.