 Douzhong Zhang1,2
 Jiguang Tang
94% of researchers rate our articles as excellent or good
Learn more about the work of our research integrity team to safeguard the quality of each article we publish.
Find out more
ORIGINAL RESEARCH article
Front. Earth Sci. , 20 September 2022
Sec. Structural Geology and Tectonics
Volume 10 - 2022 | https://doi.org/10.3389/feart.2022.1024748
This article is part of the Research Topic Quantitative Characterization and Engineering Application of Pores and Fractures of Different Scales in Unconventional Reservoirs – Volume II View all 39 articles
Shale is a low-porosity and low-permeability reservoir, and structural fractures are the main controlling factor for the migration and accumulation of shale gas. Moreover, tectonic fractures are controlled by the paleo-tectonic stress field. In this paper, taking the Longmaxi Formation of the Lintanchang area as an example, the finite element numerical simulation technology is used to analyze the distribution law of the paleo-tectonic stress field, and further, the fracture development areas under the superposition of two periods of tectonic stress are predicted using seismic, rock mechanics, and field data. The results show that the tectonic fractures developed in the Lintanchang area are mainly EW- and NNW-striking conjugate shear fractures formed in the Mid-Yanshanian period, followed by the NWW- and SWW-striking conjugate shear fractures formed in the late Yanshanian period. The distribution of tectonic fractures is affected by faults, folds, rock physical parameters and tectonic stresses. It is found that the comprehensive fracture coefficients of the anticline core and fault areas are both greater than 1.1, which are the areas with the most developed structural fractures, and these areas have poor shale gas preservation conditions. However, the comprehensive fracture coefficients of the western flanks of the anticline and the eastern and western dipping ends are between 1.0 and 1.1, which are areas with better shale gas preservation conditions. In addition, the development degree of tectonic fractures in the east and northwest areas of the Lintanchang anticline is lower than that in other areas. The comprehensive fracture coefficients of shale in these areas are between 0.9 and 1.0. The shale is in a state of “breaking without cracking”, and shale gas can be well preserved.
With the rapid development of global oil and gas exploration and development technologies, shale gas occupies an important position in the world and has attracted the attention of many countries (Jarvie et al., 2007; Pollastro, 2007; Ding et al., 2013; Melikoglu, 2014; Pireh et al., 2015). The Sichuan Basin is an important area for shale gas exploration and development in China. By 2021, the proven shale gas reserves exceeded 2×10¹² m3 (Zhang and Zhu, 2006; Guo and Zhang, 2014). The Lintanchang area is located in the eastern part of the Sichuan Basin and is a hot spot for shale gas exploration and development in the basin. The area is rich in shale gas reserves (Nie et al., 2021).
Low-porosity and low-permeability shale gas reservoirs have the characteristics of self-generation and self-storage of hydrocarbons, so structural fractures have become the main migration channels and important accumulation spaces of shale gas (Tingay et al., 2009; Lemonnier and Bourbiaux, 2010; Hennings et al., 2012; Yang et al., 2016). Predicting fracture-developed areas in shale reservoirs can significantly improve the exploration and development efficiency of shale gas (Montgomery et al., 2005; Bowker, 2007; Zeng et al., 2016). Structural fractures are an important fracture type in shale reservoirs, and the paleo-tectonic stress field controls the development of structural fractures. This is because fractures are mainly formed under the most intense period of tectonic stress activity. Intense tectonic activity causes the rock to undergo shear or conjugate shear ruptures along the direction of the maximum principal stress. The paleo-tectonic stress field controls the tectonic deformation, the development of faults and tectonic fractures. Numerical simulation based on the paleo-tectonic stress fields can effectively predict the development degree of tectonic fractures (Wei et al., 2019). Many scholars worldwide have carried out the prediction of structural fractures (Wclennan et al., 2009; Laubach et al., 2018; Milad et al., 2018; Liu C et al., 2019). These studies include logging analysis, imaging logging, seismic data inversion techniques, and numerical simulation of stress fields (Li, 2022; Li and Li., 2021; Qie et al., 2021; Ren et al., 2020; Wu et al., 2017; Xue et al., 2021; Zhao et al., 2021). Well logging analysis and imaging logging have high fracture prediction accuracy in a single well, but they cannot predict the planar distribution of fractures. Seismic data cannot effectively identify fractures affected by the resolution (Milad and Slatt, 2017). The numerical simulation of tectonic stress field is based on the theory of geomechanics and can be well applied to the evaluation of fracture development (Zeng et al., 2010; Liu D et al., 2019). The prediction of fractures via tectonic stress field simulation is based on geomechanical theory. The accumulation of tectonic stress causes rock deformation and ruptures. Based on the finite element method, the reservoir rock is divided into a series of finite elements, and the stress is transferred between the finite elements. When the stress exceeds the limit that the rock can bear, fractures will develop.
In this paper, taking the Longmaxi Formation shale in the Lintanchang area as an example, the finite element numerical simulation technology is used to analyze the distribution law of the paleo-tectonic stress fields, and further, the fracture development areas under the superposition of two periods of tectonic stress are predicted using seismic, rock mechanics, and field data. This study can provide a theoretical basis for the exploration and development of shale gas in the southern China.
The Lintanchang area is located in the fold structural belt in the southeastern margin of the Sichuan Basin. It is located in the transition zone between the northern Guizhou Fold Belt and the southern margin of the Sichuan Basin. The east part of this area is the Mesozoic Jiangnan Xuefeng Thrust Belt, the south part is in contact with the Early Paleozoic mid-Guizhou Uplift, and the north part is connected with the “Sichuan Basin” of the third subsidence belt of the Neocathaysian Tectonic System (Li C et al., 2011) (Figure 1A). The main tectonic pattern in the Lintanchang area is controlled by the compressive tectonic stress field in the SE-NW direction caused by the intracontinental orogeny of the Xuefeng Uplift. Previous chronological studies on the Lintanchang and its surrounding areas show that (Li S et al., 2011; Deng et al., 2013), the Lintanchang area experienced the early Mid-Yanshanian (Jurassic) and late Mid-Yanshanian (Early Cretaceous), late Yanshanian (late Cretaceous), and Himalayan (Paleogene-Quaternary) tectonic movements. Among them, the tectonic stress in the Middle and Late Yanshanian is the strongest. This period is the formation period of the structures in the Lintanchang area (Wang et al., 2017; Fang et al., 2018). The spatial distribution of faults in the study area is mainly divided into NE and near-EW-trending fault systems (Figure 1B). In this study, the research object is the Silurian Longmaxi Formation shale. Clay siliceous shale is mainly developed in the Longmaxi Formation (Shi et al., 2019) (Figure 2). In addition, thrust structures are developed in the Longmaxi Formation (Figure 1C). Intense tectonic deformation resulted in the development of fractures in the Longmaxi Formation shale in the study area. The controlling factors of fracture development include environmental tectonic stress and a large number of brittle minerals inside the shale. The fracture density in the shale of the Longmaxi Formation is usually distributed in the range of 3–15/m.
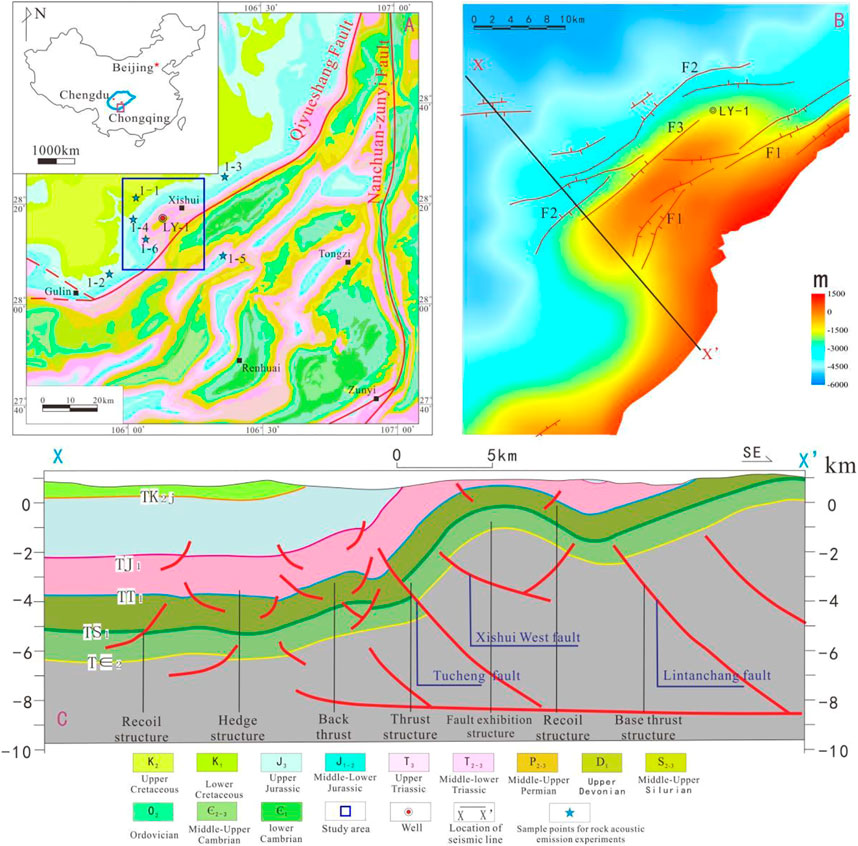
FIGURE 1. Regional structure of Lintanchang Area in eastern Sichuan Basin. Notes: (A) Geological map of Lintanchang area and adjacent areas in east Sichuan Basin (F1: Lintanchang Fault; F2: Tucheng Fault; F3: Xishuixi Fault); (B) Structure of the bottom surface of the Ordovician Wufeng Formation in the Lintanchang area; (C) Seismic interpretation profile of line X-X'.
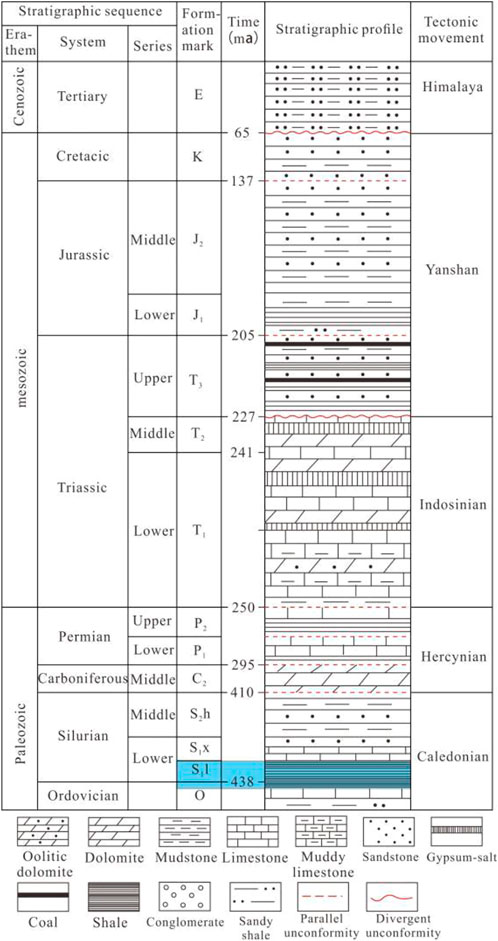
FIGURE 2. Stratigraphic systems and tectonic activities in the study area.
There are many factors affecting the paleo-tectonic stress field, including the tectonic pattern, direction and magnitude of tectonic stress, and rock mechanical properties (Timoshenko and Goodier, 1951; Laurent and Frantz, 2006; Wu et al., 2017). Generally, the stress in the core of an anticline structure is larger, and the stress in the rock with a high elastic modulus is larger. In this study, the ANSYS Software was used to carry out numerical simulation of tectonic stress fields in the target layer. The numerical simulation of tectonic stress field mainly includes: 1) geological model, 2) mechanical model, 3) mathematical model, and 4) fitting of numerical simulation results.
Geological model is the basic model for numerical simulation of tectonic stress fields. From the analysis of paleo-tectonic stress, it can be concluded that the key tectonic deformation periods are the late Mid-Yanshanian and late Yanshanian periods (Deng et al., 2013; Ju et al., 2019; Li, 2022). The Himalayan tectonic activity had little effect on the tectonic pattern and the development of tectonic fractures in the study area (Figures 3A,B).
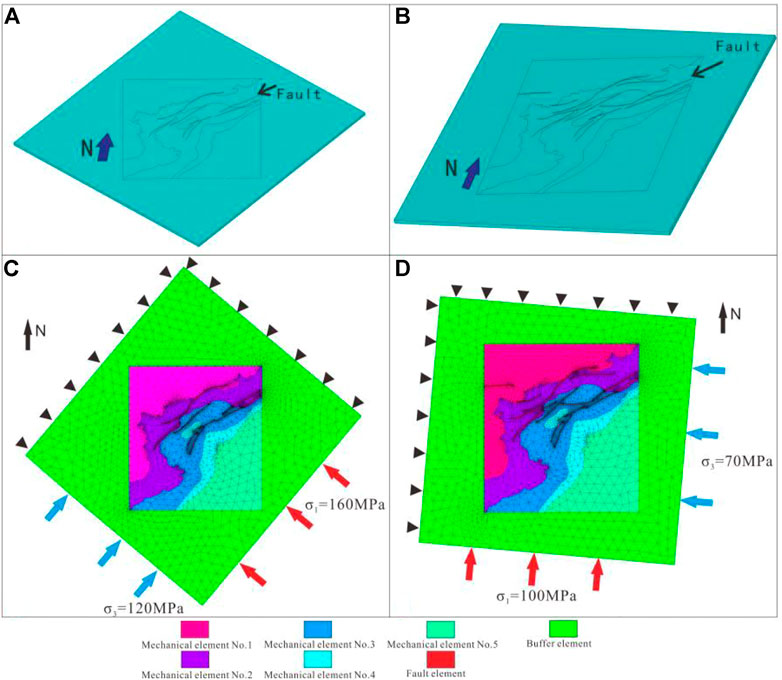
FIGURE 3. Finite element model of the target layer. (A) Middle Yanshanian geological model; (B) Late Yanshanian geological model; (C) Grid model and loading conditions in Middle Yanshanian; (D) Grid model and loading conditions in late Yanshanian.
On the basis of the geological model, the geological unit is assigned with rock mechanical parameters (elastic modulus, Poisson’s ratio) and the mechanical model is obtained (Eissa and Kazi., 1988; Kuhlman, 1993). Based on the triaxial rock mechanics experiment, the dynamic and static parameter conversion formulas of the target layer are obtained (Formulas 1 and 2):
In the formula, ES is the static Young’s modulus (GPa); Ed is the dynamic Young’s modulus (GPa); μS is the static Poisson’s ratio; μd is the dynamic Poisson’s ratio.
Due to the large differences in the distribution of static Young’s modulus and Poisson’s ratio in the region, different mechanical units are divided according to the distribution trend of rock mechanical parameters. Meanwhile, the average Young’s modulus and equivalent Poisson’s ratio of rocks in different regions are calculated (Table 1). The rock mechanical parameters of the fault are generally selected as 50–70% of the Young’s modulus of the surrounding rock; while the Poisson’s ratio of the fault zone is 0.02–0.1 larger than that of the normal depositional area (Fischer and Henk, 2013; Jiu et al., 2013).
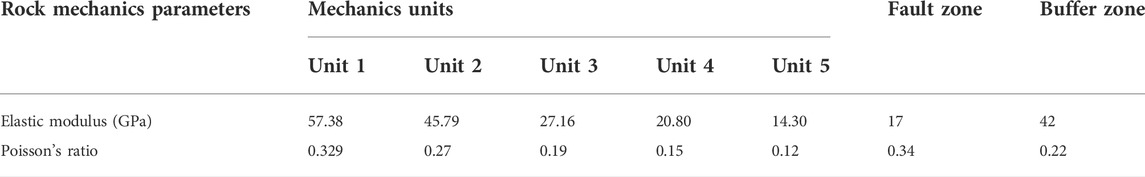
TABLE 1. Rock mechanical properties of shale in Lintanchang area of eastern Sichuan Basin.
The established model is meshed by ANSYS Software, and the mesh type is mainly tetrahedral element type with 10 nodes. The Mid-Yanshanian model has a total of 31,288 nodes and 15,593 elements, and the Late Yanshanian model has a total of 45,195 nodes and 22,548 elements. After many simulations and inversions, in the mid-Yanshanian model, the maximum principal stress is applied from the 130° direction at 165 Ma, and the minimum principal stress is applied from the 220° direction at 120 MPa. In the late Yanshanian period, the maximum principal stress was applied from the 185° direction at 100 Ma, and the minimum principal stress was applied from the 95° direction at 70 MPa. The obtained simulation results are in good agreement with the actual results (Figures 3C,D).
When subjected to stress, any nodes in the model will be displaced, and its displacement in the three directions of x, y, and z can be expressed as u, v, w, and their matrix forms are as follows:
In the formula, a1, a2, a3, b1, b2, b3, c1, c2, c3, d1, d2, d3 are matrix coefficients.
Based on the elastic equation, the relationship between the displacement and deformation of the elements is as follows:
In the formula, εx, εy, εz are the linear strain components; γxy, γxz, γyz are the shear strain components in the model deformation.
The relationship between strain and node displacement matrix can be simplified as follows:
In the formula, B is the geometric matrix; δ is the node displacement matrix.
Based on the elastic mechanics properties, the relationship between stress and strain is as follows:
In the formula, δx, δy, δz are normal stress components; τxy, τyz, τxz are shear stress components; E is elastic modulus; μ is Poisson’s ratio; G is shear modulus.
The simplified formula is as follows:
[D] is the elastic matrix.
The shale of the Silurian Longmaxi Formation in the Lintanchang area has high content of brittle minerals such as quartz and feldspar, and is easy to form structural fractures (Shi et al., 2019). Structural fractures formed under tensile stresses can be predicted by the Griffith fracture criterion, and shear fractures formed by compressive stress can be predicted by the Mohr-Coulomb fracture criterion (Rybacki et al., 2016).
The Griffith fracture criterion is a tensile fracture criterion for brittle objects (Griffith, 1921). Griffith believes that there are many fine fractures inside the material. When subjected to external tensile stress, the damage of the material generally starts from the end of the seam and gradually extends until the material ruptures. The Griffith rupture criterion formula is as follows:
When σ1+3σ3≥0, the formula is:
When σ1+3σ3≤0, the formula is:
where σ1, σ2 and σ3 are the maximum, intermediate and minimum principal stresses, respectively, and σT is the tensile stress.
The basis of the Moore-Coulomb criterion theory is that the fracture of rock is mainly shear failure on a certain surface, and this shear failure is related to the relative state of the normal stress σn and shear stress τn on the surface (Dai and Meng, 1999). The formula is as follows:
In order to quantitatively predict the development degree of shear fractures in the reservoir, the shear fracture coefficient S is introduced, and the expression is:
S is the shear rupture coefficient of shear stress, MPa; τn is the shear strength of the rock, MPa.
In order to express the shear rupture coefficient S more clearly, the conversion formula is:
When S>1, the rock will form shear fracture.
The expression for tensile rupture rate is:
Where T is the tensile fracture rate, σT is the effective tensile stress, and σt is the rock tensile strength.
When T>1, the rock will form tensile fracture.
According to the field-measured structural fractures and the observation statistics of core fractures in Well LY-1, 90% are mainly shear fractures and 10% are extensional fractures in the Lintanchang area. The fracture coefficient I is used as the criterion for judging the degree of fracture development (Wu et al., 2017), and the formula is as follows:
In the formula, a is the proportion of shear fractures, and b is the proportion of tensile fractures.
According to the principle of rock mechanics, when K<1, no obvious fractures will be formed inside the rock; when K=1, fine fractures will gradually appear inside the rock; when K>1, the fine fractures inside the rock will expand accordingly, and connected to each other, forming large fractures.
From the tectonic deformation and tectonic evolution, it can be seen that the tectonic activity in the study area was the strongest in the Mid-Yanshanian period, followed by the late Yanshanian period. Therefore, the fracture development probability-shear rupture coefficient (S) in the Lintanchang area is mainly related to the tectonic activities of the Middle and the Late Yanshanian. The superposition method is used to obtain the comprehensive rupture coefficient, that is, the rupture coefficients of the two periods are superimposed, and the maximum value of them is taken as the evaluation parameter of the comprehensive rupture coefficient.
According to the contact conditions of strata in the Lintanchang area, the characteristics of multi-phase joint structures and the results of analysis and testing experiments, the evolution process of the paleo-faults in the study area was restored. The paleo-tectonic stress field controls the structural shape of the strata, so the direction of paleo-tectonic stress can generally be restored by fault strike, fold strike, joint, and lamella (Ju et al., 2017). The north-south (nearly north-west) and east-west structures are in a composite relationship. Folds in both directions form distinct “ten”, “S" and “T" shapes across the superimposed folds, and north-south faults cut east-west folds. The NW-trending structure is restricted to the north by the E-W-trending anticline, indicating that the N-S-trending tectonic system in the area was formed a little later than the E-W-trending tectonic system (Figure 4). The phenomenon of joint cutting was observed in the field observation Z-4 point. The SW-trending conjugate shear joints cut the SEE-trending conjugate shear joints, proving that the formation of the north-south structure was later than that of the nearly east-west structure (Figure 5). The maximum principal stress (σ1) direction of the recovery of conjugate shear joints is counted. It can be seen that the number of joints formed in the σ1 direction is the largest in the direction of 120°–140°, followed by the joints in the direction of 350°–20°, and the ratio of thm is 13:7.
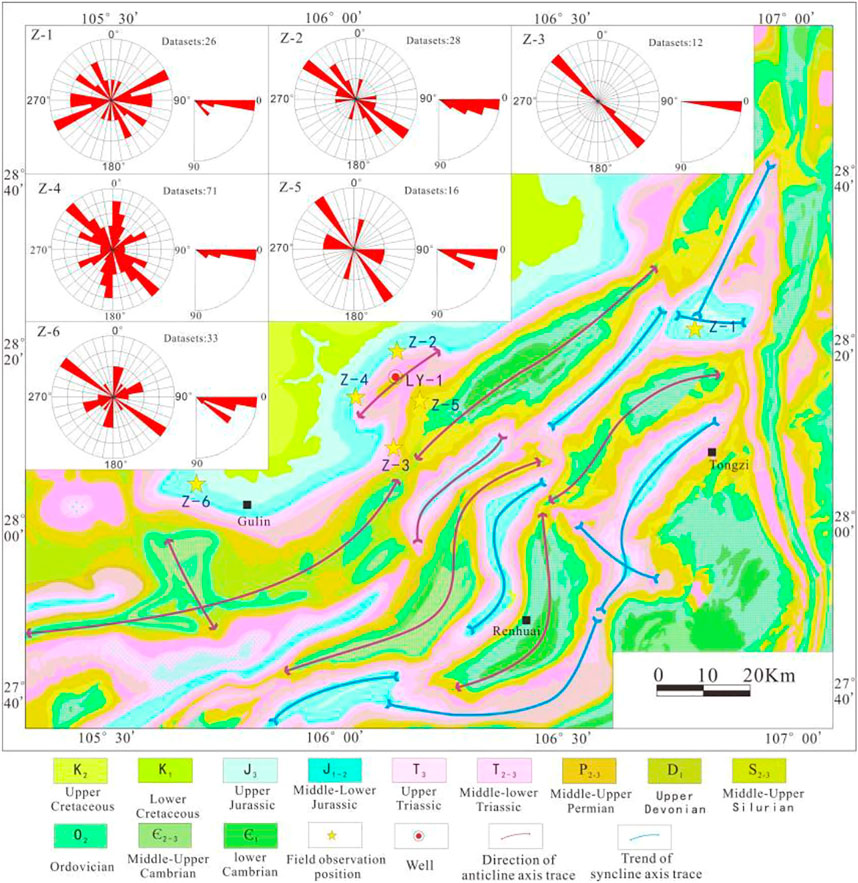
FIGURE 4. Direction of maximum principal stress (σ1) restored by fault scratches and joints in Lintanchang area.
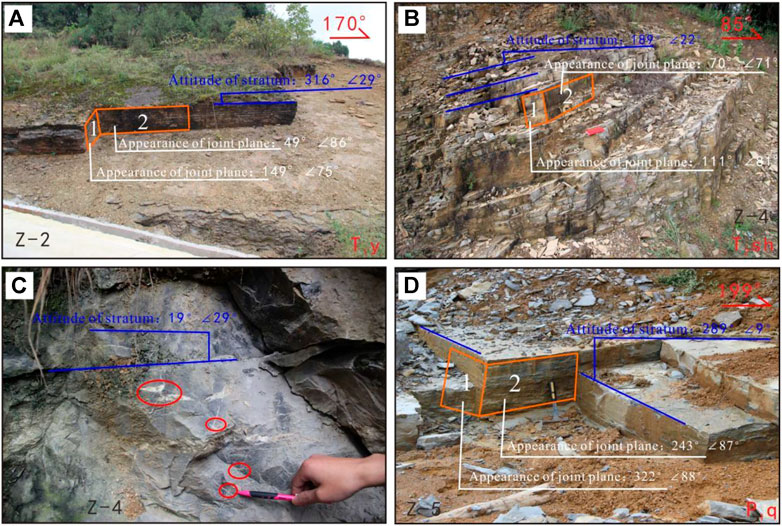
FIGURE 5. Photos of shale outcrops in Lintanchang area. (A) Observation point Z-2; (B) observation point Z-4; (C) observation point Z-4; (D) observation point Z-5.
Through field geological survey of Lintanchang and surrounding areas, 186 groups of conjugate shear joint occurrence and fault scratch occurrence data were measured. After the formation was leveled layer by layer, the direction of maximum principal stress was plotted and a rosette diagram was drawn (Figure 4). According to statistics, since the Mesozoic in the study area, the two main tectonic stress directions are as follows:
(1) SEE-NW compressive stress field of the first stage: It is the NW compressive stress produced by intracontinental orogeny, and the maximum principal stress direction (σ1) is about 120°–140°.
(2) The near-north-south compressive stress field of the second stage: The continuous NW-trending pushing of Xuefeng Mountain resulted in a strong left-lateral strike-slip movement of the Ziyun-Luodian Fault. The central area of Guizhou was strongly wedged into the Daloushan area, forming an arc-shaped outward extrusion. Furthermore, it forms a nearly north-south compressive stress in the study area, and the maximum principal stress direction (σ1) is about 350°–20°.
When the rock is under stress, a micro-fracture system that is adapted to the magnitude and direction of the force will be generated in its internal structure. In tectonic mechanics, such microscopic fractures are called Griffith fractures. When the rock mass is subjected to stress equal to or greater than the previous stress, the Kaiser points of rock acoustic emission counts will appear (Lshida, 2001; Zeng and Liu., 2010). Acoustic emission experiments can reflect the previous stress state, and then paleo-tectonic stress data are obtained (Guo et al., 2016; Ju and Sun, 2016). Seven samples were collected from strata in different periods in the study area. The test results show that the Triassic samples (T1m, T1y) have mainly experienced five periods of tectonic stresses since the Mesozoic (Triassic) (Figure 6). However, the Jurassic samples (J2sn, J3p) recorded three periods of tectonic movements in the late Mid-Yanshanian and later periods (Figure 6). The Cretaceous sample (K2j1) formed in the Late Yanshanianhave mainly experienced two periods of tectonic stresses (Late Yanshanian and Himalayas) (Figure 6). The test equipment is a TAW-1000 hydraulic servo experimental system and an AE acoustic emission detector. Three standard 25 mm × 50 mm cylindrical samples were taken in each of the X, Y and XY45° directions of the sample, and the experimental confining pressure was 30 MPa. The setting of confining pressure is determined according to the ancient burial depth and overpressure. The difference between the stress caused by the ancient burial depth and the overpressure is 30 MPa.
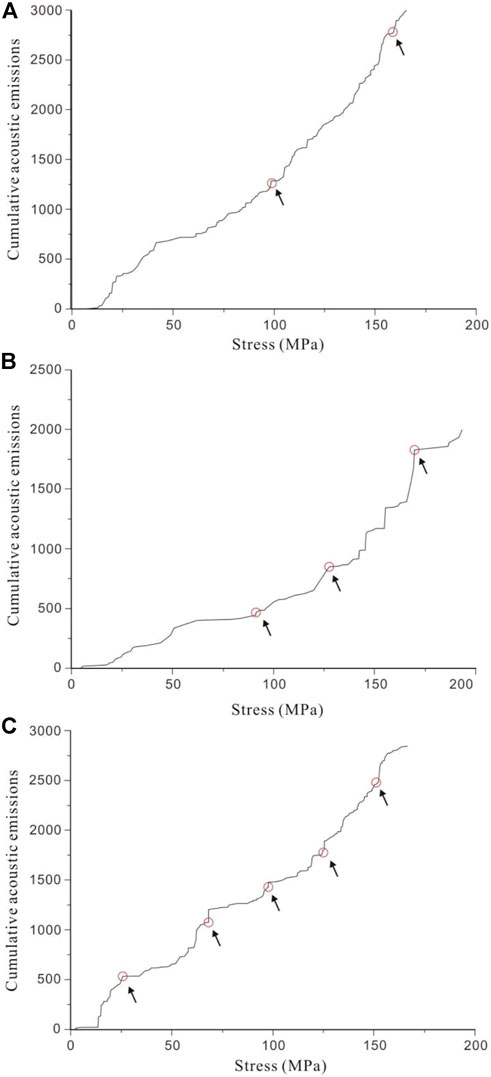
FIGURE 6. Acoustic emission experimental curves of shale samples (The sampling location is shown in Figure 1; (A): Sample No. 1-1, Cretaceous sample; (B): Sample No. 1-4, Jurassic sample; (C): Sample No. 1-6, Triassic sample).
Combined with the apatite fission track experiments (Figure 7) (Deng et al., 2013) and the results of the acoustic emission experiments in this study, the tectonic activity stages were analyzed. It can be seen that the late Mid-Yanshanian and the late Yanshanian periods are the main tectonic transformation periods in the Lintanchang area. The maximum principal stress range at the end of the Mid-Yanshanian period is 156.15–170.65 MPa, and the minimum principal stress range is 119.68–158.93 MPa; the maximum principal stress range in the late Yanshanian period was 127.26–164.39 MPa, and the minimum principal stress range was 95.21–157.64 MPa (Table 2).
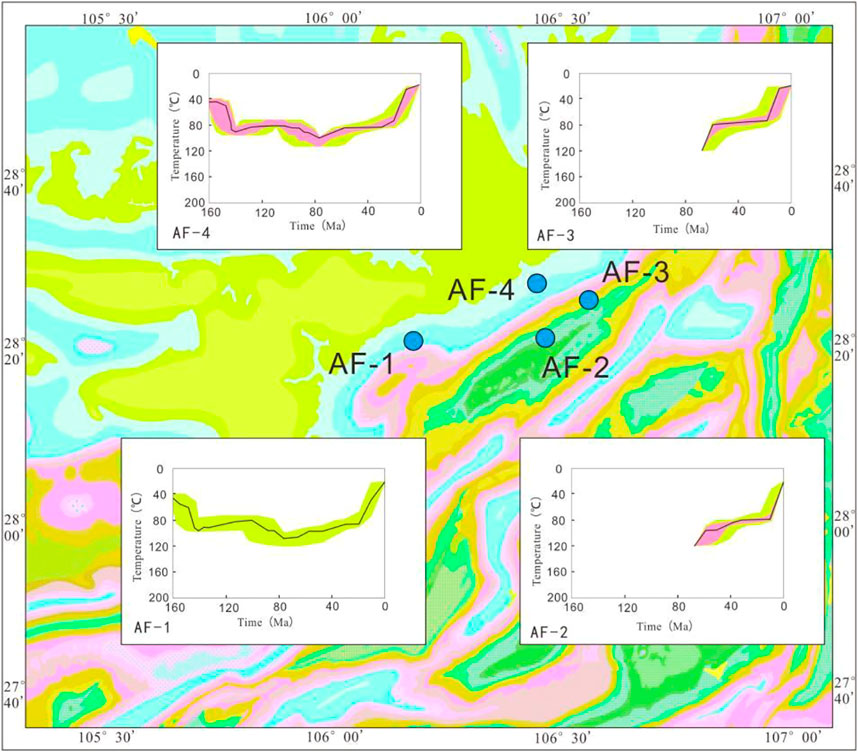
FIGURE 7. Thermal history simulation of apatite fission tracks in Lintanchang area (according to Deng et al., 2013).
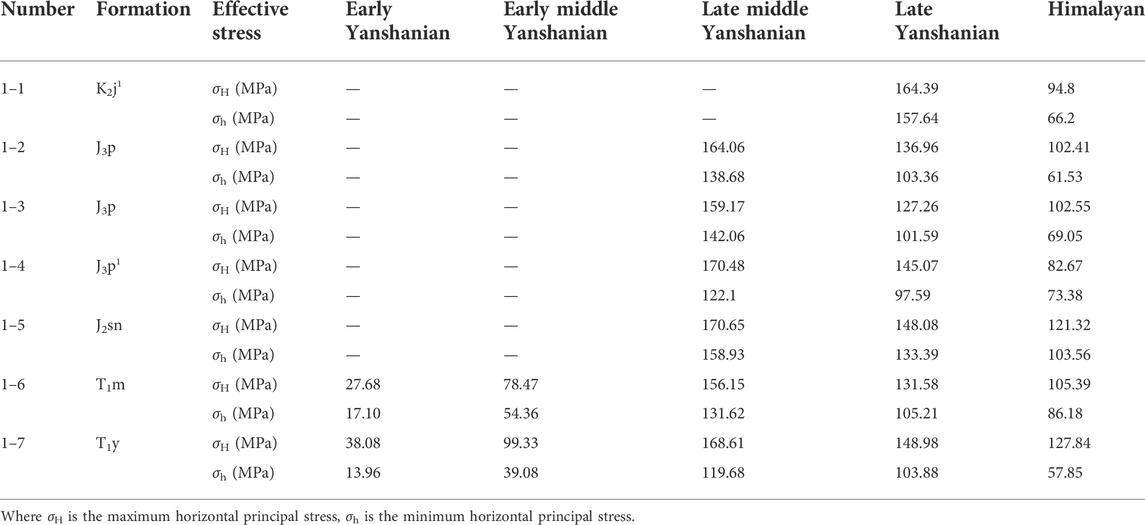
TABLE 2. Test results of rock acoustic emission experiments in Lintanchang area of East Sichuan Basin.
From the analysis of the paleo-tectonic stress field in the area, it can be seen that in the early period of the Mid-Yanshanian, the study area was affected by the Xuefeng Orogenic Movement, and the SE-NW compressive stress field began to form in the area, and the stress was relatively small in this period. With the increase of the influence of Xuefeng Orogeny, the stress value of the study area also gradually increased. At the end of the Mid-Yanshanian period, the stress reached the maximum value, forming the main tectonic pattern along the northeast direction of the study area. In the late Yanshanian period, the stress environment in the study area changed to S-N extrusion, and nearly EW-trending folds and faults were formed in the area. During the Himalayan period, the strata in the area were uplifted as a whole, and the tectonic pattern did not change (Figure 8).
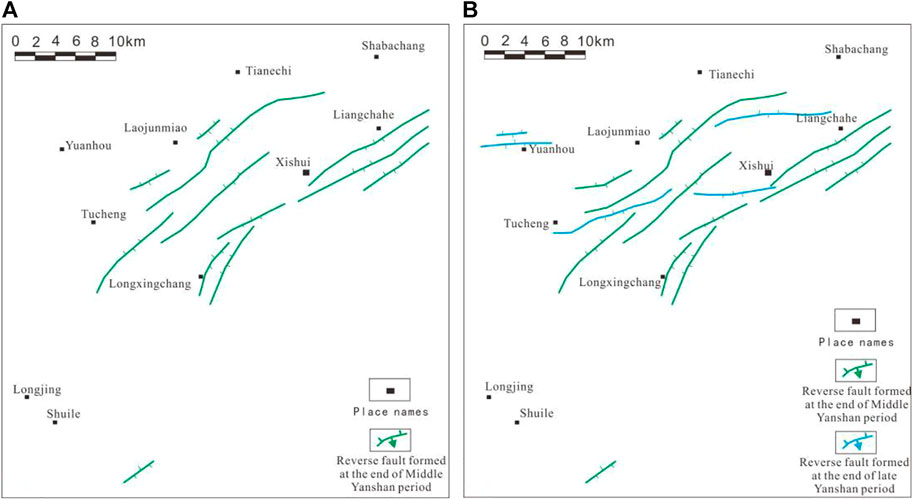
FIGURE 8. Evolution of paleo-faults in Lintanchang area ((A): end of Middle Yanshanian, (B) end of late Yanshanian).
Compared with the experimental data of rock acoustic emission in the study, the deviation rates of the maximum principal stress and the minimum principal stress of the two-phase simulation results from the measured values are mostly below 10%. The maximum deviation value is 13.73 MPa. The deviation rate of differential stress is basically below 10%, and the maximum deviation value is 5.13 MPa, which is within a reasonable deviation range (Table 3). According to comprehensive analysis (An et al., 1998; Shan et al., 2004; Meng et al., 2009), the numerical simulation results conform to the actual geological laws.
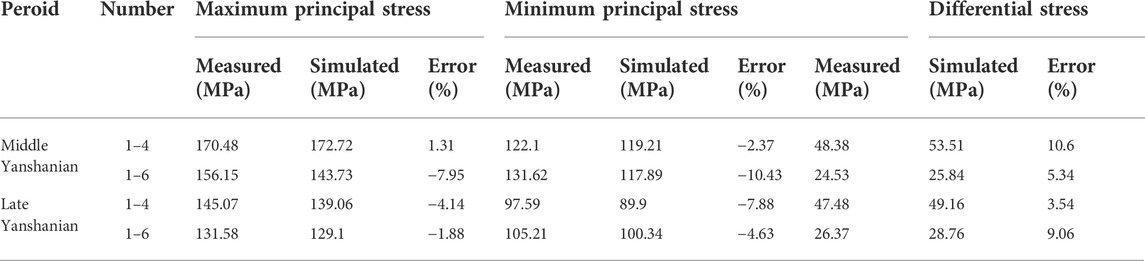
TABLE 3. Comparison of tested and simulated results of paleo-tectonic stress field.
The simulation results of the maximum horizontal principal stress (Figure 9A) show that the maximum principal stress of the Longmaxi Formation shale in the Lintanchang area of the Mid-Yanshanian period is concentrated at 94.09–236.23 MPa. A high value area of maximum principal compressive stress surrounding the anticline is formed in the north, south and west directions. The internal stress of the anticline core is relatively low, followed by the vicinity of the fault zone. The stress is distributed along the southwest-northeast trend of the fault zone with low values. The maximum horizontal principal stress is the lowest in the Lintanchang Anticline core, and its magnitude is 94.09–110 MPa. At the same time, the stress in the basin gradually increases along the dip of the wing, and the stress gradient has a significant correlation with the formation dip. Affected by the NE-trending fault, the maximum principal stress of the fault zone is lower than that of the surrounding strata. The distribution of this low-value zone is obviously banded along the fault strike, and the maximum principal stress of the foot wall is higher than that of the upper wall. In addition, the greater the fault strength, the greater the maximum principal stress gradient. At the end and turning point of the fault, the stress field is enriched to form a stress high value area.
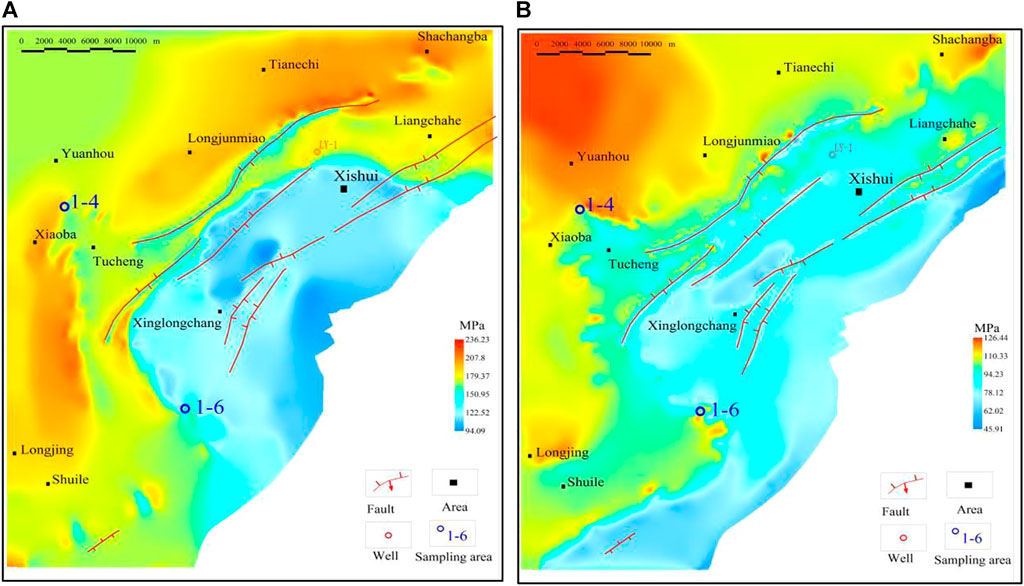
FIGURE 9. Numerical simulation results of paleo-tectonic stress field in Lintanchang area during the Middle Yanshanian period ((A): maximum principal stress; (B) minimum principal stress).
During the Mid-Yanshanian period, the minimum principal stress of the Longmaxi Formation shale in the Lintanchang area was concentrated in the range of 45.91–126.44 MPa (Figure 9B). Similar to the influencing factors of the maximum horizontal principal stress distribution, the minimum horizontal principal stress distribution is also mainly controlled by the fault and depth. A high value area of minimum principal compressive stress surrounding the anticline is formed in the north, south and west directions. The core of the anticline and the vicinity of the fault zone are lower, and at the end of the fault and the turning point, the stress field is enriched to form a high stress area. Compared with the distribution of the maximum horizontal principal stress, the areas with high minimum horizontal principal stress in the Lintanchang area are in Longjunmiao-Yuanhou, Shabachang and Longjing areas, with the stress values ranging from 110 to 126.44 MPa.
In the Late Yanshanian period, the maximum principal stress of the target layer was concentrated at 82.37–167.93 MPa (Figure 10A). A high value area of maximum principal compressive stress is formed around the anticline in the south and west directions. The maximum horizontal principal stress is the lowest at the core of the Lintanchang Anticline, and its magnitude is 82.37–95 MPa. The maximum horizontal principal stress is the highest in the footwall of Xiaoba-Longjing and Tucheng Faults, and its distribution ranges from 150 to 167.93 MPa. In addition, the stress value in the area south of Yongle area is also high, which is distributed in a near-east-west direction. Affected by the preexisting NE trending faults and the EW trending faults formed in this period, the fault zones with different strikes and their nearby areas with high and low stress values are also different. The distribution of the stress field is obviously affected by the fault structures, and the stress of the foot wall is higher than that of the upper wall.
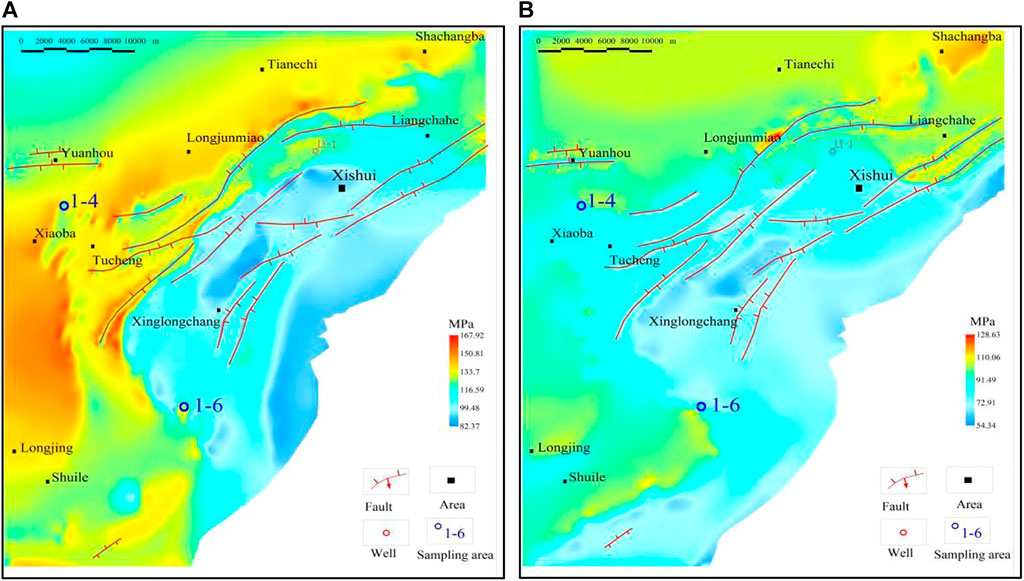
FIGURE 10. Numerical simulation results of the paleo-tectonic stress field in the Lintanchang area during the late Yanshanian period ((A): maximum principal stress; (B) minimum principal stress).
The minimum principal stress of the Longmaxi Formation shale in the Lintanchang area of the late Yanshanian period is concentrated in the range of 54.34–128.63 MPa (Figure 10B). The distribution of stresses is also controlled by faults and depth. The areas with high minimum principal compressive stress are located in the north and southwest of the anticline, and are lower near the core of the anticline and the fault zone. Compared with the distribution of the maximum horizontal principal stress, the high value area of the minimum horizontal principal stress in the Lintanchang area is located in the Shabachang area, which is distributed in a cluster shape, and its stress value is 110–128.63 MPa.
The paleo-tectonic stress field controls the development of tectonic fractures, and the direction of tectonic stress determines the development direction of tectonic fractures (Zeng et al., 2007). The development of tectonic fractures in the Lintanchang area is mainly controlled by the tectonic stress in the middle and late Yanshanian period, among which the fractures formed in the Mid-Yanshanian period are the main ones, followed by the late Yanshanian period. The direction of tectonic stress in the Mid-Yanshanian period is SE130°, and the direction of tectonic stress in the Late Yanshanian period is NNE5°. Therefore, the direction of structural fractures in the area is dominated by two sets of conjugate shear fractures of SSE and SEE strikings, followed by two sets of conjugate shear fractures of SSW and SEE strikings (Figure 11).
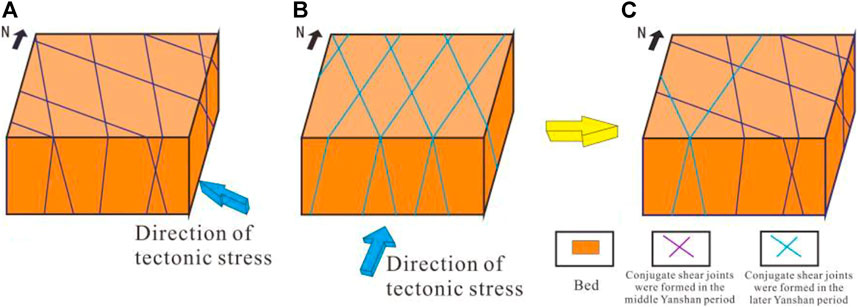
FIGURE 11. Developmental mode of conjugate shear fractures in Lintanchang Area. ((A): Striking of conjugate shear fractures formed in the Mid-Yanshanian period; (B) Striking of conjugate shear fractures formed in the Late Yanshanian period; (C) Distribution of conjugate shear fractures).
In the process of rock fracture, it is transformed from elastic to plastic deformation, and then rock fracture occurs. However, according to rock mechanics experiments, when the stress value of the rock reaches a certain level, small-scale hidden fractures will first appear in the rock. With the gradual increase of stress, the density of hidden fractures in the rock gradually increases, and gradually connects to form larger-scale fractures. When the rock fracture limit is reached, fractures appear in the rock. Therefore, the degree of fracture development in the rock gradually increases with the increase of pressure (Figure 12).
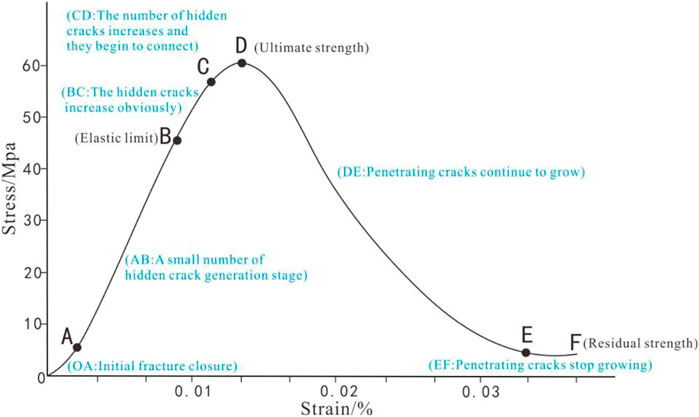
FIGURE 12. Relationship between stress and strain of shale sample.
For shale reservoirs, high fracture density is not conducive to the storage of shale gas. The high fracture density here refers to fractures near large-scale faults or open faults. Fractures are extremely developed in these areas, with a density of tens of fractures per meter. Extremely developed fractures and open faults caused the escape of natural gas. In this paper, based on petrophysical experiments and core observation data (Woodward, 1992; Wu et al., 2020), the development grades and fracture coefficient ranges of dominant fractures in shale reservoirs have been re-divided. The shear rupture coefficient S and the development of fractures are shown in Table 4.
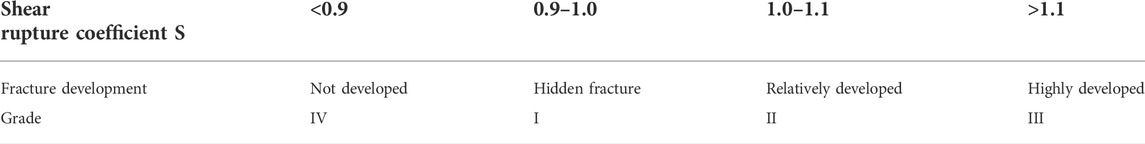
TABLE 4. Evaluation results of structural fracture development areas in shale reservoirs in Lintanchang Area.
The areas with the most developed structural fractures are located in the areas where the structural shear stress value is extremely large or small. The shear rupture coefficient S is larger in these regions. The greater the value of tectonic shear stress, the greater the degree of rock deformation. Moreover, the larger the shear rupture coefficient S, the more developed the structural fractures. In the fault distribution area, tectonic activity destroys the integrity of the rock formation. Then, the tectonic stress is partially released, and the tectonic shear stress value is very small. However, since there are many small (or associated) faults and joints in these areas, structural fractures are also relatively developed in these areas.
The prediction results of the fracture development degree in the east and west flanks of the Lintanchang Anticline are consistent with those observed in the field (Figure 13). The prediction results show that the comprehensive fracture rupture coefficient (K) in the area is between 0.8 and 1.3, and the distribution trend is greatly affected by the fault and structural position. The Grade I fracture development area is mainly distributed in the northwest of the area (the area of Shabachang-Swanchi-Longjunmiao) and the east flank of the Lintanchang Anticline. The grade II fracture development area is the most widely distributed, and it is mainly distributed in the west flank of the Lintanchang Anticline and the southern and northern dipping sections. The development areas of Grade III fractures are mainly the core area of the Lintanchang Anticline, the fault zone, and the east and south of the study area. However, the highest value of rupture coefficient is located in the fault zone, and the rupture coefficient in the fault zone is above 1.2. In addition, the rupture coefficients in the eastern and southern parts of the study area are between 1.1 and 1.2. The main fault has a larger influence on the fracture development area than other faults. The extent of the grade III fracture development zone at the endpoint and inflection point of the fault is larger than other areas of the fault. It is mainly caused by the stress concentration phenomenon in this area. The low value area of rupture coefficient is mainly distributed in the northwestern margin of the study area and the middle area of the fault. A fracture coefficient below 0.9 indicates a fracture-free zone. Since the tectonic stress is released in the fault region, the stress value in the middle region of adjacent faults decreases, and tectonic fractures do not develop.
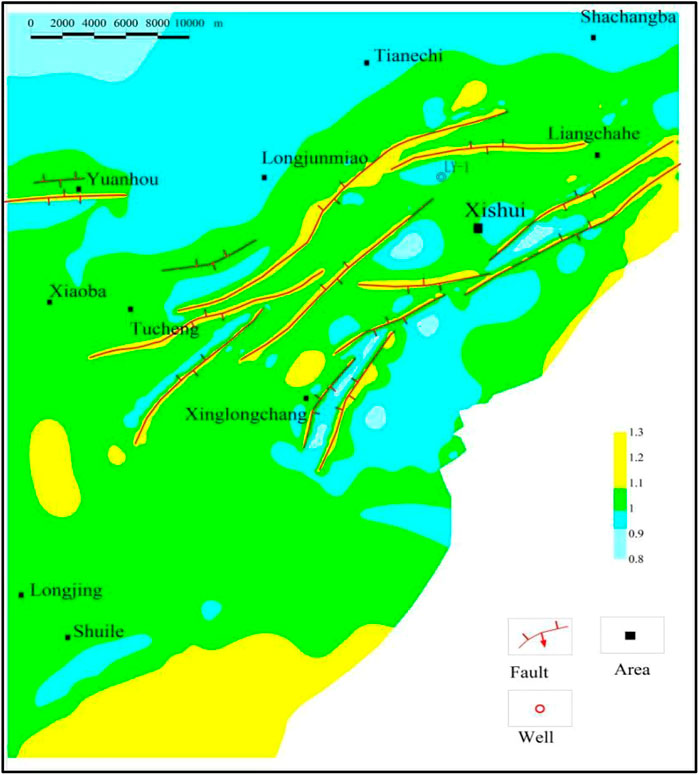
FIGURE 13. Prediction results of fracture development area in Lintanchang area.
(1) The tectonic fractures developed in the Lintanchang area of the Sichuan Basin are mainly EW- and NNW-striking conjugate shear fractures formed in the Mid-Yanshanian period, followed by the NWW- and SWW-striking conjugate shear fractures formed in the late Yanshanian period. The distribution of tectonic fractures is affected by faults, folds, rock physical parameters and tectonic stresses.
(2) The study area is affected by two periods of paleo-tectonic stress fields, their directions are 130° and 175°, and the maximum stress magnitudes are 165 and 100 MPa, respectively. The tectonic stress magnitude is mainly related to the burial depth, fault and tectonic position. According to the simulations, the maximum horizontal principal stress in the Mid-Yanshanian period is 94.09–236.23 MPa, and the minimum horizontal principal stress is 45.91–126.44 MPa. In the late Yanshanian period, the maximum horizontal principal stress is 82.37–167.93 MPa, and the minimum horizontal principal stress is 54.34–128.63 MPa.
(3) It is found that the comprehensive fracture coefficients of the anticline core and fault areas are both greater than 1.1, which are the areas with the most developed structural fractures, and these areas have poor shale gas preservation conditions. However, the comprehensive fracture coefficients of the western flank of the anticline and the eastern and western dipping ends are between 1.0 and 1.1, which are areas with better shale gas preservation conditions. In addition, the development degree of tectonic fractures in the east and northwest areas of the Lintanchang Anticline is lower than that in other areas. The comprehensive fracture coefficients of shale in these areas are between 0.9 and 1.0. The shale is in a state of “breaking without cracking”, and shale gas can be well preserved.
The original contributions presented in the study are included in the article/supplementary material, further inquiries can be directed to the corresponding author.
DZ and JT are responsible for the idea and writing of this paper and KC, KW, PZ, GH, and XT are responsible for the fracture data collection.
This research was funded by the project “Fine Structural Analysis and Shale Gas Preservation Evaluation in Nanchuan-Wulong Area” (No.P21087-6) of the Ministry of Science and Technology of Sinopec.
Authors KW, PZ, and GH were employed by the Sinopec East China Oil & Gas Company.
The remaining authors declare that the research was conducted in the absence of any commercial or financial relationships that could be construed as a potential conflict of interest.
All claims expressed in this article are solely those of the authors and do not necessarily represent those of their affiliated organizations, or those of the publisher, the editors and the reviewers. Any product that may be evaluated in this article, or claim that may be made by its manufacturer, is not guaranteed or endorsed by the publisher.
An, M. J., Shi, Y. L., and Li, F. Q. (1998). Genetic algorithm-finite element method inversion of the factors determining the recent tectonic stress field of part of East Asia area. Acta seimol. Sin. 11, 265–272. doi:10.1007/s11589-998-0034-6
Bowker, K. A. (2007). Barnett shale gas production, fort worth basin: Issues and discussion. Am. Assoc. Pet. Geol. Bull. 91 (4), 523–533. doi:10.1306/06190606018
Dai, J. S., and Meng, Z. P. (1999). Numerical simulation of Palaeozoic tectonic stress field in the Chengdao Area. Sci. Geol. Sin. 8 (2), 223–232. CNKI:SUN:DZKY.0.1999-02-011.
Deng, B., Liu, S., and Wang, G. (2013). Cenozoic uplift and exhumation in southern Sichuan Basin-Evidence from low-temperature.thcrmochronology. Chin. J.Geophys. 6, 1958–1973. (in Chinese with English abstract). doi:10.6038/cjg20130618
Ding, W., Zhu, D., Cai, J., Gong, M., and Chen, F. (2013). Analysis of the developmental characteristics and major regulating factors of fractures in marine–continental transitional shale-gas reservoirs: A case study of the carboniferous–permian strata in the southeastern ordos basin, central China. Mar. Pet. Geol. 45, 121–133. doi:10.1016/j.marpetgeo.2013.04.022
Eissa, E. A., and Kazi, A. (1988). Relation between static and dynamic Young's moduli of rocks. Int. J. Rock Mech. Min. Sci. Geomechanics Abstr. 25, 479–482. doi:10.1016/0148-9062(88)90987-4
Fang, H. H., Sang, S. X., Wang, J. L., and Ju, W. (2018). Pore characteristics and its significance on shale gas reservoir: A case study of the Longmaxi shale in the nanchuan region, chongqing, south China. Int. J. Oil Gas. Coal Technol. 18 (3-4), 512–536. doi:10.1504/IJOGCT.2018.093127
Fischer, K., and Henk, A. (2013). A workflow for building and calibrating 3-D geomechanical models &ndash a case study for a gas reservoir in the North German Basin. Solid earth. 4, 347–355. doi:10.5194/se-4-347-2013
Griffith, A. A. (1921). The phenomena of rupture and flow in solids. Trans. Roy. Soc. Philosophical Trans.221, 163–198. doi:10.1098/rsta.1921.0006
Guo, P., Yao, L., and Ren, D. (2016). Simulation of three-dimensional tectonic stress fields and quantitative prediction of tectonic fracture within the Damintun Depression, Liaohe Basin, northeast China. J. Struct. Geol. 86, 211–223. doi:10.1016/j.jsg.2016.03.007
Guo, T. L., and Zhang, H. R. (2014). Formation and enrichment mode of Jiaoshiba shale gas field, Sichuan Basin. Petroleum Explor. Dev. 41 (1), 31–40. doi:10.1016/S1876-3804(14)60003-3
Hennings, P., Allwardt, P., Paul, P., Zahm, C., Reid, R., Alley, H., et al. (2012). Relationship between fractures, fault zones, stress, and reservoir productivity in the Suban gas field, Sumatra, Indonesia. Am. Assoc. Pet. Geol. Bull. 96 (4), 753–772. doi:10.1306/08161109084
Jarvie, D. M., Hill, R. J., Ruble, T. E., and Pollastro, R. M. (2007). Unconventional shale-gas systems: The mississippian barnett shale of north-central Texas as one model for thermogenic shale-gas assessment. Am. Assoc. Pet. Geol. Bull. 91 (4), 475–499. doi:10.1306/12190606068
Jiu, K., Ding, W., Huang, W., You, S., Zhang, Y., and Zeng, W. (2013). Simulation of paleotectonic stress fields within Paleogene shale reservoirs and prediction of favorable zones for fracture development within the Zhanhua Depression, Bohai Bay Basin, east China. J. Pet. Sci. Eng. 110, 119–131. doi:10.1016/j.petrol.2013.09.002
Ju, W., and Sun, W. (2016). Tectonic fractures in the lower cretaceous xiagou formation of qingxi oilfield, jiuxi basin, NW China part one: Characteristics and controlling factors. J. Pet. Sci. Eng. 146, 617–625. doi:10.1016/j.petrol.2016.07.042
Ju, W., Wang, J., Fang, H., and Sun, W. (2019). Paleotectonic stress field modeling and prediction of natural fractures in the Lower Silurian Longmaxi shale reservoirs, Nanchuan region, South China. Mar. Petroleum Geol. 100, 20–30. doi:10.1016/j.marpetgeo.2018.10.052
Ju, W., Wang, J. L., Fang, H. H., Gong, Y. P., and Zhang, S. J. (2017). Paleostress reconstructions and stress regimes in the nanchuan region of Sichuan Basin, south China: Implications for hydrocarbon exploration. Geosci. J. 21 (4), 553–564. doi:10.1007/s12303-016-0066-1
Kuhlman, R., Heemstra, T., Ray, T., Lin, P., and Chariez, P. 1993. Field tests of downhole extensometer used to obtain Formation in- situ stress data. , SPE25, 905, 625–634. doi:10.2118/25905-MS
Laubach, S. E., Lamarche, J., Gauthier, B. D. M., Dunne, W. M., and Sanderson, D. J. (2018). Spatial arrangement of faults and opening-mode fractures. J. Struct. Geol. 108, 2–15. doi:10.1016/j.jsg.2017.08.008
Laurent, M., and Frantz, M. (2006). Chronologic modeling of faulted and fractured reservoirs using geomechanically based restoration: Technique and industry applications. Am. Assoc. Pet. Geol. Bull. 90, 1201–1226. doi:10.1306/02240605116
Lemonnier, P., and Bourbiaux, B. (2010). Simulation of naturally fractured reservoirs. State of the art. Oil Gas. Sci. Technol. –. Rev. IFP. 65, 239–262. doi:10.2516/ogst/2009066
Li, C., Chen, S., and Zhang, P. (2011). [Repair of acute avulsion-type achilles tendon rupture by locking-loop stereoscopic suture]. Geol. China 2, 47–49. (in Chinese with English abstract). doi:10.1007/s12583-011-0162-0
Li, H. (2022). Research progress on evaluation methods and factors influencing shale brittleness: A review. Energy Rep. 8, 4344–4358. doi:10.1016/j.egyr.2022.03.120
Li, L., and Li, S. J. (2021). Evolution rule of overlying strata structure in repeat mining of shallow close distance seams based on Schwarz alternating procedure. J. Min. Strata Control Eng. 3 (2), 023515. doi:10.13532/j.jmsce.cn10-1638/td.20210225.001
Li, S., Li, J., and Zhou, Y. (2011). Fission track evidence for Mesozoic-Cenozoic uplifting in the southeastern margin of Sichuan basin. Acta Petrologica Mineralogica 30 (2), 225–233. (in Chinese with English abstract). doi:10.1007/s11589-011-0776-4
Liu, C., Wang, X., and Zhao, C. (2019). Palcotectonic stress field simulation and fracture prediction of tight sandstone in the Shanxi Formation, southern Qinshui Basin, China. Ucophysical Prospect. Petroleum 58 (2), 292–302+312. (in Chinese with English abstract).
Liu, D., Yang, D., and Zhang, Z. (2019). Fracture identification for tight reservoirs by conventional and imaging logging: A case study of permian lucaogou Formation in jimsar sag, junggar basin. Lithol. Reserv. 31 (3), 76–85. (in Chinese with English abstract). doi:10.1190/int-2020-0048.1
Lshida, T. (2001). Acoustic emission monitoring of hydraulic fracturing in laboratory and field. Constr. Build. Mat. 15, 283–295. doi:10.1016/S0950-0618(00)00077-5
Melikoglu, M. (2014). Shale gas: Analysis of its role in the global energy market. Renew. Sustain. Energy Rev. 37, 460–468. doi:10.1016/j.rser.2014.05.002
Meng, W. G., Chen, Z. Y., Li, P., Guo, Y. M., Gao, X. Z., and Hui, X. F. (2009). Exploration theories and practices of buried-hill reservoirs: A case from liaohe depression. Petroleum Explor. Dev. 36, 136–143. doi:10.1016/S1876-3804(09)60116-6
Milad, B., Ghosh, S., Suliman, M., and Slatt, R. (2018). “Upscaled DFN models to understand the effects of natural fracture properties on fluid flow in the Hunton group tight limestone,” in Proceedings of the SPE/AAPG/SEG Unconventional Resources Technology Conference, Houston, TX, July 23 2018, 25.
Milad, B., and Slatt, R. M. (2017). “Integrated 3-D seismic, outcrop, and core data for characterization of natural fractures of the hunton limestone and the woodford shale in central Oklahoma,” in AAPG 2017 Annual Convention and Exhibition, Texas, Houston. United States, Search and Discovery Article #51382. doi:10.13140/RG.2.2.24808.37121
Montgomery, S. L., Jarvie, D. M., Bowker, K. A., and Pollastro, R. M. (2005). Mississippian barnett shale, fort worth basin, north-central Texas: Gas-shale play with multi-trillion cubic foot potential. Am. Assoc. Pet. Geol. Bull. 89 (2), 155–175. doi:10.1306/09170404042
Nie, H., Chen, Q., Zhang, G., Sun, C., Wang, P., and Lu, Z. (2021). An overview of the characteristic of typical Wufeng–Longmaxi shale gas fields in the Sichuan Basin, China. Nat. Gas. Ind. B 8 (3), 217–230. doi:10.1016/j.ngib.2021.04.001
Pireh, A., Alavi, S. A., Ghassemi, M. R., and Shaban, A. (2015). Analysis of natural fractures and effect of deformation intensity on fracture density in Garau formation for shale gas development within two anticlines of Zagros fold and thrust belt, Iran. J. Pet. Sci. Eng. 125, 162–180. doi:10.1016/j.petrol.2014.11.016
Pollastro, R. M. (2007). Total petroleum system assessment of undiscovered resources in the giant Barnett Shale continuous (unconventional) gas accumulation, Fort Worth Basin, Texas. Am. Assoc. Pet. Geol. Bull. 91, 551–578. doi:10.1306/06200606007
Qie, L., Shi, Y. N., and Liu, J. S. (2021). Experimental study on grouting diffusion of gangue solid filling bulk materials. J. Min. Strata Control Eng. 3 (2), 023011. doi:10.13532/j.jmsce.cn10-1638/td.20201111.001
Ren, H., Liu, C., and Liu, W. (2020). Stress field simulation and fracture development prediction of the Wufeng Formation-Longmaxi Formation in the fushun yongchuan block , Sichuan Basin. J. Geomechanics 26 (01), 74–83. (in Chinese with English abstract). doi:10.12108/yxyqc.20220105
Rybacki, E., Meier, T., and Dresen, G. (2016). What controls the mechanical properties of shale rocks? e Part II: Brittleness. J. Pet. Sci. Eng. 144, 39–58. doi:10.1016/j.petrol.2016.02.022
Shan, J. Z., Zhang, Z. W., Chen, S. S., and Xu, K. (2004). Photo-elastic experiments of paleotectonic stresses field and fracture development characters on Anfutun buried hill. Damintun Sag. Pet. Explor. Dev. 31, 1–18. doi:10.1007/BF02873097
Shi, H., Xiong, L., and Dong, X. (2019). Characteristics of shale lithofacies and Genesis of evolution sequence difference of Wufeng-Lower Longmaxi Formation in southern Sichuan. Nat. Gas. Ind. 39 (S1), 71–77. (in Chinese with English abstract). doi:10.11764/j.issn.1672-1926.2016.02.0377
Tingay, M. R. P., Hillis, R. R., Morley, C. K., King, R. C., Swarbrick, R. E., and Damit, A. R. (2009). Present-day stress and neotectonics of Brunei; Implications for petroleum exploration and production. Am. Assoc. Pet. Geol. Bull. 93 (1), 75–100. doi:10.1306/08080808031
Wang, J. L., Fang, H. H., Gong, Y. P., Zou, Y., and Liu, J. G. (2017). Control of medium to small-scale tectonic deformations on fracture development in Longmaxi Formation shale. Arab. J. Geosci. 10 (21-11), 23. doi:10.1007/s12517-016-2810-2
Wclennan, J. A., Allwardt, P., and Hennings, P. H. (2009). Multivariate fracture intensity prediction:Applicetion to Oil Mounain anticline, Wyoming. AAPG Bull. 93 (11), 1585–1595.
Wu, X., Wang, F., and Xi, X. (2020). Experimental investigation on the strength characteristic、and fracture mechanism of rock with orthogonally crossed cracks. J. China Coal Soc. 45 (07), 2681–2690. (in Chinese with English abstract). doi:10.13225/j.cnki.jccs.2020.0156
Wu, Z., Zuo, Y., Wang, S., Chen, J., Wang, A., Liu, L., et al. (2017). Numerical study of multi-period palaeotectonic stress fields in lower cambrian shale reservoirs and the prediction of fractures distribution: A case study of the niutitang Formation in feng'gang No. 3 block, south China. Mar. Petroleum Geol. 80, 369–381. doi:10.1016/j.marpetgeo.2016.12.008
Xue, F., Liu, X. X., and Wang, T. Z. (2021). Research on anchoring effect of jointed rock mass based on 3D printing and digital speckle technology. J. Min. Strata Control Eng. 3 (2), 023013. doi:10.13532/j.jmsce.cn10-1638/td.20201020.001
Yang, R., He, S., Yi, J., and Hu, Q. (2016). Nano-scale pore structure and fractal dimension of organic-rich wufeng-longmaxi shale from jiaoshiba area, Sichuan Basin: Investigations using FE-SEM, gas adsorption and helium pycnometry. Mar. Pet. Geol. 70, 27–45. doi:10.1016/j.marpetgeo.2015.11.019
Zeng, L. B., and Liu, H. T. (2010). Influence of fractures on the development of low permeability sandstone reservoirs: A case study from the taizhao district, daqing oilfield, China. J. Pet. Sci. Eng. 72, 120–127. doi:10.1016/j.petrol.2010.03.009
Zeng, L. B., Lyu, W. Y., Li, J., Zhu, L. F., Weng, J. Q., Yue, F., et al. (2016). Natural fractures and their influence on shale gas enrichment in Sichuan Basin, China. J. Nat. Gas. Sci. Eng. 30, 1–9. doi:10.1016/j.jngse.2015.11.048
Zeng, L. B., Qi, J. F., and Wang, Y. X. (2007). Origin type of tectonic fractures and geological conditions in low permeability reservoirs. Acta Pet. Sin. 28 4, 52. doi:10.1016/S1872-5813(07)60034-6
Zeng, L. B., Wang, H. J., Gong, L., and Liu, B. M. (2010). Impacts of the tectonic stress field on natural gas migration and accumulation: A case study of the kuqa depression in the tarim basin, China. Mar. Pet. Geol. 27, 1616–1627. doi:10.1016/j.marpetgeo.2010.04.010
Zhang, S. C., and Zhu, G. Y. (2006). Gas accumulation characteristics and exploration potential of marine sediments in Sichuan Basin. Acta Pet. Sin. 27 (5), 1–8. (in Chinese with English abstract). doi:10.7623/syxb201303004
Keywords: Lintanchang area, finite element, numerical simulation, tectonic stress field, fracture prediction
Citation: Zhang D, Tang J, Chen K, Wang K, Zhang P, He G and Tuo X (2022) Simulation of tectonic stress field and prediction of tectonic fracture distribution in Longmaxi Formation in Lintanchang area of eastern Sichuan Basin. Front. Earth Sci. 10:1024748. doi: 10.3389/feart.2022.1024748
Received: 22 August 2022; Accepted: 05 September 2022;
Published: 20 September 2022.
Edited by:
Shuai Yin, Xi’an Shiyou University, ChinaReviewed by:
Zhonghu Wu, Guizhou University, ChinaCopyright © 2022 Zhang, Tang, Chen, Wang, Zhang, He and Tuo. This is an open-access article distributed under the terms of the Creative Commons Attribution License (CC BY). The use, distribution or reproduction in other forums is permitted, provided the original author(s) and the copyright owner(s) are credited and that the original publication in this journal is cited, in accordance with accepted academic practice. No use, distribution or reproduction is permitted which does not comply with these terms.
*Correspondence: Jiguang Tang, dGFuZ2ppZ3VvMTE1QDEyNi5jb20=
Disclaimer: All claims expressed in this article are solely those of the authors and do not necessarily represent those of their affiliated organizations, or those of the publisher, the editors and the reviewers. Any product that may be evaluated in this article or claim that may be made by its manufacturer is not guaranteed or endorsed by the publisher.
Research integrity at Frontiers
Learn more about the work of our research integrity team to safeguard the quality of each article we publish.