 Yanwei Liu1
 Haojie Jia
 Hongkai Han
 Jin Shi
 Ping Chang
- 1School of Safety Science and Engineering, Henan Polytechnic University, Jiaozuo, China
- 2College of Literature, Science and the Arts, University of Michigan, Ann Arbor, Michigan, United Sates
- 3WA School of Mines: Minerals, Energy and Chemical Engineering, Curtin University, Kalgoorlie, WA, Australia
- 4School of Intelligent Engineering, Shandong Management University, Jinan, Shandong, China
In order to reveal the process and mechanism of gas flow in a low-permeability coal seam, a new multiple-relaxation-time lattice Boltzmann method (MRT-LBM) model of gas migration in coal micro/nanopores based on Langmuir monolayer adsorption theory, the slip boundary scheme and Bosanquet effective viscosity was established. The software MATLAB was used to carry out the simulation study of uniform pore gas flow based on the MRT-LBM model, and the results were compared and verified with the porous anodic alumina membrane gas flow experimental results. On this basis, the gas flow in coal pores with different micro/nanopore sizes considering adsorption was simulated. The results show that the dimensionless permeability coefficient increases with decreasing pore size under the same pressure, which reflects the subsequent enhancement of the microboundary constraint effect and reveals that the pore system becomes the main controlling factor of coal seam permeability within the coal matrix in the middle and late stages of coal seam gas extraction, while the role of the microboundary constraint effect needs to be considered. The gas adsorption layer weakens the pore gas flow capacity, but for pores with a radius greater than 16 nm, the apparent change in permeability caused by the adsorption layer is less than 5%, and the adsorption effect can be ignored. N2, CH4, and CO2 enter the transition flow regime under different pressure conditions; with gas extraction, the gas pressure decreases, and the difference in the gas flow characteristics of the three gases increases.
Introduction
According to the theory of rarefied gas dynamics, when the ratio of the mean free path of the molecules in the fluid to the pore size of coal seam (Knudsen number) is greater than 0.1, the fluid enters the transition flow regime, and the Navier–Stokes equation based on continuum approximation and the thermodynamic equilibrium assumption is invalid. The gas transport within the micro/nanopores of a deep low-permeability coal seam in the middle and late stages of extraction occurs within the transition flow. Determining the trend and mechanism of coal seam gas migration in the transitional regime is a popular and challenging problem in current research. A precise understanding of the gas migration in low-permeability coal seams would have important directive significance for improving the accuracy of gas extraction prediction and implementing effective measures to increase production.
To accurately describe the gas migration in coal seam micro/nanopores, scholars have established various coal pore diffusion models from the perspective of pore diffusion (Wang et al., 2020a; Liu et al., 2020; Wang et al., 2021a; Zhang et al., 2022). Barrer (1951) first established the classical single-hole diffusion model based on Fick diffusion. Ruckenstein et al. (1971) proposed a dual-porosity diffusion model based on the classical model. Liu (Liu, 2011) extended the double porosity diffusion model to the three-stage diffusion model; although the accuracy was improved, the model was complex and difficult to apply to engineering applications. Li et al. (2021a) established a new model based on the diffusion coefficient-time relationship; this basis simplified the model but did not represent a sufficient physical basis. Liu et al. (2021a) unified the characterization of seepage and diffusion with the concept of the density gradient and established a density gradient-driven desorption diffusion model. Scholars have applied a variety of effective strategies to study coal pore gas diffusion, but they have not reached a unified understanding.
When gas is transported through porous media rich in micro/nanopores, the collision of the gas molecules with the wall increases the gas flow rate, and the gas permeability measured is the apparent permeability. Javadpour (2009) directly added slip flow to Knudsen diffusion flow to represent the total flow in micro/nanopores, leading to the concept of apparent permeability. Wu et al. (2015) coupled the flow of different flow mechanisms according to a certain contribution weight coefficient. However, repeated calculations to a certain extent cannot be avoided by adding different flow regimes. Beskok and Karniadakis (1999) established a model suitable for all flow regimes by modifying the boundary slip condition and introducing the dilution effect coefficient. Liu et al. (2022) showed that the microboundary constraint effect in the transitional region cannot be ignored. The Beskok model was improved by using the effective viscosity to modify the mean free path. Although the apparent permeability model establishes a relationship with Darcy’s law, which makes its application more convenient, the above models are mostly simplified or contain more empirical coefficients.
The pore microstructure of coal is extremely complicated, and micro/nanopore gas experiments are difficult and expensive and have a low success rate. Therefore, many scholars simplify the microstructure to micro/nanotube bundles for theoretical and experimental research. A porous anodic alumina membrane contains a large number of micro/nanotube bundles per unit area, with a simple pore structure and uniform pore size. Liu et al. (2022), Guo et al. (2015) and Wang et al. (2017a) carried out experimental research and model verification of micro/nanopore gas flow with porous anodic alumina membranes. However, when the pore of the membrane is smaller than 20 nm, the pore formation is not uniform, and it is difficult to precisely obtain the pore parameters. In addition, these experiments are easily disrupted and expensive. It is difficult to use this technique in systematic studies on gas migration within micro/nanopores.
The LBM is a mesoscopic simulation method that realizes fluid motion through particle collision and migration with a clear physical background and is an effective simulation method for the transition flow. Combined with experimental methods, it is expected to solve the controversy over the coal pore gas transmission mechanism.
LBM simulations of coal gas migration are currently mostly performed at the macrofracture level (Roslin et al., 2019; Wang et al., 2020b; Li et al., 2021b). Jin et al. (Jin et al., 2019) and Yu et al. (2020) used the LBM to simulate the permeability of the fluid migration process in coal cleat networks. Wang et al. (2022) simulated the seepage characteristics of three-dimensional fracture networks of coal in different loading stages. Yan et al. (2021) studied the gas seepage in coal pore networks by the LBM. They found that the gas seepage velocity and apparent permeability increased with increasing porosity, but they did not consider the wall slip or the microboundary constraint effect.
The LBM has been widely used in the study of nanopore transition-flow in shale. Succi (2002) first proposed a rebound-mirror combined boundary scheme (bounce-back and specular reflection (BSR) slip boundary scheme) that can describe the boundary slip effect. Nie et al. (2002) established the LBM model of the transition-flow based on the relations between the Knudsen number and relaxation time. Wang et al. (2020c) established the microscale gas flow LBM model of shale. Wang et al. (2017b) and Liu et al. (2021b) used the MRT-LBM model to study microscale gas transmission and improved the simulation accuracy.
Coal seam gas migration is a complex multiphase and multi-scale fluid flow. Bai et al. (Bai et al., 2021a; Bai et al., 2021b) studied the coupling flow of multiphase materials and the effect of temperature on adsorption - desorption and migration in porous media by laboratory experiments. Wang et al. (2021b) combined Pore Network Models (PNM), Laplace Semi-Analytical Solvers (SAS) and LBM to study the permeability of tight porous rocks.
In summary, the combination of the mesoscopic LBM simulation method and porous anodic alumina membrane gas flow experiment is an effective tool and developing trend for determining the expression and mechanism of transition flow regime gas migration in coal. The pore parameters of the membrane were accurately characterized by the maximum stable extremum region algorithm. The MRT-LBM model established for micro/nanopore gas flow in coal was effectively verified by physical experiments. Finally, based on the MRT-LBM model, an extended simulation experiment of coal micro/nanopore gas migration was carried out to reveal the expression of coal micro/nanopore gas flow.
Simulation method
LBM-LBM mathematical model
The LBM has a comprehensible mesoscopic physical background and obtains macroscopic flow information through the numerical solution of the discrete particle density distribution function. The discrete equation of the LBM can be written as (Succi, 2002):
where
The accuracy of the model is determined by the collision operator. The MRT-LBM model contains multiple adjustable parameters; the shear viscosity and bulk viscosity are adjustable, with adequate numerical stability (Li et al., 2011). The collision operator of the MRT-LBM model is given by:
where S is a diagonal relaxation matrix. For the commonly used D2Q9 (two-dimensional nine-velocity) model, the matrix is
Relaxation time and boundary treatment of the transition flow
When using the LBM to simulate macroscopic flow, the Reynolds number is mandatory. In the simulation of the microscale transition-flow, a dimensionless Knudsen number is needed, and the relationship between the Knudsen number and relaxation time (the time when the distribution of microscopic particles approaches equilibrium from the nonequilibrium state) is determined.
According to rarefied gas dynamics, the Knudsen number which is used to classify gas flow regimes can be defined as (Florence et al., 2007):
where λ represents the mean free path, nm; p denotes the gas pressure, MPa; R is the gas constant, J/(molK); T is the absolute temperature, K; μ denotes the dynamic viscosity at p and T, mPas; M denotes the molecular weight, kg/mol; and H represents the characteristic length of the flow geometry, nm.
In the microscale LBM simulation, the relations between Kn and relaxation time τ is given by (Nie et al., 2002):
where NH represents the lattice number for the characteristic length of the flow geometry. When Kn > 0.01, the gas enters the slip flow regime, and the BSR slip boundary scheme can accurately describe the boundary slip velocity.
When Kn > 0.1, the gas enters the transitional regime, and the constraint of the microboundary on the mean free path cannot be ignored. At this time, the mean free path needs to be corrected by the effective viscosity (Liu et al., 2022).
The effective viscosity μeff can be expressed as (Beskok and Karniadakis, 1999):
Michalis et al. (Michalis et al., 2010) found experimentally that the parameter
When the effective viscosity is adopted, the rebound ratio coefficient
Analysis of adsorption
The adsorption layer is formed under the interaction between gas and solid surface in coal micro-scale pores. The gas adsorption volume of coal can be calculated by the Langmuir equation:
where a represents the maximum monolayer adsorption capacity, m3/t; b denotes the Langmuir equilibrium constant, 1/MPa; and V is the adsorption amount of adsorbed gas at p, m3/t.
The adsorption intensity can be represented by the surface coverage, and the adsorption gas surface coverage θ can be expressed as:
When the maximum adsorption capacity is reached, according to Langmuir monolayer adsorption theory, the size of the gas flow channel is reduced two times the molecular diameter. Therefore, the effective flow radius re of the coal nanopores considering adsorption can be defined as:
where d is the diameter of the gas molecules.
Physical model of gas flow in the transitional regime
Considering that the gas flow in the micro/nanopores is affected by viscous resistance, wall slip, adsorption and the microboundary constraint effect, a physical model of gas flow in the micro/nanopores of coal is established (Figure 1).
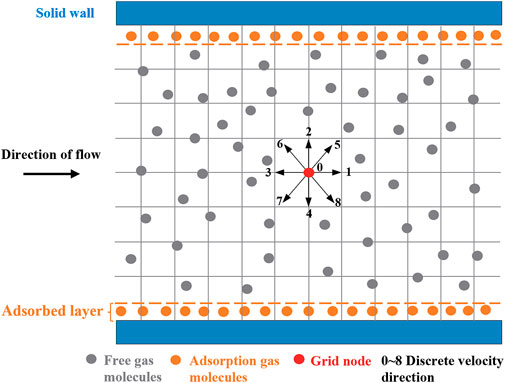
FIGURE 1. Physical model of gas transport in coal micro/nanochannels.
Experiment and model validation
The pore structure of coal is complex and unevenly distributed from nanometers to microns, and this structure is difficult to accurately obtain. Thus, it is difficult to directly study the flow of gas in coal micro/nanopores. Therefore, a porous anodic alumina membrane with uniform pore sizes of micro- and nanopores was selected to study the gas flow in the transitional regime and to verify the model. First, images of the pores of the membrane were obtained by field emission scanning electron microscopy (FESEM), and the pore structure was characterized with maximally stable extremal regions (MSER) in MATLAB. The pore structure parameters of the membrane were obtained, and the intrinsic permeability was calculated. Then, the gas pressure and flow rate were measured through a permeability test experiment on the membrane, and the gas flow of the micro/nanopores was analyzed.
Measurement of micro/nanopore parameters of porous anodic alumina membranes
Porous anodic alumina membranes with a diameter of 35 mm and a thickness of 60 μm were used in the experiment. Limited by the material properties, three kinds of membranes with representative pore sizes (the theoretical mean pore sizes of the membranes were 20–30 nm, 110–150 nm and 200–300 nm) were selected and numbered M-1, M-2 and M-3, respectively. The membranes were scanned by FESEM at Henan Polytechnic University. The scanning results are shown in Figure 2. The magnifications are 67560 times, 30,000 times, and 5,000 times.
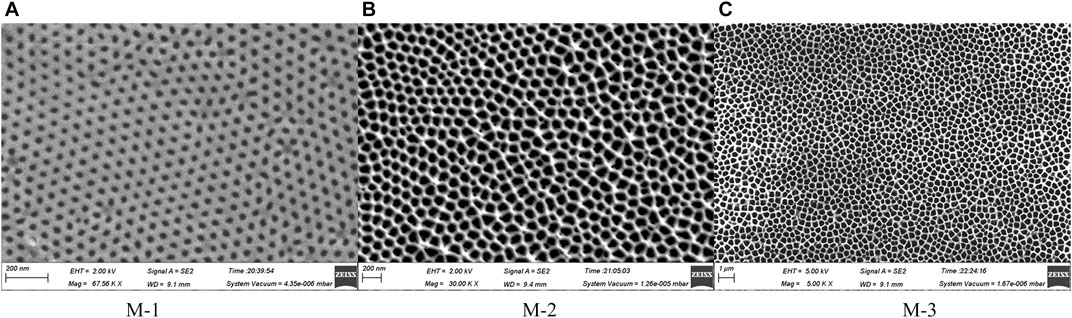
FIGURE 2. FESEM images of the porous anodic alumina membranes. (A) M-1, (B) M-2, and (C) M-3
Figure 2 shows that the pore-forming effect of the selected three specifications of the membrane is good, the pore size is relatively uniform, and the pore section tends to be elliptical; these pores closely resemble the pores of a coal body, meeting the requirements of the uniform micro/nanopore gas flow experiment.
The MSER algorithm conducts affine invariant transformation to the image gray level and can be used for multiscale detection. Based on the MSER algorithm, the software MATLAB is used to write the program, and ellipses are used to fit the micro/nanopore edges of the membrane. The treatment process of the M-1 membrane is shown in Figure 3 as an example, and more detailed treatment steps are given in Reference (Liu et al., 2022).
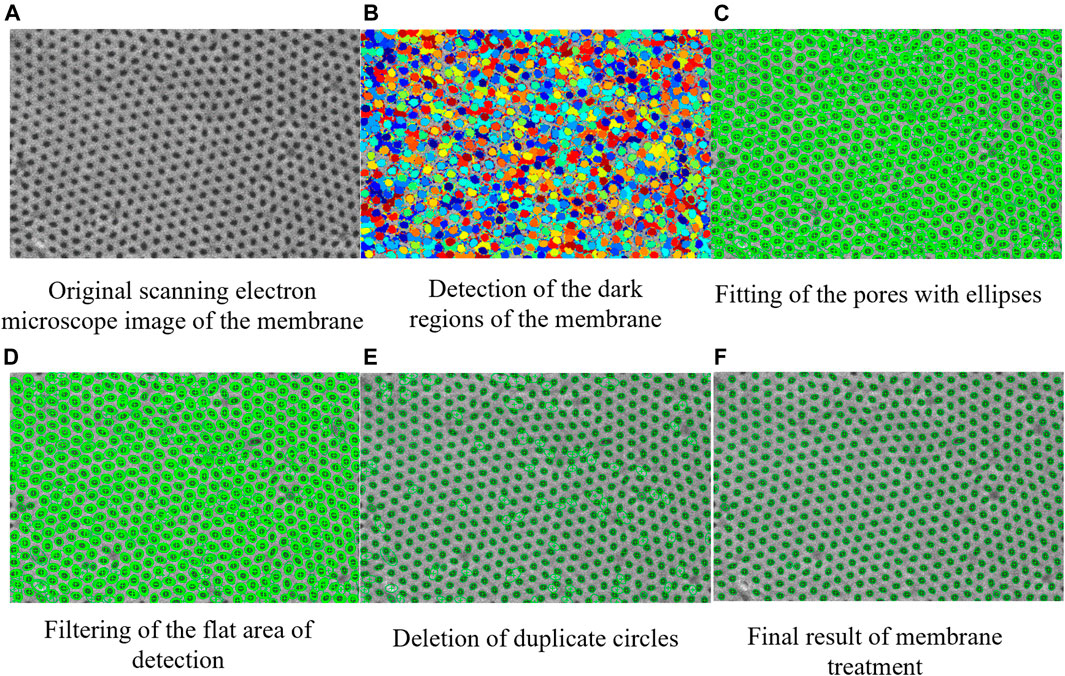
FIGURE 3. Pore treatment process of the membrane. (A) Original scanning electron microscope image of the membrane, (B) Detection of the dark regions of the membrane, (C) Fitting of the pores with ellipses, (D) Filtering of the flat area of detection, (E) Deletion of duplicate circles, and (F) Final result of membrane treatment.
The number and the total area of pores in the detection area were counted, and the porosity and equivalent mean pore size of the membranes were calculated. The Darcy permeability of porous media is related only to the pore structure, which can be calculated by Eq. 10.
where KD denotes the Darcy permeability (also known as the intrinsic permeability), 10–3 mD; φ represents porosity; and r is the pore radius, nm.
The pore parameters of the membranes obtained by MSER algorithm processing and statistical calculation are shown in Table 1. The table shows that the equivalent mean pore size of the membranes is 34.3–270.3 nm and that the ratio of pore length to pore size is 222–1749; thus, the membranes exhibit the characteristics of tube bundles.
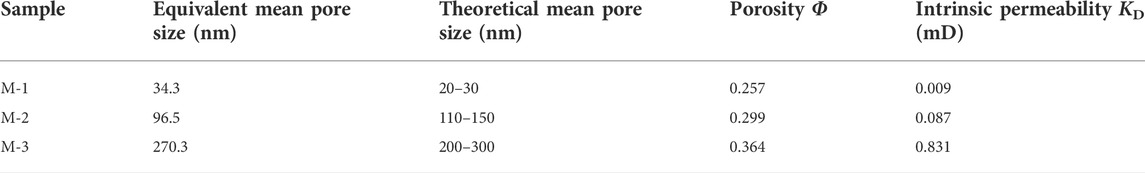
TABLE 1. Pore parameters of the membranes.
Gas flow experiment of the transition flow
The gas microflow-permeability analyzer of Henan Polytechnic University was used in the experiment. This equipment can monitor pressure and flow in real time, and the error of the data is 0.15%. A photo of the analyzer, a schematic of the sample holder system and the membrane sample are shown in Figure 4. To ensure that the gas completely passes through the membrane sample, O-ring packing is used to compact the sample. The outlet pressure of the experiment is the local atmospheric pressure (0.10 MPa), and the diameter of the O-ring is 15 mm. More detailed experimental steps are given in Reference (Liu et al., 2022).
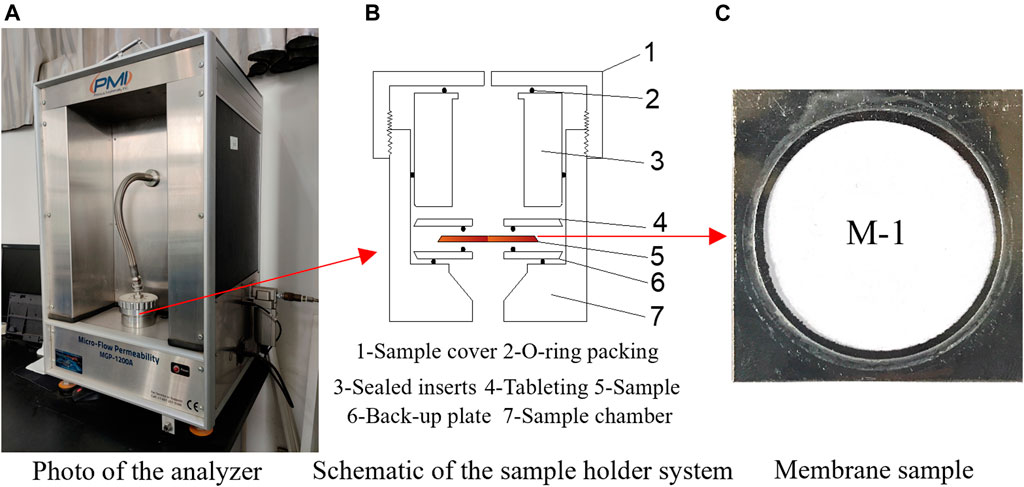
FIGURE 4. Gas microflow-permeability analyzer. (A) Photo of the analyzer, (B) Schematic of the sample holder system, (C) Membrane sample
To ensure the safety of the experimental process, nitrogen was used instead of methane. Both nitrogen and methane are nonpolar molecules, their molecular diameters and mean free paths are similar, and both have adsorption properties. Moreover, nitrogen is often contained in the gas components of coal seams, and the two are equivalent in terms of gas flow. Helium is an inert gas that does not adsorb, and its molecular properties are quite different from those of methane and nitrogen, making it suitable for experimental comparison. The physical properties of the three gas parameters are shown in Table 2, and the experimental temperature was 298 K.
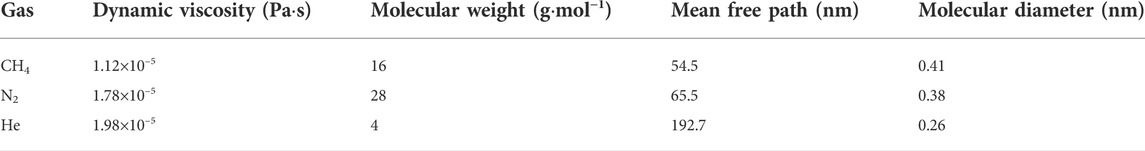
TABLE 2. Physical properties of the experimental gases.
When gas passes through micro/nanopores in porous media, the collisions between the gas and solid wall cannot be ignored. The microboundary constraint effect enhances the gas flowability in the pores, and the gas permeability measured is the apparent permeability. The gas permeability of the membrane samples can be calculated by Eq. 11.
where Kapp represents the gas permeability (also known as the apparent permeability), mD; P0, Pin and Pout are the standard atmospheric pressure, inlet pressure, and outlet pressure, respectively, MPa; Q0 denotes the gas flow rate at P0, cm3/s; μ is the dynamic viscosity, mPas; L denotes the flow channel length, cm; and A is the cross-sectional area of the flow channel, cm2.
Results and discussion regarding the experiment
To avoid the influence of nitrogen adsorption on the experimental results, the M-1, M-2 and M-3 films were used repeatedly in the experiment, and helium and nitrogen were used successively for the gas penetration experiments. The inlet pressure of the experiment increased gradually with time. The pressure stability in the pipeline system was controlled by the default maximum pressure drop and holding time value of the instrument, and the gas flow and pressure were automatically recorded at each stable timestep. To prevent the membrane from rupturing, the instrument automatically stopped when the maximum pressure (0.40 MPa) was reached. The experimental results are shown in Figure 5.
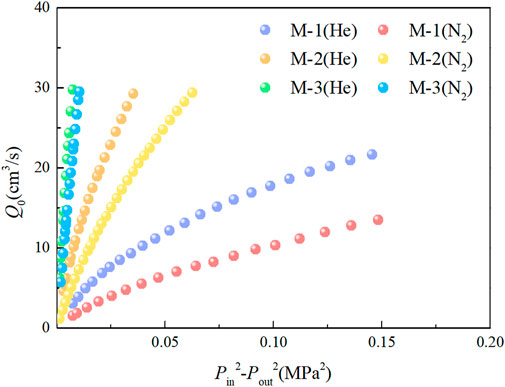
FIGURE 5. Relationship between the flow rate and square difference in the inlet and outlet pressures.
During the experiment, when the small pore size membrane M-1 (34.3 nm) reaches the set maximum pressure (0.40 MPa), the instrument automatically stops. The medium-pore size membrane M-2 (96.5 nm) and large-pore size membrane M-3 (270.3 nm) cannot maintain pressure stability when the flow rate reaches approximately 30 cm3/s, and the instrument automatically stops.
As depicted in Figure 5, with an increasing square of the difference in the inlet and outlet pressures, the flow rate shows nonlinear growth. Under the same pressure, the flow rate of helium is greater than that of nitrogen, and the slope of the curve is larger. Combining Eq. 11 shows that the curve slope reflects the apparent permeability. To further analyze the variation in apparent permeability, the relationship between apparent permeability and inlet pressure is shown in Figure 6.
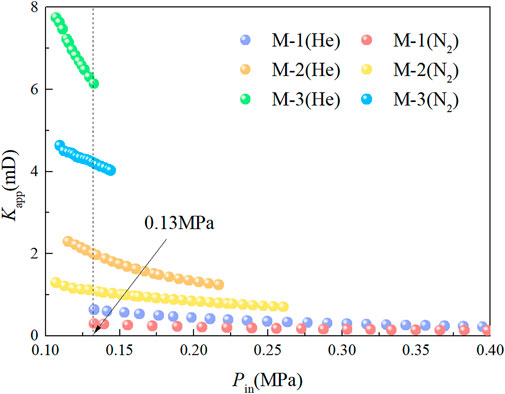
FIGURE 6. Relationship between apparent permeability and inlet pressure.
According to Figure 6 and Table 1, the experimental apparent permeability is much higher than the intrinsic permeability of the membranes, and the apparent permeability increases with the decrease of gas pressure in the channel. The results show that the mean free path increases with decreasing pressure and that the proportion of collisions between molecule and the wall out of the total number of collisions increases, which enhances the flow capacity of gas in the pores. For the same membrane, the apparent permeability of helium is higher than that of nitrogen under the same pressure, and the flow rate is larger. This shows that under the same conditions, the microboundary constraint effect of helium is stronger, and the flowability is stronger.
When the pressure is approximately 0.13 MPa, the helium flow rates of the M-1, M-2 and M-3 membranes are 1.97, 1.76 and 1.41 times the nitrogen flow rate, respectively. This shows that under the same pressure, the smaller the pore size of the membrane is, the more obvious the difference between the helium and nitrogen flow capacities. When the pressures on the M-1 membrane are approximately 0.20, 0.30 and 0.40 MPa, the helium flows are 1.89, 1.78 and 1.61 times the nitrogen flow. This shows that under the same pore conditions, the lower the pressure is, the more obvious the difference between the helium and nitrogen flow capacities. The experiments show that the apparent permeability of micro/nanoporous media is not only determined by the pore structure but related to the fluid pressure and fluid type.
Verification and discussion of the model
The MRT-LBM model in this paper was used to simulate the flow experiments of helium and nitrogen. The BSR slip boundary scheme was used for the upper and lower walls, and a consistent linear extrapolation scheme was used for the inlet and outlet (Verhaeghe et al., 2009). In the LBM simulation process, the pressure boundary scheme was transformed into the particle density distribution function by

TABLE 3. Numerical simulation schemes.
In the LBM simulation of physics experiments, the real physical units need to be converted into dimensionless lattice units. By non-dimensionalizing all the physical units in Eq. 11, the apparent permeability of the LBM can be written as (Cho et al., 2013):
where
The microboundary constraint effect causes the apparent permeability of the membranes measured with the experimental gas to be much larger than its intrinsic permeability. The stronger the microboundary constraint effect is, the greater the ratio (dimensionless permeability coefficient) of the two, and the greater the deviation from Darcy’s law. The dimensionless permeability coefficient of the LBM simulation can be calculated as follows:
where Kr is the dimensionless permeability coefficient and
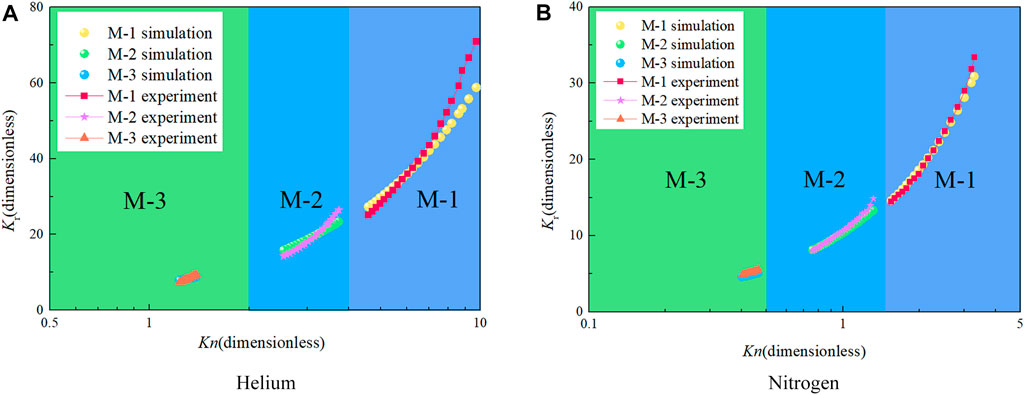
FIGURE 7. Variation in the dimensionless permeability coefficient with Kn. (A) Helium, (B) Nitrogen
Figure 7 shows that the experimental gas flows all enter the transitional regime, that the Knudsen number of the helium experiment is 1.2–9.7, and that the Knudsen number of the nitrogen experiment is 0.4–3.3. The simulation results of the MRT-LBM model in this paper are in good agreement with the experimental results as a whole, but the deviation of the simulation results increases gradually after Kn > 8. This occurs because the parameter
Gas flow is essentially a macroscopic velocity transfer caused by molecular collisions. The characteristic size of the flow channel and gas pressure, temperature and molecular properties all affect the molecular collisions, and these factors can be reflected by Kn. Therefore, under the experimental pressure conditions, the dimensionless permeability coefficients Kr of nitrogen and helium with different micro/nanopore size membranes have the same variation as Kn.
Extended simulation and discussion of transition flow gas flow in coal
Fu et al. (Fu et al., 2005) classified coal pores into two types, where those <65 nm are diffusion pores and those >65 nm are seeping pores by the fractal method. This classification method is convenient for engineering application, but both pore size and gas pressure affect the gas migration regime within pores. According to Eq. 3, the corresponding relationship between the methane flow regime and pressure in pores with different pore sizes under coal reservoir conditions can be calculated (Figure 8).
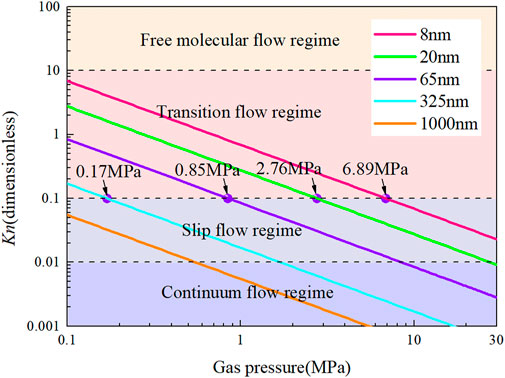
FIGURE 8. Relationship between methane flow regimes and pressure in pores with different sizes.
Figure 8 illustrates that it is necessary to determine the gas flow regime by combining the pore size and pressure to determine the applicable flow mechanism and model. For diffusion pores with radii larger than 8 nm, the slip flow regime is entered when the gas pressure is greater than 6.89 MPa. For seeping pores with radii smaller than 325 nm, when the gas pressure is less than 0.17 MPa, the transitional regime is entered. At this time, the approximation and the thermodynamic equilibrium assumption are invalid, and a higher-order model with higher accuracy is needed; otherwise, large errors occur. The LBM is a mesoscopic simulation method that is suitable for macroscopic and microscopic simulations. Therefore, the MRT-LBM model in this paper is used to carry out extended simulation research on gas migration in micro/nanopores of coal.
Effect of pore size and pressure on methane flow
In order to investigate the influence of pore size on methane flow, the flow of methane in micro/nanopores with different pore sizes was simulated, and the relationship between the dimensionless permeability coefficient and pressure can be obtained (Figure 9).
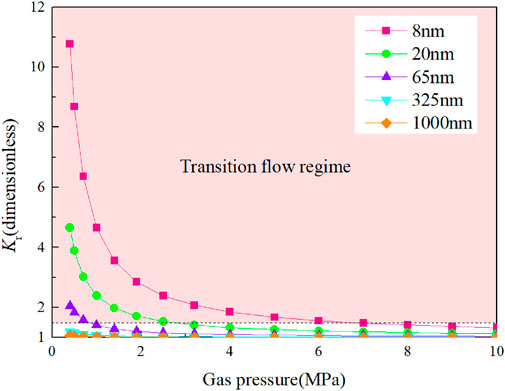
FIGURE 9. Variation in the dimensionless permeability coefficient with pressure for different pore sizes.
Figure 9 demonstrates that the microboundary constraint effect enhances the gas flowability and that the smaller the pore size and the lower the pressure are, the more significant the enhancement effect on the flowability. For pores with a radius of 8 nm, at a pressure of 0.40 MPa and 10 MPa, the actual gas flow is 10.8 and 1.3 times that calculated by Darcy’s law, respectively. For pores with a radius of 325 nm, the actual gas flow is only 1.2 times that calculated by Darcy’s law at a pressure of 0.40 MPa; the pores with radii of 1,000 nm can be neglected.
With the progress of gas extraction, the gas pressure decreases, and the effect of the microboundary constraint on the enhancement of gas flowability is more obvious. However, in the early stage of gas extraction in a low-permeability coal seam, the extraction flow rate is high, and the attenuation is fast. In the later stage, the flow rate is low, and the gas is difficult to extract. Therefore, it is necessary to further analyze the relationship between pore apparent permeability and gas pressure.
Figure 10 shows that with decreasing pore size, the intrinsic permeability decreases, and the apparent permeability decreases. Therefore, the pore size dominates the permeability, and the microboundary constraint effect alleviates the influence of pore size reduction on permeability.
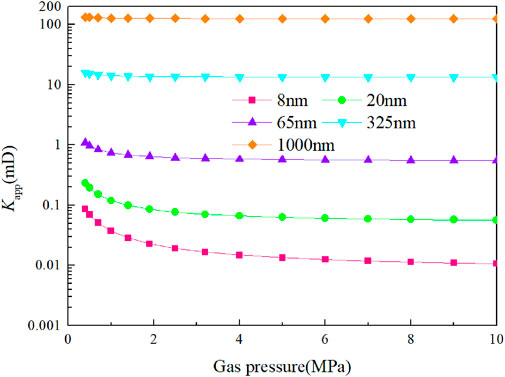
FIGURE 10. Variation in apparent permeability with pressure for different pore sizes.
The methane in coal is mainly stored in micropores, and adsorbed methane accounts for 80%–90% of the methane in coal reservoirs (Cheng and Hu, 2021). The desorption process of adsorbed gas is very fast, approximately 10–10–10–5 s, and the desorption of free gas from micropores (<2 nm) into the middle and large pores in the path is very short. In the study of coal seams, the impact of methane desorption and migration in micropores on permeability can be ignored. In the early stage of gas extraction, free gas is released rapidly under drive from the pressure gradient. At this time, the large pores and fractures are the main flow channels and are the main controlling factors of coal permeability. In the middle and late period of extraction, the free gas is released rapidly, the gas pressure drops, and the microporous desorbed gas replenishes the fracture system through the pore system. The replenishment velocity of gas through the pore system is less than that of the fracture flow velocity, and with the decrease in pressure, the microboundary constraint effect increases. In the coal matrix and in the mid-late stage of coal seam gas extraction, the pore system becomes the main controlling factor of coal seam permeability. Therefore, it is necessary to accurately understand gas migration through micro/nanopores in low-permeability coal seams.
Effect of adsorption on methane flow
Collectively, a large number of pore structures in coal provides a large specific surface area and has a strong adsorption effect on methane. To investigate the effect of adsorption on methane flow in coal nanopores, the Langmuir equilibrium constant is set to b = 0.5 MPa−1 to simulate methane flow with and without adsorption at pore sizes of 2 nm, 4 nm, 8 nm and 16 nm, respectively. The variation in the apparent permeability change rate with or without adsorption with pressure is shown in Figure 11.
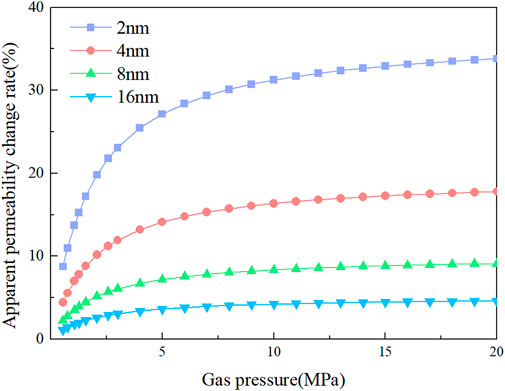
FIGURE 11. Variation in apparent permeability change rate with pressure.
Figure 11 shows that the adsorption layer weakens the methane flow capacity in the pores and that the magnitude of the weakening increases with increasing pressure and finally tends to be stable. Combined with Eq. 7, it can be seen that when the pressure reaches a certain value, the adsorption amount tends to the maximum adsorption volume and gradually stabilizes. At this time, the coverage θ ≈ 1, and the thickness of the adsorption layer tends to the maximum. The apparent permeability change rate considering adsorption increases with decreasing pore size. When the adsorption layer is considered, the apparent permeability of the pores with a radius of 2 nm is reduced by 33.8% at most. For pores with radii greater than 16 nm, the apparent permeability change rate is less than 5%, and the influence of the adsorption layer thickness on the apparent permeability can be ignored.
The surface diffusion of adsorbed gas on the solid wall is driven by the chemical potential gradient. Yang et al. (2020) studied the effect of surface diffusion of nanoporous gas on apparent permeability by combining molecular simulation and LBM simulation. The results showed that the contribution of gas surface diffusion to permeability decreased with increasing pressure and pore size. When the pore size was greater than 20 nm, surface diffusion could be ignored. Surface diffusion makes a greater contribution to permeability in micropores (<2 nm), and gas has a short path through micropores, so it has little effect on the overall permeability of the coal seam.
The temperature conduction have an important influence on adsorption mechanism, Bai et al. (2022) used the smoothed particle hydrodynamics (SPH) method to simulate the heat transfer process in porous media at the pore scale. Yang et al. (2020) research shows that the gas apparent permeability in organic nanopore is enhanced with the increment of temperature.
Difference analysis on the influence of different gas types
Coal seam gas is composed of a variety of gas components, and the common components are N2, CH4 and CO2. In order to study the influence of different gas types on the gas flow law of nanopores, the gas flow of three kinds of gas components with a radius of 20 nm was simulated, and the relationship between the dimensionless permeability coefficient Kr and gas pressure is shown in Figure 12.
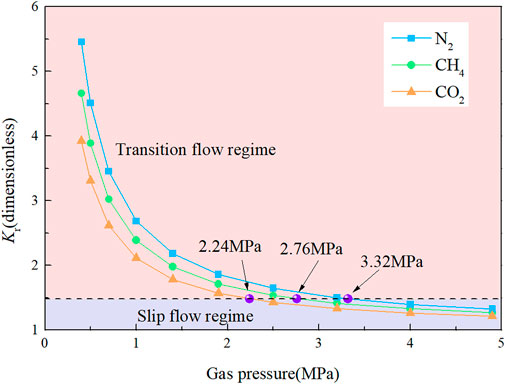
FIGURE 12. Variation in the dimensionless permeability coefficient with pressure
Figure 12 shows that the effects of the microboundary constraint on different gas flow capacities are different. N2, CH4 and CO2 enter the transitional regime at 3.32 MPa, 2.76 MPa, and 2.24 MPa, respectively. Under the same pressure of CO2, CH4 and N2, the mean free path increases in turn, the microboundary constraint effect on the gas flow capacity increases in turn, and the dimensionless permeability coefficient increases in turn. The dimensionless permeability coefficients of the three gases increase with decreasing pressure, and the difference among the three increases with decreasing pressure. This shows that with gas extraction, the gas pressure decreases, and the difference in the three gas flow characteristics increases.
Figure 13 shows that the dimensionless permeability coefficients of N2, CH4 and CO2 increase with the decrease of pore size, and the difference between the three increases with the decrease of pore size. It shows that the smaller the pressure and the pore size, the more obvious the microboundary constraint effect, and the greater the difference in the flow characteristics of different gases.
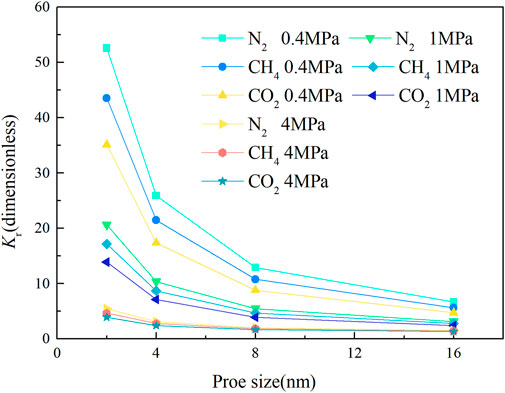
FIGURE 13. Variation in the dimensionless permeability coefficient with proe size
Conclusion
In this paper, a porous anodic alumina membrane gas permeability test and MRT-LBM simulation were used to study the gas migration trend and the mechanism of transition-flow in different micro/nanopores in coal. The following conclusions were obtained:
1) A new simulation method for micro/nanopore gas migration in coal based on the MRT-LBM model is proposed. The experimental verification shows that on the basis of Langmuir monolayer adsorption theory, the model of the BSR scheme and effective viscosity can precisely describe gas migration in the transitional regime in coal.
2) The microboundary constraint effect in the transitional regime reduces the mean free path, and the gas viscosity decreases. The smaller the pore size and the lower the gas pressure are, the greater the contribution of the collisions between molecules and the wall to the flow, the more obvious the microboundary constraint effect, and the greater the difference of different gas flow. The adsorption layer reduces the effective flow radius of a pore and decreases the flow capacity of methane in the pore.
3) The corresponding relationship between methane flow regime and pressure in coal pores with different pore sizes under coal reservoir conditions is investigated. The smaller the pore size is, the higher the pressure of gas flow into the transitional regime, and the microboundary constraint effect increases the permeability of the transition flow. The pore size plays a dominant role in permeability. In the early stage of gas extraction, large pores and fractures are the main circulation channels and are the main factors controlling coal permeability. In the coal matrix and the middle and later periods of gas extraction, the pore system becomes the main factor controlling coal permeability, and with the decrease in pore pressure, the microboundary constraint effect is more obvious.
Data availability statement
The original contributions presented in the study are included in the article/supplementary material, further inquiries can be directed to the corresponding author.
Author contributions
YL and HH designed and modified the theoretical framework and the structures of manuscript; HJ implemented the numerical simulations and prepared the draft of manuscript; JS and PC corrected some Figures and technical termnology; JM, YH, and JP improved some Figures and presentations.
Funding
This work was supported by the program for National Natural Science Foundation of China (Nos. 52174173, 52274188, and 52104190), the Focus R&D and Promotion for Scientific and Technological Project of Henan Province (No. 222102320012), the Key Scientific Research Project Fund of Colleges and Universities of Henan Province (No. 21A440009), the Project Funded by China Postdoctoral Science Foundation (Nos. 2020M682291 and 2022T150194), the Fundamental Research Funds for the Universities of Henan Province (No. NSFRF210307) and the State Key Laboratory Cultivation Base for Gas Geology and Gas Control (Henan Polytechnic University) (Nos. WS2021A05 and WS2021B01).
Conflict of interest
The authors declare that the research was conducted in the absence of any commercial or financial relationships that could be construed as a potential conflict of interest.
The handling editor SW declared a shared affiliation with the authors at the time of review.
Publisher’s note
All claims expressed in this article are solely those of the authors and do not necessarily represent those of their affiliated organizations, or those of the publisher, the editors and the reviewers. Any product that may be evaluated in this article, or claim that may be made by its manufacturer, is not guaranteed or endorsed by the publisher.
References
Bai, B., Jiang, S. C., Li, L. L., Li, X., and Wu, H. Y. (2021). The transport of silica powders and lead ions under unsteady flow and variable injection concentrations. Powder Technol. 387, 22–30. doi:10.1016/j.powtec.2021.04.014
Bai, B., Nie, Q. K., Zhang, Y. K., Wang, X. L., and Hu, W. (2021). Cotransport of heavy metals and SiO2 particles at different temperatures by seepage. J. Hydrology 597, 125771. doi:10.1016/j.jhydrol.2020.125771
Bai, B., Wang, Y., Rao, D. Y., and Bai, F. (2022). The effective thermal conductivity of unsaturated porous media deduced by pore-scale SPH simulation. Front. Earth Sci. (Lausanne). 10. doi:10.3389/feart.2022.943853
Beskok, A., and Karniadakis, G. E. (1999). A model for flows in channels, pipes, and ducts at micro and nano scales. Microscale Thermophys. Eng. 3 (1), 43–77. doi:10.1080/108939599199864
Cheng, Y. P., and Hu, B. (2021). Main occurrence form of methane in coal: Micropore filling. J. China Coal Soc. 46 (09), 2933–2948. doi:10.13225/j.cnki.jccs.2020.1214
Cho, H., Jeong, N., and Sung, H. J. (2013). Permeability of microscale fibrous porous media using the lattice Boltzmann method. Int. J. Heat. Fluid Flow. 44, 435–443. doi:10.1016/j.ijheatfluidflow.2013.07.013
Florence, F. A., Rushing, J. A., Newsham, K. E., and Blasingame, T. A. (2007). Improved permeability prediction relations for low-permeability sands. Rocky Mt. Oil Gas Technol. Symposium Society of Petroleum Engineers(SPE) SPE107954 2007 SPE Rocky Mountian Oil and Gas Technology Symposium Denver, CO, United States April 16–18, 2007. doi:10.2118/107954-MS
Fu, X. H., Qin, Y., Zhang, W. H., Wei, C. T., and Zhou, R. F. (2005). Fractal classification and natural classification of coal pore structure based on migration of coal bed methane. Chin. Sci. Bull. 50 (1), 66–71. doi:10.1007/bf03184085
Guo, C. H., Xu, J. C., Wu, K. L., Wei, M. Z., and Liu, S. Y. (2015). Study on gas flow through nano pores of shale gas reservoirs. Fuel 143, 107–117. doi:10.1016/j.fuel.2014.11.032
Javadpour, F. (2009). Nanopores and apparent permeability of gas flow in mudrocks (shales and siltstone). J. Can. Petroleum Technol. 48 (8), 16–21. doi:10.2118/09-08-16-da
Jin, Y., Zheng, J. L., Liu, X. H., Pan, J. N., and Liu, S. X. (2019). Control mechanisms of self-affine, rough cleat networks on flow dynamics in coal reservoir. Energy 189, 116146. doi:10.1016/j.energy.2019.116146
Li, Q., He, Y. L., Tang, G. H., and Tao, W. Q. (2011). Lattice Boltzmann modeling of microchannel flows in the transition flow regime. Microfluid. Nanofluidics 10 (3), 607–618. doi:10.1007/s10404-010-0693-1
Li, Q., Liu, D., Cai, Y., Zhao, B., Lu, Y., and Zhou, Y. (2021). Effects of natural micro-fracture morphology, temperature and pressure on fluid flow in coals through fractal theory combined with lattice Boltzmann method. Fuel 286, 119468. doi:10.1016/j.fuel.2020.119468
Li, Z. Q., Peng, J. S., Li, L., Qi, L. L., and Li, W. (2021). Novel dynamic multiscale model of apparent diffusion permeability of methane through low-permeability coal seams. Energy fuels. 35 (9), 7844–7857. doi:10.1021/acs.energyfuels.1c00324
Liu, L. F., Wang, Y. H., and Aryana, S. A. (2021). Insights into scale translation of methane transport in nanopores. J. Nat. Gas Sci. Eng. 96, 104220. doi:10.1016/j.jngse.2021.104220
Liu, W., Xu, H., Wu, D. Y., Qin, Y. P., Liu, J., and Zhao, W. (2021). Gases migration behavior of adsorption processes in coal particles: Density gradient model and its experimental validation. Process Saf. Environ. Prot. 152, 264–277. doi:10.1016/j.psep.2021.06.014
Liu, Y. W., Du, Y., Li, Z. Q., Zhao, F. J., Zuo, W. Q., Wei, J. P., et al. (2020). A rapid and accurate direct measurement method of underground coal seam gas content based on dynamic diffusion theory. Int. J. Min. Sci. Technol. 30 (6), 799–810. doi:10.1016/j.ijmst.2020.07.004
Liu, Y. W., Jia, H. J., Zuo, W. Q., Han, H. K., Chang, P., Miao, J., et al. (2022). A model for gas transport through nanopores based on effective molecular free path. J. China Univ. Min. Technol. 51 (01), 90–99. doi:10.13247/j.cnki.jcumt.001341
Liu, Y. W. (2011). Study on gas emission rules, mechanism and dynamic model from coal particle. Doctoral dissertation. Jiaozuo: Henan Polytechnic University, 123–127.
Michalis, V. K., Kalarakis, A. N., Skouras, E. D., and Burganos, V. N. (2010). Rarefaction effects on gas viscosity in the Knudsen transition regime. Microfluid. Nanofluidics 9 (4-5), 847–853. doi:10.1007/s10404-010-0606-3
Nie, X. B., Doolen, G. D., and Chen, S. Y. (2002). Lattice-Boltzmann simulations of fluid flows in MEMS. J. Stat. Phys. 107 (1), 279–289. doi:10.1023/a:1014523007427
Roslin, A., Pokrajac, D., and Zhou, Y. (2019). Cleat structure analysis and permeability simulation of coal samples based on micro-computed tomography (micro-CT) and scan electron microscopy (SEM) technology. Fuel 254, 115579. doi:10.1016/j.fuel.2019.05.162
Ruckenstein, E., Vaidanathan, A. S., and Youngquist, G. R. (1971). Sorption by solids with bidisperse pore structures. Chem. Eng. Sci. 26 (9), 1305–1318. doi:10.1016/0009-2509(71)80051-9
Succi, S. (2002). Mesoscopic modeling of slip motion at fluid-solid interfaces with heterogeneous catalysis. Phys. Rev. Lett. 89 (6), 064502–064509. doi:10.1103/physrevlett.89.064502
Tao, S., Zhang, H. L., Guo, Z. L., and Wang, L. P. (2018). Numerical investigation of dilute aerosol particle transport and deposition in oscillating multi-cylinder obstructions. Adv. Powder Technol. 29 (9), 2003–2018. doi:10.1016/j.apt.2018.05.007
Verhaeghe, F., Luo, L., and Blanpain, B. (2009). Lattice Boltzmann modeling of microchannel flow in slip flow regime. J. Comput. Phys. 228 (1), 147–157. doi:10.1016/j.jcp.2008.09.004
Wang, D. K., Liu, S. M., Wei, J. P., Wang, H. L., and Yao, B. H. (2017). A research study of the intra-nanopore methane flow law. Int. J. Hydrogen Energy 42 (29), 18607–18613. doi:10.1016/j.ijhydene.2017.04.195
Wang, D. K., Tian, X. R., Wei, J. P., Zhang, H. T., Yao, B. H., Zhang, H., et al. (2022). Fracture evolution and nonlinear seepage characteristic of gas-bearing coal using X-ray computed tomography and the lattice Boltzmann method. J. Petroleum Sci. Eng. 211, 110144. doi:10.1016/j.petrol.2022.110144
Wang, H. B., Li, T., Zou, Q. L., Cheng, Z. H., and Yang, Z. K. (2020). Influences of path control effects on characteristics of gas migration in a coal reservoir. Fuel 267, 117212. doi:10.1016/j.fuel.2020.117212
Wang, H. Y., Yang, X., Du, F., Wang, G. D., Wang, Y. Y., Zhao, W., et al. (2021). Calculation of the diffusion coefficient of gas diffusion in coal: The comparison of numerical model and traditional analytical model. J. Petroleum Sci. Eng. 205, 108931. doi:10.1016/j.petrol.2021.108931
Wang, J. J., Kang, Q. J., Chen, L., and Rahman, S. S. (2017). Pore-scale lattice Boltzmann simulation of micro-gaseous flow considering surface diffusion effect. Int. J. Coal Geol. 169, 62–73. doi:10.1016/j.coal.2016.11.013
Wang, Q., Li, C., Zhao, Y., and Ai, D. (2020). Study of gas emission law at the heading face in a coal-mine tunnel based on the Lattice Boltzmann method. Energy Sci. Eng. 8 (5), 1705–1715. doi:10.1002/ese3.626
Wang, Y. D., Chung, T., Rabbani, A., Armstrong, R. T., and Mostaghimi, P. (2021). Fast direct flow simulation in porous media by coupling with pore network and Laplace models. Adv. Water Resour. 150, 103883. doi:10.1016/j.advwatres.2021.103883
Wang, Y. D., Xue, J. K., Wang, D. S., and Xue, Q. Z. (2020). Lattice Boltzmann method for simulation of shale gas flow in kerogen nano-pores considering temperature dependent adsorption. Int. J. Oil Gas Coal Technol. 23 (4), 409–426. doi:10.1504/ijogct.2020.106145
Wu, K. L., Li, X. F., and Chen, Z. X. (2015). A model for gas transport though nanopores of shale gas reservoirs[J]. Acta Petro-lei Sin. 36 (7), 837889–838848.
Yan, M., Zhou, M., Li, S. G., Lin, H. F., Zhang, K. Y., Zhang, B. B., et al. (2021). Numerical investigation on the influence of micropore structure characteristics on gas seepage in coal with lattice Boltzmann method. Energy 230, 120773. doi:10.1016/j.energy.2021.120773
Yang, X., Zhou, W. N., Liu, X. L., and Yan, Y. Y. (2020). A multiscale approach for simulation of shale gas transport in organic nanopores. Energy 210, 118547. doi:10.1016/j.energy.2020.118547
Yu, X., Xu, L. C., Regenauer-Lieb, K., Jing, Y., and Tian, F. B. (2020). Modeling the effects of gas slippage, cleat network topology and scale dependence of gas transport in coal seam gas reservoirs. Fuel 264, 116715. doi:10.1016/j.fuel.2019.116715
Keywords: transition flow regime, micro/nanopore flow experiment, monolayer adsorption, multi-relaxation-time (MRT), expansion simulation
Citation: Liu Y, Jia H, Han H, Zuo W, Shi J, Chang P, Miao J, He Y and Peng J (2022) Research on the gas migration trend and mechanism of the transition flow regime in coal based on MRT-LBM simulation. Front. Earth Sci. 10:1022845. doi: 10.3389/feart.2022.1022845
Received: 19 August 2022; Accepted: 06 September 2022;
Published: 23 September 2022.
Edited by:
Shuren Wang, Henan Polytechnic University, ChinaReviewed by:
Fangtian Wang, China University of Mining and Technology, ChinaBing Bai, Beijing Jiaotong University, China
Copyright © 2022 Liu, Jia, Han, Zuo, Shi, Chang, Miao, He and Peng. This is an open-access article distributed under the terms of the Creative Commons Attribution License (CC BY). The use, distribution or reproduction in other forums is permitted, provided the original author(s) and the copyright owner(s) are credited and that the original publication in this journal is cited, in accordance with accepted academic practice. No use, distribution or reproduction is permitted which does not comply with these terms.
*Correspondence: Hongkai Han, aGhrQGhwdS5lZHUuY24=