- 1National Meteorological Centre, Beijing, China
- 2CMA Earth System Modeling and Prediction Centre, Beijing, China
Accurate long-term forecasts of PM2.5 pollution are essential to mitigating health risks and formulating pollutant control strategies for decision-makers in China. In this study, an objective identification and forecast method for PM2.5 pollution (OIF-PM2.5) is developed based on medium- and long-term ensemble forecasts of PM2.5 in Beijing-Tianjin-Hebei region and its surrounding areas. The results show that the observed PM2.5 pollution ratio increases with the aggravating PM2.5 pollution. For example, the ratio of meteorological stations with heavy pollution is 4.4 times that of light pollution and 3.9 times that of moderate pollution. In addition, the correlation coefficients between observations and forecasts are above 0.60 for all forecast leading times. Statistical results show that the average accuracy for forecasts with the leading times of 1–3 days, 4–7 days, and 8–15 days are 74.1%, 81.3%, and 72.9% respectively, indicating that the OIF-PM2.5 method has a high reliability in forecasts with the leading times of 1–15 days. The OIF-PM2.5 method is further applied in a severe PM2.5 pollution episode in the December of 2021, and the average forecast precision in forecasts with the leading times of 6–8 days reaches as high as 100%, showing a certain reference value for PM2.5 forecasts.
1 Introduction
In terms of economy, urbanization and population growth, the Beijing-Tianjin-Hebei region (BTH) and its surrounding areas are among the most developed regions in China. Meanwhile, severe and frequent PM2.5 (fine particulate matter with an aerodynamic diameter ≤2.5 μm) pollution in this region has attracted more and more attention in recent years due to its complex impacts on visibility, human health and ecological environment (Liu et al., 2019; Li et al., 2021a; Cheng et al., 2021; Sawlani et al., 2021; Zhang et al., 2021). The Chinese government launched the “Air Pollution Prevention and Control Action plan” in 2013 and “2017 Air Pollution Prevention and Management Plan for the Beijing-Tianjin-Hebei Region and its Surrounding Areas” to solve the severe PM2.5 pollution. A series of control measures have been implemented to reduce pollutant emissions, e.g., eliminating industries with high pollution and emission, optimizing industrial and energy structures and restricting vehicle use (Zhang et al., 2014; Chen et al., 2021; Liu et al., 2021). Nonetheless, heavy PM2.5 pollution episodes are still frequent in BTH and its surrounding areas, especially during autumn and winter due to unfavorable meteorological conditions (Zhang et al., 2018; Li et al., 2019; Bei et al., 2020). Accurate PM2.5 pollution forecasts can reduce the air pollutant exposure to sensitive groups and provide necessary reference for making pollution policies and starting control measures in advance, especially before some importance events such as the Asia-Pacific Economic Cooperation Summit 2014 and 70th anniversary of the founding of the People’s Republic of China. Therefore, medium- and long-term PM2.5 forecast is critically important.
Various methods have been used for air pollution forecasting. In general, the forecasting methods can be categorized into three groups: empirical method, statistical approaches and numerical simulations (Zhai and Chen, 2018; Liu and Chen, 2019). The empirical method, also known as a knowledge-based procedure, is based on previous observations, which requires a comprehensive understanding of the pollution dispersion/transport mechanisms and physical-chemical processes (Garner and Thompson, 2012; Yuval et al., 2012). Furthermore, the empirical method is highly dependent on pollution sources and meteorological factors, and previous studies (Zhou et al., 2019; Wu et al., 2020; Samal et al., 2021) have demonstrated that it performs poorly when compared with statistical approaches. Statistical approaches consist of multiple linear regression (Dimitriou and Kassomenos, 2014; Jeong et al., 2021; Liu et al., 2022), Kalman filtering, artificial neural network (Zhou et al., 2020; Bera et al., 2021), long short-term memory (Gao and Li, 2021), support vector machine (Wang et al., 2017) and other hybrid methods (Liu et al., 2020; Huang et al., 2021). It is found that they can successfully forecast the PM2.5 for their capacity of nonlinear mapping. In addition, the deep learning technology has sparked a lot of interest (Pak et al., 2020; Menares et al., 2021; Yang et al., 2021) and proven its superiority in several fields. Deep learning technology is proposed for analyzing the characteristics of historical data. However, all of these statistical approaches only focus on the historical data, which ignore the atmospheric dispersion and transport mechanisms. Furthermore, most of them could only provide short-term forecasts that usually range from 24 to 72 h (Jiang et al., 2021), while most planning and monitoring actions have a greater demand for long-term forecasts. Numerical simulations, such as the Community Multiscale Air Quality Modeling System and the Comprehensive Air quality Model with extensions, can simulate the chemical and physical processes of PM2.5 pollution (Cai et al., 2017; Liu et al., 2018) and thus provide a better understanding of the transformations and distributions of PM2.5. Although numerical models can provide reliable medium-term forecasts, there may be some systematic errors in short-term forecasts. Such models tend to be sensitive to initial and boundary fields (Feng et al., 2020).
Over the past decades, ensemble forecast products have been a major contributor to improving weather forecasts (Yang et al., 2015; Zhao et al., 2022). These products take into account the uncertainty of initial states and process description in numerical weather forecasting models. Ensemble forecasts include several members, representing a set of possible atmospheric conditions in the future. In contrast to deterministic weather forecasts, ensemble forecasts increase the lead time of high-quality forecasts to more than several days. The Observing-system Research and Predictability Experiment (THORPEX) Interactive Grand Global Ensemble (TIGGE) is a database of ensemble forecasts in medium and long ranges conducted by different forecasting centers established for scientific research (Tao et al., 2014). Among all TIGGE data, the European Centre for Medium-Range Weather Forecasts (ECMWF) have presented advantages in the number of ensemble members and spatial resolutions than other forecasting systems (Sagar et al., 2017), consisting of 51 members with a resolution of approximate 0.5° for the whole globe (Zhao et al., 2016). Regarding these advantages, the ECMWF ensemble forecasts are widely applied in forecasting precipitation (Cong et al., 2021), temperature (Verkade et al., 2013), tropical cyclone track (Nishimura and Yamaguchi, 2015) and water deficit depth (Zhao et al., 2016). Based on the ECMWF ensemble forecasts, Schumacher et al. (2011) studied a low-vortex induced rainstorm event in southern United States, and investigated the impact of disturbances in upstream weather systems on precipitation forecasts. Besides, Schauwecker et al. (2021) also conducted a research on the forecast performance of ECMWF Integrated Forecasting System ensemble median run in a heavy precipitation event over Switzerland. The uncertainty in atmospheric forecasts mainly arises from the parameters, initial states and model structure. In the past few years, researchers have proposed various techniques to tackle the uncertainties in ensemble forecasts from different aspects (Demeritt et al., 2007; Yu and Meng, 2016; Ali et al., 2018). For these uncertainties, the forecasting skill can be enhanced by post-processing through multiple-modeling, statistical methods and data assimilation (Li et al., 2021b; Whan et al., 2021; Zhao et al., 2022). However, there are few studies on ensemble forecasting post-processing techniques in the field of PM2.5 forecasting.
In this study, objective identification and forecast method of PM2.5 pollution (OIF-PM2.5) is established based on the medium- and long-term ensemble forecasts with the leading times of 1–15 days. Besides, this method is evaluated by the forecast precision and its applicability is assessed in a PM2.5 pollution episode in BTH and its surrounding areas. The remainder of this paper is organized as follows. Section 2 describes the study area, data and method. Section 3 presents the results and discussions, including the characteristics of PM2.5 pollution, the performance of PM2.5 ensemble forecast and the evaluation of OIF-PM2.5 method. Finally, Section 4 gives the conclusions.
2 Data and methods
2.1 Study areas
The BTH and its surrounding areas include two municipalities (Beijing and Tianjin) as well as the provinces of Hebei, Henan and Shandong. This region is home to the majority of energy-intensive and polluting industries (Tong et al., 2019). In addition, the unfavorable geographical conditions with the Yanshan Mountains to its north and the Taihang Mountains to its west are conducive to the accumulation of pollutants (Bei et al., 2020).
2.2 PM2.5 observations
The medium- and long-term ensemble forecasts of PM2.5 are established based on ground observations from meteorological stations in China. The daily PM2.5 observations are obtained through the neighboring-point interpolation algorithm conducted on data from 417 meteorological stations set up by the China National Environmental Monitoring Centre. All observed samples are divided into two groups of training dataset and testing dataset. The OIF-PM2.5 is established by using the training dataset of the autumns and winters (January, February, March, October, November and December) from 2018 to 2020, and the testing dataset contains the data of the autumn and winter of 2021. The locations of meteorological stations in the study area is presented in Figure 1.
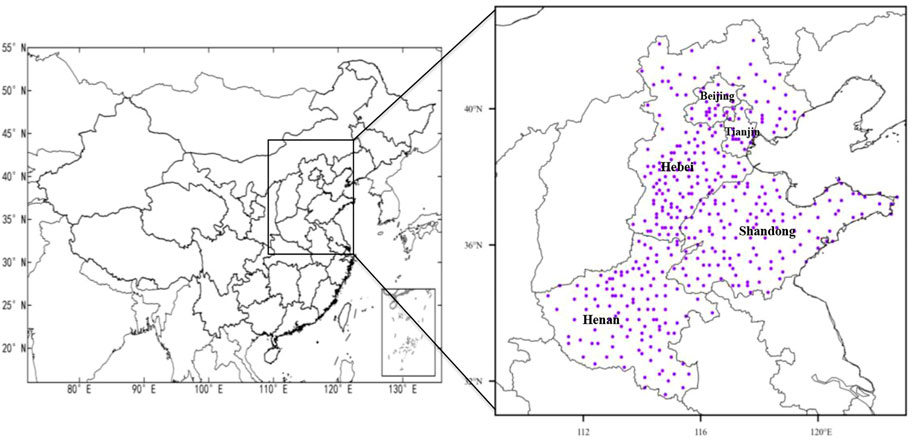
FIGURE 1. Locations of the meteorological stations in Beijing-Tianjin-Hebei (BTH) and its surrounding areas.
2.3 PM2.5 ensemble forecast
Based on regional pollution characteristics, topography and climate differences, the PM2.5 ensemble forecast products are made by using the ECMWF ensemble products. These products contain meteorological factors such as horizontal and vertical diffusion capacities and dry and wet deposition conditions. Furthermore, the forecast equations of daily PM2.5 at each station is set up based on meteorological factors and pollution characteristics in different regions. Finally, the ensemble average forecast, control forecast and 51-members ensemble forecast products are obtained, forming 1–15-day forecast products. In this study, the ensemble average forecast is used to establish the OIF-PM2.5.
2.4 Methods
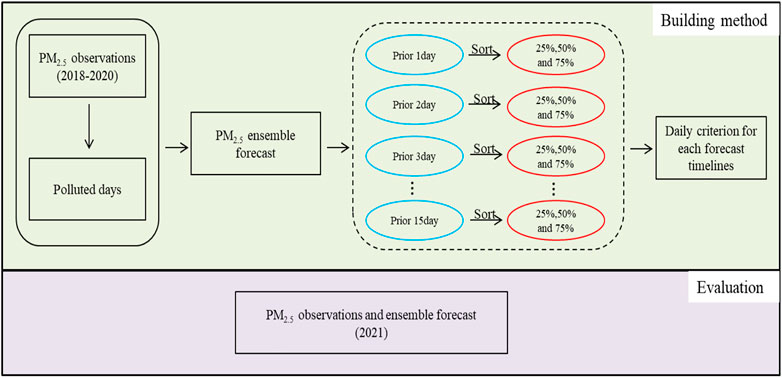
The OIF-PM2.5 technical flowchart is presented in Figure 2. In this study, the performance of PM2.5 ensemble forecast in varying forecasting time ranges is considered. The 25th, 50th and 75th percentiles of forecasted PM2.5 pollution ratios are chosen as the identification thresholds for each forecasting time range corresponding to each polluted day (PM2.5 ≥ 75 μg m−3) in the training dataset. Here, the forecasted PM2.5 pollution ratio is defined as the ratio of the number of stations with PM2.5 ≥ 75 μg m−3 in the ensemble forecast to the total number of stations in this region in each day.
To evaluate the performance and precision of the OIF-PM2.5 method, the 25th percentile is selected as the criterion, and the accuracy as the statistical index. The principle of the accuracy (AC, unit:%) index is listed in Table 1, where NA, NB, NC, and ND variables represent different categories. NA variable represents the forecasted PM2.5 pollution ratio exceeds the 25th percentile on the polluted day, and NC variable means the forecasted PM2.5 pollution ratio exceeds the 25th percentile on the polluted day is lower than the 25th percentile on the polluted day. Consequently, NB and ND variables represent the forecasted PM2.5 pollution ratio are higher or lower than the 25th percentile on non-polluted day, respectively.
3 Results
3.1 Characteristics of PM2.5 pollution
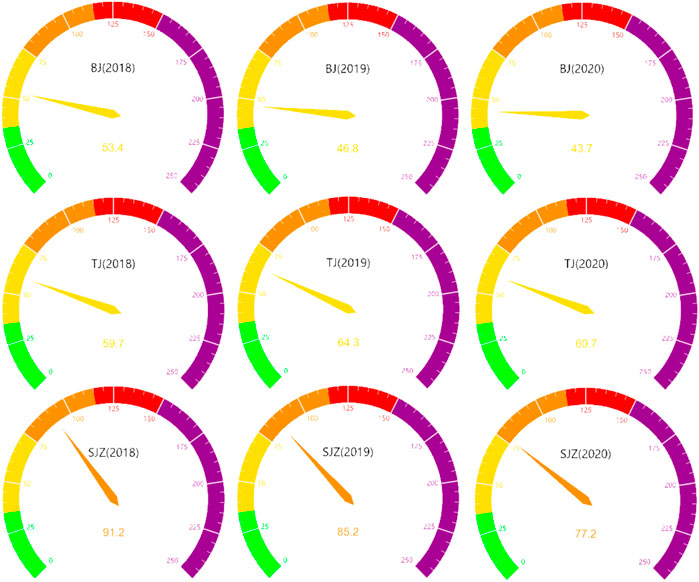
The spatial distributions of average PM2.5 concentrations in BTH and its surrounding areas from 2018 to 2020 are shown in Figure 3. It is worth noting that the PM2.5 concentrations in northern Hebei are below the threshold for the daily average of the China Ambient Air Quality Standard (GB 3095–2012) for PM2.5 (Grade Ⅰ:35 μg m−3). However, the PM2.5 pollution in 2018 and 2019 is heavy in the south and light in the north of the BTH and its surrounding areas, with the main pollution belts concentrated in southern Hebei, central-eastern Henan and western Shandong. In 2020, the PM2.5 level is low in Beijing, Tianjin, Northern Hebei and Shandong, while slightly polluted in Southern Hebei and Northern Henan. In addition, Beijing, Tianjin and Shijiazhuang are selected for comparison (Figure 4). It can be seen that the PM2.5 concentrations of Beijing decrease from 53.4 μg m−3 in 2018 to 43.7 μg m−3 in 2020, while those in Tianjin fluctuate between 59.7 μg m−3 and 64.3 μg m−3 within the same period. In other words, the PM2.5 concentrations of 2020 are 1.2 times and 1.7 times the PM2.5 Grade Ⅰ in Beijing and Tianjin, respectively. What’s more, the PM2.5 concentrations in Shijiazhuang decrease from 91.2 μg m−3 in 2018 to 77.2 μg m−3 in 2020 by 15.3%, which is the largest decrease among the three cities. However, the magnitude of PM2.5 concentrations in 2020 in Shijiazhuang is 2.2 times the PM2.5 Grade Ⅰ.

FIGURE 3. Observations of PM2.5 concentrations in BTH and its surrounding areas in (A) 2018, (B) 2019 and (C) 2020.
The probability distributions and averages of observed PM2.5 pollution ratios under different polluted levels in BTH and its surrounding areas are given in Figure 5, Table 2, respectively. As can be seen, when the average PM2.5 concentration reaches the light level, the ratio of the number of stations with light pollution is the highest within the range of 34%–40%, and the distribution curve follows the law of normal distribution. However, the average PM2.5 pollution ratios for moderate pollution and heavy pollution are 16.6% and 10.4%, respectively. What’s more, the highest ratio of the number of stations with heavy pollution rapidly increases to 35.3% under the level of moderate pollution, which is 1.7 times that of light pollution and 1.5 times that of moderate pollution. In addition, the number of stations with heavy pollution are more than half of the total in this region. Nevertheless, the heavy PM2.5 pollution ratio is 4.4 times that of light pollution and 3.9 times that of moderate pollution. In general, the ratio of polluted meteorological stations is increasing as the PM2.5 pollution aggravates in this region.
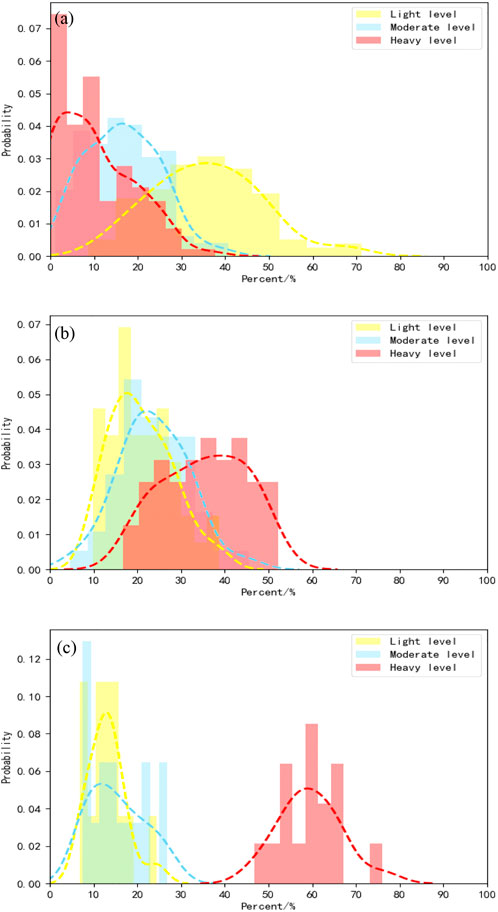
FIGURE 5. Distributions of observed PM2.5 pollution ratios under (A) light pollution, (B) moderate pollution and (C) heavy pollution in BTH and its surrounding areas.
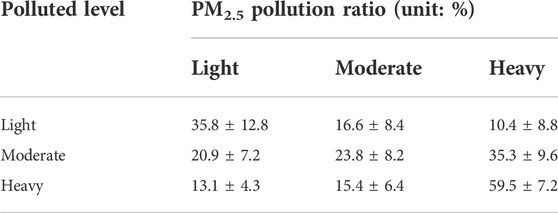
TABLE 2. Average PM2.5 pollution ratios at different polluted levels in BTH and its surrounding areas.
3.2 Performance of PM2.5 ensemble forecasts
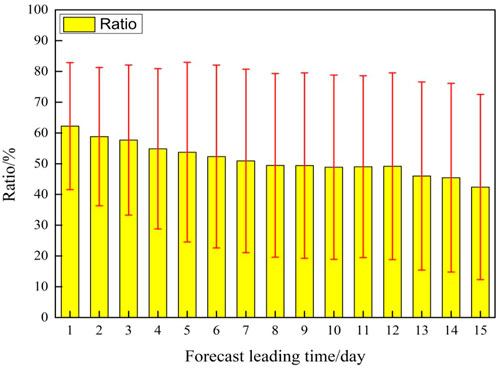
Some studies (Wang and Huang, 2006; Zhao et al., 2021) have revealed that the performance of forecasting products vary with the forecast leading times. The forecasted PM2.5 pollution ratios with different forecast leading times are analyzed based on the training dataset (Figure 6). For PM2.5 ensemble forecasts, the ratio of stations being polluted decreases with the increasing forecast leading times, which is consistent with other forecasting products. The averages of forecasted PM2.5 pollution ratios with the forecast leading times of 1–3 days, 4–7 days and 8–15 days are 59.5%, 52.9% and 47.4%, respectively. That is, the PM2.5 pollution processes at more than 50% meteorological stations in this region can be forecasted by 8 days in advance.
As illustrated in Figure 7A, the bias (forecast minus observation) of PM2.5 pollution ratio increases with the increasing forecast leading time, and the biases are all negative, that is, the forecasted ratios are lower than the observed ones. The biases of PM2.5 pollution ratio with the forecast leading times of 1–6 days are less than −13%; however, the bias remains between −14.1% and −15.4% when the forecast leading time is more than 7 days. Besides, the correlation coefficients of the ratios between the observations and forecasts are more than 0.68 with the forecast leading times being 1–3 days, while above 0.60 for other leading times (Figure 7B). In general, although the forecasted ratios are lower than the observed ones, the correlation between them remains high values, indicating a good performance of the PM2.5 ensemble forecasts.
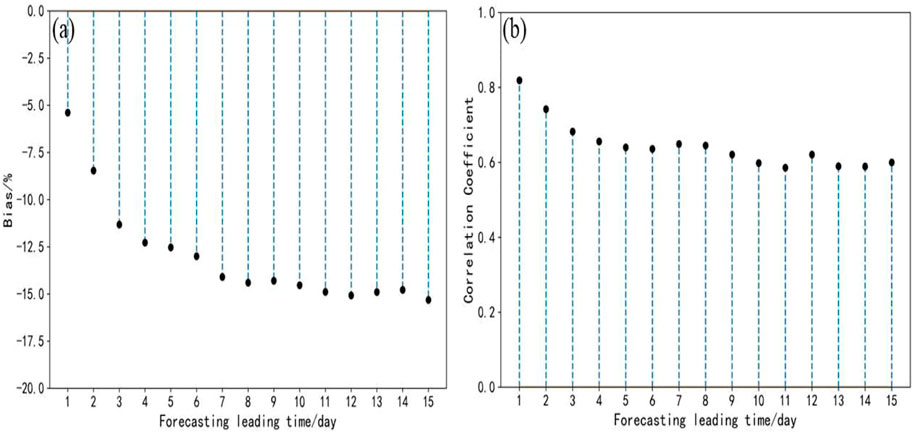
FIGURE 7. (A) Biases (forecast minus observation) of PM2.5 pollution ratios and (B) correlation coefficients between observations and forecasts with different forecast leading times.
The forecasted PM2.5 pollution ratios of the autumns and winters from 2018 to 2020 are calculated, and the corresponding 25th, 50th and 75th percentiles are given in Table 3. The 25th percentiles of the forecasted PM2.5 pollution ratios are below 50% for all forecast leading times, which are below 20% for the leading times of 12–15 days. Besides, the 25th percentiles exceed 30% with the forecast leading times of 1–6 days, with the ratios being 47.6% and 42.2% for the leading times of 1 day and 2 days, respectively. The 50th percentiles are below 70% for all forecast leading times, which are over 60% with the forecast leading times of 1–5 days. Besides, the differences of the 50th percentiles among different forecast leading times are smaller than those of the 25th percentiles. The 75th percentiles of the forecasted PM2.5 pollution ratios are above 70% for most of the forecast leading times, which exceed 75% with the leading times of 1–6 days. In addition, the differences of the 75th percentiles among different forecast leading times are further reduced when compared with those of the 50 percentiles, being only 10.1% between the 1-day and 15-day forecast leading times. In summary, the forecasts of PM2.5 pollution ratio with different leading times are indicative of the occurrence of regional PM2.5 pollution events to some extent.
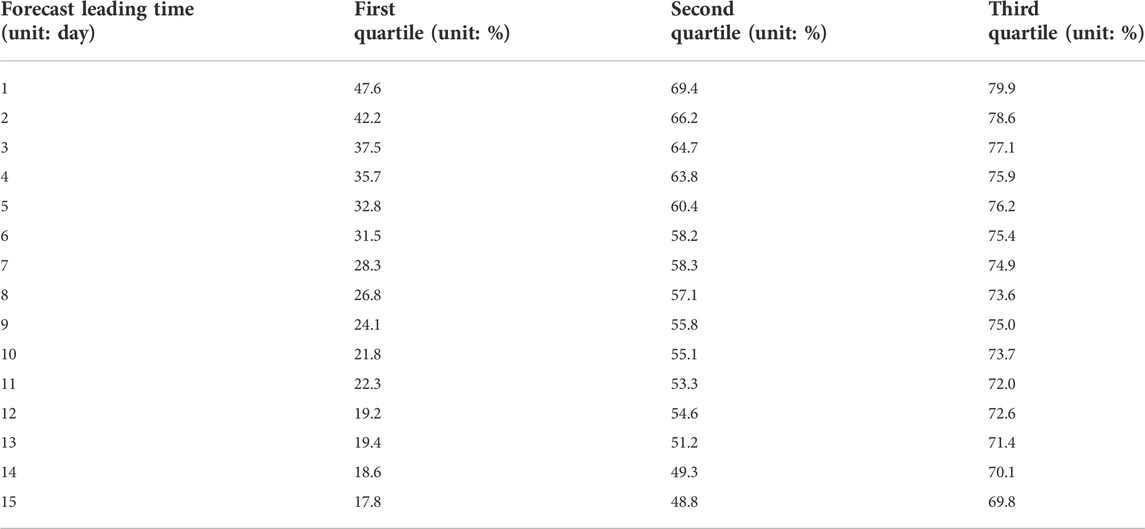
TABLE 3. The first, second and third quartiles of forecasted PM2.5 pollution ratios with different forecast leading times.
3.3 Evaluation of the OIF-PM2.5 method and its application
3.3.1 Performance of the OIF-PM2.5 method
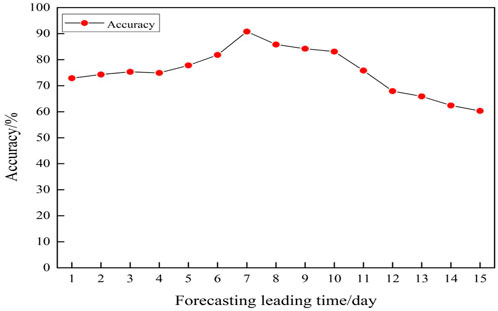
In this study, the accuracy for forecasts in the autumn and winter of 2021 is examined. As illustrated in Figure 8, the accuracy of the OIF-PM2.5 method show a trend of first increase and then decrease, being over 60% for different forecast leading times. The highest accuracy of 90.8% is achieved for the forecasts with the leading time of 7 days. In addition, the average accuracy for forecast leading times of 1–3 days, 4–7 days and 8–15 days are 74.1%, 81.3% and 72.9%, respectively. It is well documented that the ECMWF has better predictability for ensemble forecasts with the leading times of 4–7 days (Huang and Niu, 2017). The evolution of accuracy with different forecast leading times is consistent with that reported in Tao et al. (2017). It indicates that the OIF-PM2.5 method has a high reliability in forecasts with the forecast leading times of 1–15 days.
3.3.2 Application in a PM2.5 pollution process
A regional PM2.5 pollution event occurred in BTH and its surrounding areas from December 8 to 12, 2021 (Figures 9, 10). Most of the region was dominated by PM2.5 pollution of light level on December 9, with the daily average PM2.5 concentration being 88.7 μg m−3 and the pollution ratio being 69.5%. In addition, the atmospheric dispersion conditions worsened in this region during December 10–11. The areas with high PM2.5 concentrations were mainly located in southern Hebei, central and eastern Henan, and central and Western Shandong, with the regional averaged PM2.5 concentrations reaching 118.3 μg m−3 on December 10 and 113.4 μg m−3 on December 11. In addition, the PM2.5 pollution ratio increased to 86.3% on December 10 and 78.2% on December 11, indicating the significant expansion and enhancement of the PM2.5 pollution. Eventually, the PM2.5 concentrations decreased gradually from North to South due to the cold air on December 12, and the air quality reached the excellent and good level in most of the region.
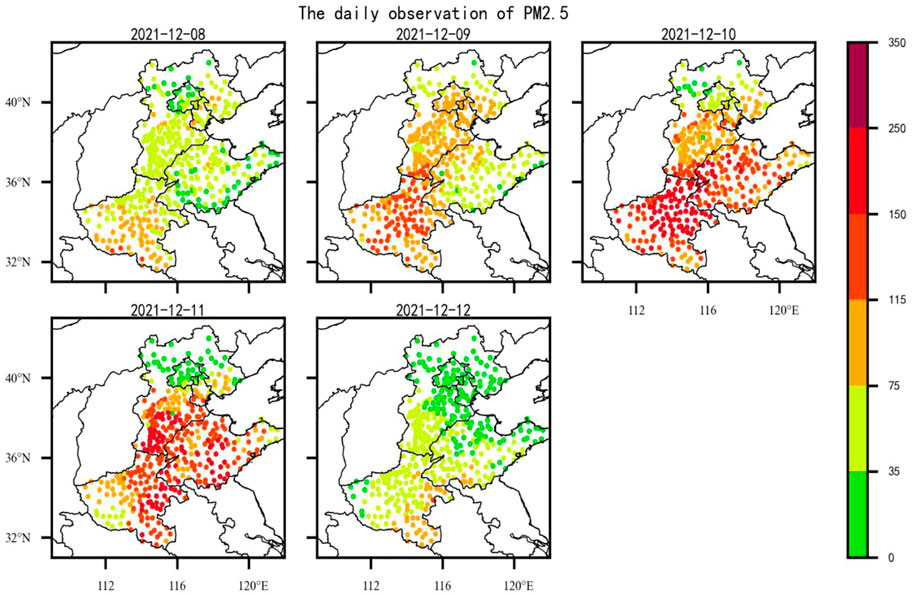
FIGURE 9. Distributions of daily PM2.5 concentrations from December 8 to 12 of 2021 in BTH and its surrounding areas.
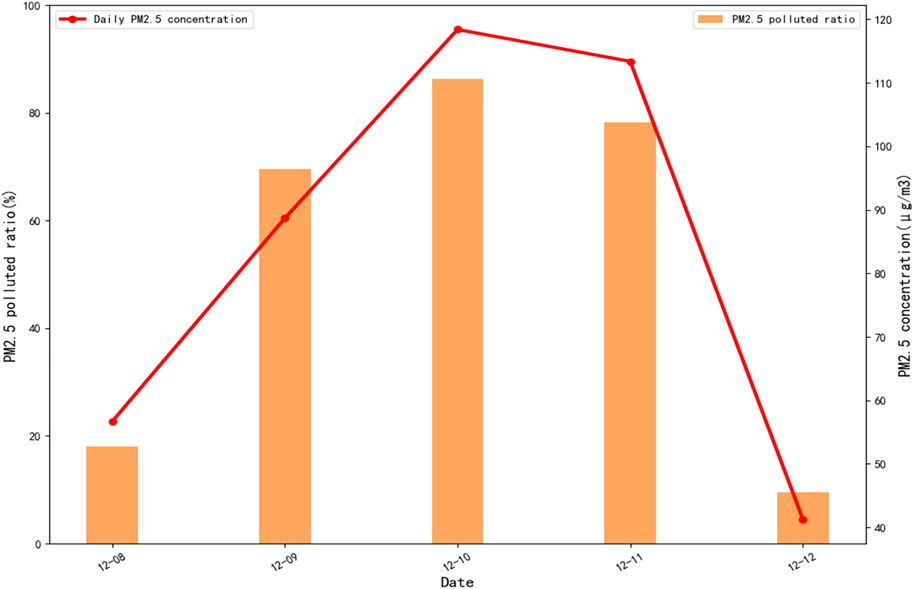
FIGURE 10. Daily PM2.5 concentrations and PM2.5 pollution ratios from December 8 to 12 of 2021 in BTH and its surrounding areas.
Using different forecast initial times, the OIF-PM2.5 method is applied to this pollution episode, and the forecast results are shown in Figure 11. It can be seen that the forecasted PM2.5 pollution ratios for different initial times are consistent with the observations, which is of indicative significance for the evolution of pollution process. For the most polluted period of the pollution process, the pollution ratio of stations on December 10 is 57.7% with the forecast initial time being December 1, which even exceeds the 50th percentile (55.8%). In addition, the values of accuracy under different forecast leading times are also calculated. The results show that the average accuracy reaches 90% (100%) under the leading times of 4–11 days (6–8 days), indicating that the forecast stability of the OIF-PM2.5 method is more stable and is of reference value for forecasts.
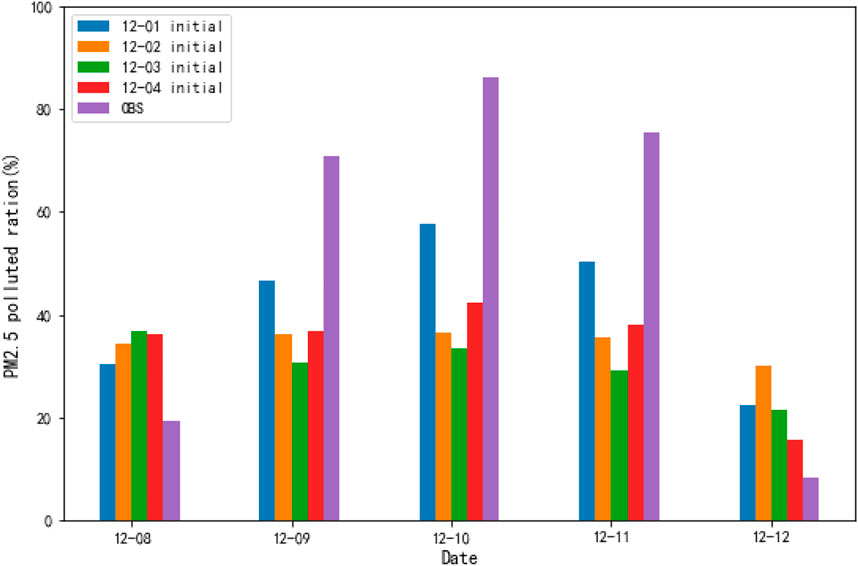
FIGURE 11. PM2.5 pollution ratios for forecasts under different forecast initial times and observations from December 8 to 12 of 2021 in BTH and its surrounding areas.
4 Conclusion and discussion
Based on the medium- and long-term ensemble forecasts of PM2.5 concentrations, the OIF-PM2.5 method is developed in this study. Specifically, different percentiles of forecasted PM2.5 pollution ratios for each forecast leading time from 2018 to 2020 are determined and analyzed. The OIF-PM2.5 method is further evaluated and applied in a PM2.5 pollution episode in 2021. The main conclusions are as follows.
The observed PM2.5 pollution ratio increases with the aggravation of PM2.5 pollution in this region. For example, the heavy pollution ratio is 4.4 times the light pollution ratio and 3.9 times the moderate pollution ratio. Besides, the correlation coefficients between the observed ratios and forecasted ratios are above 0.60 for all forecast leading times in ensemble forecast products. Furthermore, the statistical results show that the average accuracy for forecasts with the leading times of 1–3 days, 4–7 days and 8–15 days in are 74.1%, 81.3% and 72.9%, respectively, indicating that the OIF-PM2.5 method has a high reliability in forecasts with the leading times of 1–15 days. The OIF-PM2.5 method is further applied in a severe PM2.5 pollution episode in the December of 2021. It is revealed that the average accuracy for the forecasts with the leading times of 6–8 days reaches as high as 100%, showing a certain reference value.
The findings of this paper help to understand the PM2.5 concentration forecasts with the forecast leading times of 1–15 days, which can help to minimize the adverse effects of high PM2.5 pollution for society and public health. Moreover, it will help decision makers to formulate pollutant control strategies and take precautions.
Data availability statement
The raw data supporting the conclusion of this article will be made available by the authors, without undue reservation.
Author contributions
Conceptualization, XR; Methodology, BOZ; Data curation and formal analysis and writing—original draft preparation, CL; writing—review and editing, CL and QC; Visualization, BOZ; Funding acquisition: BHZ and QC. All authors have read and agreed to the published version of the manuscript.
Funding
This study was supported by the National Key R & D Program Pilot Projects of China (2019YFC0214602), National Key R & D Program Pilot Projects of China (2021YFC3000900) and National Meteorological Centre forecaster funding (Y202127).
Conflict of interest
The authors declare that the research was conducted in the absence of any commercial or financial relationships that could be construed as a potential conflict of interest.
Publisher’s note
All claims expressed in this article are solely those of the authors and do not necessarily represent those of their affiliated organizations, or those of the publisher, the editors and the reviewers. Any product that may be evaluated in this article, or claim that may be made by its manufacturer, is not guaranteed or endorsed by the publisher.
References
Ali, M., Deo, R. C., Down, N. J., and Maraseni, T. (2018). An ensemble-ANFIS based uncertainty assessment model for forecasting multi-scalar standardized precipitation index. Atmos. Res. 207 (15), 155–180. doi:10.1016/j.atmosres.2018.02.024
Bei, N. F., Li, X. P., Tie, X. X., Zhao, L. N., Wu, J. R., Li, X., et al. (2020). Impact of synoptic patterns and meteorological elements on the wintertime haze in the Beijing-Tianjin-Hebei region, China from 2013 to 2017. Sci. Total Environ. 772 (20), 135210. doi:10.1016/j.scitotenv.2019.135210
Bera, B., Bhattacharjee, S., Sengupta, N., and Saha, S. (2021). PM2.5 concentration prediction during COVID-19 lockdown over Kolkata metropolitan city, India using MLR and ANN models. Environ. Challenges 4, 100155. doi:10.1016/j.envc.2021.100155
Cai, S. Y., Wang, Y. J., Zhao, B., Wang, S. X., Chang, X., and Hao, J. M. (2017). The impact of the “air pollution prevention and control action plan” on PM2.5 concentrations in jing-jin-ji region during 2012–2020. Sci. Total Environ. 580 (15), 197–209. doi:10.1016/j.scitotenv.2016.11.188
Chen, J. D., Gao, M., Li, D., Li, L., Song, M. L., and Xie, Q. J. (2021). Changes in PM2.5 emissions in China: An extended chain and nested refined laspeyres index decomposition analysis. J. Clean. Prod. 294 (20), 126248. doi:10.1016/j.jclepro.2021.126248
Cheng, M. T., Tang, G. Q., Lv, B., Li, X. R., Wu, X. R., Wang, Y. M., et al. (2021). Source apportionment of PM2.5 and visibility in Jinan, China. J. Environ. Sci. 102, 207–215. doi:10.1016/j.jes.2020.09.012
Cong, J., Wu, Z. L., Ma, Y. X., Xu, S., Wang, Y., Sun, M. N., et al. (2021). Improving numerical forecast of the rainstorms induced by Mongolia cold vortex in North China with the frequency matching method. Atmos. Res. 262, 105791. doi:10.1016/j.atmosres.2021.105791
Demeritt, D., Cloke, H., Pappenberger, F., Thielen, J., Bartholmes, J., and Ramos, M. H. (2007). Ensemble predictions and perceptions of risk, uncertainty, and error in flood forecasting. Environ. Hazards 7 (2), 115–127. doi:10.1016/j.envhaz.2007.05.001
Dimitriou, K., and Kassomenos, P. (2014). A study on the reconstitution of daily PM10 and PM2.5 levels in Pariswith a multivariate linear regression model. Atmos. Environ. 98, 648–654. doi:10.1016/j.atmosenv.2014.09.047
Feng, L. W., Li, Y. Y., Wang, Y. M., and Du, Q. Y. (2020). Estimating hourly and continuous ground-level PM2.5 concentrations using an ensemble learning algorithm: The ST-stacking model. Atmos. Environ. 223, 117242. doi:10.1016/j.atmosenv.2019.117242
Gao, X., and Li, W. D. (2021). A graph-based LSTM model for PM2.5 forecasting. Atmos. Pollut. Res. 12 (9), 101150. doi:10.1016/j.apr.2021.101150
Garner, G. G., and Thompson, A. M. (2012). The value of air quality forecasting in the mid-atlantic region. Weather, Clim. Soc. 4 (1), 69–79. doi:10.1175/wcas-d-10-05010.1
Huang, G. Y., Li, X. Y., Zhang, B., and Ren, J. D. (2021). PM2.5 concentration forecasting at surface monitoring sites using GRU neural network based on empirical mode decomposition. Sci. Total Environ. 768 (10), 144516. doi:10.1016/j.scitotenv.2020.144516
Huang, W., and Niu, R. Y. (2017). The medium-term multi-model integration forecast experimentation for heavy rain based on support vector machine. Meteorol. Mon. 43 (9), 1110–1116. (in Chinese).
Jeong, J. L., Park, R. J. L., Yeh, S. W., and Roh, J. W. (2021). Statistical predictability of wintertime PM2.5 concentrations over East Asia using simple linear regression. Sci. Total Environ. 776, 146059. doi:10.1016/j.scitotenv.2021.146059
Jiang, S., Yu, Z. G., Anh, V. V., and Zhou, Y. (2021). Long- and short-term time series forecasting of air quality by a multi-scale framework. Environ. Pollut. 271, 116381. doi:10.1016/j.envpol.2020.116381
Li, F., Yan, J. J., Wei, Y. C., Zeng, J. J., Wang, X. Y., Chen, X. Y., et al. (2021a). PM2.5-bound heavy metals from the major cities in China: Spatiotemporal distribution, fuzzy exposure assessment and health risk management. J. Clean. Prod. 286 (1), 124967. doi:10.1016/j.jclepro.2020.124967
Li, W. T., Pan, B. X., Xia, J. J., and Duan, Q. Y. (2021b). Convolutional neural network-based statistical post-processing of ensemble precipitation forecasts. J. Hydrology 605, 127301. doi:10.1016/j.jhydrol.2021.127301
Li, X., Gao, Z. Q., Li, Y. B., Gao, C. Y., Ren, J. Z., and Zhang, X. Y. (2019). Meteorological conditions for severe foggy haze episodes over north China in 2016–2017 winter. Atmos. Environ. 199 (15), 284–298. doi:10.1016/j.atmosenv.2018.11.042
Liu, C., Hua, C., Zhang, H. D., Zhang, B. H., Wang, G., Zhu, W. H., et al. (2019). A severe fog-haze episode in Beijing-Tianjin-Hebei region: Characteristics, sources and impacts of boundary layer structure. Atmos. Pollut. Res. 10 (4), 1190–1202. doi:10.1016/j.apr.2019.02.002
Liu, H., and Chen, C. (2019). Prediction of outdoor PM2.5 concentrations based on a three-stage hybrid neural network model. Atmos. Pollut. Res. 11 (3), 469–481. doi:10.1016/j.apr.2019.11.019
Liu, H., Long, Z. H., Duan, Z., and Shi, H. P. (2020). A new model using multiple feature clustering and neural networks for forecasting hourly PM2.5 concentrations, and its applications in China. Engineering 6 (8), 944–956. doi:10.1016/j.eng.2020.05.009
Liu, T., Lau, A. K. H., Sandbrink, K., and Fung, J. C. H. (2018). Time series forecasting of air quality based on regional numerical modeling in Hong Kong. J. Geophys. Res. Atmos. 123, 4175–4196. doi:10.1002/2017jd028052
Liu, Z. J., Szpiro, A. A., Workalemahu, T., Young, M. T., Kaufman, J. D., and Enquobahrie, D. A. (2022). Associations of perinatal exposure to PM2.5 with gestational weight gain and offspring birth weight. Environ. Res. 204, 112087. doi:10.1016/j.envres.2021.112087
Liu, Z. Y., Qi, Z. L., Ni, X. F., Dong, M. T., Ma, M. Y., Xue, W. B., et al. (2021). How to apply O3 and PM2.5 collaborative control to practical management in China: A study based on meta-analysis and machine learning. Sci. Total Environ. 772, 145392. doi:10.1016/j.scitotenv.2021.145392
Menares, C., Perez, P., Parraguez, S., and Fleming, Z. L. (2021). Forecasting PM2.5 levels in Santiago de Chile using deep learning neural networks. Urban Clim. 38, 100906. doi:10.1016/j.uclim.2021.100906
Nishimura, M., and Yamaguchi, M. (2015). Selective ensemble mean technique for tropical cyclone track forecasts using multi-model ensembles. Trop. Cyclone Res. Rev. 4 (2), 71–78.
Pak, U., Ma, J., Ryu, U., Ryom, K., Juhyok, U., Pak, K., et al. (2020). Deep learning-based PM2.5 prediction considering the spatiotemporal correlations: A case study of beijing, China. Sci. Total Environ. 699 (10), 133561. doi:10.1016/j.scitotenv.2019.07.367
Sagar, S. K., Rajeevan, M., Rao, S. V. B., and Mitra, A. K. (2017). Prediction skill of rainstorm events over India in the TIGGE weather prediction models. Atmos. Res. 198 (1), 194–204. doi:10.1016/j.atmosres.2017.08.017
Samal, K. K. R., Panda, A. K., Babu, K. S., and Das, S. K. (2021). Multi-output TCN autoencoder for long-term pollution forecasting for multiple sites. Urban Clim. 39, 100943. doi:10.1016/j.uclim.2021.100943
Sawlani, R., Agnihotri, R., and Sharma, C. (2021). Chemical and isotopic characteristics of PM2.5 over New Delhi from September 2014 to May 2015: Evidences for synergy between air-pollution and meteorological changes. Sci. Total Environ. 763, 142966. doi:10.1016/j.scitotenv.2020.142966
Schauwecker, S., Schwarb, M., Rohrer, M., and Stoffel, M. (2021). Heavy precipitation forecasts over Switzerland – an evaluation of bias-corrected ECMWF predictions. Weather Clim. Extrem. 34, 100372. doi:10.1016/j.wace.2021.100372
Schumacher, R. S. (2011). Ensemble-based analysis of factors leading to the development of a multiday warm-season heavy rain event. Mon. Weather Rev. 139 (9), 3016–3035. doi:10.1175/mwr-d-10-05022.1
Tao, Y. M., Duan, Q. Y., Ye, A. Z., Gong, W., Di, Z. H., Xiao, M., et al. (2014). An evaluation of post-processed TIGGE multimodel ensemble precipitation forecast in the Huai river basin. J. Hydrology 519, 2890–2905. doi:10.1016/j.jhydrol.2014.04.040
Tao, Y. W., Dai, K., and Dong, Q. (2017). Extreme analysis and ensemble prediction verification on cold wave process in January 2016. Meteorol. Mon. 43 (10), 1176–1185. (in Chinese). doi:10.7519/j.issn.1000-0526.2017.10.002
Tong, D., Geng, G. N., Jiang, K. J., Cheng, J., Zheng, Y. X., Hong, C. P., et al. (2019). Energy and emission pathways towards PM2.5 air quality attainment in the Beijing-Tianjin-Hebei region by 2030. Sci. Total Environ. 692, 361–370. doi:10.1016/j.scitotenv.2019.07.218
Verkade, J. S., Brown, J. D., Reggiani, P., and Weerts, A. H. (2013). Post-processing ECMWF precipitation and temperature ensemble reforecasts for operational hydrologic forecasting at various spatial scales. J. Hydrology 501 (25), 73–91. doi:10.1016/j.jhydrol.2013.07.039
Wang, P. F., and Huang, G. (2006). A study on the dependency of maximum prediction time on computation precision and time step size in numerical model. Clim. Environ. Res. 11 (3), 395–403. (in Chinese). doi:10.3878/j.issn.1006-9585.2006.03.17
Wang, P., Zhang, H., Qin, Z. D., and Zhang, G. S. (2017). A novel hybrid-Garch model based on ARIMA and SVM for PM2.5 concentrations forecasting. Atmos. Pollut. Res. 8 (5), 850–860. doi:10.1016/j.apr.2017.01.003
Whan, K., Zscheischler, J., Jordan, A. I., and Ziegel, J. F. (2021). Novel multivariate quantile mapping methods for ensemble post-processing of medium-range forecasts. Weather Clim. Extrem. 32, 100310. doi:10.1016/j.wace.2021.100310
Wu, H. P., Liu, H., and Duan, Z. (2020). PM2.5 concentrations forecasting using a new multi-objective feature selection and ensemble framework. Atmos. Pollut. Res. 11 (7), 1187–1198. doi:10.1016/j.apr.2020.04.013
Yang, J., Yan, R., Nong, M. Y., Liao, J. Q., Li, F. P., and Sun, W. (2021). PM2.5 concentrations forecasting in Beijing through deep learning with different inputs, model structures and forecast time. Atmos. Pollut. Res. 12 (9), 101168. doi:10.1016/j.apr.2021.101168
Yang, T. H., Yang, S. C., Ho, J. Y., Lin, G. F., Hwang, G. D., and Lee, C. S. (2015). Flash flood warnings using the ensemble precipitation forecasting technique: A case study on forecasting floods in taiwan caused by typhoons. J. Hydrology 520, 367–378. doi:10.1016/j.jhydrol.2014.11.028
Yu, H. Z., and Meng, Z. Y. (2016). Key synoptic-scale features influencing the high-impact heavy rainfall in Beijing, China, on 21 July 2012. Tellus A Dyn. Meteorology Oceanogr. 68, 31045. doi:10.3402/tellusa.v68.31045
Yuval, , Broday, D. M., and Alpert, P. (2012). Exploring the applicability of future air quality predictions based on synoptic system forecasts. Environ. Pollut. 166, 65–74. doi:10.1016/j.envpol.2012.03.010
Zhai, B. X., and Chen, J. G. (2018). Development of a stacked ensemble model for forecasting and analyzing daily average PM2.5 concentrations in Beijing, China. Sci. Total Environ. 635, 644–658. doi:10.1016/j.scitotenv.2018.04.040
Zhang, H., Xie, B., Zhao, S. Y., and Chen, Q. (2014). PM2.5 and tropospheric O3 in China and an analysis of the impact of pollutant emission control. Adv. Clim. Change Res. 5 (3), 136–141. doi:10.1016/j.accre.2014.11.005
Zhang, Q. Q., Ma, Q., Zhao, B., Liu, X. Y., Wang, X. Y., Jia, B. X., et al. (2018). Winter haze over north China plain from 2009 to 2016: Influence of emission and meteorology. Environ. Pollut. 242, 1308–1318. Part B. doi:10.1016/j.envpol.2018.08.019
Zhang, W. H., Hai, S. F., Zhao, Y. H., Sheng, L. F., Zhou, Y., Wang, W. C., et al. (2021). Numerical modeling of regional transport of PM2.5 during a severe pollution event in the Beijing–Tianjin–Hebei region in November 2015. Atmos. Environ. 254, 118393. doi:10.1016/j.atmosenv.2021.118393
Zhao, G. J., He, N., Hao, C., Li, J., and Li, S. (2021). Evaluation of models and objective methods for temperature in Beijing area. Meteorological Sci. Technol. 49 (6), 870–877. (in Chinese). doi:10.19517/j.1671-6345.20200409
Zhao, J. F., Xu, J. W., Xie, X. M., and Lu, H. Q. (2016). Drought monitoring based on TIGGE and distributed hydrological model in Huaihe River Basin, China. Sci. Total Environ. 553 (15), 358–365. doi:10.1016/j.scitotenv.2016.02.115
Zhao, P. C., Wang, Q. J., Wu, W. Y., and Yang, Q. C. (2022). Extending a joint probability modelling approach for post-processing ensemble precipitation forecasts from numerical weather prediction models. J. Hydrology 605, 127285. doi:10.1016/j.jhydrol.2021.127285
Zhou, Y. L., Chang, F. J., Chang, L. C., Kao, I. F., Wang, Y. S., and Kang, C. C. (2019). Multi-output support vector machine for regional multi-step-ahead PM2.5 forecasting. Sci. Total Environ. 651 (1), 230–240. doi:10.1016/j.scitotenv.2018.09.111
Keywords: PM 2.5 pollution, ensemble forecast, forecast technology, objective identification and forecast method for PM2.5 pollution, beijing-tianjin-hebei region and its surrounding areas
Citation: Liu C, Rao X, Chen Q, Zhang B and Zhang B (2023) Objective identification and forecast method of PM2.5 pollution based on medium- and long-term ensemble forecasts in Beijing-Tianjin-Hebei region and its surrounding areas. Front. Earth Sci. 10:1022565. doi: 10.3389/feart.2022.1022565
Received: 18 August 2022; Accepted: 01 November 2022;
Published: 05 January 2023.
Edited by:
Lingling Shen, Beijing Meteorological Information Center, ChinaReviewed by:
Ying Zhou, Beijing University of Technology, ChinaDuanyang Liu, Chinese Academy of Meteorological Sciences, China
Copyright © 2023 Liu, Rao, Chen, Zhang and Zhang. This is an open-access article distributed under the terms of the Creative Commons Attribution License (CC BY). The use, distribution or reproduction in other forums is permitted, provided the original author(s) and the copyright owner(s) are credited and that the original publication in this journal is cited, in accordance with accepted academic practice. No use, distribution or reproduction is permitted which does not comply with these terms.
*Correspondence: Xiaoqin Rao, cmFveHFAY21hLmdvdi5jbg==; Qiying Chen, Y2hlbnF5QGNtYS5nb3YuY24=
 Chao Liu
 Xiaoqin Rao
 Qiying Chen2*
 Bo Zhang