 Keying Wang
 Ningbo Cai
 Jiang Du1,2
95% of researchers rate our articles as excellent or good
Learn more about the work of our research integrity team to safeguard the quality of each article we publish.
Find out more
ORIGINAL RESEARCH article
Front. Earth Sci. , 09 September 2022
Sec. Economic Geology
Volume 10 - 2022 | https://doi.org/10.3389/feart.2022.1020313
This article is part of the Research Topic Exploration, Exploitation, and Utilization of Coal-Measure Gas into the Future View all 16 articles
The Ziyun-Luodian area of southern Guizhou province in China is chosen as the research area and the Dawuba formation in Carboniferous system is the target stratum in this paper. Combined with laboratory experiments and mathematical analyses, geological evaluations on organic geochemistry, physical property of the reservoir, and gas bearing feature are all studied, and geological controls on gas occurrence are then analyzed. The following conclusions are achieved. The organic type is mainly II2 or III. TOC is generally in a range of 1%–3%, and Ro,max ranges from 1.7% to 4.4%, with an average value of 2.4%. Mineral compositions are mainly clay and quartz, with a few calcite and dolomite. The Specific surface area ranges from 6.6 to 29.8 m2/g, with an average value of 15.2 m2/g, and the pore volume varies from 0.012 to 0.046 cm3/g, with an average value of about 0.02 cm3/g. There is a strongly and positively linear relationship between specific surface area and pore volume. The porosity is mostly in the range of 1%–3%, with an average value of 1.8%. Most of permeability is below 0.01 mD, with an average value of about 0.004 mD. There is an exponential and positive relationship between porosity and permeability. The gas content is generally below 2.0 m3/t. There are three obvious correlations for gas content versus buried depth ranges of 500–700 m, 700–1,000 m, and 2,700–3,000 m. TOC influences gas content in a linear mode, and Ro,max influences gas content positively. The gas content has a positive relationship with clay mineral and a negative relationship with sapropelic percentage. The porosity and permeability are both positively correlated with gas content. The pore volume has a positive trend with gas content, and the specific surface area has a positively and strongly linear relationship with gas content.
Shale is a source, reservoir and trap for significant quantities of methane and minor amounts of other gases, with the coexistence of absorbed and free gas (Dow, 1977; Curtis, 2002; Jarvie et al., 2007; Ross and Bustin, 2009). This gas, referred to as shale gas, is potentially an important economic resource, and has received worldwide attentions as a clean and unconventional energy (Schmoker, 1980; Bowker, 2007; Chen et al., 2011).
Exploration and exploitation on shale gas in China are relatively late compared with that in America (Li et al., 2007). Besides, geological setting of shale gas in China is quite complex, especially in southern China. Till now, researches on shale gas in southern China usually focus on Sichuan basin, while relatively few researches have been carried out in Guizhou province (Zou C et al., 2010; Huang et al., 2012; Yang et al., 2014; Meng et al., 2016; Ma et al., 2018). As a typical area for shale gas exploration and exploitation in Guizhou province, the Ziyun-Luodian area is selected as the research area in this paper. Current researches show that multiple shale layers are developed in this area, with a vast distribution and a high organic content, among which, the Dawuba formation has been demonstrated to be the most potential stratum and is the target stratum in this study (Wang et al., 2012).
It is of great significance to study shale gas geology on reservoir geometry, organic maceral, organic type, organic abundance, organic maturity, mineral composition, pore system and gas bearing feature (Martini et al., 2003; Bowker, 2007; Martineau, 2007; Loucks et al., 2012; Zou et al., 2015a, 2015b; Qi et al., 2019; Qi et al., 2022). Combined with the physical experiments and mathematical analyses, the geological evaluation and gas bearing analysis are both conducted in this paper, which provides references for shale gas exploration in the future.
Core samples in the Dawuba formation from wells C01, D01, and Z01 were fully collected, as well as outcrop samples in cities of Ziyun, Changshun, Huishui, Qinglong, Manchang, Wangyou, Daihua, and Zhenning. Sample locations can be found in Figure 1.
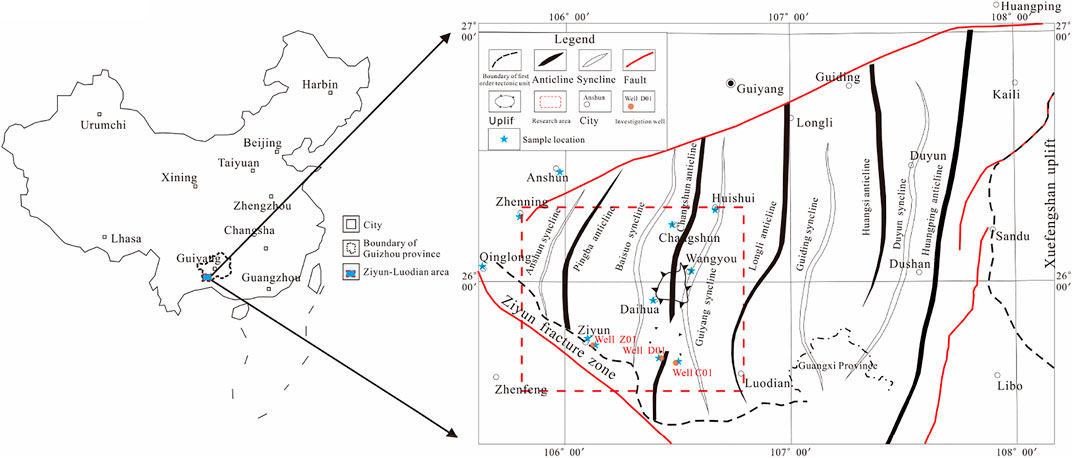
FIGURE 1. Structure outline and sample locations in the research area.
Samples were immediately shipped back to the lab after collection. Three types of samples were prepared in this study. The first type was cylinder samples with a diameter of 25 mm and a height of 30–50 mm; and they were used for permeability test (PT). The second type was block samples with a maximum length of about 15 mm, which were used for mercury intrusion porosimetry (MIP), total organic carbon (TOC), and isothermal adsorption (IA). The last type was particle samples with about 3 g weight and 60 mesh in size, and they were prepared for organic maceral (OM), mineral composition (MC), vitrinite reflectance (VR), and nitrogen adsorption under low temperature (NALT).
All the above mentioned experiments were made on prepared samples. Besides, gas content test (GCT) was made on the field. All experiments were conducted with the guidance of China’s national standard or industry standard. Samples used in each experiment are listed in Table 1.
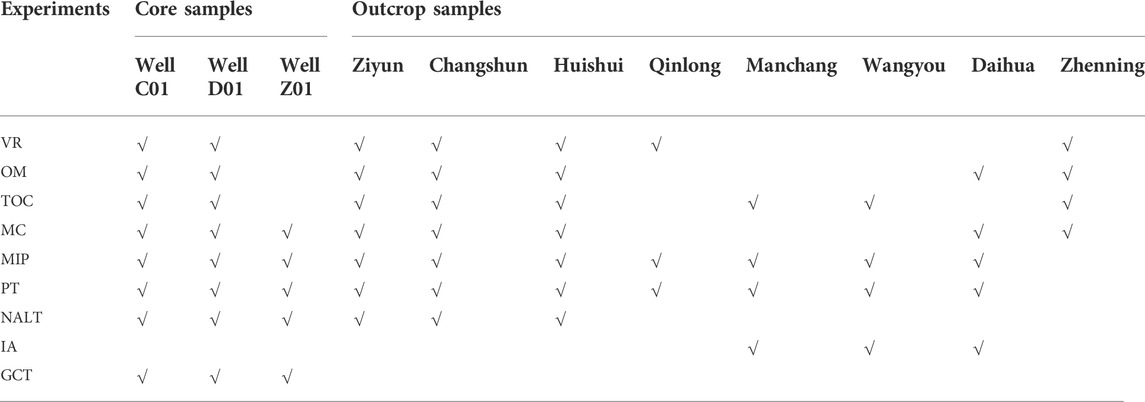
TABLE 1. Samples used in each experiment.
Some descriptions should be noted for those experiments. The MIP measurement ran up to a pressure of 6 × 10⁴ Psia, which shows that pore diameters as small as 3 nm were penetrated. For the IA measurement, the temperature was set to 30°C, and the Langmuir equation and capacity method were adopted during the measurement. During the NALT measurement, the related parameters were set as follows: Experimental temperature, 77.37 K; degassing temperature, 120°C; degassing time, 240 min, and the BET equation was used to calculated the specific surface area and pore volume of the samples. The PT measurement was simulated under situ stress conditions using a triaxial cell with an isotropic ambient pressure of 2.5 MPa. The GCT measurement was conducted by using desorption method, and the gas content consisted of desorbed gas, residual gas and lost gas. Measurements of VR, OM, and MC are conducted following the Chinese oil and gas industry standard (SY/T) 5124-2012, 5125-2014, and 5163-2010, respectively. The TOC measurement is conducted following the China’s national standard of GB/T19145-2003.
The structure outline of the research area is shown in Figure 1. The research area locates at the southern Guizhou depression of China, in which synclines and anticlines are arranged alternately. Trough-like folds are developed, with compressional north-south structures passing through the entire area. Main structures within the research area are Anshun syncline, Pingba anticline, Baisuo syncline, Changshun anticline, Guiyang syncline, and Longli anticline, et al. Major morphologies of the anticlines are box-shaped with widths of about 30–50 km, while the synclines are trough-shaped with widths of about 10–15 km. Most of the faults are thrust faults with big angles, trending north-south or northeast, and they are perpendicular with northwestern or northeastern fractures.
The Dawuba formation occurs in the lower Carboniferous system, and can be divided into two parts. The lower part mainly consists of dark gray shale, silty shale and a small amount of siltstone, while the upper part is composed of black limestone, calcareous shale and siliceous shale. The Dawuba formation is laterally stable and ranges in a thickness from 128 to 204 m for mud or shale inside, with an average value of 166 m. The thickness reaches a peak around Ziyun or Wangyou city and then reduces towards Changshun-Daihua city. The depth of the stratum shows a trend of decreasing first and then increasing from west to east. The maximum depth is about 4,500 m around Ziyuan city, and the minimum depth can reduce to less than 1,000 m in the central area.
Core samples from wells D01 and C01 and outcrop samples from cities of Ziyun, Changshun, Huishui, Daihua, and Zhenning are all collected to conduct the OM measurement. For well D01, sapropelinite varies between 15% and 95%, with an average value of 52%; and percentage ranges of exinite, vitrinite and inertinite are 5%–65%, 1%–43%, and 1%–22%, respectively, with their respective averages of 49%, 18%, and 7%. For well C01, sapropelinite is between 1 and 6%, with an average value of 3%; and percentages of exinite, vitrinite, and inertinite are 43%–75%, 13%–45%, and 3%–19%, respectively, and their respective averages are 59%, 31%, and 8%. Experiments on outcrop samples show that the sapropelinite ranges from 22% to 84%, and the average is 54%; and percentage ranges of exinite, vitrinite and inertinite are 12%–61%, 1%–30%, and 1%–43%, respectively, with their averages of 35%, 12%, and 16%, respectively.
Regarding all the samples above, a three element diagram concerning sapropelinite, vitrinite plus inertinite, and exinite is drawn as shown in Figure 2. The figure indicates that sapropelic and hybrid types are the main organic types, while the humus type is much less developed.
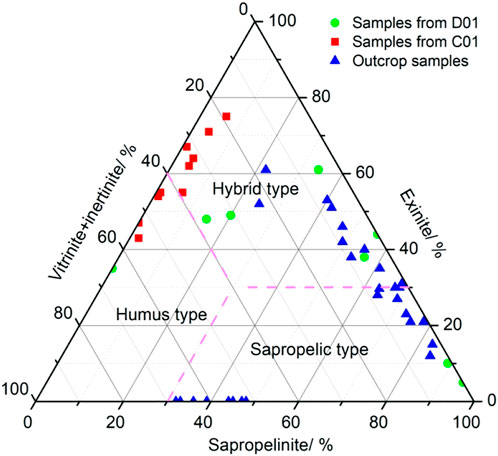
FIGURE 2. Three element diagram to distinguish organic type.
As a very important parameter, TI is used here to evaluate kerogen type, which is expressed as follows,
where, a, b, c, and d represent sapropelic, exinite, vitrinite, and inertinite, respectively.
According to Dow (1977) and Tissot and Welte (1978), four organic types are classified. They are type I with TI higher than 80, which is much beneficial for oil generation; type II1 with TI between 80 and 40, which is quite beneficial for oil generation; type II2 with TI between 0 and 40, which is quite beneficial for gas generation; and type III with TI lower than 0, which is much beneficial for gas generation. Then, for shale samples in well D01, TI ranges from −37 to 98, and all the four organic types can be distinguished, with type II2 as the majority. For shale samples in well C01, TI ranges from −21 to 29, and the organic types are II2 and III. While for outcrop samples, TI is between −30 and 89, and all the four organic types are developed. As a result, the organic types are mostly II2 and III in this area, which is beneficial for gas generation.
Core samples from wells D01 and C01 and outcrop samples from cities of Ziyun, Changshun, Huishui, Manchang, Wangyou, and Zhenning are all collected to conduct the TOC measurement. As can be seen from Figure 3, TOC is 0.4%–6.9% and the average value is 2.19% for samples collected from well D01. The frequency histogram in Figure 3 indicates that most of the TOC values range from 1% to 3%. As can be seen from Figure 4, TOC value varies from 0.2% to 4.5% and the average value is 1.8% for samples in well C01. The frequency histogram in Figure 4 indicates that 35% of the TOC values are higher than 2.0%, and 90% of the values are higher than 1.0%. For the outcrop samples, TOC is mainly in a range of 1.0%–3.0%. Therefore, TOC values in this area are mainly in the range of 1%–3%, and values lower than 1% or higher than 3% are relatively few. Generally, a TOC range of higher than 1% is considered to be conducive to organic matter accumulation. Therefore, most of the source rock in this area is quite beneficial for the organic accumulation.
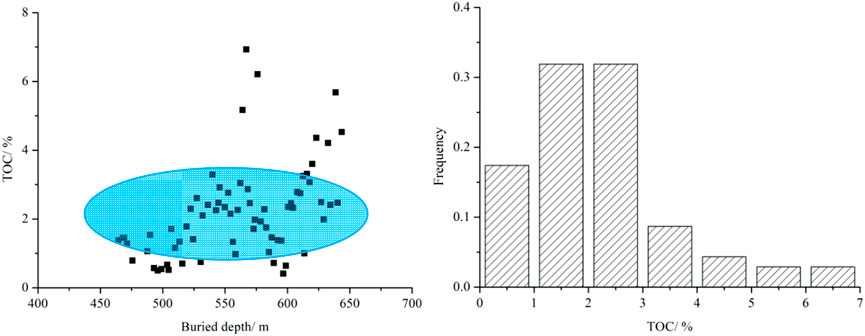
FIGURE 3. TOC variation with depth (left) and TOC frequency histogram (right) for well D01.

FIGURE 4. TOC variation with depth (left) and TOC frequency histogram (right) for well C01.
Core samples from wells D01 and C01 and outcrop samples from cities of Ziyun, Changshun, Huishui, Qinlong, and Zhenning are all collected to conduct the VR measurement. Ro,max values for wells D01 and C01 are shown in Figure 5. It can be seen from the figure that the Ro,max for well D01 ranges from 2.2% to 2.7%, with an average value of about 2.4%; and Ro,max for well C01 varies from 2.1% to 3.3%, with an average value of about 2.7%. Generally, Ro,max for core samples from wells D01 and C01 is from 2.2% to 2.7%. Ro,max values for outcrop samples are shown in Figure 6. The figure shows that Ro,max values for outcrop samples range from 1.7% to 4.4%, with an average value of about 2.4%, which is a little higher than the values from core samples. The main Ro,max range for outcrop samples is 1.7%–3.0%, which is approximate with that for core samples. As a result, the coalification degree in this area is quite high.
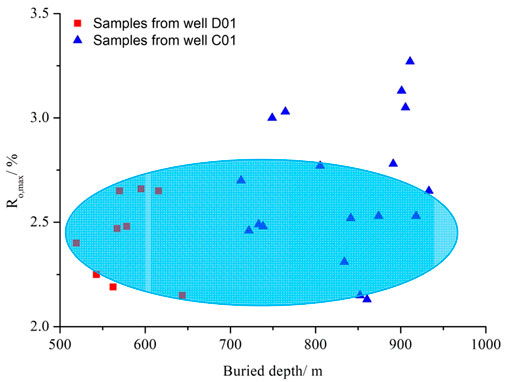
FIGURE 5. Ro,max values for the core samples from wells D01 and C01.
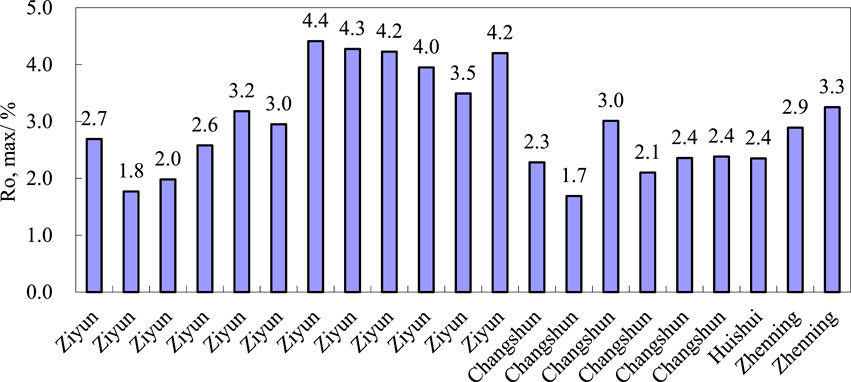
FIGURE 6. Ro,max values for the outcrop samples.
Core samples from wells D01, C01, and Z01 and outcrop samples from cities of Ziyun, Changshun, Huishui, Daihua, and Zhenning are all collected to conduct the MC measurement. Mineral compositions of the Dawuba formation in the research area are mainly clay and quartz, with a few calcite and dolomite, and the contents of other minerals including plagioclase, potash feldspar, and pyrite are rarely detected, as shown in Figure 7. The percentage of clay varies from 17.6% to 58.4% and its average value is 46.3%; while the percentage of quartz ranges from 21.7% to 53.0% and its average value is 37.6%. The distribution of calcite is extremely inhomogeneous, and its percentage is between 0% and 48.6%, with an average value of about 11.9%. The dolomite also distributes inhomogeneously, and its percentage varies from 0% to 23.0%, with an average value of about 8.5%.
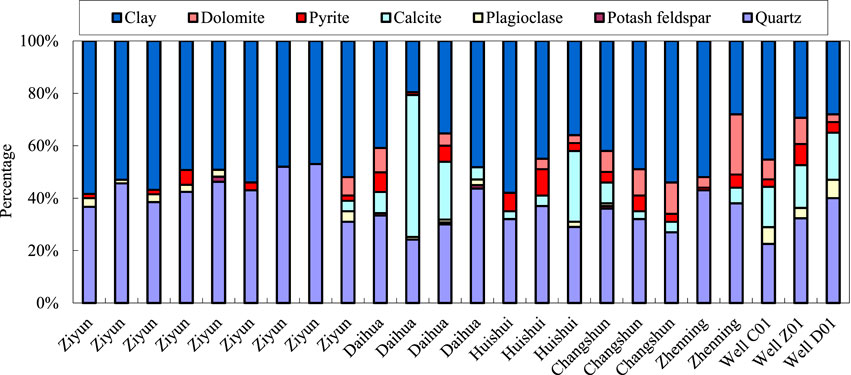
FIGURE 7. Mineral compositions for the core samples and outcrop samples.
Core samples from wells D01, C01, and Z01 and outcrop samples from cities of Ziyun, Changshun, and Huishui are all collected to conduct the NALT measurement, and the results are shown in Figure 8. The figure shows that the specific surface area ranges from 6.6 to 29.8 m2/g, with an average value of 15.2 m2/g; and the pore volume varies from 0.012 to 0.046 cm3/g, with an average value of 0.02 cm3/g. There is a strongly and positively linear relationship between specific surface area and pore volume in this area, and the fitting degree can reach about 0.6.
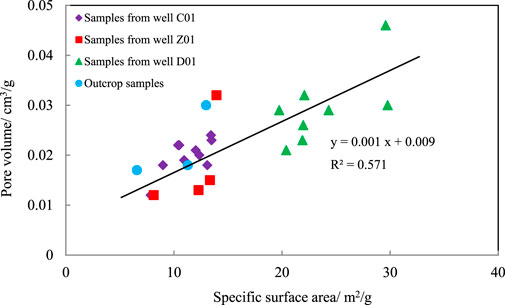
FIGURE 8. Fitting diagram between specific surface area and pore volume.
Core samples from wells D01, C01, and Z01 and outcrop samples from cities of Ziyun, Changshun, Huishui, Qinlong, Manchang, Wangyou, and Daihua are all collected to conduct the MIP and PT measurements, and the results are shown in Figure 9. The figure indicates that the porosity in the research area ranges from 0.32% to 4.57%, with an average value of about 1.8% and the major range of 1%–3%; and the permeability varies from 0.001 to 0.029 mD, with an average value of about 0.004 mD, and most of the permeability is below 0.01 mD. The figure also indicates that there is an exponential and positive relationship between porosity and permeability, with a fitting degree of about 0.5.
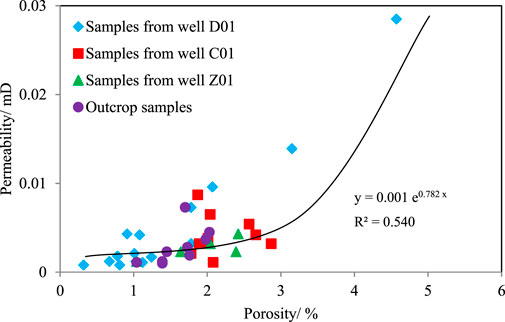
FIGURE 9. Fitting diagram between porosity and permeability.
Thirty two core samples from well C01, 57 core samples from well D01 and 18 core samples from well Z01 are collected, and GCT measurements are then conducted on the field. The frequency histogram for gas content is therefore drawn as shown in Figure 10. The figure indicates that the gas content is mostly below 2.0 m3/t in this area, with extremely few values higher than 4 m3/t. Meanwhile, IA measurements for outcrop samples of Wangyou, Manchang and Daihua are conducted and shown in Figure 11. The figure indicates that adsorption volume can be higher than 2 m3/t for the Daihua sample, and be higher than 1.5 m3/t for the Manchang and Wangyou samples as pressure increasing, although the weathering may reduce the gas bearing property for outcrop samples. All the above indicates that the gas bearing feature is quite good, and the research area can be treated as an effective area for the shale gas exploitation in the future.
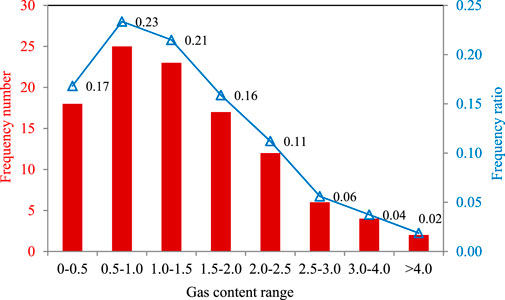
FIGURE 10. Frequency histogram of gas content for wells C01, D01 and Z01.
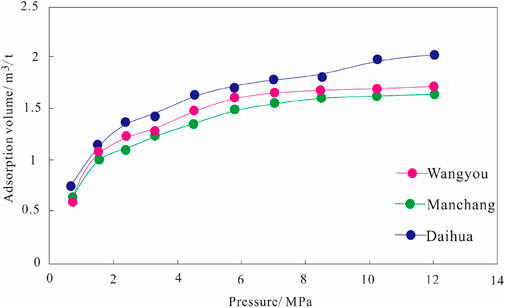
FIGURE 11. Isothermal adsorption curves for the outcrop samples.
After the Yanshanian movement, the strata in southern Guizhou province started to be uplifted and eroded, and Jurassic and Triassic were then failed to be deposited. As a result, the upper Paleozoic strata were exposed with fractures developed, which is much harmful for shale gas occurrence. The buried depth of the target stratum is a direct parameter to represent the geological evolution, and its influence on gas content for wells C01, D01, and Z01 are then analyzed as shown in Figure 12. Several findings can be achieved from the figure. First, there are three obvious correlations for gas content versus buried depth ranges of 500–700 m, 700–1,000 m, and 2,700–3,000 m. Second, three correlations are all linear, with fitting degrees of about 0.3. Third, as buried depth increasing, the slope of the correlation equation decreases from 0.015 to 0.003, which indicates that the gas content becomes more stable and the influence amplitude become weaker. Moreover, it is realized that the increasing gas content with buried depth is likely to be the result of the increasing reservoir pressure, which has a control on free and adsorbed gases.

FIGURE 12. Fitting diagram for gas content and buried depth.
Influences of TOC and Ro, max on gas content are both conducted as shown in Figure 13. As can be seen from the figure, TOC influences gas content in a linear mode with a fitting degree of about 0.4, and Ro, max influences gas content linearly and positively, with a fitting degree of 0.7. TOC represents the palaeosedimentary environment and Ro,max is an important index for coalification, both of which are related to gas source. Therefore, they two have strong relationships with gas content.

FIGURE 13. Relationships between gas content versus Ro,max (left) and TOC (right).
As the sapropelic is a measure of organic maceral containing exinite, vitrinite, and inertinite, the sapropelic percentage is adopted here to fit with gas content as shown in Figure 14. The figure indicates that the gas content has a negative and linear relationship with sapropelic percentage, with a fitting degree of about 0.5. The sapropelic percentage is a measure of kerogen type, and type I is caused by a high sapropelic percentage, which is beneficial for oil generation but harmful for gas generation. Therefore, the sapropelic percentage has a negative relationship with gas content.
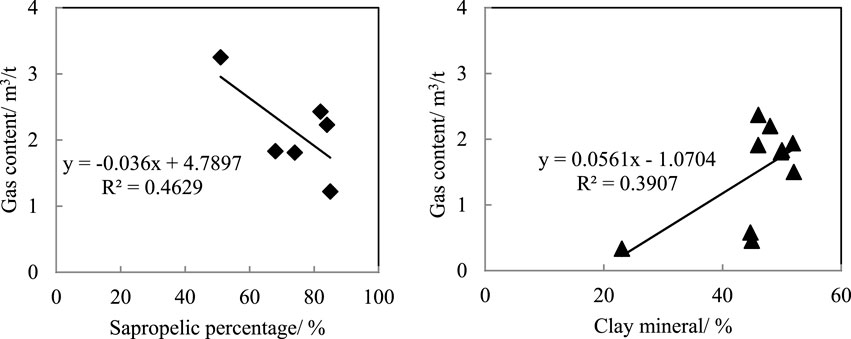
FIGURE 14. Relationships between gas content versus sapropelic percentage (left) and clay mineral (right).
Regarding to the mineral composition, the clay mineral is selected to fit with gas content as shown in Figure 14. The figure indicates that the gas content has a positive and linear relationship with clay mineral, with a fitting degree of about 0.4. There are many pores developed within clay minerals, which supports effective space for gas storage (Hill and Milburn, 1950; Aringhieri, 2004; Wang and Reed, 2009; Zou et al., 2020). Therefore, clay mineral has a positive relationship with gas content.
Four parameters of porosity, permeability, specific surface area and pore volume are chosen to conduct fitting analyses versus gas content as shown in Figure 15. The figure indicates that porosity and permeability are both positively correlated with gas content, while the fitting degrees are quite low. The pore volume has a positive trend with gas content, and the specific surface area has a positively and strongly linear relationship with gas content, with a fitting degree of about 0.4. Gas is stored in the pores or is absorbed on the pore surface (Schafer, 1972; Zou M et al., 2010; Zou et al., 2018). Therefore, a bigger specific surface area can result in a higher gas content as shown in the figure. The other three parameters are all measures for the pore system, and they all have positive relationships and low fitting degrees with gas content.
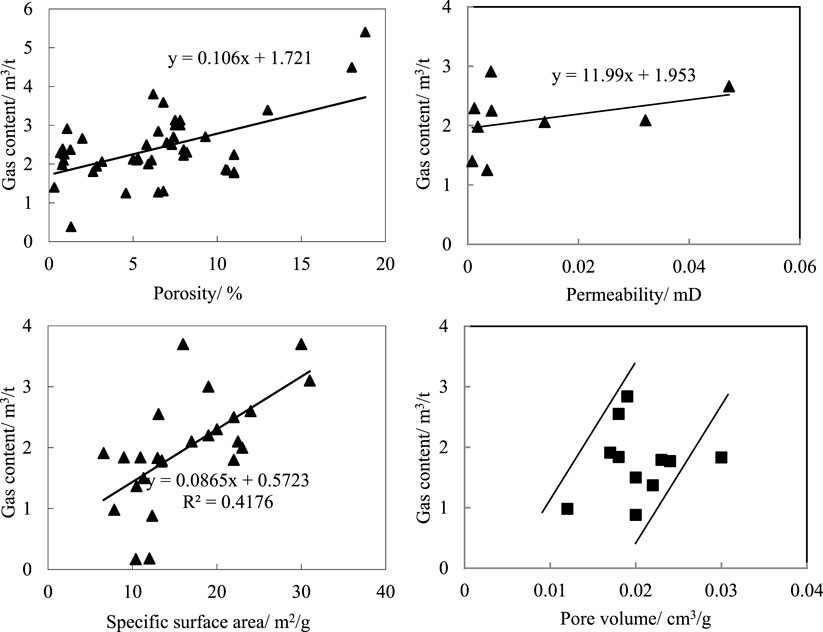
FIGURE 15. Relationships between gas content versus porosity (upper left), permeability (upper right), specific surface area (lower left) and pore volume (lower right).
In this paper, the Ziyun-Luodian area of southern Guizhou province in China is chosen as the research area, and the Dawuba formation in Carboniferous system is the target stratum. Core samples from wells of Z01, C01, and D01 and outcrop samples are all collected. Combined with laboratory experiments and mathematical analyses, geological evaluations on organic geochemistry, physical property of the reservoir, and gas bearing feature are all studied, and geological controls on gas occurrence are then analyzed. The following conclusions are achieved.
1) Sapropelic and hybrid types are the main organic types, while the humus type is less developed. TOC is generally in the range of 1%–3%, and the source rock in most of the research area is quite beneficial for the organic accumulation. Ro,max ranges from 1.7% to 4.4%, with an average value of about 2.4%.
2) Mineral compositions of the Dawuba formation are mainly clay and quartz, with a few calcite and dolomite. The percentage of clay varies from 17.6% to 58.4%, with an average of 46.3%, and the percentage of quartz ranges from 21.7% to 53.0% with an average value of 37.6%.
3) Specific surface area ranges from 6.6 to 29.8 m2/g, with an average value of 15.2 m2/g, and the pore volume varies from 0.012 to 0.046 cm3/g, with an average value of about 0.02 cm3/g. There is a strongly and positively linear relationship between specific surface area and pore volume. Porosity ranges from 0.32% to 4.57% with an average value of about 1.8%, and the values are mostly in the range of 1%–3%. Permeability varies from 0.001 to 0.029 mD with an average value of about 0.004 mD, and most of the permeability is below 0.01 mD. There is an exponential and positive relationship between porosity and permeability.
4) The gas content is generally below 2.0 m3/t, with extremely few values higher than 4 m3/t. There are three obvious correlations for gas content versus buried depth ranges of 500–700 m, 700–1,000 m, and 2,700–3,000 m. TOC influences gas content linearly, and Ro, max influences gas content positively. The sapropelic percentage and clay mineral are both fitted well with gas content. The gas content has a positive relationship with clay mineral and a negative relationship with sapropelic percentage. The porosity and permeability are both positively correlated with gas content. The pore volume has a positive trend with gas content, and the specific surface area has a positively and strongly linear relationship with gas content.
The original contributions presented in the study are included in the article/Supplementary Material, further inquiries can be directed to the corresponding author.
KW: laboratory experiments and data analysis; NC: paper writing; JD: mathematical analysis; and SG and YL: sample collection.
The authors wish to acknowledge financial support of this study provided by the Geological survey project from Oil and Gas Resource Survey Center of China Geological Survey under Grant No. DD 20160178-02-05.
The authors declare that the research was conducted in the absence of any commercial or financial relationships that could be construed as a potential conflict of interest.
All claims expressed in this article are solely those of the authors and do not necessarily represent those of their affiliated organizations, or those of the publisher, the editors and the reviewers. Any product that may be evaluated in this article, or claim that may be made by its manufacturer, is not guaranteed or endorsed by the publisher.
Aringhieri, R. (2004). Nanoporosity characteristics of some natural clay minerals and soils. Clays Clay Min. 52 (6), 700–704. doi:10.1346/ccmn.2004.0520604
Bowker, K. A. (2007). Barnett shale gas production, fort worth basin: issues and discussion. Am. Assoc. Pet. Geol. Bull. 91 (4), 523–533. doi:10.1306/06190606018
Chen, S., Zhu, Y., Wang, H., Liu, H., Wei, W., and Fang, J. (2011). Shale gas reservoir characterisation: a typical case in the southern Sichuan basin of China. Energy 36 (11), 6609–6616. doi:10.1016/j.energy.2011.09.001
Curtis, J. B. (2002). Fractured shale gas systems. AAPG Bull. 86 (11), 1921–1938. doi:10.1306/61EEDDBE-173E-11D7-8645000102C1865D
Dow, W. G. (1977). Kerogen studies and geological interpretations. J. Geochem. Explor. 7, 79–99. doi:10.1016/0375-6742(77)90078-4
Hill, H. J., and Milburn, J. D. (1950). Effect of clay and water salinity on electrochemical behavior of reservoir rocks. Trans. AIME 207, 65–72. doi:10.2118/532-g
Huang, J., Zou, C., Li, J., Dong, D., Wang, S., Wang, S., et al. (2012). Shale gas generation and potential of the lower cambrian qiongzhusi formation in the southern Sichuan basin, China. Petroleum Explor. Dev. 39 (1), 75–81. doi:10.1016/s1876-3804(12)60017-2
Jarvie, D. M., Hill, R. J., Ruble, T. E., and Pollastro, R. M. (2007). Unconventional shale-gas systems: the Mississippian Barnett shale of north-central Texas as one model for thermogenic shale-gas assessment. Am. Assoc. Pet. Geol. Bull. 91 (1), 475–499. doi:10.1306/12190606068
Li, X., Hu, S., and Cheng, K. (2007). Suggestions from the development of fractured shale gas in North America. Pet. explor. dev+. 34 (4), 392–400. doi:10.1242/dev.01970
Loucks, R. G., Reed, R. M., Ruppel, S. C., and Hammes, U. (2012). Spectrum of pore types and networks in mudrocks and a descriptive classification for matrix-related mudrock pores. Am. Assoc. Pet. Geol. Bull. 96 (6), 1071–1098. doi:10.1306/08171111061
Ma, Y., Cai, X., and Zhao, P. (2018). China's shale gas exploration and development: understanding and practice. Petroleum Explor. Dev. 45 (4), 589–603. doi:10.1016/s1876-3804(18)30065-x
Martineau, D. F. (2007). History of the Newark East field and the Barnett shale as a gas reservoir. Am. Assoc. Pet. Geol. Bull. 91 (4), 399–403. doi:10.1306/intro910407
Martini, A. M., Walter, L. M., Ku, T. C., Budai, J. M., McIntosh, J. C., and Schoell, M. (2003). Microbial production and modification of gases in sedimentary basins: a geochemical case study from a devonian shale gas play, Michigan basin. Am. Assoc. Pet. Geol. Bull. 87 (8), 1355–1375. doi:10.1306/031903200184
Meng, J., Pan, R., Chen, H., and Tang, X. (2016). Shale gas accumulation condition and resource potential analysis of Devonian in Dian-Qian-Gui Basin. Geoscience 30 (1), 181–191. (in Chinese with an English abstract). doi:10.3969/j.issn.1000-8527.2016.01.020
Qi, Y., Ju, Y., Cai, J., Gao, Y., Zhu, H., Hunag, C., et al. (2019). The effects of solvent extraction on nanoporosity of marine-continental coal and mudstone. Fuel 235, 72–84. doi:10.1016/j.fuel.2018.07.083
Qi, Y., Ju, Y., Yu, K., Meng, S., and Qiao, P. (2022). The effect of grain size, porosity and mineralogy on the compressive strength of tight sandstones: a case study from the eastern ordos basin, China. J. Pet. Sci. Eng. 208, 109461. doi:10.1016/j.petrol.2021.109461
Ross, D. J. K., and Bustin, R. M. (2009). The importance of shale composition and pore structure upon gas storage potential of shale gas reservoirs. Mar. Pet. Geol. 26 (6), 916–927. doi:10.1016/j.marpetgeo.2008.06.004
Schafer, H. N. S. (1972). Factors affecting the equilibrium moisture contents of low-rank coals. Fuel 51, 4–9. doi:10.1016/0016-2361(72)90029-4
Schmoker, J. W. (1980). Organic content of Devonian shale in Western Appalachian basin. AAPG Bull. 64, 2156–2165.
Tissot, B. P., and Welte, D. H. (1978). Petroleum formation and distribution- a new oil and gas exploration way. Berlin: Organic Geochemistry Press.
Wang, F. P., and Reed, R. M. (2009). “Pore networks and fluid flow in gas shales,” in Paper SPE 124253, presented at SPE Annual Technical Conference and Exhibition, New Orleans, Louisiana, America, October 4–7, 2009.
Wang, P., Chen, Z., He, X., Dong, L., Xu, Z., Ma, L., et al. (2012). Shale gas accumulation conditions and play evaluation of the Devonian in Guizhong Depression. Oil Gas. Geol. 33 (3), 353–363. (in Chinese with an English abstract). doi:10.11743/ogg20120304
Yang, F., Ning, Z., and Liu, H. (2014). Fractal characteristics of shales from a shale gas reservoir in the Sichuan Basin, China. Fuel 115, 378–384. doi:10.1016/j.fuel.2013.07.040
Zou, C., Dong, D., Wang, S., Li, J., Li, X., Wang, Y., et al. (2010). Geological characteristics and resource potential of shale gas in China. Petroleum Explor. Dev. 37 (6), 641–653. doi:10.1016/s1876-3804(11)60001-3
Zou, M., Wei, C., Huang, Z., and Wei, S. (2015a). Porosity type analysis and permeability model for micro-trans-pores, meso-macro-pores and cleats of coal samples. J. Nat. Gas. Sci. Eng. 27, 776–784. doi:10.1016/j.jngse.2015.09.025
Zou, M., Wei, C., Yu, H., and Song, L. (2015b). Modeling and application of coalbed methane recovery performance based on a triple porosity/dual permeability model. J. Nat. Gas. Sci. Eng. 22, 679–688. doi:10.1016/j.jngse.2015.01.019
Zou, M., Wei, S., Huang, Z., Lv, X., and Guo, B. (2018). Simulations on recoverability performances for a coalbed methane field in SE edge of Ordos basin, China. Fuel 233, 354–360. doi:10.1016/j.fuel.2018.06.071
Zou, M., Liu, Y., Huang, Z., Zhang, M., and Zhang, P. (2020). Geological control of irreducible water within the coal matrix and its quantified evaluation model. ACS Omega 5, 9540–9549. doi:10.1021/acsomega.0c00782
Keywords: geological evaluation, gas bearing analysis, shale gas, fitting analysis, southern Guizhou province
Citation: Wang K, Cai N, Du J, Gong S and Li Y (2022) Geological evaluation and gas bearing analysis for shale reservoir in Ziyun-Luodian typical area of southern Guizhou province, China. Front. Earth Sci. 10:1020313. doi: 10.3389/feart.2022.1020313
Received: 16 August 2022; Accepted: 22 August 2022;
Published: 09 September 2022.
Edited by:
Mingjun Zou, North China University of Water Resources and Electric Power, ChinaCopyright © 2022 Wang, Cai, Du, Gong and Li. This is an open-access article distributed under the terms of the Creative Commons Attribution License (CC BY). The use, distribution or reproduction in other forums is permitted, provided the original author(s) and the copyright owner(s) are credited and that the original publication in this journal is cited, in accordance with accepted academic practice. No use, distribution or reproduction is permitted which does not comply with these terms.
*Correspondence: Keying Wang, NzQ0NDkxNTIyQHFxLmNvbQ==
Disclaimer: All claims expressed in this article are solely those of the authors and do not necessarily represent those of their affiliated organizations, or those of the publisher, the editors and the reviewers. Any product that may be evaluated in this article or claim that may be made by its manufacturer is not guaranteed or endorsed by the publisher.
Research integrity at Frontiers
Learn more about the work of our research integrity team to safeguard the quality of each article we publish.