- 1 Department of Earth and Environment Sciences, The University of Texas at Arlington, Arlington, TX, United States
- 2 Shandong Provincial Key Laboratory of Deep Oil and Gas, China University of Petroleum (East China), Qingdao, China
- 3 X-ray Science Division, Advanced Photon Source, Argonne National Laboratory, Lemont, IL, United States
- 4 School of Geoscience and Technology, Southwest Petroleum University, Chengdu, China
Pore structure study is an important part of unconventional shale reservoir characterization, since the pore system provides the primary petroleum storage space and fluid flow pathways. Previous studies have suggested that the pore structure is related to the total organic carbon (TOC) content, mineral compositions, and the maturity of the organic matter (OM). However, few studies have focused on the mineral grains, the primary grains being deposited but before cementation, which are the building blocks of shale. Eight Woodford Shale outcrop samples from southern Oklahoma were chosen to study the effects of mineral grain size on the pore structure characterization, using multiple and complementary experimental approaches, including laser diffraction, mineralogy, TOC, pyrolysis, liquid immersion porosimetry, mercury intrusion porosimetry, gas physisorption, (ultra) small angle X-ray scattering, scanning electron microscopy, and spontaneous imbibition. The results from different experiments of eight samples show that the Woodford Shale has the mean mineral grain diameters at 3–6 μm, a wide range of porosity at 3–40% and pore diameters at 50–1,000 nm, and various pore connectivity. Grain size variation was probably caused by the sea-level fluctuation during its deposition, which affect the porosity, pore size distribution, and pore connectivity. With decreasing mineral grain sizes, the porosity tends to increase while the pore connectivity worsens. The results also indicate that OM and carbonates in this low-maturity Woodford Shale could block the pores and decrease the porosity. Coupling with the grain size analyses, the control of depositional environment on grain sizes and subsequent effects on pore structure is identified. The pore structure characteristics over a wide pore-diameter range provided by multiple experiments could improve the understanding of storage space and fluid flow in the Woodford Shale to further increase its petroleum production.
Introduction
Shales have fine-grained matrices, low porosities and very low permeabilities, and very slow fluid flow rates; as a consequence, hydraulic fracturing is needed for the petroleum production in shale reservoirs. To understand the fluid-matrix interactions, pore structure characterization of shale has been carried out in recent decades (Ross and Bustin, 2009; Curtis et al., 2010; Clarkson et al., 2013; Cao et al., 2016; Sun et al., 2017; Kibria et al., 2018). Pore size distribution, pore types, and pore connectivity are key aspects of shale pore structure studies (Parker et al., 2009; Wang et al., 2016; Gao et al., 2018; Sun et al., 2019; Wang et al., 2021a; Wang et al., 2022). The factors that control pore structure properties of both marine and lacustrine shales include TOC content, mineral compositions, and thermal maturity. Increasing TOC content and thermal maturity both increase the formation of secondary pores in OM, which can lead to an increase in the porosity and specific pore surface area (Curtis et al., 2012; Cao et al., 2015). The contents of silica minerals also increase the porosity in both marine and lacustrine shale (Fu et al., 2015; Dong and Harris, 2020; Iqbal et al., 2021).
Mineral grain sizes can also be a factor controlling the pore structure. In this study, we define the mineral grains as the primarily deposited grains, which can be measured after the dissolution of cements and OM. Several studies have shown that quartz grain sizes in sandstones are positively correlated with porosity, pore throat size, and pore connectivity (Cao et al., 2016; Li et al., 2018; Qiao et al., 2020). However, few studies have focused on the effects of mineral grain sizes on pore structure in shale. The full section Woodford Shale outcrop at southern Oklahoma is a good option to study this topic. The samples collected from the bottom to the top of the section deposited at the same basin with a continuous environment change, under which the changes of mineral grain size could have a rule to follow (Catuneanu, 2006). Moreover, Woodford Shale in Oklahoma is an important unconventional source rock, and its pore structure study could provide more geologic supports to improve the petroleum production. In this work on eight Woodford Shale outcrop samples collected from Oklahoma in USA, the effects of mineral grain size on pore structure have been studied using various experiments of X-ray diffraction on mineralogy (XRD), TOC, pyrolysis, liquid immersion porosimetry (LIP), mercury intrusion porosimetry (MIP), gas physisorption (GP), (ultra) small angle X-ray scattering [(U)SAXS)], scanning electron microscopy (SEM), spontaneous imbibition (SI), and grain size distribution (GSD) by laser diffraction. The results from different experiments of these eight samples are discussed to illustrate the effects of grain size on pore structure, including porosity, pore size distribution, pore connectivity, and tortuosity.
Geological background
The Late Devonian to Early Mississippian marine Woodford Shale is widely distributed in the Midwest USA, including western Texas, southeastern New Mexico, and southern Oklahoma (Comer, 1991; Romero and Philp, 2012). The Woodford Shale in Oklahoma contains OM of mostly algal/bacterial origin, which is oil- and associated gas-prone, and contains reserves of more than 644 billion cubic feet of gas and 460 million barrels of oil (Cardott, 2012; Cardott, 2017). Like most shale reservoirs, the extremely low permeability and other complex petrophysical properties lead to a rapid decline in petroleum production in the Woodford Shale and make economic development difficult to sustain. However, the studies on the Woodford Shale have not attracted much attention of petrophysicists since the production is not prominent, and only a few research studies focus on the basic aspects of pore structure characteristics (Slatt and O’Brien, 2011; Kibria et al., 2018; Ojha et al., 2018; Cullen, 2020).
The Woodford Shale in Oklahoma is mainly present in the Anadarko, Arkoma, Ardmore, and Marietta Basins (Cardott, 2017). The samples in this study were collected from the outcrop in the McAlister Cemetery quarry, in the western Ardmore Basin, to the south of Ardmore city near the exit off Interstate 35 (Bernal et al., 2012; Ekwunife, 2017). The Ardmore Basin is the consequence of compression by a series of tectonic events in Pennsylvanian to Permian (Granath, 1989). Eight samples collected in this work were from the 100 m-thick vertical section. The Hunton Group and Sycamore Limestone contact with the Woodford Shale unconformably on the top and bottom, respectively (Figure 1; Comer, 2008; Ekwunife, 2017). The Woodford Shale is unofficially subdivided into three units: Lower, Middle, and Upper Woodford; the Lower and Middle units were deposited in a transgressive environment, and the Upper Woodford Shale was formed under a regressive environment (Bernal et al., 2012).
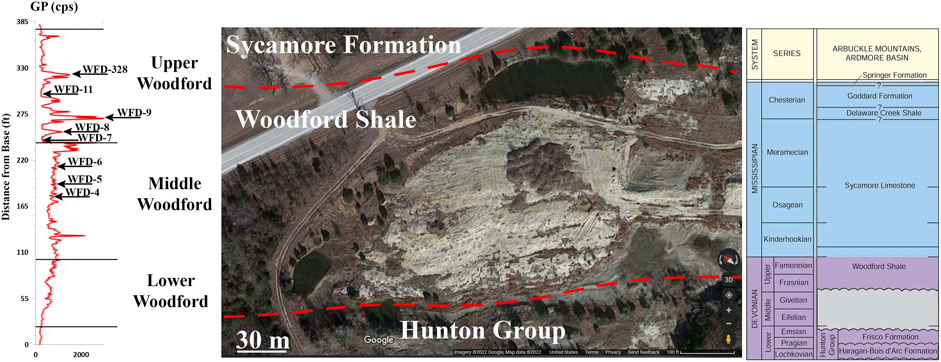
FIGURE 1. Outcrop sample locations and lithostratigraphy (modified after Ekwunife, 2017).
Samples and methods
Woodford samples
From these eight samples, WFD-4, WFD-5, and WFD-6 were collected from Middle Woodford, while samples WFD-7, WFD-8, WFD-9, WFD-11, and WFD-328 came from the Upper Woodford (Figure 1). Since the shale from Lower Woodford is too fragile to collect as chunky samples, only Middle and Upper Woodford were covered in this work. These samples were processed into various shapes and sizes for different laboratory experiments detailed below.
Mineralogy, organic geochemistry, and SEM imaging
Samples were pulverized into powder with particle sizes <75 μm and oven-dried at 60°C for 48 h before the mineralogy and organic geochemistry analyses. The mineral analyses by XRD were performed using a Shimadzu MAXima X XRD-7000 X-ray Diffractometer with the 2θ from 2° to 70°. The mineralogical compositions were semi-quantitatively calculated in weight percentage with an approximate uncertainty of ±10% (Moore and Reynolds, 1997). TOC content and pyrolysis were conducted by GeoMark Research Ltd with a LECO TOC and HAWK pyrolysis instruments, respectively. The TOC content, Tmax and other geochemical parameters (e.g., S1 and S2) were obtained from these two measurements.
Pore types were studied using images generated by SEM. Images are created using a variety of radiation signals, including X-rays, backscattered electrons, secondary electrons, and Auger electrons emitted from the sample surface. Backscattered electrons (BSE) and secondary electrons (SE) are two commonly used signals in SEM image generation. The BSE images reflect the atomic number differences in the sample and show the compositional difference at different grayscales. The SE signals produce a visual information of the surface topography of the sample. Both Hitachi S-4800 and Hitachi N-3000 instruments were applied in this study for different observational scales of samples and containing pores. Before scanning, all the samples were oven-dried at 60°C for 48 h and coated with metal Pt for 1–2 min with Hummer VI Sputtering System.
Liquid immersion porosimetry
LIP was carried out after vacuum pulling to evacuate the air from the connected pore space, followed by a liquid immersion to ensure full liquid saturation of the pore systems connected to the sample surface. Samples as 1-cm3 cubes with a side length of 1 cm were vacuumed under a pressure of 0.1 Torr for over 12 h, after that samples were flushed with CO2 for 30 min. The aim of CO2 injection was to use this gas to replace the residual air, in order to improve the water saturation of the pores since CO2 dissolves more readily in water than air during the subsequent water immersion. Samples were evacuated again under a similar vacuum pressure for 12 h before the release of deionized water (DIW) into the sample/vacuum chamber to occupy the evacuated pore space. The water-saturated sample was then submerged under boiled and cooled DIW to obtain the bulk volume and pore volume, using the Archimedes’ principle (Hu et al., 2012, 2015; Kuila et al., 2014). Porosity, bulk density, and grain density were calculated from the sample weight, bulk volume, and pore volume.
Spontaneous imbibition
SI can be applied to characterize the combined influence of capillarity and relative permeability on the extent and rate of fluid flow in porous media. The capillary force-driven SI is a process in which the wetting fluid (e.g., water) expels a non-wetting fluid (e.g., air or oil) in a water-wet material. Imbibition can be regarded as diffusion mathematically (Philip, 1957). Hu et al. (2012) proved that the fitting slope of imbibed mass and imbibed time in log-log space could describe the pore connectivity of the shale rocks. The experimental procedure of imbibition tests follows Hu et al. (2001). One 1-cm3 cubic sample was hung under a bottom-weighing electronic balance with the bottom end in contact with the imbibing liquid which is DIW. Except for the bottom and top faces, the other four faces of the cube were covered by epoxy to minimize the adsorption of DIW vapor. The imbibition direction was transverse (T direction) to the bedding layers, without the restriction of either top or bottom faces of the sample. For samples without stratifications, the imbibition direction was not specified. Every sample was tested for 24 h. The porosity measured from LIP method was used in SI for imbibed liquid volume calculation, because both methods use DIW as the testing fluid.
Mercury intrusion porosimetry
MIP method uses non-wetting liquid mercury to invade pores under an applied pressure, and the data can be used to measure the pore-throat diameter distribution. 1-cm3 cubes with side length of 1 cm were used and oven-dried for 48 h before the MIP tests by following the procedure of Gao and Hu (2013) and Hu et al. (2017). The Washburn equation describes the relationship between the applied pressure and pore throat size being intruded (Eq. 1)
where
In addition to porosity and pore throat diameter distribution, tortuosity and permeability of the pore system can be obtained by the MIP method. Tortuosity is the ratio of the actual distance the fluid travels and the shortest distance between the start and end points of the fluid flow. Eq. 2 shows the calculation of tortuosity (
where
where
Gas physisorption
Hand-crushed granular samples with diameter between 500–840 μm were used in GP tests, as nitrogen gas was used with a Micromeritics ASPS 2460 system. The Langmuir equation expresses the relationship between the volume of nitrogen gas adsorbed and the relative pressure, from which pore surface area, pore diameter distribution, and pore shape can be calculated (Bardestani et al., 2019). At the beginning of the adsorption process, the gas molecules start to form a monolayer on the pore walls at low relative pressures. The specific surface area can be calculated based on a monolayer coverage of nitrogen molecules using the Brunauer-Emmett-Teller (BET) equation (Thommes, 2010; Lowell et al., 2012). An isotherm plot can be obtained by plotting adsorption volume against relative pressure at a constant experimental temperature. During the desorption process, the nitrogen in pores is released with decreasing pressure. The Barrett-Joyner-Halenda (BJH) method was used to calculate the pore diameter distribution (Barrett et al., 1951). The experimental temperature was 77.3K, while the absolute pressure range was 0.210–102 KPa and the relative pressure range was 0.002–0.998.
(Ultra) small angle X-ray scattering
To understand the effect of OM on pore structure characteristics, both solvent-extracted and non-extracted samples were measured by (U)SAXS methods. Two wafers were made from every sample with a thickness of ∼0.8 mm: one wafer was soaked in a mixture of dichloromethane and methanol at a volume ratio of 9:1 under 70°C for 48 h (Zhang et al., 2019), and another wafer was made without soaking in solvent.
In (U)SAXS analyses, the X-ray passes through the sample and scatters differently, and the contrast of the scattering intensity measured by the detector is used to characterize the spatial pore data of porous materials (Li et al., 2016; Sun et al., 2020). The (U)SAXS experiments were performed at beamline 9-ID of the Advanced Photon Source at Argonne National Laboratory in Illinois. The detectable pore diameter range is ∼1 Å-6 μm, and the range of scattering vector Q is 8×10⁻⁵< Q < 6 A−1. Each sampling spot was scanned by ultra-SAXS for 90 s and by (U)SAXS for 10 s with an X-ray energy of 21 keV, yielding the combined (U)SAXS data (Wang et al., 2021b). Calibration and background subtraction were needed during (U)SAXS experiments for consequent data reduction. The data were processed by Igo Pro software following Ilavsky and Jemian (2009) and Ilavsky et al. (2018). Porosity, pore diameter distribution, and pore surface area were thus calculated, and pore volume obtained using the bulk density results obtained from MIP tests.
Particle size analyses by laser diffraction
The particle size is related to the diffraction angle when the X-ray passing through the particle, and the particle size distribution is related to the diffracted light intensity. During the measurement, samples are carried by being suspended in DIW, and flowing through a monochromatically parallel X-ray beam in the sample cell. The scatter patterns and light intensity are measured by the detector after the scattered light passes through a focal lens and is captured by the detector (;McCave et al., 1986; Ma et al., 2000; Wen et al., 2002).
With a detectable range from 10 nm to 300 μm, a Shimadzu SALD-7101 laser diffraction particle size analyzer was applied in this study to measure the grain size distribution. Eight hand crushed and sieved samples with a particle diameter of 500–841 μm were dissolved in sequence in 10% HCl and 30% H2O2 to dissolve the carbonate cement and pyrite, which can disaggregate the mineral grains. The residual grains were carried by 0.5 g/L NaH2PO4 solution, which was applied for better dispersion of the grains for grain size measurement (Penner and Lagaly, 2001; Sato et al., 2019). In this study, to simplify the analysis and discussion, we define a particle as the aggregation of primarily-deposited crystal grains being cemented (i.e., by carbonates), and a grain as the primary crystals. In other word, the sizes of the grains that remain in the HCl and H2O2 solutions are regarded as the primarily deposited crystal grains.
Results
Basic rock properties from XRD, rock pyrolysis, and LIP
Table 1 shows the mineralogical compositions from XRD analyses. Quartz, dolomite, and clays are the major minerals in these eight samples of the Woodford Shale. The quartz content varies from 13.7 wt.% to 92.2 wt.%, the dolomite content ranges from 2.30 wt.% to 84.9 wt.%, and clays content varies from 0-73.5 wt.%. Sample WFD-328 has the highest quartz content, WFD-8 has the highest dolomite content, and WFD-11 has the highest clays content.

TABLE 1. Mineralogical, petrophysical, and geochemical properties from XRD, and rock pyrolysis results (HC: hydrocarbons; wt.%: weight percentage).
The TOC content varies from 0.06 to 15.7%. Tmax values range from 408 to 425°C, indicating that all samples are thermally immature with respect to oil generation. The low value of 374°C for sample WFD-7 is unreliable due to its low TOC and S2 values.
SEM observations
From the SEM images, both interparticle, intraparticle, and OM pores were identified in the samples. Interparticle pores formed between mineral grains, such as rigid quartz grains, are the primary contributors to the pore volume (Figures 2A,B). Intraparticle pores are defined as pores inside the grain boundary (Loucks et al., 2012). Intraparticle pores are common in clay minerals, such as kaolinite and illite (Figure 2C). The pores in OM are also a type of intraparticle pore (Figure 2D); however, in this study, they are called OM pores. WFD-6 has well-connected OM pores with diameters of 30–50 nm (Figures 2E,F). The particles of OM were obviously detected by the SEM in samples with TOC contents >4%, such as WFD-4, WFD-5, WFD-8, and WFD-9; nevertheless, not all OM has pores inside. Some non-porous OM filled in partial interparticle pores could block the interparticle pores and decrease the pore volume. Both samples WFD-4 and WFD-8 are dominated by carbonates. In Figure 2G, non-porous carbonates are likely serving as the cements. The sizes of mineral grains, including quartz, clay minerals, and feldspar, can also be estimated from the SEM images with a mean size of 3–4 μm.
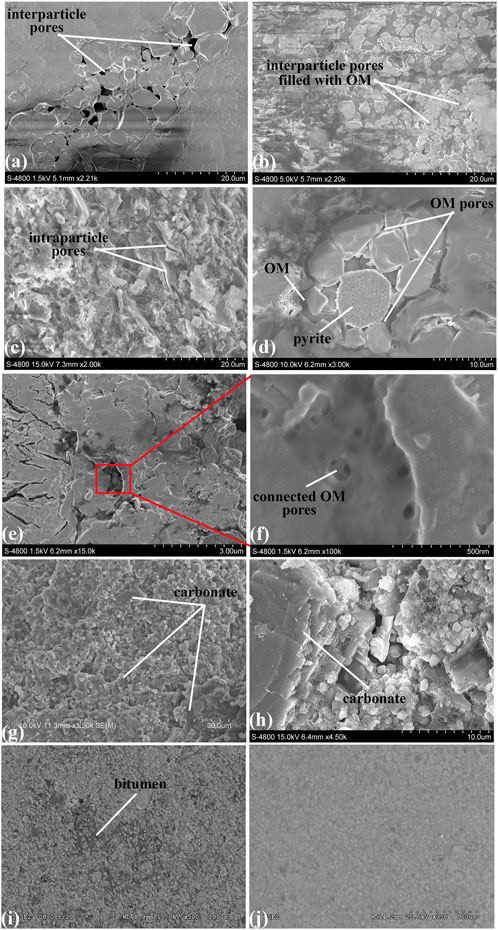
FIGURE 2. Pore types identified in SEM images; (A,B) interparticle pores in WFD-4 and WFD-9; (C) intraparticle pores in WFD-5; (D) OM pores and pyrite in WFD-4; (E,F) connected OM pores in WFD-6; (G) carbonate in WFD-8; (H) carbonate in WFD-4; (I) BSE image of WFD-6 before solvent extraction; (J) BSE image of WFD-6 after solvent extraction.
Pore structure from MIP, GP, and LIP methods
Porosity, pore-throat size distribution, and tortuosity can be obtained from MIP (Table 2). The average porosity of MIP is 22.9%, within the range of 3.72–50.3%. Figure 3 shows the pore-throat diameter distribution from the MIP analyses. Most samples have pore-throat diameters smaller than 1 μm. WFD-4 and WFD-8 have lower peaks with the smallest porosities compared with other samples (Figure 3). Samples WFD-5, WFD-6, and WFD-9 are dominated by pores with a diameter of 0.02 μm, while WFD-7, WFD-11, and WFD-328 primarily have pore diameters of 0.1–1 and ∼1,000 μm. The total pore volume varies from 0.02 cm3/g to 0.58 cm3/g. The total pore surface areas range from 2.69 m2/g to 26.2 m2/g, and tortuosity calculated from the MIP method changes from 3.00 to 3,341.
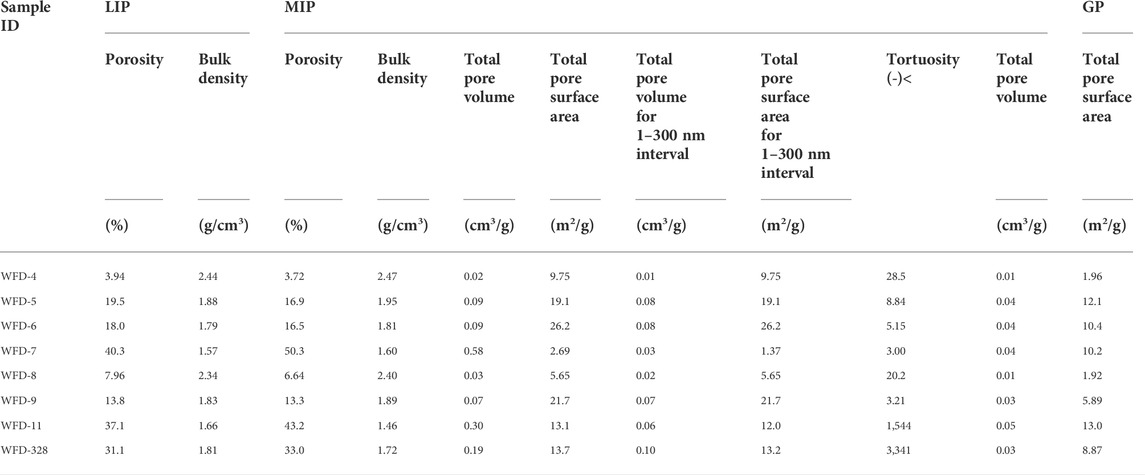
TABLE 2. Porosity, pore volume, surface area, and tortuosity obtained from three methods, (-) means dimensionless.
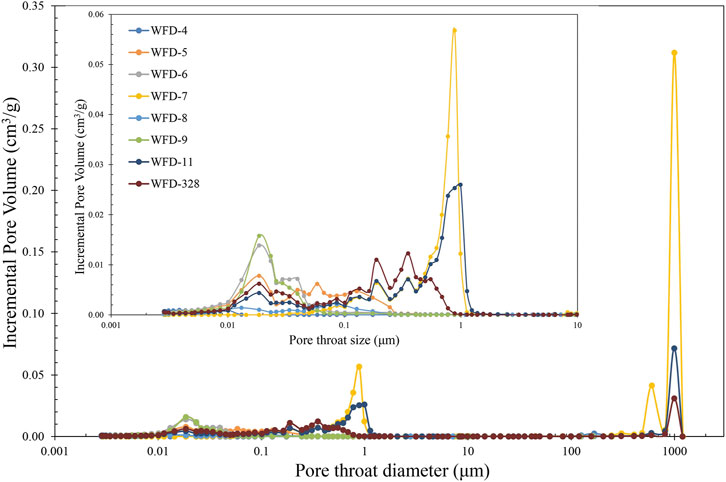
FIGURE 3. Pore-throat size distribution from MIP analyses with complete (0.3 nm-1000 µm) and zoomed (0.3 nm-2 µm) regions.
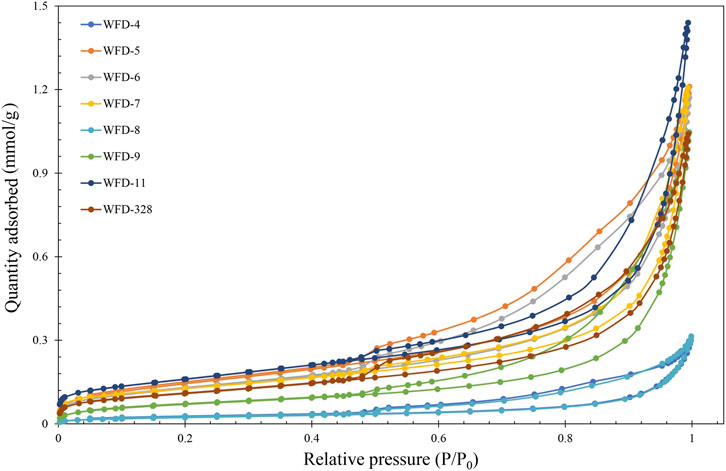
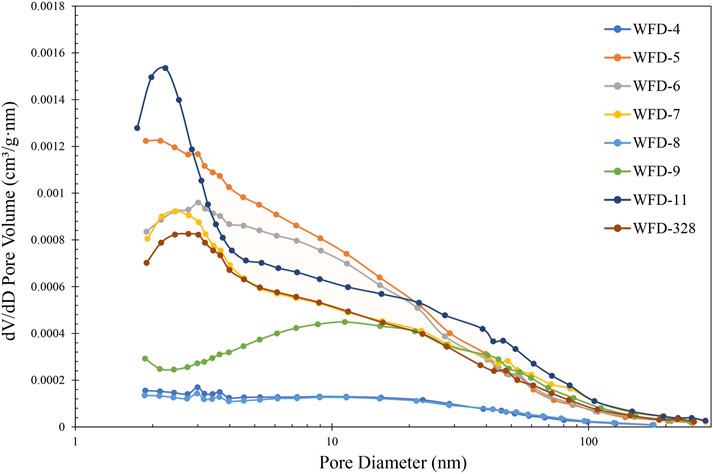
From the GP analyses, hysteresis loops apparently exist between the adsorption and desorption isotherms due to both pore blocking and cavitation (Figure 4) (Thommes et al., 2015; Schlumberger and Thommes, 2021). The adsorption isotherms suddenly increase after P/P0 = 0.8. No horizontal plateau exists when P/P0 approaches to 1 in these samples, which indicates that the diameters of many pores are over the upper detectable range of GP method (Ravikovitch and Neimark, 2002), which is 300 nm in this work. The desorption isotherms show a step-down behavior and overlap with the adsorption isotherms at P/P0 = 0.4–0.5. Based on the classification of IUPAC (Thommes et al., 2015), the hysteresis loops for these eight Woodford Shales are identified as Type H3, which indicates a primary presence of slit-shaped pores. Figure 5 shows the dominant pore diameter is 2–3 nm. The total pore volume within the GP-measurable range of 1–300 nm varies from 0.01 cm3/g to 0.05 cm3/g, and over 50% of the total pore volume is provided by pores with a diameter smaller than 50 nm. In addition, the specific pore surface area varies from 1.96 m2/g to 13.0 m2/g. Porosities range from 3.94 to 40.3% from the LIP analyses, and the bulk density varies from 1.66 g/cm3 to 2.44 g/cm3. LIP and MIP show similar porosities and bulk densities. Total pore volume and total pore surface area from MIP and GP were compared under the same pore range from 1–300 nm (Table 2). For its wide measurable pore size range, MIP results have higher values of total pore volume and pore surface area than these from GP.
Pore structure from (U)SAXS analyses
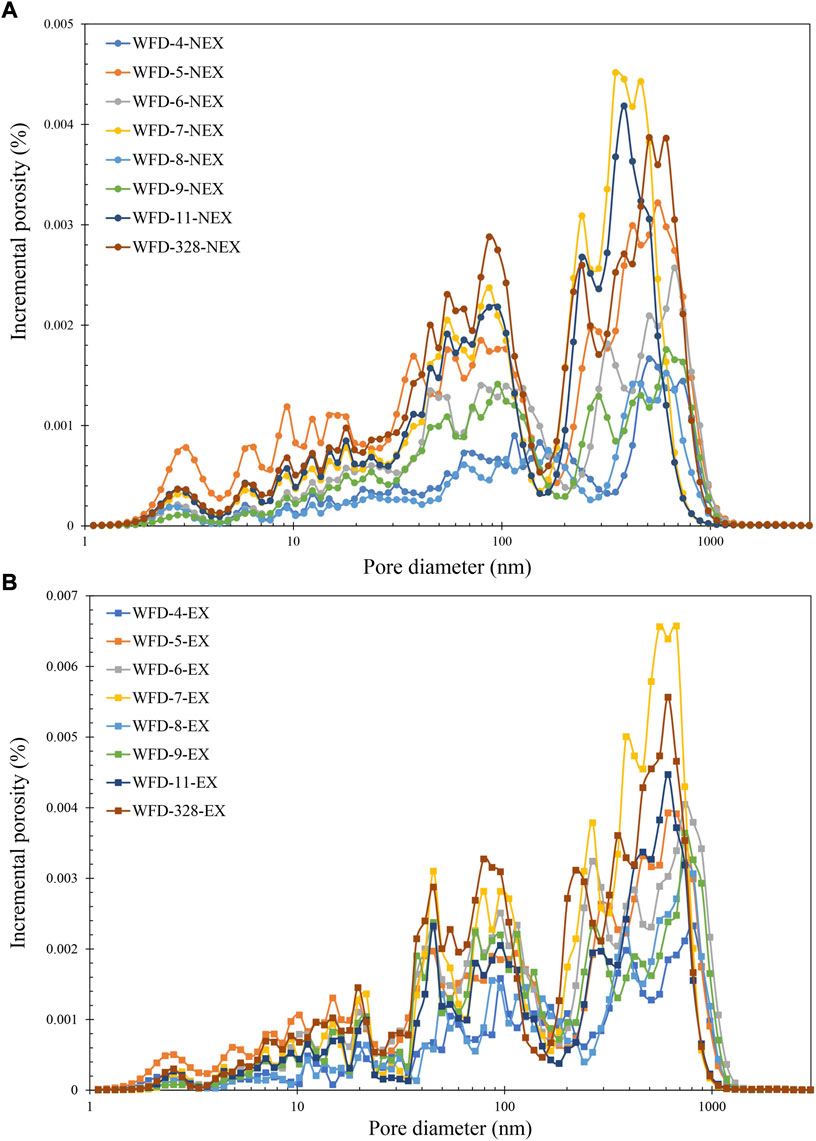
The pore structure analyses by (U)SAXS method were applied to both non-extracted and solvent-extracted samples. For non-extracted samples, the range of porosities is from 2.84 to 8.93% (Table 3). The pore diameter distributions are characterized by multiple peaks in Figure 6. All samples have similar pore diameter distribution patterns with a dominance at 50–100 nm and 250–700 nm, in additional to a minor presence of pores at 2–10 nm in diameters.
For solvent-extracted samples, the porosity varies from 4.93 to 11.1%. The pore diameter distribution patterns of solvent-extracted samples are similar to the non-extracted samples but with greater incremental porosities. The pore diameter distribution curves of solvent-extracted samples WFD-5, WFD-7, WFD-11, and WFD-328 show little differences compared to the results of non-extracted samples (Figures 6A,B). The curves of solvent-extracted samples WFD-4, WFD-6, WFD-8, and WFD-9 show a significant increase in incremental porosities at diameters of 40–150 nm and 300–1,000 nm. The porosity differences [(solvent-extracted–non-extracted)/non-extracted) ×100%] among these samples vary from 7.72 to 94.1% with an average of 46.5% (Table 3), which indicates the dramatic porosity increase after the solvent extraction.
Pore connectivity from SI method
As mentioned in Spontaneous imbibition Section, SI can estimate the pore connectivity associated with LIP result. The DIW volume imbibed by the eight samples varies from 0.03 to 0.45 cm3. Since the sample dimension of LIP and SI are the same which is a cube with a length of ∼1 cm, the pore volume and porosity measured by LIP can be used to calculate the imbibed DIW volume in SI. The imbibed DIW volumes from SI are only 0.34–0.86% of the total pore volumes (Table 4). In the log-log plot of imbibition time against cumulative imbibition volume, these eight samples can be separated into two groups based on the imbibition behaviors (Figure 7). Group 1 contains samples WFD-4, WFD-5, WFD-6, WFD-8, and WFD-9, which have no or a very short plateau during the experimental duration of the SI tests. The fitted imbibition slopes vary from 0.10 to 0.38 (Table 4). In addition, samples WFD-5 and WFD-6 show an increase in the fitted slope after 2 and 4 h of imbibition, respectively.
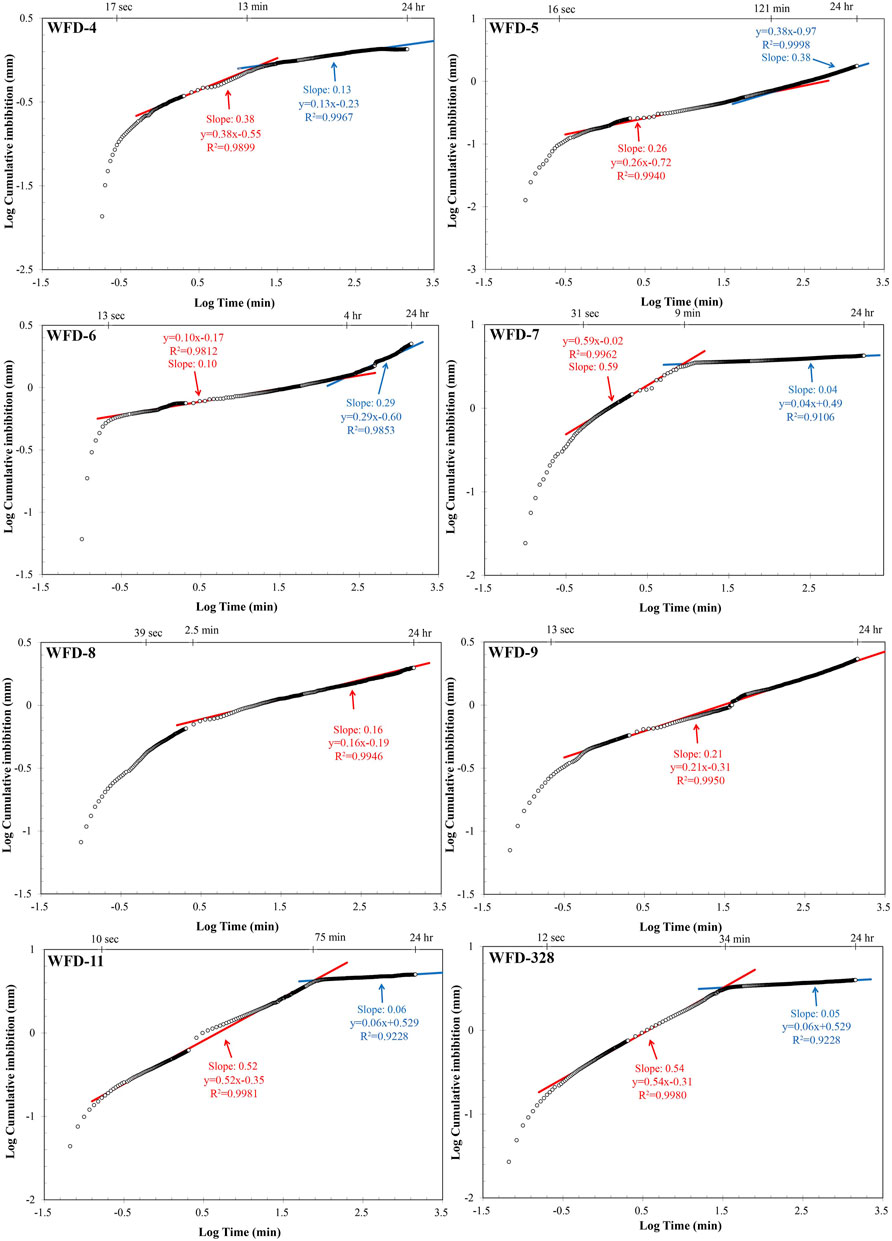
FIGURE 7. Plots of imbibition time vs. cumulative imbibition volume of SI results with fitted imbibition slopes.
Group 2 contains samples WFD-7, WFD-11, and WFD-328 which have fast and large cumulative imbibition with a long plateau after 40 min of imbibition test time. The fitted slopes vary from 0.52 to 0.59 (Table 4).
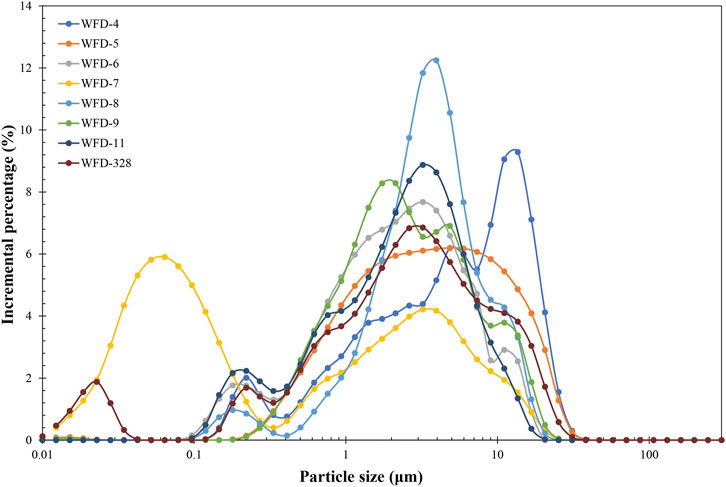
Particle size distribution analyses
Table 5 shows the mean grain size and sorting of eight Woodford Shale samples, which were calculated by Eq. 4 reported by Folk (1980) for sedimentary rocks:
where

TABLE 5. Mean grain size from laser diffraction analyses (TST: transgressive system tract; HST: highstand system tract).
Discussion
In this Section, the comparison of experimental methods, pore structure characterization, and effect of grain sizes on pore structure will be discussed. As no single experiment can measure the complete spectrum of the pore structure, through measuring shale by multiple experiments, the pore structure can be characterized credibly and comprehensively, and the pros and cons of each experiment can be compared. With a well-justified pore structure characterization, the discussion on the effect of grain sizes on pore structure can be more reasonable.
Comparison of GP, MIP, LIP and (U)SAXS methods
In Results Results Section, the similar porosities and bulk densities between MIP and LIP indicate the accuracy of the LIP and increase the credibility of SI results, since the porosities from LIP were used to calculate the imbibed DIW volume percentage in SI. Both GP and MIP are fluid-intrusion methods which use fluids to probe pore structures. GP uses nitrogen gas based on the Kelvin equation and MIP uses high-pressure liquid mercury based on the Washburn equation. For GP method, only pore volume and specific surface area of the samples can be obtained. Moreover, the measurable pore range of GP is 2–300 nm which is too narrow to fully characterize the pore structure of shale with a nm-µm spectrum. For MIP method, more petrophysical properties can be probed compared with GP, including pore volume, specific surface area, densities, and the wide measurable pore-throat range from 3 nm to ∼1,000 μm. This makes the MIP the most popular method in pore structure characterization. However, the samples cannot be reused after MIP, since mercury will pollute them; in addition, there are some concerns that high pressure intrusion may deform the pore structure of porous media Unlike the fluid-intrusion methods, (U)SAXS measures both isolated and connected pores in 1–1,000 nm on ∼800 μm intact wafers which can be tested repeatably.
The pore volumes measured by GP, MIP, and (U)SAXS methods were compared in the pore range of 2–300 nm which is the overlapping range of the three methods (Figure 9). The results show that GP has similar pore volume with (U)SAXS in 2–300 nm, which indicate the creditability of both methods. MIP shows no data in <2.8 nm and slightly higher pore volume than GP and (U)SAXS in the pore interval of 2.8–300 nm, which could be mainly caused by the ink-bottle effect in the MIP method, as the MIP method measures the pore-throat distribution with the pore volume associated with larger-sized pore body being ascribed to smaller pore throats. The systematic bias in (U)SAXS and sample heterogeneity will also need to be considered in the result comparison among different methods. The data interpretation model for pore volume calculation in (U)SAXS was applicable for samples with porosities smaller than 10%, while the Woodford Shale outcrop samples have large porosities with an average of 21.5% to potentially introduce systematic bias to the pore volume results. The sample dimension in MIP is 1-cm3 cube and in (U)SAXS is 0.8 mm-thick wafer with X-ray scanning area of 0.64 mm2. The measurable volume in (U)SAXS is much smaller than in MIP, which may enlarge the effect of sample heterogeneity and show smaller pore volume in (U)SAXS.
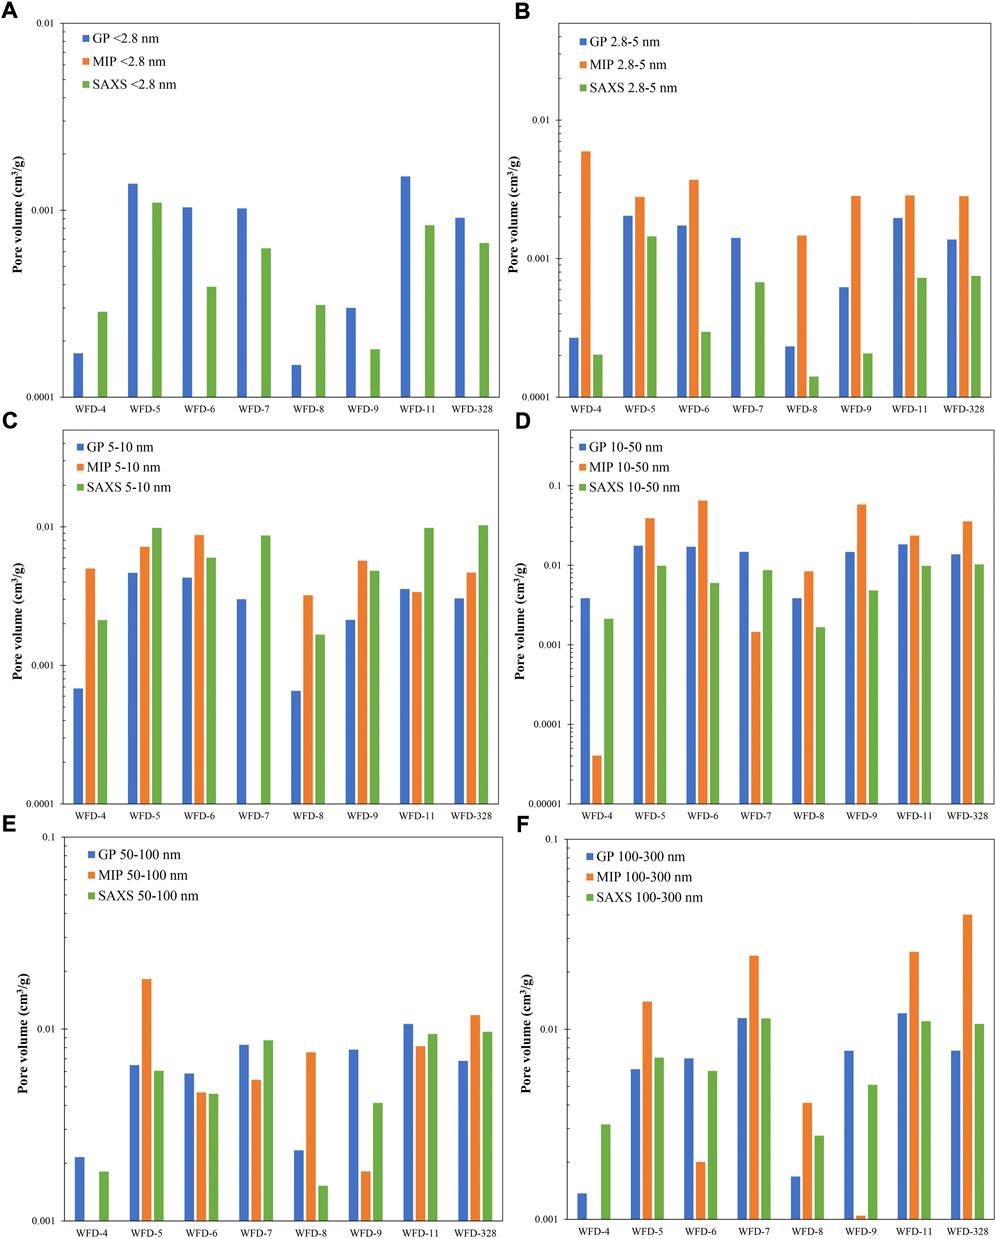
FIGURE 9. Pore volume comparison of GP, MIP, and (U)SAXS methods in six ranges; (A) < 2.8 nm; (B) 2.8–5 nm; (C) 5–10 nm; (D) 10–50 nm; (E) 50–100 nm; (F) 100–300 nm.
Pore body with small throat cannot be filled until the throat was intruded under high pressure. In such condition, the mercury volume being filled into pore body will be accounted as the volume corresponding to a smaller size of pore throat. Because the Washburn equation links the intrusion pressure to pore throat size (Wardlaw and McKellar, 1981; Gao et al., 2018; Zhang, et al., 2019). Therefore, the volume of pore-throats in nanometers are higher than GP and (U)SAXS. No single experiment can characterize the complete spectrum of pore structure in shale because of the limitations and different principles of each experiment. For MIP, higher pressures are needed to measure pores in nanometers, while the high pressure could potentially change the original pore structure and introduce errors to the results (Tang et al., 2016; Li et al., 2018). Compared with MIP, the GP method will not distort the pore structures and keep the samples reusable. However, the measurement range of GP is only from 2–300 nm which is much smaller than the range in MIP which is from 3 nm to ∼1,000 μm. Therefore, the combined data from both methods can be the best option to cover more pores and obtain a better and holistic characterization of the connected pores, with the ability of assessing the ink-bottle effect.
In summary, MIP is the most economic and popular test in pore structure characterization. Though GP could measure nano-sized pores in 2–300 nm by using theoretical data interpretation models, this relatively narrow range make the GP not as effective as MIP. (U)SAXS could measure nano-sized pores in the range of 1–1,000 nm, which is more powerful than GP. However, the small sample size and the accessibility to (U)SAXS instruments in national facilities are the two major limitation, along with the upper testable limit of 1 μm in diameter that is relatively not sufficient to cover many shale samples.
Pore structure characterization by MIP, GP, (U)SAXS and SI methods
In this section, pore structure will be discussed in the context of pore size distribution and pore connectivity. Pore size distribution are based on the combined data of GP and MIP methods. To avoid the errors introduced by the deformation in pores <50 nm under high mercury pressure, GP provides the pore data in 1–50 nm and MIP provides data in the 50 nm-1000 μm range. In addition, the pore connectivity of the Woodford Shale is to be discussed from imbibition slopes (SI) and tortuosity (MIP) results.
In this study, the pore diameter classification by Loucks et al. (2012) was applied. Loucks et al. (2012) proposed three categories of pores: nanopores (1 nm-1 μm), micropores (1–62.5 μm), and mesopores (62.5 μm-4 mm). Figure 10 shows the domination of nanopores in the eight samples. WFD-7, WFD-11, and WFD-328 with porosities over 30% (from MIP) have large pore volumes in nanopores and mesopores. For other samples with porosities at 3–17% (from MIP), only nanopores have the domination. The large pore volumes in large porosity samples may be caused by the weathering and dissolution of the outcrops.
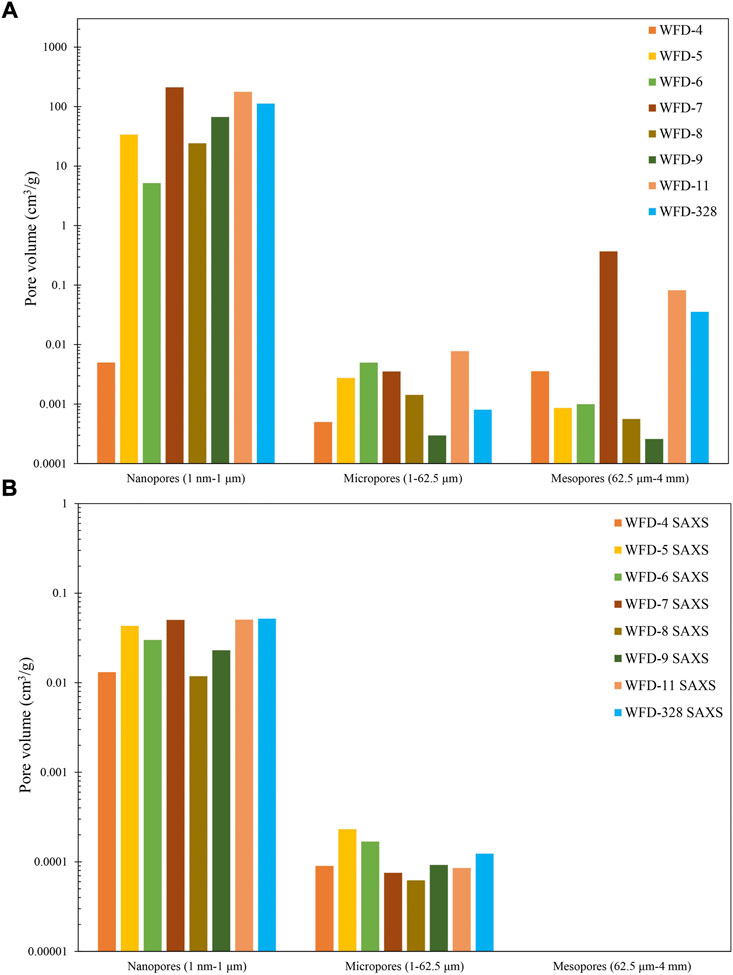
FIGURE 10. (A) Combined pore diameter distribution of MIP and GP method; (B) pore diameter distribution of (U)SAXS method.
These eight Woodford Shale samples were also tested by (U)SAXS method for solvent-extracted and non-extracted samples. The pore volume distribution of non-extracted samples from (U)SAXS shows similar distribution behavior (Figure 10A), which indicates the consistency among GP, MIP, and (U)SAXS methods (Figure 10B). In Table 3, the porosities of solvent-extracted samples increase 46% on the average compared to the non-extracted samples. Samples with high TOC contents, such as WFD-8 and WFD-9, tend to have greater porosity differences after the solvent extraction. Pore diameter distributions of WFD-4, WFD-6, WFD-8, and WFD-9 show a volume increase in nanopores after the solvent extraction, especially at the intervals of 50–100 nm and 400–1,000 nm (Figure 6B). Through the comparison of SEM images, bitumen which is soluble to the solvent decreases obviously with the solvent extraction (Figures 2I,J). Therefore, it is reasonable to speculate that the bitumen which is accounted as OM could block pores and may affect the pore connectivity (Tissot and Welte, 1984).
The fitted slope can indicate the pore connectivity based on the classification by Hu et al. (2002). The values of fitted slope at ∼0.26 indicates poor pore connectivity, ∼0.5 for good pore connectivity, and 0.26–0.5 for intermediate pore connectivity. The fitted slopes from SI method show that the pore connectivities of these eight samples are different. Samples WFD-6, WFD-8, and WFD-9 have poor pore connectivity, WFD-4 and WFD-5 have intermediate pore connectivity, and WFD-7, WFD-11, and WFD-328 have good pore connectivity. The increase in fitted slope for samples WFD-5 and WFD-6 indicates the pore connectivity changing from poor pore connectivity to intermediate connectivity during the imbibition process. To find the factors that influence the pore connectivity, crossplots of fitted slopes with other results were presented (Figure 11A). Group 1 samples (WFD-4, WFD-5, WFD-6, WFD-8, and WFD-9) in SI show a positive relationship between mean grain size and the fitted slope. This correlation could indicate that the increase in grain diameter could help to improve the pore connectivity. Wang X. et al. (2021) pointed out that pores with diameter >50 nm provide the major driving force in SI process. In Table 6, the percentages of pores in 0.05–1 μm for samples WFD-5, WFD-8, WFD-9, WFD-11, and WFD-328 are over 50%. The cross-plot of percentage of pore volume in 0.05–1 μm and mean grain size also have a positive relationship (Figure 11B). Therefore, we reasonably expect that shales with grain sizes greater than 4 μm have a higher possibility to create more nanopores with diameters over 50 nm and provide better pore connectivity. Samples in Group 2 (WFD-7, WFD-11, and WFD-328) in SI show less correlation with mean grain sizes. Tortuosity is also an important property in shale pore structure studies, which could affect the formation factor in Archie’s Law and fluid flow behavior (Archie, 1941; Tsang, 1984). The tortuosity values in the eight Woodford Shale samples are lower than 30, except for samples WFD-11 and WFD-328 which are extremely high (Table 2). Results from Rao and Bai (2020) show a negative linear relationship between tortuosity and porosity in granular soil simulation. However, no relationship exists between tortuosity and porosity in Figure 11C, which could be caused by the complexity of the pore structure in shale.
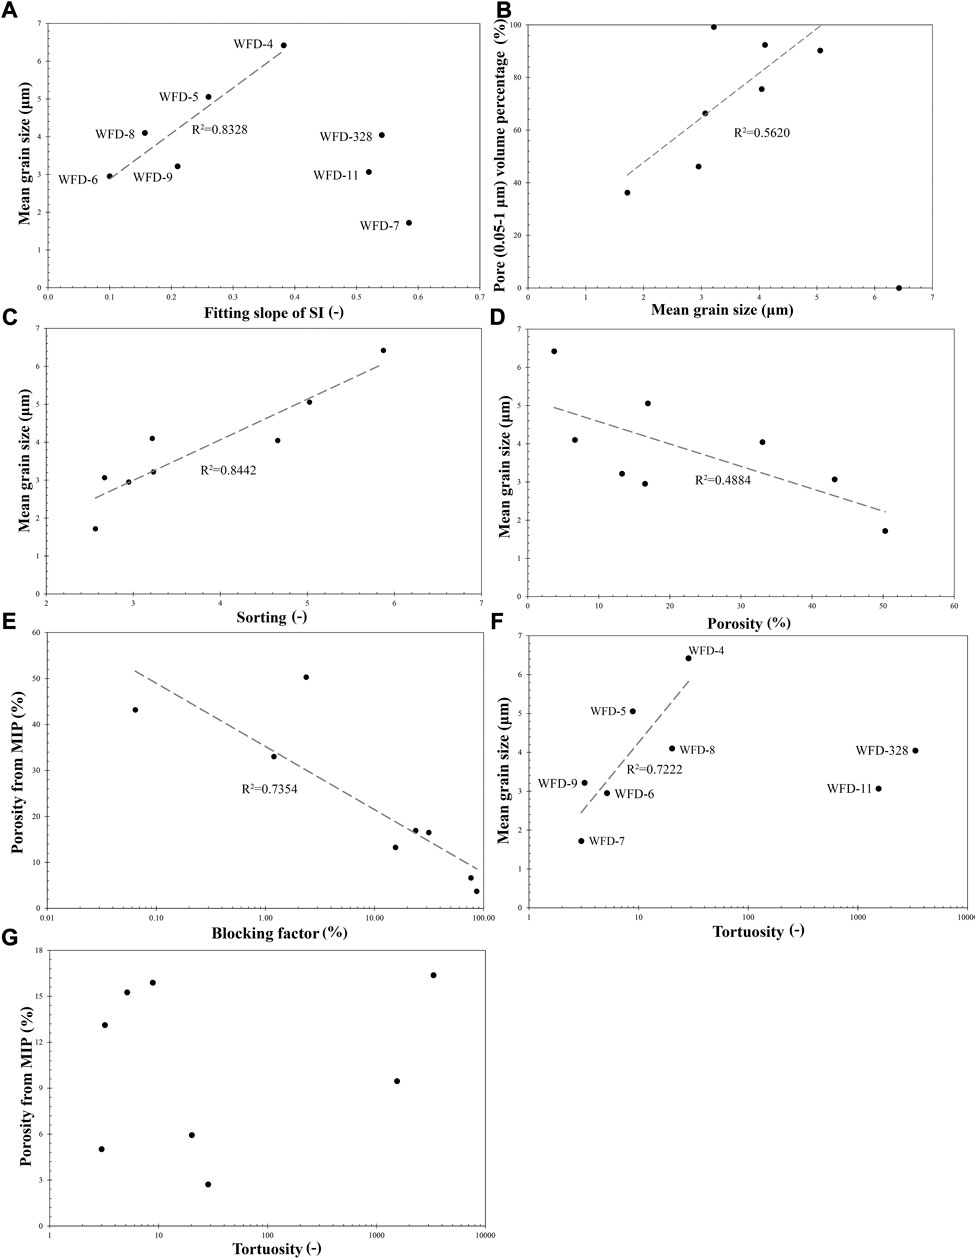
FIGURE 11. Cross plots of (A) mean grain size vs. fitting slopes; (B) nanopore percentage vs. mean grain size; (C) porosity vs. tortuosity; (D) porosity vs. blocking factor; (E) mean grain size vs. sorting; (F) mean grain size vs. porosity; and (G) mean grain size vs. tortuosity; (-) means dimensionless.
Effects of grain size and pore blocking factors on pore structure
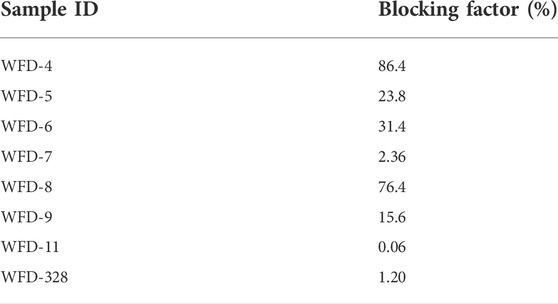
In this section, the influence of grain sizes, pore blocking factors, and paleo-depositional environment on the pore structure of Woodford Shale will be discussed. The results of solvent extraction and (U)SAXS analyses, as well as SEM imaging, show that the bitumen could block the pore space and decrease the porosity as reported by Wei et al. (2014). In addition, Taghavi et al. (2006) and Ehrenberg et al. (2006) showed that the compaction and recrystallization of carbonates can decrease the porosity. From XRD results, the carbonate percentages in WFD-4 & WFD-8 are over 70%, and both samples have the smallest porosities in the eight samples. Moreover, the carbonates in WFD-4 & WFD-8 are observed to be non-porous in SEM images (Figures 2G,H). Therefore, we speculate that both bitumen and carbonates in the Woodford Shale act as pore blocking materials. To quantify the potential contribution of these pore blocking materials, a blocking factor is introduced in this study (Eq. 5) (Table 7). To simplify the weight percent calculation of bitumen, we used TOC% as the replacement in calculating the blocking factor.
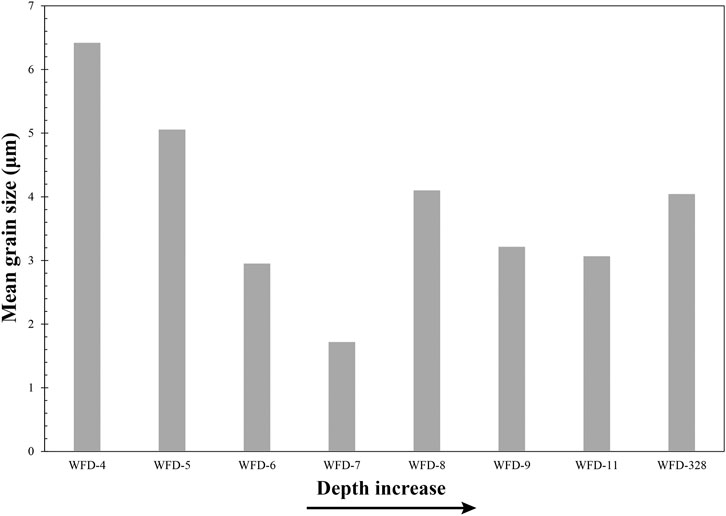
where qtz% is the total percentage of quartz, feldspars, and other trace minerals from the XRD results. The blocking factor varies from 0.06 to 86.4% (Table 1), and the negative relationship between porosity (from MIP) and blocking factor prove the effect of carbonates and OM on porosity (Figure 11D). Mean grain sizes of eight samples show positive and negative relationships with sorting values and porosity (from MIP) (Figures 11E,F). Samples with small grain sizes tend to be well-sorted, and well-sorted samples tend to have greater porosities (McLean and Kirk, 1969; Edwards, 2001; Ogolo et al., 2015). Grain sizes also have direct relationships with the depositional environment of the Woodford Shale. Middle Woodford Shale was deposited in a transgressive environment with increasing water depth, and Upper Woodford Shale was deposited in a highstand system with relatively stable water level (Figure 1) (Comer, 1991; Kirkland et al., 1992; Philp and DeGarmo, 2020). As a water depth increases, the grains deposited at the same place tend to have smaller diameters (Catuneanu, 2006). Therefore, the grain size will decrease upward in the stratigraphic column (from older to younger rocks). In Figure 12, such grain size decrease can be observed in Middle Woodford Shale with the sea-level increase. The changing pattern in the grain size in the Upper Woodford Shale is irregular as the grain sizes decrease first and then increase, which should show grain size increase upward in high-stand system (Figure 12).
The paleo-location of the Ardmore Basin was near the equator and subtropical area (Comer, 1991). The oxygen-bearing surface water could not sink due to its high temperature, which finally formed a thermocline and created the anoxic bottom water environment (Kirkland et al., 1992). Moreover, the dilution of the OM by the sediments was weak due to the less input of sediments during the deposition (Kirkland et al., 1992). Therefore, the anoxic environment and low dilution resulted in higher preservation of the OM in the Woodford Shale. Compared with the Middle Woodford Shale, the TOC% preserved in the Upper Woodford Shale is much lower. In the Upper Woodford Shale, quartz and feldspars are the major minerals and the Upper Woodford Shale has a smaller average blocking factor than the Middle Woodford Shale.
In Woodford Shale samples, positive relationships exist between tortuosity vs. mean grain size, rather than in tortuosity vs. porosity (Figures 11C,G). As discussed before, samples with greater grain sizes tend to be poorly sorted, which has also been suggested by Khabbazi et al. (2015) and Rezende and Pope (2015). Compared with well-sorted samples, smaller sized grains fill in the pores in poorly-sorted samples, resulting in more barriers to fluid movement and an increase in the tortuosity. Therefore, the Woodford Shale outcrop samples with greater grain size tend to be poorly sorted and have higher tortuosity than smaller sized samples.
Conclusion
Multiple experiments were applied on eight Woodford Shale outcrop samples to characterize the pore structure, with a particular emphasis on grain sizes and their distributions. Through a comparison of integrated and complementary experiments, the associated (U)SAXS, MIP, and GP methods are a good combination for shale pore structure study. The results indicate that (1) the nanopores (1 nm-1 µm) dominated Woodford Shale outcrop samples have porosities in 3–40% with poor-to-good pore connectivity; 2) carbonate and OM can decrease the porosity; and 3) porosity, pore connectivity, and tortuosity have close relationships with the grain size which is affected by the sea-level fluctuation in the Woodford Shale. With the sea-level increase, the grain size will decrease, which makes the porosity and tortuosity increase and improves the pore connectivity. This study presents the advantages of the application of multiple experiments on shale. The multiple experiments tested the shales on different aspects to probe the pore structures as comprehensive as possible. This study also built a connection between pore structure and grain size. Since the pores are created based on the grains, such as the interparticle pores, the studies on grains can provide more understandings on pore structures and the pore structure can be further connected with depositional environment in the future.
Data availability statement
The data analyzed in this study is subject to the following licenses/restrictions: The datasets generated during and/or analyzed during the current study are available from the corresponding author on reasonable request. Requests to access these datasets should be directed to Qinhong Hu, bWF4aHVAdXRhLmVkdQ==.
Author contributions
CZ: Investigation, Formal analysis, Writing-Ordinal draft preparation. QH: Conceptualization, Methodology, Resources, Supervision, Writing-Reviewing and Editing. QW: Investigation, Software, Writing-Reviewing and Editing. JI: Investigation, Software. MW: Investigation, Visualization, Resources. XZ: Investigation; Formal analysis. JY: Visualization, Investigation.
Funding
Financial assistances for this work are provided by the National Natural Science Foundation of China (Nos. 41830431 and 41821002), Shandong Provincial Major Type Grant for Research and Development from the Department of Science and Technology of Shandong Province (No. 2020ZLYS08), and AAPG Foundation’s Grants-in-Aid Program. The X-ray scattering data were collected at the X-ray Science Division beamline of 9-ID, a resource of the Advanced Photon Source, a U.S. Department of Energy (DOE) Office of Science User Facility operated for the DOE Office of Science by Argonne National Laboratory under Contract No. DE-AC02-06CH11357.
Conflict of interest
The authors declare that the research was conducted in the absence of any commercial or financial relationships that could be construed as a potential conflict of interest.
Publisher’s note
All claims expressed in this article are solely those of the authors and do not necessarily represent those of their affiliated organizations, or those of the publisher, the editors and the reviewers. Any product that may be evaluated in this article, or claim that may be made by its manufacturer, is not guaranteed or endorsed by the publisher.
References
Baiker, A., and Reithaar, A. (1982). Contact angle of mercury against catalyst materials for use in intrusion porosimetry. Ind. Eng. Chem. Prod. Res. Dev. 21 (4), 590–591. doi:10.1021/i300008a015
Bardestani, R., Patience, G. S., and Kaliaguine, S. (2019). Experimental methods in chemical engineering: Specific surface area and pore size distribution measurements—BET, BJH, and DFT. Can. J. Chem. Eng. 97 (11), 2781–2791. doi:10.1002/cjce.23632
Barrett, E. P., Joyner, L. G., and Halenda, P. P. (1951). The determination of pore volume and area distributions in porous substances. I. Computations from nitrogen isotherms. J. Am. Chem. Soc. 73 (1), 373–380. doi:10.1021/ja01145a126
Bernal, A. S., Mayorga, L. C., Prada, A. G., and Slatt, R. M. (2012). Geological characterization of the Woodford shale. McAlester Cemetery quarry, 63. Oklahoma, 202–213. Shale Shaker.
Brunauer, S., Emmett, P. H., and Teller, E. (1938). Adsorption of gases in multimolecular layers. J. Am. Chem. Soc. 60 (2), 309–319. doi:10.1021/ja01269a023
Cao, T., Song, Z., Wang, S., and Xia, J. (2015). A comparative study of the specific surface area and pore structure of different shales and their kerogens. Sci. China Earth Sci. 58 (4), 510–522. doi:10.1007/s11430-014-5021-2
Cao, Z., Liu, G., Zhan, H., Li, C., You, Y., Yang, C., et al. (2016). Pore structure characterization of Chang-7 tight sandstone using MICP combined with N2GA techniques and its geological control factors. Sci. Rep. 6 (1), 36919–37013. doi:10.1038/srep36919
Cardott, B. J. (2012). Thermal maturity of Woodford Shale gas and oil plays, Oklahoma, USA. Int. J. Coal Geol. 103, 109–119. doi:10.1016/j.coal.2012.06.004
Clarkson, C. R., Solano, N., Bustin, R. M., Bustin, A. M. M., Chalmers, G. R., He, L., et al. (2013). Pore structure characterization of North American shale gas reservoirs using USANS/SANS, gas adsorption, and mercury intrusion. Fuel 103, 606–616. doi:10.1016/j.fuel.2012.06.119
Comer, J. B. (2008). “Distribution and source-rock characteristics of Woodford Shale and age-equivalent strata,” in Poster panel presented at 2008 AAPG annual convention held in san antonio (USA: Texas).
Comer, J. B. (1991). “Stratigraphic analysis of the upper devonian Woodford formation, permian basin, west Texas and southeastern New Mexico,” in Bureau of Economic Geology (Austin: University of Texas at Austin). Report of Investigations Number 201, 66.
Craddock, P. R., Le Doan, T. V., Bake, K., Polyakov, M., Charsky, A. M., and Pomerantz, A. E. (2015). Evolution of kerogen and bitumen during thermal maturation via semi-open pyrolysis investigated by infrared spectroscopy. Energy fuels. 29 (4), 2197–2210. doi:10.1021/ef5027532
Cullen, A. (2020). Woodford shale mercury anomalies from the McAlister Cemetery quarry, Oklahoma: A north American test of the volcanic-trigger hypothesis for late devonian mass extinctions. Shale Shak. 71 (5). September-October.
Curtis, M. E., Ambrose, R. J., Sondergeld, C. H., and Rai, C. S. (2010). in Structural characterization of gas shales on the micro- and nano-scales: Canadian Unconventional Resources and International Petroleum Conference, October 19-21, 2010 (Calgary, Alberta: Canada), 15. SPE Paper 137693.
Curtis, M. E., Cardott, B. J., Sondergeld, C. H., and Rai, C. S. (2012). Development of organic porosity in the Woodford Shale with increasing thermal maturity. Int. J. Coal Geol. 103, 26–31. doi:10.1016/j.coal.2012.08.004
Dong, T., and Harris, N. B. (2020). The effect of thermal maturity on porosity development in the Upper Devonian–Lower Mississippian Woodford Shale, Permian Basin, US: Insights into the role of silica nanospheres and microcrystalline quartz on porosity preservation. Int. J. Coal Geol. 217, 103346. doi:10.1016/j.coal.2019.103346
Ehrenberg, S. N., Eberli, G. P., and Baechle, G. (2006). Porosity-permeability relationships in miocene carbonate platforms and slopes seaward of the great barrier reef, Australia (ODP leg 194, marion plateau). Sedimentology 53 (6), 1289–1318. doi:10.1111/j.1365-3091.2006.00817.x
Ekwunife, I. C. (2017). Assessing mudrock characteristics, high-resolution chemostratigraphy, and sequence stratigraphy of the Woodford shale in the McAlister Cemetery quarry, Ardmore Basin. Oklahoma, Master Thesis: University of Oklahoma.
Forsmo, S. P. E., and Vuori, J. P. (2005). The determination of porosity in iron ore green pellets by packing in silica sand. Powder Technol. 159 (2), 71–77. doi:10.1016/j.powtec.2005.05.032
Freeman, V. L. (1961). Contact of boquillas flags and austin chalk in val verde and terrell counties, Texas. AAPG Bull. 45 (1), 105–107.
Fu, H., Wang, X., Zhang, L., Gao, R., Li, Z., Xu, T., et al. (2015). Investigation of the factors that control the development of pore structure in lacustrine shale: A case study of block X in the ordos basin, China. J. Nat. Gas Sci. Eng. 26, 1422–1432. doi:10.1016/j.jngse.2015.07.025
Gao, Z., and Hu, Q. (2013). Estimating permeability using median pore-throat radius obtained from mercury intrusion porosimetry. J. Geophys. Eng. 10, 025014. doi:10.1088/1742-2132/10/2/025014
Gao, Z., Hu, Q., and Hamamoto, S. (2018). Using multicycle mercury intrusion porosimetry to investigate hysteresis phenomenon of different porous media. J. Porous Media 21 (7), 607–622. doi:10.1615/jpormedia.2018017822
Giesche, H. (2006). Mercury porosimetry: A general (practical) overview. Part. Part. Syst. Charact. 23 (1), 9–19. doi:10.1002/ppsc.200601009
Granath, J. W. (1989). Structural evolution of the Ardmore Basin, Oklahoma: Progressive deformation in the foreland of the ouachita collision. Tectonics 8 (5), 1015–1036. doi:10.1029/tc008i005p01015
Hall, P. L., Mildner, D. F., and Borst, R. L. (1986). Small‐angle scattering studies of the pore spaces of shaly rocks. J. Geophys. Res. 91 (B2), 2183–2192. doi:10.1029/jb091ib02p02183
Hu, H., Zhang, T., Wiggins-Camacho, J. D., Ellis, G. S., Lewan, M. D., and Zhang, X. (2015). Experimental investigation of changes in methane adsorption of bitumen-free Woodford Shale with thermal maturation induced by hydrous pyrolysis. Mar. Petroleum Geol. 59, 114–128. doi:10.1016/j.marpetgeo.2014.07.029
Hu, Q., Ewing, R. P., and Dultz, S. (2012). Low pore connectivity in natural rock. J. Contam. Hydrology 133, 76–83. doi:10.1016/j.jconhyd.2012.03.006
Hu, Q., Persoff, P., and Wang, J. S. (2001). Laboratory measurement of water imbibition into low-permeability welded tuff. J. Hydrology 242 (1-2), 64–78. doi:10.1016/s0022-1694(00)00388-7
Hu, Q., Zhang, Y., Meng, X., Li, Z., Xie, Z., and Li, M. (2017). Characterization of micro-nano pore networks in shale oil reservoirs of paleogene shahejie formation in dongying sag of bohai bay basin, east China. Petroleum Explor. Dev. 44 (5), 720–730. doi:10.1016/s1876-3804(17)30083-6
Ilavsky, J., and Jemian, P. R. (2009). Irena: Tool suite for modeling and analysis of small-angle scattering. J. Appl. Crystallogr. 42 (2), 347–353. doi:10.1107/s0021889809002222
Ilavsky, J., Zhang, F., Andrews, R. N., Kuzmenko, I., Jemian, P. R., Levine, L. E., et al. (2018). Development of combined microstructure and structure characterization facility for in situ and operando studies at the Advanced Photon Source. J. Appl. Crystallogr. 51 (3), 867–882. doi:10.1107/s160057671800643x
Iqbal, O., Padmanabhan, E., Mandal, A., and Dvorkin, J. (2021). Characterization of geochemical properties and factors controlling the pore structure development of shale gas reservoirs. J. Petroleum Sci. Eng. 206, 109001. doi:10.1016/j.petrol.2021.109001
Jarvie, D. M., Claxton, B. L., Henk, F., and Breyer, J. T. (2001). Oil and shale gas from the barnett shale. Denver: AAPG Annual Meeting Program 10, A100.
Katz, A. J., and Thompson, A. H. (1986). Quantitative prediction of permeability in porous rock. Phys. Rev. B 34 (11), 8179–8181. doi:10.1103/physrevb.34.8179
Khabbazi, A. E., Hinebaugh, J., and Bazylak, A. (2015). Analytical tortuosity–porosity correlations for Sierpinski carpet fractal geometries. Chaos, Solit. Fractals 78, 124–133. doi:10.1016/j.chaos.2015.07.019
Kibria, M. G., Hu, Q., Liu, H., Zhang, Y., and Kang, J. (2018). Pore structure, wettability, and spontaneous imbibition of Woodford shale, Permian Basin, West Texas. Mar. Petroleum Geol. 91, 735–748. doi:10.1016/j.marpetgeo.2018.02.001
Kirkland, D. W., Denison, R. E., Summers, D. M., Gormly, J. R., Johnson, K. S., and Cardott, B. J. (1992). Geology and organic geochemistry of the Woodford shale in the criner hills and Western arbuckle mountains, Oklahoma. Okla. Geol. Surv. Circ. 93, 38–69.
Kuila, U., McCarty, D. K., Derkowski, A., Fischer, T. B., and Prasad, M. (2014). Total porosity measurement in gas shales by the water immersion porosimetry (WIP) method. Fuel 117, 1115–1129. doi:10.1016/j.fuel.2013.09.073
Li, T., Senesi, A. J., and Lee, B. (2016). Small angle X-ray scattering for nanoparticle research. Chem. Rev. 116 (18), 11128–11180. doi:10.1021/acs.chemrev.5b00690
Li, X., Kang, Y., and Haghighi, M. (2018). Investigation of pore size distributions of coals with different structures by nuclear magnetic resonance (NMR) and mercury intrusion porosimetry (MIP). Measurement 116, 122–128. doi:10.1016/j.measurement.2017.10.059
Li, Z., Wu, S., Xia, D., He, S., and Zhang, X. (2018). An investigation into pore structure and petrophysical property in tight sandstones: A case of the yanchang formation in the southern ordos basin, China. Mar. Petroleum Geol. 97, 390–406. doi:10.1016/j.marpetgeo.2018.07.014
Loog, A., Kurvits, T., Aruvali, J., and Petersell, V. (2001). Grain size analysis and mineralogy of the Tremadocian Dictyonema shale in Estonia. Oil Shale 18 (4), 281–297.
Loucks, R. G., Reed, R. M., Ruppel, S. C., and Hammes, U. (2012). Spectrum of pore types and networks in mudrocks and a descriptive classification for matrix-related mudrock pores. Am. Assoc. Pet. Geol. Bull. 96 (6), 1071–1098. doi:10.1306/08171111061
Loucks, R. G., and Reed, R. M. (2014). Scanning-electron-microscope petrographic evidence for distinguishing organic-matter pores associated with depositional organic matter versus migrated organic matter in mudrock. Gulf Coast Assoc. Geol. Soc. 3, 51–60.
Lowell, S., Shields, J. E., Thomas, M. A., and Thommes, M. (2012). Characterization of porous solids and powders: Surface area, 16. New York City, USA: Springer Science & Business Media. pore size and density.
Ma, Z., Merkus, H. G., de Smet, J. G., Heffels, C., and Scarlett, B. (2000). New developments in particle characterization by laser diffraction: Size and shape. Powder Technol. 111 (1-2), 66–78. doi:10.1016/s0032-5910(00)00242-4
McCave, I. N., Bryant, R. J., Cook, H. F., and Coughanowr, C. A. (1986). Evaluation of a laser-diffraction-size analyzer for use with natural sediments. J. Sediment. Res. 56, 561–564. doi:10.1306/212f89cc-2b24-11d7-8648000102c1865d
McLean, R. F., and Kirk, R. M. (1969). Relationships between grain size, size-sorting, and foreshore slope on mixed sand-shingle beaches. N. Z. J. Geol. Geophys. 12 (1), 138–155. doi:10.1080/00288306.1969.10420231
Micromeritics Instrument Inc. (2015). AutoPore V series mercury intrusion porosimetry calculations, 19 pp.
Moore, D. M., and Reynolds, R. C. (1997). X-Ray diffraction and the identification and analysis of clay minerals. 2nd Edition. New York: Oxford University Press.
Muller, P. (1994). Glossary of terms used in physical organic chemistry (IUPAC Recommendations 1994). Pure Appl. Chem. 66 (5), 1077–1184. doi:10.1351/pac199466051077
Ogolo, N. A., Akinboro, O. G., Inam, J. E., Akpokere, F. E., and Onyekonwu, M. O. (2015). “Effect of grain size on porosity revisited,” in SPE Nigeria annual international conference and exhibition (Lagos: SPE-178296-MS).
Ojha, S. P., Misra, S., Sinha, A., Dang, S., Tinni, A., Sondergeld, C., et al. (2018). Relative permeability and production-performance estimations for bakken, wolfcamp, eagle ford, and Woodford shale formations. SPE Reserv. Eval. Eng. 21 (02), 307–324. doi:10.2118/189983-pa
Parker, M. A., Buller, D., Petre, J. E., and Dreher, D. T. (2009). Haynesville shale-petrophysical evaluation. SPE Rocky Mountain Petroleum Technology Conference. SPE-122937-MS.
Penner, D., and Lagaly, G. (2001). Influence of anions on the rheological properties of clay mineral dispersions. Appl. Clay Sci. 19 (1-6), 131–142. doi:10.1016/s0169-1317(01)00052-7
Philip, J. R. (1957). The theory of infiltration: 4. Sorptivity and algebraic infiltration equations. Soil Sci. 84 (3), 257–264. doi:10.1097/00010694-195709000-00010
Philp, R. P., and DeGarmo, C. D. (2020). Geochemical characterization of the devonian-mississippian Woodford shale from the McAlister Cemetery quarry, criner hills uplift, Ardmore Basin, Oklahoma. Mar. Petroleum Geol. 112, 104078. doi:10.1016/j.marpetgeo.2019.104078
Qiao, J., Zeng, J., Jiang, S., Zhang, Y., Feng, S., Feng, X., et al. (2020). Insights into the pore structure and implications for fluid flow capacity of tight gas sandstone: A case study in the upper paleozoic of the ordos basin. Mar. Petroleum Geol. 118, 104439. doi:10.1016/j.marpetgeo.2020.104439
Ravikovitch, P. I., and Neimark, A. V. (2002). Experimental confirmation of different mechanisms of evaporation from ink-bottle type pores: Equilibrium, pore blocking, and cavitation. Langmuir 18 (25), 9830–9837. doi:10.1021/la026140z
Rezende, M. F., and Pope, M. C. (2015). Importance of depositional texture in pore characterization of subsalt microbialite carbonates, offshore Brazil. Geol. Soc. Lond. Spec. Publ. 418 (1), 193–207. doi:10.1144/sp418.2
Romero, M. A., and Philp, R. P. (2012). Organic geochemistry of the Woodford Shale, southeastern Oklahoma: How variable can shales be. Am. Assoc. Pet. Geol. Bull. 96 (3), 493–517. doi:10.1306/08101110194
Sato, Y., Ishihara, M., Nakamura, S., Fukuda, K., Takayama, T., Hiruma, S., et al. (2019). Preparation and application of bioshell calcium oxide (BiSCaO) nanoparticle-dispersions with bactericidal activity. Molecules 24 (18), 3415. doi:10.3390/molecules24183415
Schlumberger, C., and Thommes, M. (2021). Characterization of hierarchically ordered porous materials by physisorption and mercury porosimetry—a tutorial review. Adv. Mat. Interfaces 8 (4), 2002181. doi:10.1002/admi.202002181
Slatt, R. M., and O'Brien, N. R. (2011). Pore types in the Barnett and Woodford gas shales: Contribution to understanding gas storage and migration pathways in fine-grained rocks. Am. Assoc. Pet. Geol. Bull. 95 (12), 2017–2030. doi:10.1306/03301110145
Sun, M., Yu, B., Hu, Q., Yang, R., Zhang, Y., Li, B., et al. (2017). Pore structure characterization of organic-rich Niutitang shale from China: Small angle neutron scattering (SANS) study. Int. J. Coal Geol. 186, 115–125. doi:10.1016/j.coal.2017.12.006
Sun, M., Zhang, L., Hu, Q., Pan, Z., Yu, B., Sun, L., et al. (2019). Multiscale connectivity characterization of marine shales in southern China by fluid intrusion, small-angle neutron scattering (SANS), and FIB-SEM. Mar. Petroleum Geol. 112, 104101. doi:10.1016/j.marpetgeo.2019.104101
Sun, M., Zhao, J., Pan, Z., Hu, Q., Yu, B., Tan, Y., et al. (2020). Pore characterization of shales: A review of small angle scattering technique. J. Nat. Gas Sci. Eng. 78, 103294. doi:10.1016/j.jngse.2020.103294
Taghavi, A. A., Mork, A., and Emadi, M. A. (2006). Sequence stratigraphically controlled diagenesis governs reservoir quality in the carbonate Dehluran Field, southwest Iran. Pet. Geosci. 12 (2), 115–126. doi:10.1144/1354-079305-672
Tang, X., Jiang, Z., Jiang, S., Wang, P., and Xiang, C. (2016). Effect of organic matter and maturity on pore size distribution and gas storage capacity in high-mature to post-mature shales. Energy fuels. 30 (11), 8985–8996. doi:10.1021/acs.energyfuels.6b01499
Thommes, M., Kaneko, K., Neimark, A. V., Olivier, J. P., Rodriguez-Reinoso, F., Rouquerol, J., et al. (2015). Physisorption of gases, with special reference to the evaluation of surface area and pore size distribution (IUPAC Technical Report). Pure Appl. Chem. 87 (9-10), 1051–1069. doi:10.1515/pac-2014-1117
Thommes, M. (2010). Physical adsorption characterization of nanoporous materials. Chem. Ing. Tech. 82 (7), 1059–1073. doi:10.1002/cite.201000064
Tissot, B. P., and Welte, D. H. (1984). Petroleum formation and occurrence. New York: Springer-Verlag, 699.
Tsang, Y. W. (1984). The effect of tortuosity on fluid flow through a single fracture. Water Resour. Res. 20 (9), 1209–1215. doi:10.1029/wr020i009p01209
Wang, P., Jiang, Z., Chen, L., Yin, L., Li, Z., Zhang, C., et al. (2016). Pore structure characterization for the Longmaxi and Niutitang shales in the Upper Yangtze Platform, South China: Evidence from focused ion beam–He ion microscopy, nano-computerized tomography and gas adsorption analysis. Mar. Petroleum Geol. 77, 1323–1337. doi:10.1016/j.marpetgeo.2016.09.001
Wang, Q., Hu, Q., Larsen, C., Zhao, C., Sun, M., Zhang, Y., et al. (2021a). Microfracture-pore structure characterization and water-rock interaction in three lithofacies of the Lower Eagle Ford Formation. Eng. Geol. 292, 106276. doi:10.1016/j.enggeo.2021.106276
Wang, Q., Hu, Q., Ning, X., Ilavasky, J., Kuzmenko, I., and Tom, T. (2021b). Spatial heterogeneity analyses of pore structure and mineral composition of Barnett Shale using X-ray scattering techniques. Mar. petroleum Geol. 134, 105354. doi:10.1016/j.marpetgeo.2021.105354
Wang, X., Wang, M., Li, Y., Zhang, J., Li, M., Li, Z., et al. (2021c). Shale pore connectivity and influencing factors based on spontaneous imbibition combined with a nuclear magnetic resonance experiment. Mar. Petroleum Geol. 132, 105239. doi:10.1016/j.marpetgeo.2021.105239
Wang, Y., Cheng, H., Hu, Q., Liu, L., Jia, L., Gao, S., et al. (2022). Pore structure heterogeneity of Wufeng-Longmaxi shale, Sichuan Basin, China: Evidence from gas physisorption and multifractal geometries. J. Petroleum Sci. Eng. 208, 109313. doi:10.1016/j.petrol.2021.109313
Wardlaw, N. C., and McKellar, M. (1981). Mercury porosimetry and the interpretation of pore geometry in sedimentary rocks and artificial models. Powder Technol. 29 (1), 127–143. doi:10.1016/0032-5910(81)85011-5
Washburn, E. W. (1921). Note on a method of determining the distribution of pore sizes in a porous material. Proc. Natl. Acad. Sci. U. S. A. 7 (4), 115–116. doi:10.1073/pnas.7.4.115
Wei, L., Mastalerz, M., Schimmelmann, A., and Chen, Y. (2014). Influence of Soxhlet-extractable bitumen and oil on porosity in thermally maturing organic-rich shales. Int. J. Coal Geol. 132, 38–50. doi:10.1016/j.coal.2014.08.003
Wen, B., Aydin, A., and Duzgoren-Aydin, N. S. (2002). A comparative study of particle size analyses by sieve-hydrometer and laser diffraction methods. Geotechnical Test. J. 25 (4), 434–442.
Zhang, H., Huang, H., Li, Z., and Liu, M. (2019). Oil physical status in lacustrine shale reservoirs–A case study on Eocene Shahejie Formation shales, Dongying Depression, East China. Fuel 257, 116027. doi:10.1016/j.fuel.2019.116027
Zhang, L., Deng, Z., Sun, M., Lin, J., Ukaomah, C. F., Hu, Q., et al. (2021). Characterization of closed pores in Longmaxi Shale by synchrotron small-angle x-ray scattering. Energy fuels. 35 (8), 6738–6754. doi:10.1021/acs.energyfuels.1c00190
Keywords: woodford shale, pore structure, characterization methods, connectivity, grain size, deposition
Citation: Zhao C, Hu Q, Wang Q, Ilavsky J, Wang M, Zhang X and Yan J (2022) Multiple experimental studies of pore structure and mineral grain sizes of the Woodford shale in southern Oklahoma, USA. Front. Earth Sci. 10:1019951. doi: 10.3389/feart.2022.1019951
Received: 15 August 2022; Accepted: 06 September 2022;
Published: 26 September 2022.
Edited by:
Jianhua Zhao, China University of Petroleum, ChinaReviewed by:
Yang Wang, Chang’an University, ChinaMengdi Sun, Northeast Petroleum University, China
Copyright © 2022 Zhao, Hu, Wang, Ilavsky, Wang, Zhang and Yan. This is an open-access article distributed under the terms of the Creative Commons Attribution License (CC BY). The use, distribution or reproduction in other forums is permitted, provided the original author(s) and the copyright owner(s) are credited and that the original publication in this journal is cited, in accordance with accepted academic practice. No use, distribution or reproduction is permitted which does not comply with these terms.
*Correspondence: Qinhong Hu, bWF4aHVAdXRhLmVkdQ==
 Chen Zhao1,2
 Qinhong Hu
 Jan Ilavsky