 Shuiling Zhang
 Hui Li
 Chunhui Li
 Yujun Yi
 Xuan Wang
 Qiang Liu
94% of researchers rate our articles as excellent or good
Learn more about the work of our research integrity team to safeguard the quality of each article we publish.
Find out more
ORIGINAL RESEARCH article
Front. Earth Sci., 16 January 2023
Sec. Hydrosphere
Volume 10 - 2022 | https://doi.org/10.3389/feart.2022.1018980
This article is part of the Research TopicWater and Ecological System: Response, Management, and RestorationView all 15 articles
With the development of the economy, the contradiction of water resources in the lower Yellow River area is becoming increasingly serious. Economic development not only increases the socio-economic water demand, but also causes damage to the environment. In order to ensure the safety of the vast plains along the lower Yellow River, protect the environment of the lower Yellow River and estuaries, and achieve environmental sustainability of the lower Yellow River, a model was established to optimize the allocation of water resources with the goal of ecological, safety, and social benefits, combining the uncertainty of water resources, the uncertainty of the water demand during the flood season under different water and sediment conditions, and the water requirements of different water users. An improved ecological footprint method considering soil water was applied during the allocation. Thirty different scenarios were set up, and appropriate scenarios for 2025 and 2030 in wet, normal, and dry years were calculated, providing a reference for decision makers. Results show that: 1) The water supply is affected by the amount of water resources and water demand for sediment transport in the lower Yellow River. The satisfaction of sediment transport and the water supply rate during wet years can reach a high level of satisfaction. 2) When the regional water resources ecological footprint is the smallest, the allocation of water resources tends to the section or unit with a smaller ecological footprint. Therefore, the river sections with the lowest water shortage rates are Lijin-Hekou and Sunkou-Aishan, and the unit with a low water shortage is ecological and industrial water.
The ecological footprint can comprehensively calculate the utilization of resources, and measure the relationship between the degree of human utilization of natural resources and the ability of the environment to provide services to humans (Rees 1992; Wackernagel and Rees 1996). After being proposed, the concept of ecological footprint was then introduced by some scholars and gradually applied to the calculation of water resource utilization, the calculation of water resources carrying capacity, and the evaluation of sustainable development.
The water utilization described in the ecological footprint model did not reflect the actual integrated use of water resources, Chinese scholar Fan (2005), to reduce previous limitations in describing water resources, proposed the water resources ecological footprint model to reduce previous limitations in describing water resource by increasing the assessment of the use of water resources by human activities and the health of aquatic ecosystems (Wang et al., 2006; Dai et al., 2019). The advantage of the ecological footprint of water resources is that it considers the degree of ecological resources occupied by humans and indicates the ecological sustainability of regional development (Hoekstra 2008; Stoeglehner et al., 2011). The water resources ecological footprint method mainly evaluates the sustainable development and utilization of water resources by establishing a calculation model of the ecological footprint of water resources and the corresponding ecological carrying capacity (Huang et al., 2008). Since the introduction of the ecological footprint of water resources, its meaning has been continuously expanded and improved, scholars have taken into account the concept of ecological footprint of water resources for CNY 10,000 of GDP and the impact of water pollution on the environment (Wang et al., 2013), the regional characteristics of equalization and yield factors (Wang et al., 2020) to make the ecological footprint of water resources more accurate for the respective areas. Su et al. (2018) compared water ecological footprint in four municipalities in China to help identify the key gaps between different cities under different developing back ground. The ecological footprint of water resources considers the carrying capacity of regional water resources and can demonstrate whether the local sectors use water resources in a sustainable approach.
The allocation of water resources is concerned with how limited resources should be distributed fairly among competing activities (Wang et al., 2007). In the process of research and development in the allocation of water resources worldwide, the research objective has changed from simply optimizing the water volume to coordinating the economy and ecological environment. Linear programming, dynamic programming, nonlinear programming, multi-objective programming, multi-objective genetic algorithms, and other theoretical methods were applied to achieve the comprehensive goal (Chen et al., 2006; Song, 2008). Scholars have modified the methods to make them more suitable for their own study area by establishing agriculture and hydropower sectors and the marginal net benefit from domestic and industrial sectors (Divakar et al., 2011), developing a multi-stage fuzzy stochastic programming (MFSP) method to hybrid uncertainties with the consideration of ecological water demand (Li et al., 2018), considering hydropolitic conditions (Kazemi et al., 2020), applying the sustainability index to the optimization model (Dadmand et al., 2020), etc.
The Yellow River is China’s second largest river, and water resource of the Yellow River basin is decreasing (Zhang et al., 2009). Since the middle and lower reaches of the Yellow River Basin are more economically efficient in water use and the water demand in the lower reaches of the Yellow River is higher (Guan et al., 2021). Many Chinese scholars have conducted research on the optimization of water resources in the lower Yellow River and the Yellow River Delta (Shao et al., 2009; Yang, 2011; Zhang et al., 2014; Zhang and Oki, 2021). Water resources are needed for household production, ecology, and sediment transport in the lower Yellow River. In order to coordinate the conflicts of interests of all parties in water use, and consider the coordinated and sustainable development of different elements in various regions, water resources need to be allocated according to local conditions. In this study, the water resources were allocated to meet the goals of high-quality development and ecology protection with ecological footprint of water resources. The ecological footprint calculation takes into account the soil water, which improves the comprehensiveness of this method.
With the development of the economy and society and the improvement of people’s living standards, China’s water shortage problem has become increasingly prominent. Defining the status quo of sustainable water resources is of great significance for the rational allocation of limited water resources, improving water use efficiency and achieving the sustainable development of society. Due to natural and human factors, the shortage of water resources in the lower Yellow River has become more serious.
The urban clusters in the lower Yellow River selected in this study cover 17 cities in Henan Province and Shandong Province (Figure 1). The area is 12,171,513 square kilometres with a temperate monsoon climate. The temperature from May to September is 21.5–27.3°C, December to February is −2.4–2.8°C, the rest of the months is 7.1–15.7°C. The annual average temperature is 14.1–15.1°C. The annual average precipitation is 490–720 mm, and the precipitation from June to September accounts for three-quarters of the total.

FIGURE 1. City group map along the lower Yellow River.
Considering the regulating performance and storage capacity of Xiaolangdi Reservoir, we believe that the downstream water regulation can be achieved during the year. Therefore, the problem to be solved is how to allocate water resources in the lower Yellow River and achieve the maximum benefit among different water users.
Based on the conditions in the lower Yellow River, water resources can be divided into two major aspects: the ecological water used for sediment transport in the river, and the domestic water outside the river. It is a multi-objective problem as it is necessary to consider both the spatial and temporal allocation of water resources.
To solve the problem, it is necessary to identify the water consumption of each type of water use, each river section, and each period; generalize the downstream area; and convert the problem into a mathematical problem. Based on the above requirements, a spatial generalization of the lower Yellow River area was carried out.
According to the relationship between the water supply project and the natural geographical location, the study area is generalized into 7 river sections according to the main control hydrological station downstream, namely, Huayuankou-Jiahetan (HJ), Jiahetan-Gaocun (JG), Gaocun-Sunkou (GS), Sunkou-Aishan (SA), Aishan- Luokou (AL), Luokou-Lijin (LL), and Lijin-Hekou (LH), and 8 nodes: Huayuankou, Jiahetan, Gaocun, Sunkou, Aishan, Luokou, Lijin, and Hekou. The administrative regions (cities) corresponding to each river section are shown in Table 1. The lower Yellow River is generalized as shown in Figure 2, where ecological water refers to the ecological water outside the river.
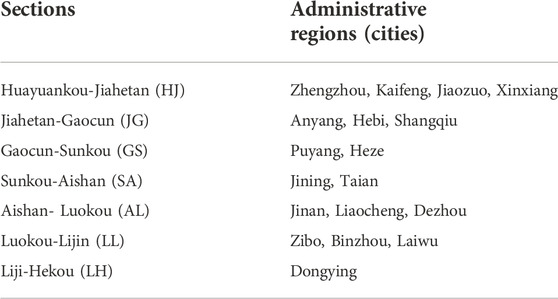
TABLE 1. Comparison table of generalized administrative units in the lower Yellow River.
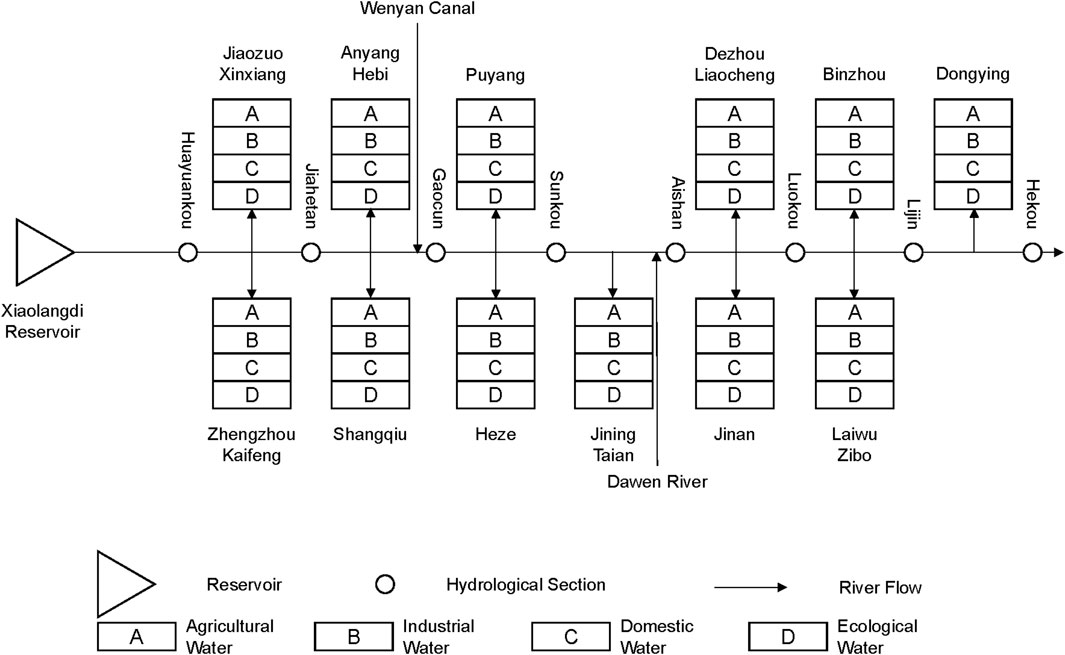
FIGURE 2. Generalized diagram of water resource users in the lower Yellow River.
The steps for the allocation of water resources are as follows:
1) Determine the scope of the research: the scope of this study was the lower Yellow River.
2) Determine the objectives of the research: according to national ecological protection and high-quality development plan of the Yellow River (The State Council of the People’s Republic of China Gov, 2021), ecological water use should be considered first. The management of the Yellow River, the protection of germplasm resources, and farmland agriculture should be planned as a whole.
3) Users identification and generalization: a) water sources, including the inflow of upstream rivers, the inflow of tributaries, the storage of reservoirs, the groundwater, and the externally transferred water sources; b) users, including household, industry, agriculture, and ecology; c) transmission and water supply systems, including the industrial water intake and channels in the study area. Based on the studies of Li et al. (2020) and the actual situation of the lower Yellow River, the basic data in this study are shown in Tables 2–5:
4) Target determination: coordination should be conducted to meet the goals of each department in time and space.
5) Constraint determination: various constraints were set to achieve system goals.
6) Model establishment.
7) Model solving: find a suitable algorithm and program to solve the model.
8) The generation of the system plan: optimize and coordinate the water resources to obtain the final allocation plan of water resources.
According to the natural and economic conditions of the lower Yellow River, the principles for constructing the allocation model were determined as follows:
1) Put people first and guaranteeing people’s lives along the river.
2) Ensure the basic ecological water use of the river, and ensure the water requirements of the ecological environment of the estuary.
3) Ensure production safety, which means the agricultural water use should meet water demand during the growth period of crops in the lower Yellow River.
4) Ensure the safety of downstream flood control and ensure water for sediment transport during the flood season.
5) The relationship between water used within the river basins and water transferred across river basins should be handled well. Water demand of users in various sections should be considered comprehensively.
6) Promote a virtuous cycle of the ecological environment, maintain and improve the regional ecological environment.
The overall goal of the spatial allocation of water resources in the lower Yellow River was to achieve the sustainable development of the social economy through the process. The objectives of this study are mainly reflected in three aspects:
1) The safety goal was to protect the vast plains along the lower Yellow River from floods, ensure that the water supply meets the demand for planting and the demand for sediment transport in the lower Yellow River.
2) The ecological environment goal was to improve the environment of the lower Yellow River, the ecological environment of the Yellow River and estuaries, and gradually increase the amount of water used for the ecological environment.
3) The socio-economic goal was to ensure the quality and quantity of water for urban and rural residents.
According to the above objectives and requirements, the water resources of the lower Yellow River can be divided into two major aspects. One is the ecological water used for sediment transport in the river, and the other is the water used for production and domestic outside the river. Time and space are the factors that must be considered while allocating water resources, so the water requirements of each type of water use, river section, and period must be identified.
Due to the positive linear correlation between the runoff and sediment load (Kong et al., 2015) and water volume of the Yellow River Basin during wet, normal, and dry years varies greatly, water used for water and sediment regulation varies in different years. In wet years, it is necessary to ensure the basic ecological water demand in the river, and provide a longer period of time for water and sediment regulation to ensure water for sediment transport during the flood season. In normal years, the time for water and sediment regulation should be reduced due to the limitation of incoming water. In dry years, the water used for water and sediment regulation should be restricted.
According to the relevant planning and the actual situation of the river basin, agricultural water, industrial water, domestic water, ecological water (referring to ecological water outside the river), sediment transport and river ecological water (river water) were selected as five users of three objectives of the allocation. Meanwhile, the temporal and spatial distribution of water resources was taken into account.
Building a multi-objective allocation model should include the following aspects:
1) Goal: Achieve a balance among demand of ecology, sediment transport, and economy.
2) Time: Meet the water demands of different periods.
3) Space: Meet the water demands of different river sections.
The lower Yellow River is at an ecological deficit (Li et al., 2020); the ecological footprint of water resources is mainly derived from household and production, involving domestic, agricultural and industrial water consumption. Therefore, the ecological footprint can be used as the objective function to balance the relationship between agricultural, industrial, domestic water and the environment. Taking sediment transport and ecological satisfaction as the objective function reflects the goals of sediment transport and river ecological water use.
Benefits will be generated when distributing water resources to various users, and there will also be costs when using water resources. The purpose of water resources optimization is to meet the needs of all users, increase benefits, and reduce costs when allocating water resources. According to the general guiding concept of taking into account the safety, ecological safety, and social development of the lower Yellow River, this article considers the ecological benefit objective, safety benefit objective, and social benefit objective as the objectives of the lower Yellow River area.
1) Ecological footprint function
The ecological footprint can reflect the sustainable development of a region. The ecological footprint of water consumption is calculated according to the definition of the improved ecological footprint (Li et al., 2020), which added the soil water as an indicator to make the assessment more comprehensive. For the lower Yellow River, the ecological footprint calculation includes four aspects, namely, agricultural, industrial, domestic and ecological water consumption.
where
2) Satisfaction function
The satisfaction function of ecological water use for river sediment transport was selected as the objective function of safety and ecology. The objective satisfaction function (Zhao et al., 2007) is defined as:
where
Based on this, the ecological satisfaction function of river sediment transport is established:
where
3) Water shortage rate function
The total water shortage rate function was selected as the social benefit objective function. Social benefit refers to the social value generated after the water source is allocated to the four water users (household, industry, agriculture, and environment). Under limited water resources conditions, the minimum total water shortage rate of the lower Yellow River is selected as the social benefit target, and the formula is as follows:
where
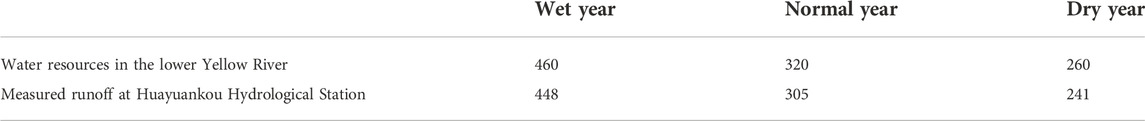
TABLE 2. Water resources in the lower Yellow River/108 m3.
1) Constraints on the total amount of water resources: the amount of water taken by all users outside the river channel and the amount of water in the river channel shall not exceed the total amount of water resources.
where
2) Water balance restriction of diversion section: according to the principle of water balance, the inflow section is equal to the outflow section plus the water withdrawal of the river section minus the river receding water.
where
3) River water restriction: in order to ensure the safety of the environment in the lower Yellow River, the river must have a certain amount of flow to transport sediment and protect the environment, which is expressed by the ecological water use constraints of sediment transport and the river ecological water:
where
where
4) Water diversion restriction: the water drawn from the river channel cannot exceed its water demand.
where
5) Water supply capacity constraints: the water drawn from the river cannot exceed than its water supply capacity.
where
6) Non-negative constraints
According to the prediction results of water demand in Table 3 and Table 4, the corresponding constraint values of water in the river and outside the river were obtained, and the constraints of water use in the river are as follows: the sediment transport water in the flood season was calculated according to the bankfull discharge in the flood season. The upper limit of the sediment transport water requirement in the flood season, as found in Table 3, is the ideal value of the objective function, and the lower limit of the sediment transport water requirement is the lower limit of the objective function; the nonflood season’s suitable ecological water demand in Table 3 is the ideal value of the objective function, and the lower limit ecological water demand is the lower limit of the objective function.
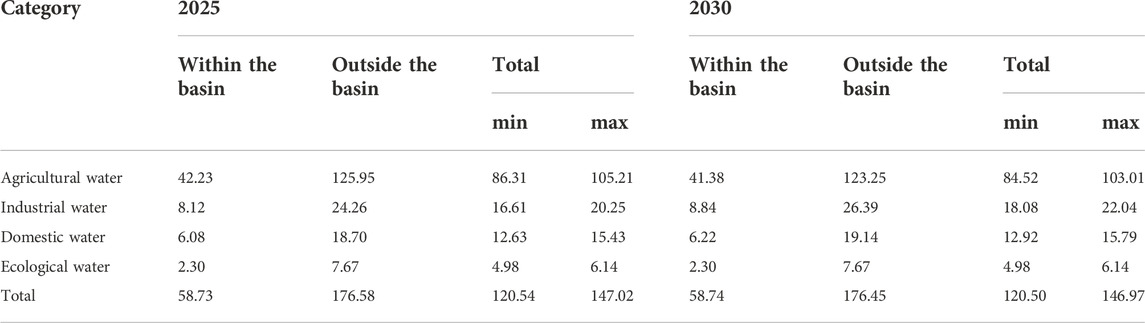
TABLE 3. Water demand by users in the lower Yellow River/108 m3 (water use outside the basin is water diverted to the Huai River Basin and the Shandong Peninsula, details can be found in the cited article).

TABLE 4. Water demand in the lower Yellow River/108 m3.
At present, linear programming is the best way to solve multi-objective problems, and its core concept is to transform multi-objective problems into single-objective problems. This paper adopted the main objective function method, that is, a primary objective function is selected from a series of objective functions, while the remaining objectives are limited to a certain range and converted into new constraints, established the model according to the above constraints, and used the General Algebraic Modelling System (GAMS) to solve it.
The objective function is:
The constraint functions are:
where each symbol in the formula is the same as before.
According to the water demand forecast results (2025 and 2030) from Table 5 and the uncertainty of incoming water and sediment (frequency of water resources and range of water used for sediment transport), this research combined high, medium, and low inflow scenarios (that is, corresponding to wet years, normal years, and dry years in Table 4) with different ecological satisfaction levels of sediment transport to form different simulation scenarios. Among them, the different types of sediment transport satisfaction were divided into A, B, C, D, and E, respectively, corresponding to the scenarios with satisfaction levels of 0, 0.25, 0.5, 0.75, and 1. A total of 30 scenarios were set up to analyze the quantitative relationship between different sediment transport requirements and water shortage rates under different water requirements and different incoming water conditions. The parameters of each simulation scenario are shown in Table 6.
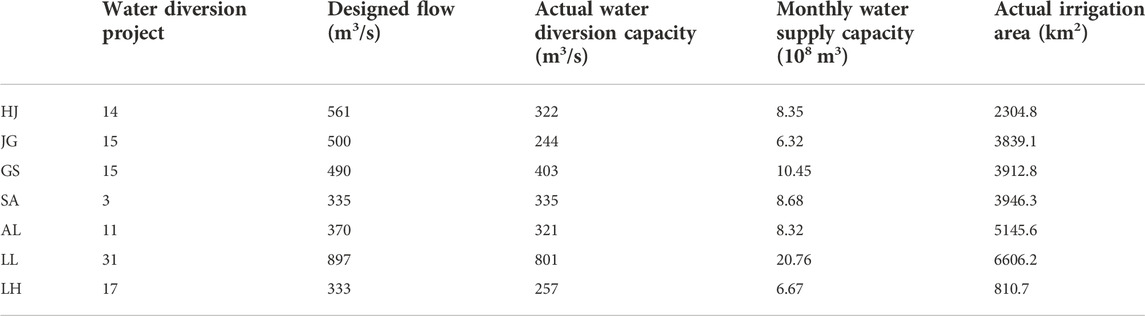
TABLE 5. Water diversion and water lifting projects in the lower Yellow River.
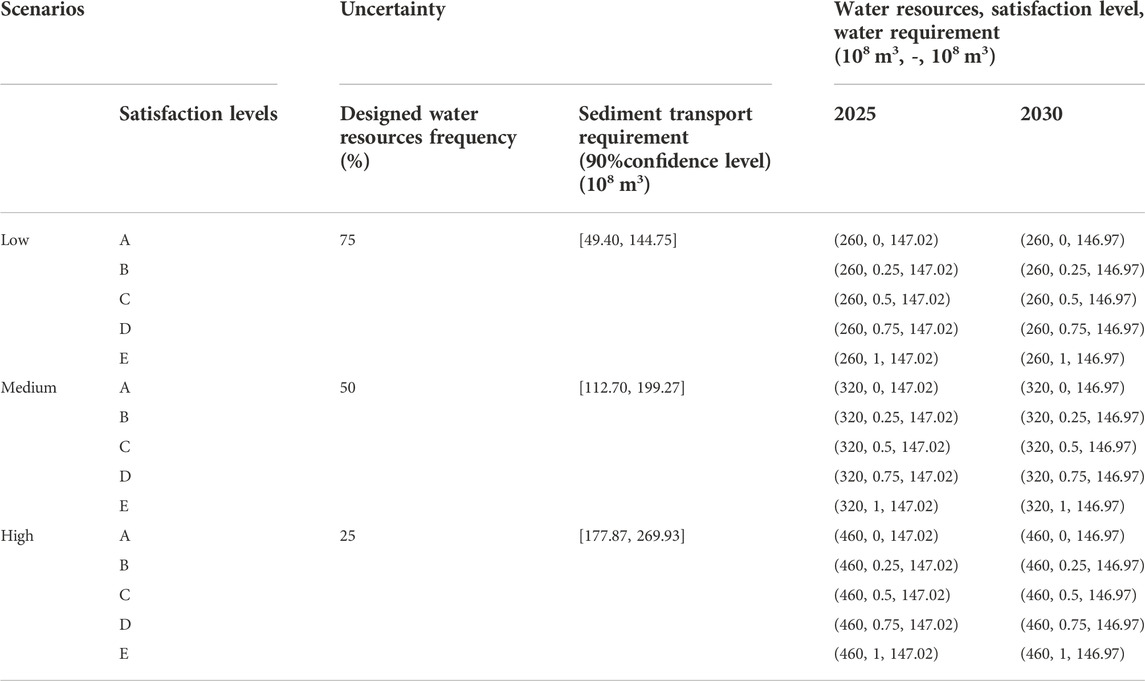
TABLE 6. Proposed plans.
The overall water shortage rate trend of the 15 scenarios in the 2025 forecast year in the lower Yellow River basin is shown in Figure 3. It can be seen from the figure that when the satisfaction degree of ecological sediment transport increases, the water shortage rate of water outside the river channel increases. In the low and medium scenarios, only when the satisfaction degree is 0 and 0.25, can it be ensured that there is no shortage of water outside the river, while in the high scenario, the water demand outside the river can be fully satisfied.
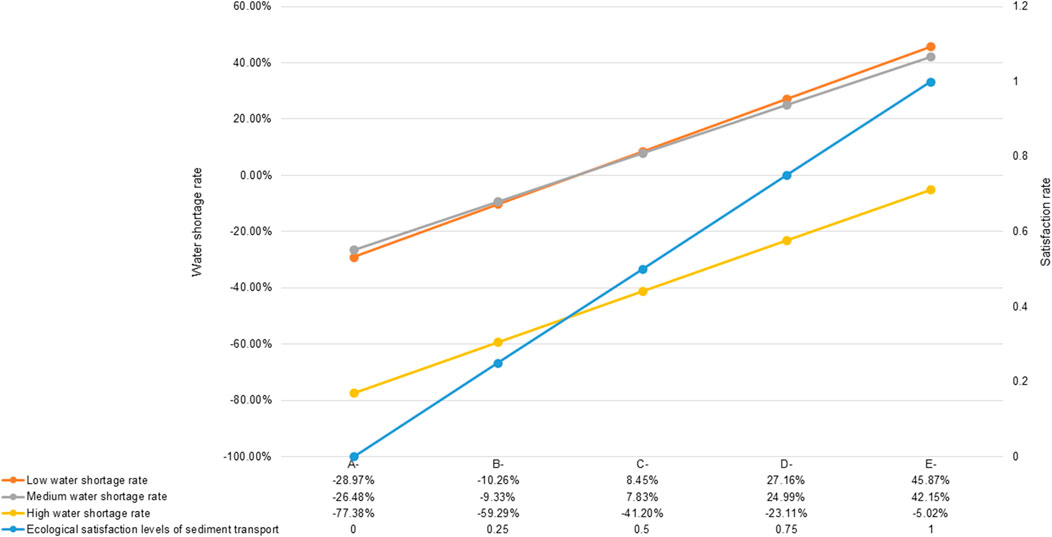
FIGURE 3. Changes in satisfaction and water shortage rate under different scenarios (2025)
The overall water shortage rate trend of the 15 scenarios in the 2030 forecast year in the lower Yellow River basin is shown in Figure 4. It can be seen from the figure that the overall trend is the same as in 2025, but compared to 2025, the water shortage rate under the same sediment transport satisfaction rate drops slightly.
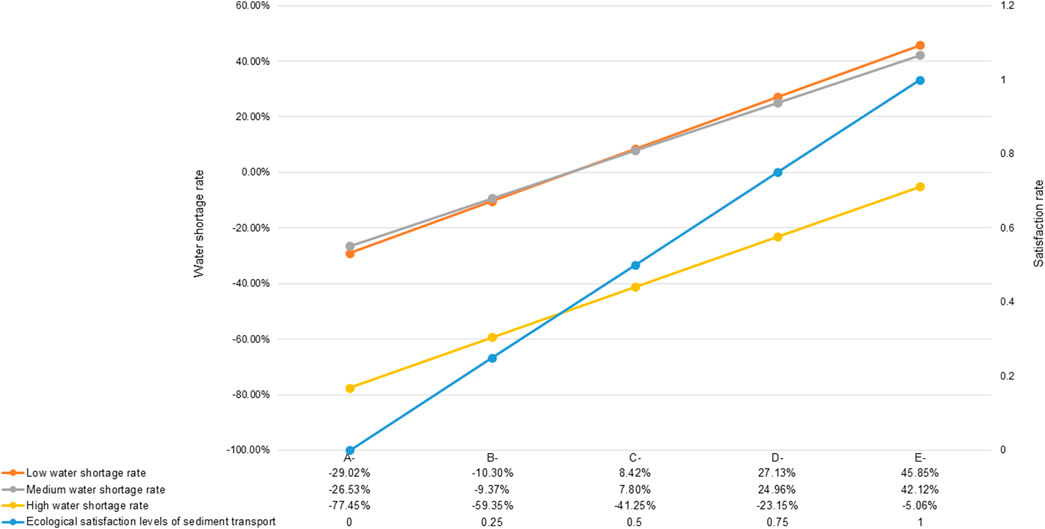
FIGURE 4. Changes in satisfaction and water shortage rate under different scenarios (2030)
According to the model, the feasible solutions under different water shortage rates and different satisfaction levels are as follows:
When the water shortage rate for water outside the river is less than 30%, only two of the 2025 and 2030 plans cannot meet the requirements, namely, 2025-low -E and 2025-medium-E, and 2030-low-E and 2030-medium-E.
When the water shortage rate for water outside the river is less than 20%, four of the 2025 and 2030 plans cannot meet the requirements, namely, 2025-low-D, 2025-medium-D, 2025-low-E, and 2025-medium-E, and 2030-low-D, 2030-medium-D, 2030-low-E, and 2030-medium-E.
When the water shortage rate for water outside the river is less than 10%, four of the 2025 and 2030 plans cannot meet the requirements, namely, 2025-low-D, 2025-medium-D, 2025-low-E, and 2025-medium-E, and 2030-low-D, 2030-medium-D, 2030-low-E, and 2030-medium -E.
It can be seen from the above that the water resources in the lower Yellow River face a great shortage. In dry years and normal years, the average water demand for sediment transport in flood seasons cannot meet the demand for water outside the river and within the river.
Therefore, we selected suitable plans for different satisfaction levels of years and different water resources, according to the requirements of wet years, normal years, and dry years. In the wet year, the plans with a satisfaction degree of one were selected, that is, 2025-high-D and 2030-high-D. In the normal years, the plans with a satisfaction degree greater than or equal to 0.5 and the water shortage rate of less than 10% were selected, that is, 2025-medium-C and 2030-medium-C. In the dry years, the plans with a satisfaction degree greater than or equal to 0.5 and the water shortage rate of less than 10% were selected, that is, 2025-low-C and 2030-low-C.
The results of the ecological footprint-based water distribution scenarios of the above six scenarios were analyzed. The result is shown in Figure 5 with 5(a) to 5(f) represents 6 selected scenarios respectively. In 2025, the water shortage rate under the suitable scenarios of dry year, normal year, and wet year is 8.45%, 7.83%, and 0%, respectively. In 2030, the water shortage rate under the suitable scenarios of dry year, normal year, and wet year is 8.42%, 7.80%, and 0%, respectively.
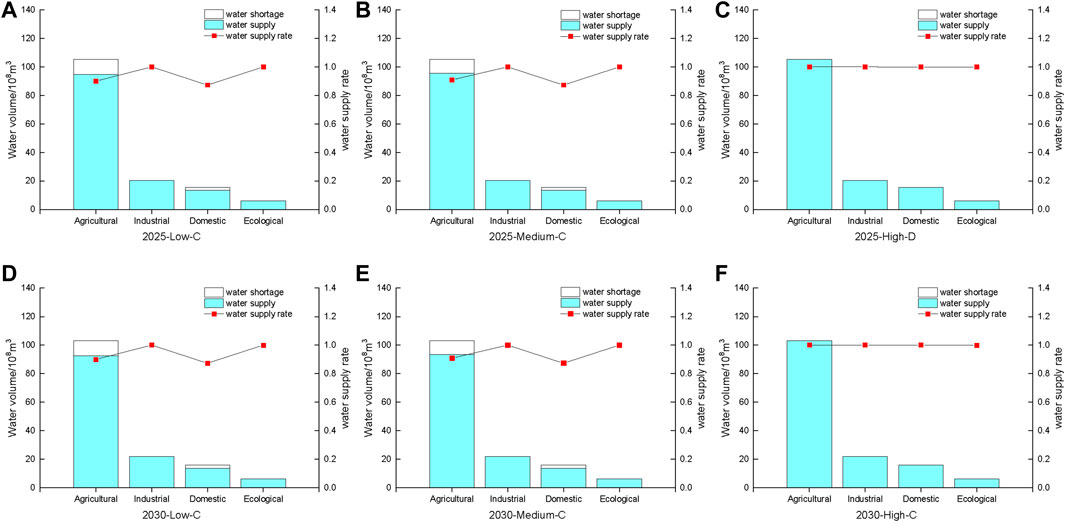
FIGURE 5. Water resource allocation of six suitable scenarios [(A–F) represent 6 selected scenarios respectively].
Within the same year, there is a small difference in the water shortage rate of the water resources allocated outside the river in a normal year and a dry year in 2025. That is, the total amount of water resources in normal years is more than that in dry years, but the amount of water used for sediment transport in normal years also increases. This is due to the fact that with the increase in the inflow of water, the sediment load increases (Kong et al., 2015), and the amount of water required for sediment transport increases. Therefore, although the total amount of water resources in a normal year increases, under the same satisfaction degree of sediment transport, the distribution of water resources outside the river does not change significantly. In a wet year, although the water demand for sediment transport increases, the efficiency of transporting sediment may increase due to the large amount of inflow. Therefore, even if the satisfaction of water for sediment transport increases (from 0.5 to 1), the water resources allocated outside the river course will also increase significantly, which can fully meet all water demand outside the river course.
Although existing dams and reservoirs play a key role in trapping sediments in the Yellow River, the ability will decline in the future (Wang et al., 2016), slowing down the erosion of the Loess Plateau which causes larger sediment load is the source management method to control water demand for sediment transport.
Table 7 and Figures 6–12 show the changes in four water users outside the river from seven sections in the lower Yellow River under the six scenarios, respectively and (a) to (f) represent 6 selected scenarios.

TABLE 7. Water supply rate of six suitable scenarios in seven sections.
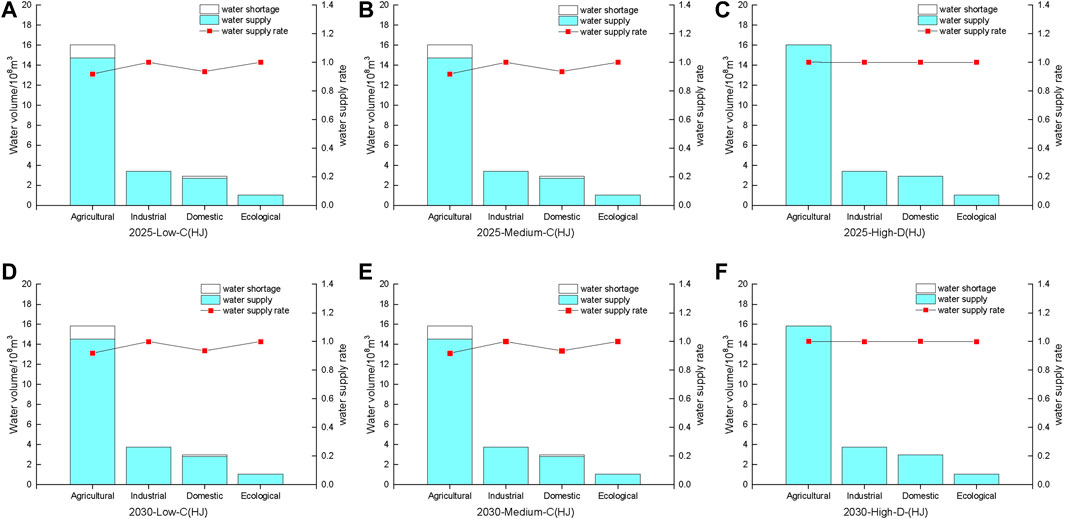
FIGURE 6. Distribution of water resources for six suitable scenarios in Huayuankou-Jiahetan section [(A–F) represent 6 selected scenarios respectively].
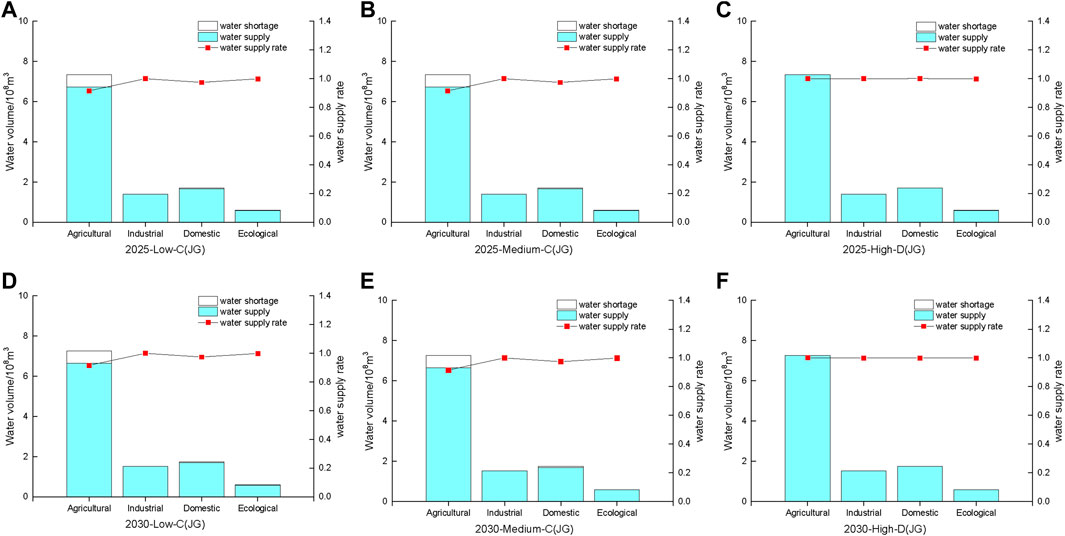
FIGURE 7. Distribution of water resources for six suitable scenarios in Jiahetan-Gaocun section [(A–F) represent 6 selected scenarios respectively].
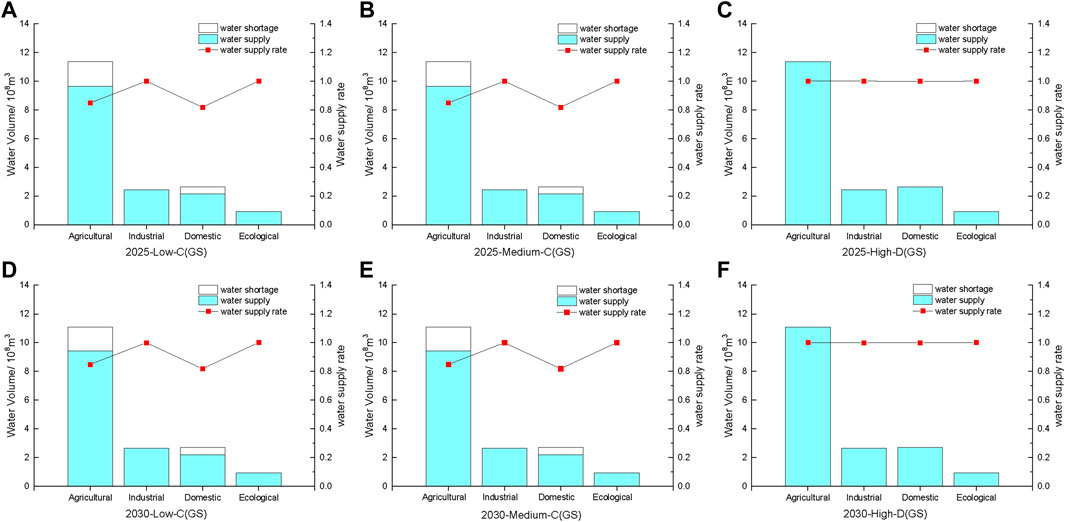
FIGURE 8. Distribution of water resources for six suitable scenarios in Gaocun-Sunkou section [(A–F) represent 6 selected scenarios respectively].
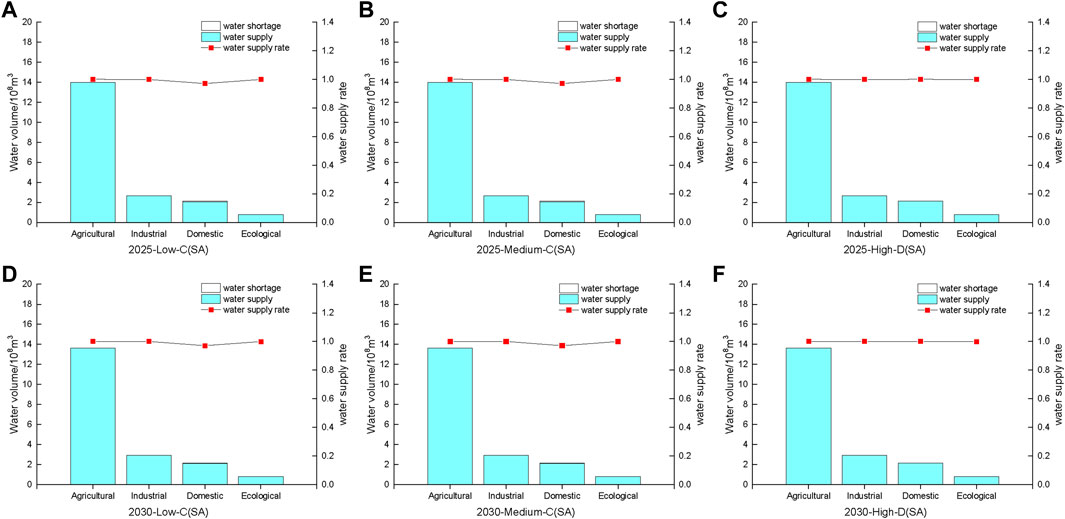
FIGURE 9. Distribution of water resources for six suitable scenarios in Sunkou-Aishan section [(A–F) represent 6 selected scenarios respectively].
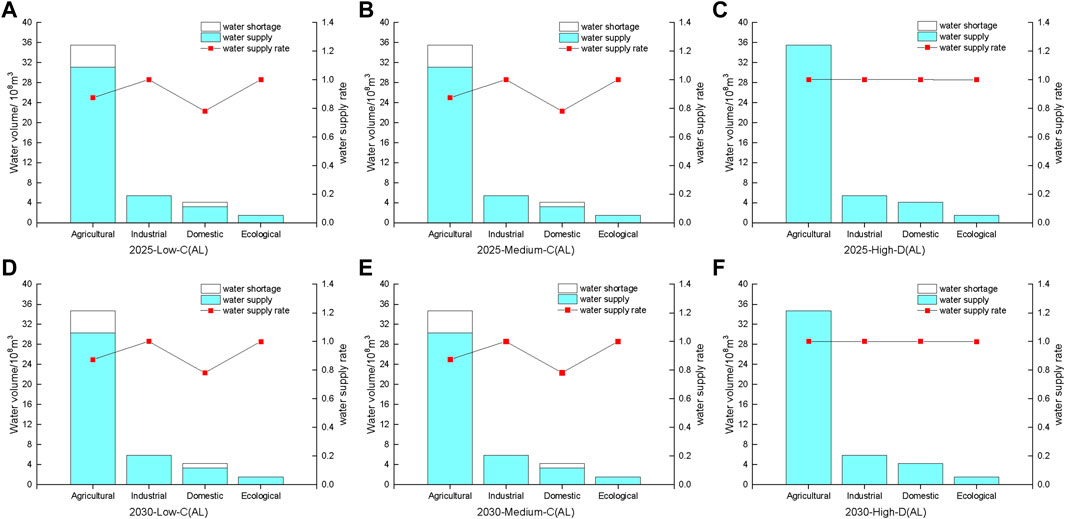
FIGURE 10. Distribution of water resources for six suitable scenarios in Aishan-Luokou section [(A–F) represent 6 selected scenarios respectively].
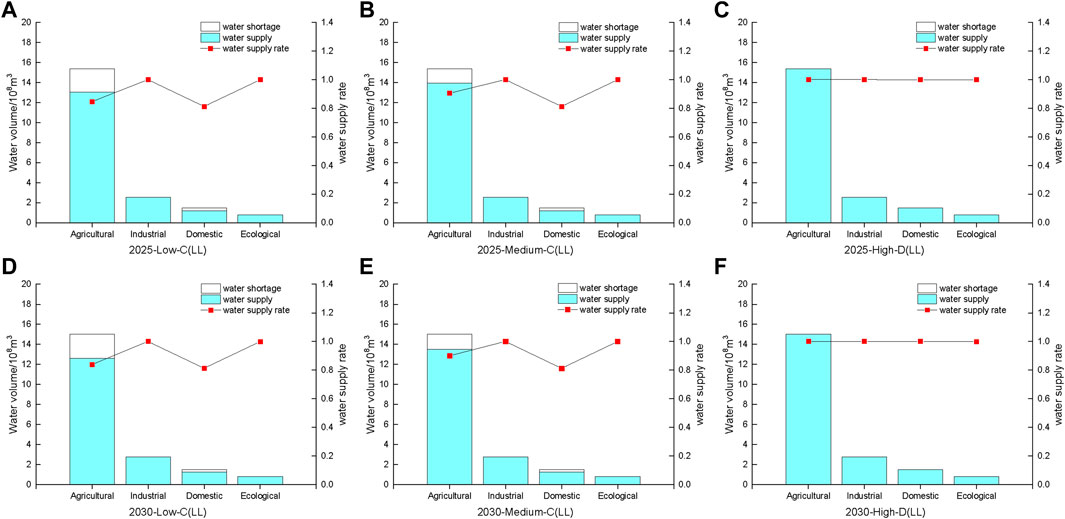
FIGURE 11. Distribution of water resources for six suitable scenarios in Luokou-Lijin section [(A–F) represent 6 selected scenarios respectively].
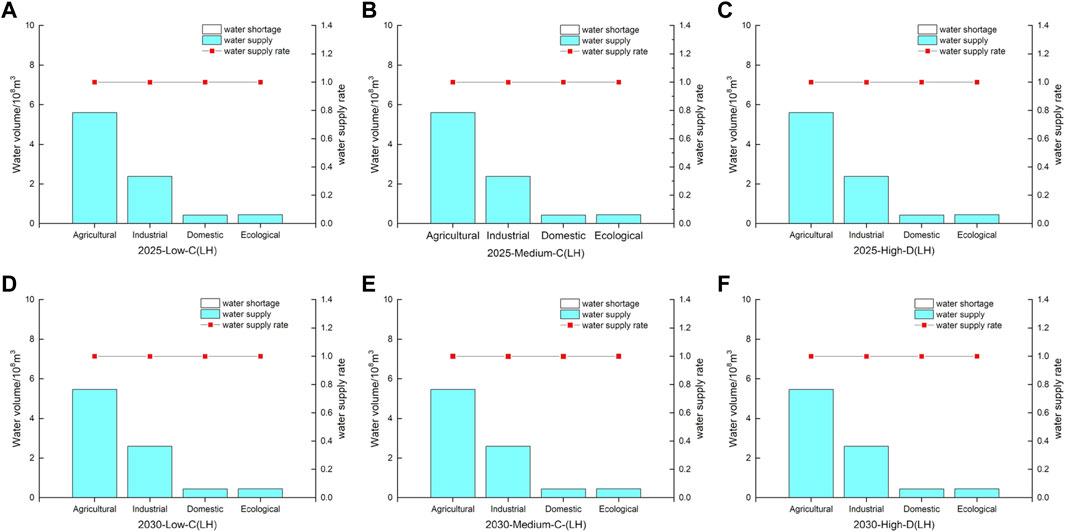
FIGURE 12. Distribution of water resources for six suitable scenarios in Lijin-Hekou section [(A–F) represent 6 selected scenarios respectively].
Figure 13 shows the overall water supply rate in every region in 6 scenarios. It can be concluded from the above that on the whole scale, cities in GS and AL sections suffer more from lower water supply rate. According to studies of Gong et al. (2020), Puyang in GS section, Dezhou and Liaocheng in AL section performed poorly in efficiency of water utilization, which may cause larger water demand. Moreover, as shown in Figure 2, GS and AL sections are in the lower reaches of the main tributaries of the Yellow River (Wenyan Canal and Dawen River), restricting upper cities’ water intake from these tributaries may supplement main stream water and improve the water supply rate.
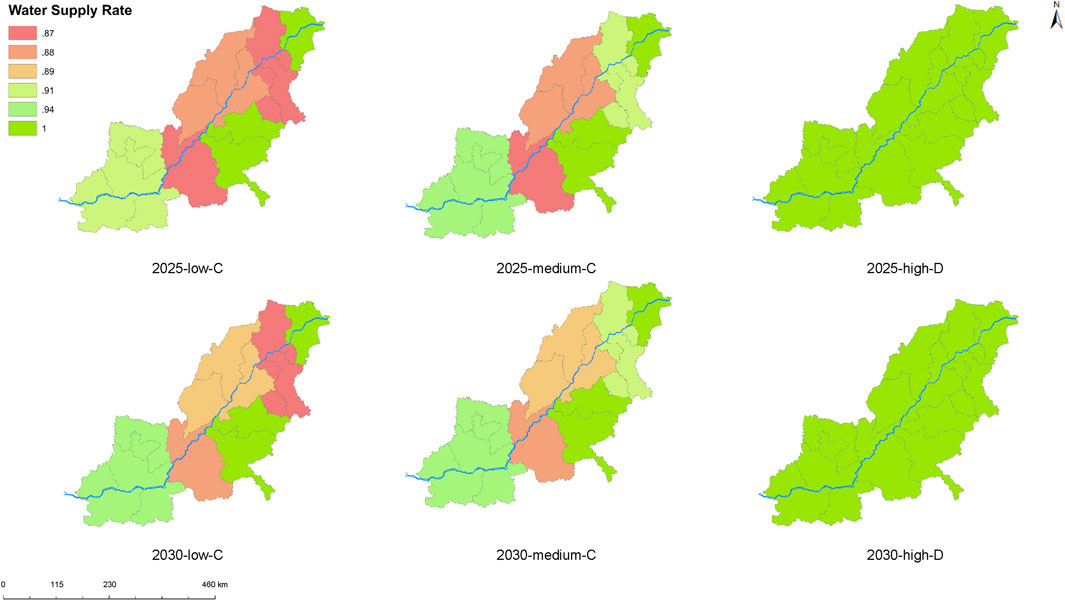
FIGURE 13. Overall water supply rate in study area in six scenarios.
From the perspective of different industries, ecological, and industrial water supply rates of the sections other than SA and LH are better than those of domestic and agricultural water supply rates, which indicates that the ecological footprint of domestic and agricultural water in these sections is greater than that of ecological and industrial water. Therefore, these sections should focus on improving the efficiency of domestic water and agricultural water or making industrial adjustments to reduce the production of ecological footprint. In the SA section, the water supply rate of ecology, industry, and agriculture in this area is better than that of domestic use, which reflects the larger ecological footprint generated by domestic water in the section. Therefore, this section should focus on improving the efficiency of domestic water. In the LH section, under the water demand forecast scenarios in 2025 and 2030, the water supply rate of each department in the dry year and normal year also reached 1.0.
Analyzing the above results, among the sections, the river sections with the largest water supply rate are the LH section and the SA section, which are close to 1. The river sections with the smallest water supply rate are the GS section and the LL section, which are 0.87; that is, the GS section and the LL section have a relatively large ecological footprint. Among industries, the water supply rate of agricultural and domestic water is lower than that of ecological and industrial water. This reflects that the ecological footprint generated by agricultural water and domestic water in the lower Yellow River is larger. Measures should be taken to improve the efficiency of agricultural and domestic water utilization. Among the years, there is a significant conflict between the water demand for sediment transport outside the river in normal and dry years.
Since water use priorities vary from region to region, there are some studies that also set priorities between both cities and types of water utilization (Li et al., 2021). However, when prioritizing using analytical hierarchy process (AHP) or other methods (Wang et al., 2003), there is still the problem of subjectivity and possibly insufficient rationality in the water allocation.
The result of the allocation plan is similar to Zhang and Oki (2021) based on Nash–Harsanyi bargaining game theory. Since the concept of ecological footprint of water resources applied in this paper innovatively includes soil water as one of the indicators of water resources carrying capacity (Li et al., 2020), the ecological footprint of water resources in agriculture, which is one of the main water uses in the lower reaches of the Yellow River, can be considered more objectively, and the ecological footprint of water resources in the lower reaches of the Yellow River can be assessed more comprehensively. However, this study only focuses on the water resources allocation in the lower reaches of the Yellow River, and there may be a need for more in-depth studies in the basin as a whole in the future.
The suggestions for normal and dry years are as follows:
1) Broaden sources of income: increase the amount of water resources, including inter-annual reservoir regulation of water resources; introduce external water resources, such as the South-to-North Water Diversion and seawater desalination.
2) Reduce expenditure: since the main water demand for water outside the lower Yellow River is agricultural water, water-saving irrigation should be conducted to improve the utilization efficiency of water resources. Furthermore, the efficiency of sediment transport can be improved since the main water used in the river is for sediment transport. Water conservancy projects need to be fully utilized, such as the Xiaolangdi Reservoir for water and sediment regulation. In addition, more stringent policies and laws and regulatory regimes may be needed.
Based on the evaluation results of ecological footprint and the results of water demand prediction, a multi-objective allocation model of water resources in the lower Yellow River was constructed and solved with GAMS software. The model results are shown as follows:
1) The shortage of water resources in the lower Yellow River is related to the amount of water resources and the water demand for sediment transport in the year. When there is a wet year, the shortage of water resources is significantly reduced, but there is no significant difference between a dry year and a normal year.
2) Water shortages in different areas of the lower Yellow River are related to the ecological footprints of different users in the area. The rivers with the largest shortages are GS and AL sections, the rivers with the smallest shortages are the LH and SA sections. Restricting upper cities’ water intake from tributaries of the Yellow River may supplement main stream water and improve the water supply ability.
The model explores the relationship among incoming water and sediment conditions, the ecological footprint produced by water utilizations, and the distribution of water resources, which can provide decision makers with different allocation scenarios, comprehensively considering ecological, safety, and social benefits to achieve the goal of optimal system benefits.
The original contributions presented in the study are included in the article/supplementary material, further inquiries can be directed to the corresponding authors.
All authors contributed to the study conception and design. Material preparation, data collection and analysis were performed by SZ and HL. The first draft of the manuscript was written by SZ and HL; CL, YY, XW, and QL commented on previous versions of the manuscript. All authors read and approved the final manuscript.
This study was funded by the Joint Funds of the National Natural Science Foundation of China (U2243236) and the National Science Foundation for Distinguished Young Scholars (52025092).
The authors declare that the research was conducted in the absence of any commercial or financial relationships that could be construed as a potential conflict of interest.
All claims expressed in this article are solely those of the authors and do not necessarily represent those of their affiliated organizations, or those of the publisher, the editors and the reviewers. Any product that may be evaluated in this article, or claim that may be made by its manufacturer, is not guaranteed or endorsed by the publisher.
Chen, N., Li, Y., and Xu, C. (2006). Optimal deployment of water resources based on multi-objective genetic algorithm. J. Hydraulic Eng. 9 (03), 308–313. doi:10.3321/j.issn:0559-9350.2006.03.009
Dadmand, F., Naji-Azimi, Z., Motahari Farimani, N., and Davary, K. (2020). Sustainable allocation of water resources in water-scarcity conditions using robust fuzzy stochastic programming. J. Clean. Prod. 276, 123812. doi:10.1016/j.jclepro.2020.123812
Dai, D., Sun, M., Xu, X., and Lei, K. (2019). Assessment of the water resource carrying capacity based on the ecological footprint: A case study in zhangjiakou city, north China. Environ. Sci. Pollut. Res. 26 (11), 11000–11011. doi:10.1007/s11356-019-04414-9
Divakar, L., Babel, M. S., Perret, S. R., and Gupta, A. D. (2011). Optimal allocation of bulk water supplies to competing use sectors based on economic criterion – an application to the Chao Phraya River Basin, Thailand. J. Hydrol. X. 401 (1), 22–35. doi:10.1016/j.jhydrol.2011.02.003
Fan, X. (2005). “Study on the principle of water resources ecological footprint and application inJiangsu province,” (China: Hohai University). Master Dissertation.
Gong, C., Xu, C., and Zhang, X. (2020). Spatio-temporal evolution and influencing factors of water resources utilization efficiency of cities along the middle and lower reaches of the Yellow River. Sci. Geogr. Sin. 40 (11), 1930–1939. doi:10.13249/j.cnki.sgs.2020.11.018
Gov (2021). The state Council of the people's republic of China. Available at: http://www.gov.cn/zhengce/2021-10/08/content_5641438.html.
Guan, X., Dong, Z., Luo, Y., and Zhong, D. (2021). Multi-objective optimal allocation of river basin water resources under full probability scenarios considering wet–dry encounters: A case study of Yellow River basin. Int. J. Environ. Res. Public Health 18, 11652. doi:10.3390/ijerph182111652
Hoekstra, A. Y. (2008). Human appropriation of natural capital: A comparison of ecological footprint and water footprint analysis. Ecol. Econ. 68 (7), 1963–1974. doi:10.1016/j.ecolecon.2008.06.021
Huang, L., Zhang, W., Jiang, C., and Fan, X. (2008). Ecological footprint method in water resources assessment. Acta Ecol. Sin. 28 (03), 1279–1286. doi:10.3321/j.issn:1000-0933.2008.03.044
Kazemi, M., Bozorg-Haddad, O., Fallah-Mehdipour, E., and Loáiciga, H. A. (2020). Inter-basin hydropolitics for optimal water resources allocation. Environ. Monit. Assess. 192 (7), 478. doi:10.1007/s10661-020-08439-3
Kong, D., Miao, C., Borthwick, A. G. L., Duan, Q., Liu, H., Sun, Q., et al. (2015). Evolution of the Yellow River Delta and its relationship with runoff and sediment load from 1983 to 2011. J. Hydrol. X. 157-167, 157–167. doi:10.1016/j.jhydrol.2014.09.038
Li, C., Cai, Y., and Qian, J. (2018). A multi-stage fuzzy stochastic programming method for water resources management with the consideration of ecological water demand. Ecol. Indic. 95, 930–938. doi:10.1016/j.ecolind.2018.07.029
Li, H., Zhao, F., Li, C., Yi, Y., Bu, J., Wang, X., et al. (2020). An improved ecological footprint method for water resources utilization assessment in the cities. Water (Basel) 12 (2), 503. doi:10.3390/w12020503
Li, J., Cui, L., Dou, M., and Ali, A. (2021). Water resources allocation model based on ecological priority in the arid region. Environ. Res. 199, 111201. doi:10.1016/j.envres.2021.111201
Rees, W. E. (1992). Ecological footprints and appropriated carrying capacity: What urban economics leaves out. Environ. Urban. 4 (2), 121–130. doi:10.1177/095624789200400212
Shao, W., Yang, D., Hu, H., and Sanbongi, K. (2009). Water resources allocation considering the water use flexible limit to water shortage—a case study in the Yellow River basin of China. Water Resour. manage. 23 (5), 869–880. doi:10.1007/s11269-008-9304-2
Song, Y. (2008). “Study on optimal allocation of water resources based on the development benefit in the yinmahe drainage basin,” (Jilin: University of Jilin). Master Dissertation.
Stoeglehner, G., Edwards, P., Daniels, P., and Narodoslawsky, M. (2011). The water supply footprint (WSF): A strategic planning tool for sustainable regional and local water supplies. J. Clean. Prod. 19 (15), 1677–1686. doi:10.1016/j.jclepro.2011.05.020
Su, Y., Gao, W., Guan, D., and Su, W. (2018). Dynamic assessment and forecast of urban water ecological footprint based on exponential smoothing analysis. J. Clean. Prod. 195, 354–364. doi:10.1016/j.jclepro.2018.05.184
Wackernagel, M., and Rees, W. (1996). Ecological footprints for beginners: Our ecological footprint: Reducing human impact on the Earth. Washington, DC: Island Press/Center for Resource Economics. doi:10.5822/978-1-61091-491-8_45
Wang, H., Huang, J., Zhou, H., Deng, C., and Fang, C. (2020). Analysis of sustainable utilization of water resources based on the improved water resources ecological footprint model: A case study of hubei province, China. J. Environ. Manage. 262, 110331. doi:10.1016/j.jenvman.2020.110331
Wang, J., Zhang, J., and Dong, Z. (2003). Harmoniousness analysis of water resources allocation. J. Hohai Univ. Nat. Sci. 31 (6), 702–705. doi:10.3321/j.issn:1000-1980.2003.06.025
Wang, L. H., Fang, L. P., and Hipel, K. W. (2007). On achieving fairness in the allocation of scarce resources: Measurable principles and multiple objective optimization approaches. IEEE Syst. J. 1 (1), 17–28. doi:10.1109/JSYST.2007.900242
Wang, S., Yang, F., Xu, L., and Du, J. (2013). Multi-scale analysis of the water resources carrying capacity of the Liaohe Basin based on ecological footprints. J. Clean. Prod. 53, 158–166. doi:10.1016/j.jclepro.2013.03.052
Wang, S., Fu, B., Piao, S., Lu, Y., Ciais, P., Feng, X., et al. (2016). Reduced sediment transport in the Yellow River due to anthropogenic changes. Nat. Geosci. 9, 38–41. doi:10.1038/ngeo2602
Wang, Y., Huang, Q., and Liu, C. (2006). Research on real-time regulation-control for river basin water resources and its model. J. Hydraulic Eng. 9, 1122–1128. doi:10.3321/j.issn:0559-9350.2006.09.015
Yang, W. (2011). A multi-objective optimization approach to allocate environmental flows to the artificially restored wetlands of China's Yellow River Delta. Ecol. Modell. 222 (2), 261–267. doi:10.1016/j.ecolmodel.2010.08.024
Zhang, C. Y., and Oki, T. (2021). Optimal multi-sectoral water resources allocation based on economic evaluation considering the environmental flow requirements: A case study of Yellow River basin. Water 13 (16), 2253. doi:10.3390/w13162253
Zhang, Q., Xu, C., and Yang, T. (2009). Variability of water resource in the Yellow River basin of past 50 Years, China. Water Resour. manage. 23, 1157–1170. doi:10.1007/s11269-008-9320-2
Zhang, Z., Ma, H., Li, Q., Wang, X., and Feng, G. (2014). Agricultural planting structure optimization and agricultural water resources optimal allocation of Yellow River Irrigation Area in Shandong Province. Desalination Water Treat. 52 (13-15), 2750–2756. doi:10.1080/19443994.2013.819167
Keywords: the lower Yellow River, water resources management, water resources allocation, ecological footprint, sustainable development
Citation: Zhang S, Li H, Li C, Yi Y, Wang X and Liu Q (2023) Allocation of water resources in the lower Yellow river based on ecological footprint. Front. Earth Sci. 10:1018980. doi: 10.3389/feart.2022.1018980
Received: 14 August 2022; Accepted: 31 October 2022;
Published: 16 January 2023.
Edited by:
Weili Duan, Xinjiang Institute of Ecology and Geography (CAS), ChinaReviewed by:
Wei Sun, School of Geography and Planning, Sun Yat-Sen University, ChinaCopyright © 2023 Zhang, Li, Li, Yi, Wang and Liu. This is an open-access article distributed under the terms of the Creative Commons Attribution License (CC BY). The use, distribution or reproduction in other forums is permitted, provided the original author(s) and the copyright owner(s) are credited and that the original publication in this journal is cited, in accordance with accepted academic practice. No use, distribution or reproduction is permitted which does not comply with these terms.
*Correspondence: Chunhui Li, Y2h1bmh1aWxpQGJudS5lZHUuY24=; Yujun Yi, eWl5dWp1bkBibnUuZWR1LmNu
Disclaimer: All claims expressed in this article are solely those of the authors and do not necessarily represent those of their affiliated organizations, or those of the publisher, the editors and the reviewers. Any product that may be evaluated in this article or claim that may be made by its manufacturer is not guaranteed or endorsed by the publisher.
Research integrity at Frontiers
Learn more about the work of our research integrity team to safeguard the quality of each article we publish.