 Li Li
Li Li Guangyao Shi1,2
94% of researchers rate our articles as excellent or good
Learn more about the work of our research integrity team to safeguard the quality of each article we publish.
Find out more
ORIGINAL RESEARCH article
Front. Earth Sci., 11 January 2023
Sec. Structural Geology and Tectonics
Volume 10 - 2022 | https://doi.org/10.3389/feart.2022.1018561
This article is part of the Research TopicUnconventional Reservoir GeomechanicsView all 16 articles
Based on an analysis of core fractures and computed tomography scanning by X-ray under uniaxial compression tests with loading and unloading, this study investigated the three-dimensional evolution of fracture initiation and propagation in different heterogeneity conditions of low-permeability reservoirs. Reservoir heterogeneity affected the 3D dynamic development of fractures. With increasing loading value, fractures with strong heterogeneity in low-permeability reservoirs followed the development sequence from shallow to deep depth in the profile. When the fracture tip reached the incompetent layer, propagation stopped. Subsequently, when the deformation continued to increase, the fracture crossed the incompetent layer and initiated a new fracture at the front end. Therefore, the across-bedding and through-going macro fractures formed in conjugate sets or were Y-shaped, with roughly equal spacing. In the plane, the fractures initiated along the pre-existing bedding parallel fracture and further propagated into large fractures. Consequently, they formed a net-shaped fracture from the edge to the center, with a long development period. These fractures intersected to form a complex, interconnected, and high-fracture-density system in three dimensions. Under the same loading value, owing to uniform lithology, the formation of micro-fractures in the weak heterogeneity of low-permeability reservoirs is difficult. Furthermore, long shear fractures were only produced in a relatively short formation period with a low fracture density. In the plane, the fractures stepped in an en-énchelon and terminated with horse-tailing microfractures. Moreover, the strong heterogeneity of low-permeability reservoirs was more favorable for producing fractures. The fracture volume was 13.17% of the total sample volume compared to 0.67% in the weak-heterogeneity reservoir under the same loading compression. Furthermore, a better fracturing effect was achieved by fracturing along the direction >50° with the natural fracture and under the condition of small differential horizontal stresses.
The rocks in low permeability-tight reservoirs produce more fractures during deformation owing to their tight and brittle nature. Consequently, fractures play a crucial role in these reservoirs (Zeng and Xiao 1999; Zhou et al., 2006; Ding et al., 2015; Li et al., 2017). To exploit low-permeability tight reservoirs, hydraulic fracturing is frequently used to increase oil and gas production. The factors affecting the fracture effects include fracture attitude (strike and dip angle), size, and number, as well as aperture and its angle with maximum principal stress (Zeng, 2004; Jin et al., 2005; Gale et al., 2007). Therefore, a detailed understanding of static fractures is required to improve permeability without increasing the water cut of the oil well.
The formation and evolution of fractures include a large amount of information related to rock mechanics and determine the physical properties and oil-gas properties of low-permeability reservoirs (Germanovich et al., 1994; Wang et al., 2008; Li et al., 2019; Li et al., 2019; Zhang et al., 2020; Li et al., 2022). Rock strength, petrology, and tectonic stress influence the development of natural fractures in low-permeability reservoirs (Li et al., 2019; Li et al., 2022), and fracture density and opening directly controlled gas productivity. Microfractures with apertures less than 50 μm improve porosity and permeability in these reservoirs (Wang et al., 2008). However, owing to their small size, they are rarely identified using relevant logging and geophysical methods and their initiation and development remain unknown. Experimental results have demonstrated that when the load reaches one-third of the compressive strength, wing cracks start to propagate from the tip of the plexiglass preset crack and wrap the initial crack at a stable speed. The wing crack tip shows the largest propagation length and initially reaches 1 to 1.5 times the crack radius (Germanovich et al., 1994). Experiments on cement sand specimens showed that the propagation direction of the main crack was related to the mechanical properties of the crack and was affected by the distribution of cracks, pores, and microcracks (Chen et al., 2005). When the crack is perpendicular to the load direction, the main crack primarily extends along the edge of the crack.
In the plane perpendicular to the loading direction, cracks in tight sandstone extend along the fracture axis or increase the fracture diameter. Cracks easily lead to the penetration of pores during loading (Li et al., 2019). CT imaging by X-ray can be used to reveal the pore structure and relative density inside the core rock. Therefore, the three-dimensional evolution characteristics of fractures can be observed under different loading (Ketcham and Carlson 2001; Cao, 2005; Renard et al., 2009; Sun et al., 2020; Zhang et al., 2020). Furthermore, the analysis of dynamic fracture evolution of tight sandstone under uniaxial compression showed that fractures underwent compaction, linear elastic behavior, and non-linear and residual deformation (Zhang et al., 2020). In addition, the mineral composition and mesostructure play a significant role in the mechanical properties, fracture pattern, and crack morphology. Secondary cracks propagate parallel to the direction of axial stress. The above-mentioned fracture development studies were mostly based on CT scans of sandstone intermediate zoning layers and tight sandstone. However, studies on fracture development in low-permeability reservoirs and the influence of reservoir heterogeneity on the fracture mechanism are scarce.
Low-permeability-tight reservoir fractures have the characteristics of complex distribution and high heterogeneity, which leads to poor physical properties of the reservoir, large differences in oil and gas well productivity, and low recovery. The C41 fault block is located in the Liangjialou oil field, whose main oil and gas producing intervals include the Fourth Member of the Shahejie Formation (E2s4). Previous research analyzed the present ground stress, fracture characteristics, and development period (Liu et al., 2003; Shi et al., 2021). The results showed a maximum horizontal principal stress of 52–74 MPa trending toward near east-west within the fault block. The minimal horizontal principal stress was 41–52 MPa in the south-north direction (Liu et al., 2003). The Upper E2s4 included shear fractures with small apertures and low filling in the C41 block that developed during the periods of E2s3-2 and Late E3d deposition (Shi et al., 2021). However, these previous studies lacked information on detailed fracture evolution and mechanisms. To solve these problems and better reveal the distribution of cracks, research on the causes and development of cracks is essential. Therefore, the present study investigated the development of fractures in a low-permeability reservoir. The research method mainly included two parts: observation of core fractures and physical simulation of the three-dimensional evolution of fractures in real time. For the latter, first, a MicroXCT-510 scanner was used to scan the core sample in real-time under uniaxial compression conditions. Subsequently, based on the CT images and data obtained from the test, the fracture initiation and propagation process in was analyzed three dimensions. Finally, the differential evolution mechanisms of fractures in different heterogeneous reservoirs were explored and the relationships of fractures with oil and gas were analyzed to provide a reliable geological basis for improving the development effects.
The study area was located in the southern Dongying Sag of the Jiyang Depression in Bohai Bay Basin (Figure 1A). The detailed study area was fault block C41, in the southern portion of the Liangjialou oilfield (Figure 1B). The Cenozoic strata of the Liangjialou oilfield comprise the Paleocene-Eocene Shahejie Formation (E1-2s), the Oligocene Dongying Formation (E3d), the Miocene Guantao Formation (N1g), and the Pliocene Minghuazhen Formation (N2m), of which the Shahejie Formation was further subdivided into four Members. The main reservoir was E2s4u. E2s4u is a ladder-shaped structure composed of a series of near east-west trending faults (Figure 1B). Most of the faults dipped to the north, and the oil fault blocks controlled by them showed a gradually decreasing oil ladder from south to north. Controlled by two main NEE trending faults, the C41 fault block was high in the southwest and low in the northeast. The kick-off point of E2s4u studied here was mainly composed of fine sandstone and siltstone, in which the strata dip and dip angle changed a lot (Figure 1B).
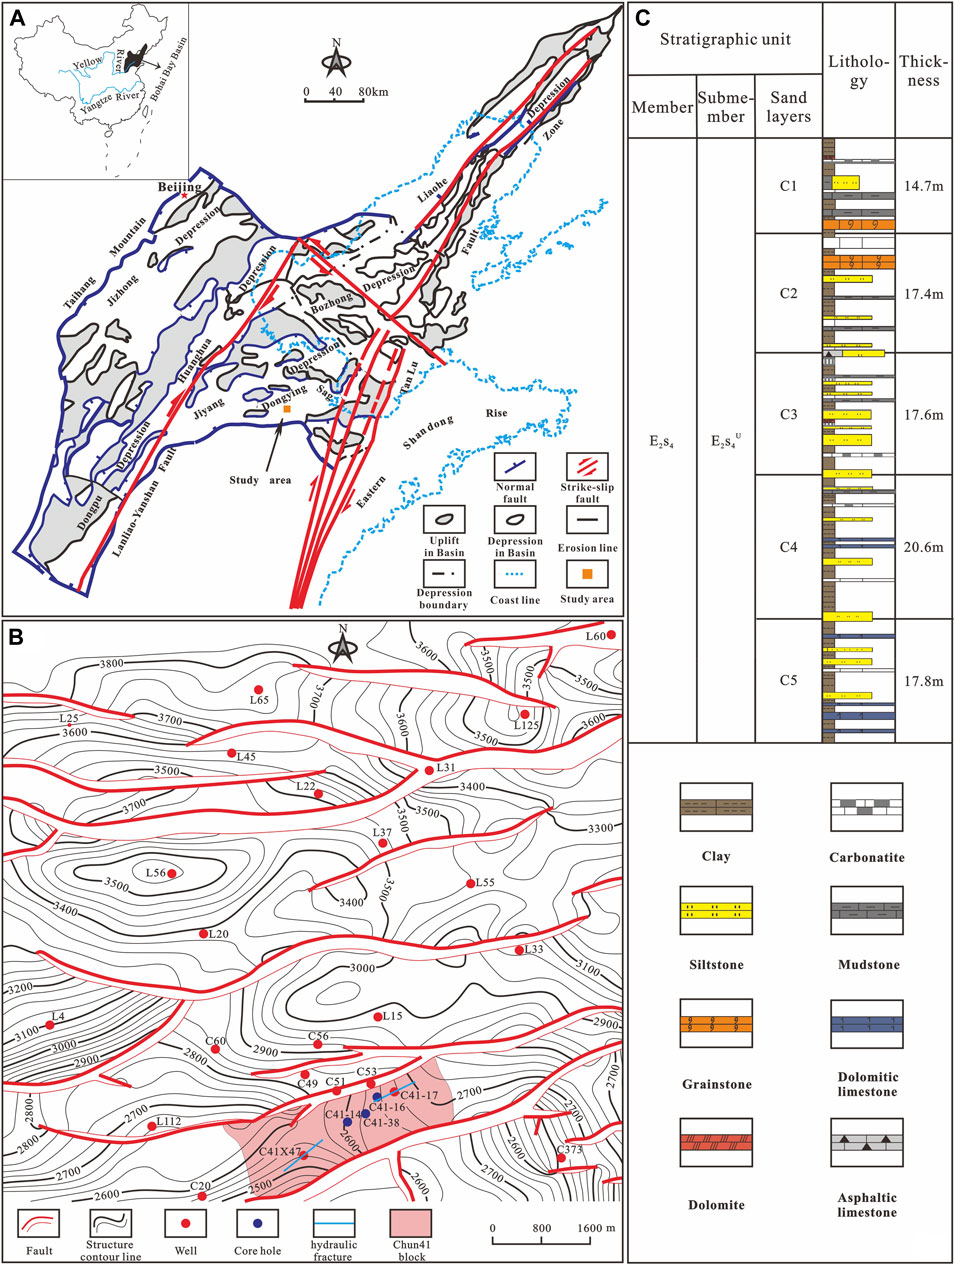
FIGURE 1. Basinal location, geological setting, well locations and strata of the study area. (A) Location of the Bohai Bay Basin and the study area. (B) Well locations and the top surface structure map of the Upper Fourth Member of Shahejie Formation (length of the hydraulic fractures exaggerated). (C) Stratigraphic histogram.
When the E2s4u was deposited 43-40 Ma, the study area was a shallow lake with an underwater low uplift. The lake water transgression and regression affected the reservoir formation and type. Terrigenous debris transported by waves and lake currents was deposited at the site of energy reduction on the shoreline, resulting in a typical shore-shallow lake-beach bar. As the overlying sediment thickened, the pressure also increased and minerals filling the pores of the sediment cemented the dispersed grains together. Thus, diagenesis such as compaction and cementation reduced the primary pores in the sandstone, like the thinning of a piece of bread in a vertical press, rendering it a low-porosity and low-permeability reservoir. The thickness of the well sections of E2s4u range from 61 to 91 m, with an average of 81 m. E2s4u is divided into five sand layers (C1–C5) (Figure 1C), with a thin reservoir thickness and an average sand body thickness of 26.8 m. The lithology of the sand body is mainly feldspathic siltstone, fine sandstone, dolomitic siltstone, argillaceous limestone, and argillaceous dolomite (Figure 1C). The sandstone consists of 40–45% quartz, 35–37% feldspar, and 20–24% rock debris. It has a low composition and structure maturity. The cementation between grains is mainly contact-pore type, with a few pore types. The sorting coefficient is 1.4–1.9. The roundness is subangular. The median and average particle sizes are 0.05–1 mm and 0.09 mm, respectively. The physical properties vary considerably between layers. The total average permeability is 9.2×10⁻³ μm2, ranging between 14.2×10⁻³ and 5.37×10⁻³ μm2. In addition, the average carbonate content in C1–C4 is 17, 23.11, 15.96, and 78.3%, respectively. The permeability difference and dart coefficient of E2s4u are 76 and 1.2, respectively; thus, the E2s4u reservoir is low-permeability with strong heterogeneity (Li, 1997). Moreover, this reservoir is widely distributed and shows great planar connectivity; however, the planar heterogeneity is severe and the areas of high permeability show zonal division.
E2S4 in the C41 fault block contains three core holes (Figure 1B). The attitude, type, width, opening, and filling materials of fractures can be obtained by core observation. These characteristics are shown in Table 1. The fracture attitude was measured in two steps: first, the actual attitude of the E2S4u strata was measured and calculated according to the structural contour map for E2S4u. The results showed a 90°C dip with a dip angle of 6°–10° in the three core holes and gently inclined to near-horizontal strata dipping east. Second, the real attitude of the fracture in E2S4 was obtained. The bedding surface was found and the core was arranged according to the dip of the core to the east and a dip angle of 6°–10° so that the true occurrence of fractures could be directly measured. The fracture characteristics of the three core holes are as follows.
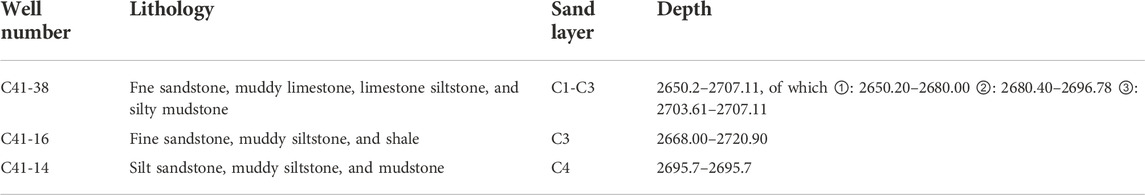
TABLE 1. Basic characteristics of the observation sections.
The core hole included three sections: ①, ②, and ③ (Table 1). The fracture characteristics are shown in Figures 2A–J. Most (88%) of the fractures were shear fractures; the remaining were tensile joints. The high-angle (Figure 2A) and gentle-angle fractures (Figure 2D) were small, while the vertical fracture showed significant development (Figures 2B–C, E–J).
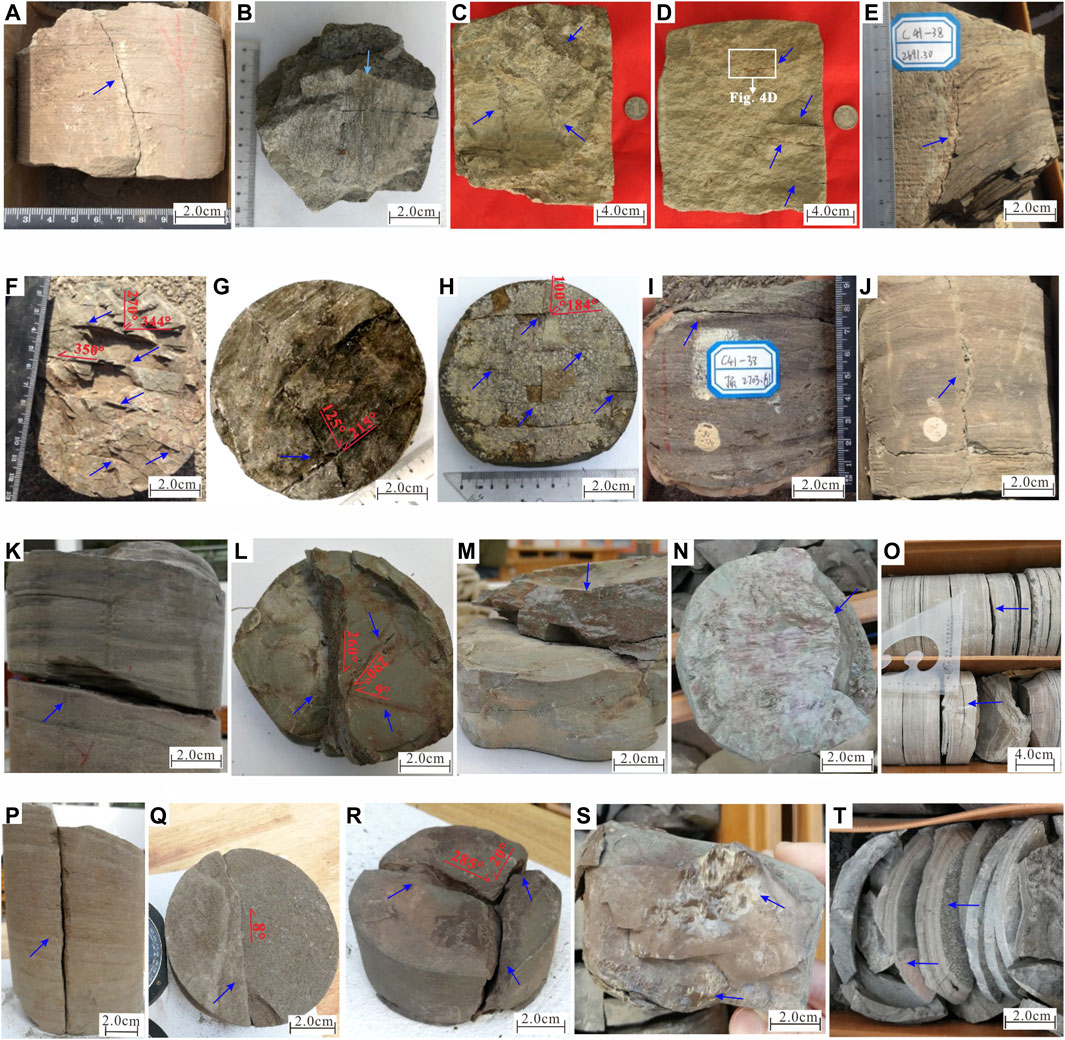
FIGURE 2. Core fracture characteristics of E2s4u in the C41 fault block in the Jiyang Depression of Bohai Bay Basin. From left to right are (A–T): (A) high angle-shear fractures with no fillings, Well C41-38, 2650.2 m (arrow: drilling direction). (B) Vertical shear fractures, with scratches and calcite fibers on the fracture surfaces, Well C41-38, 2652.815 m. (C) Many groups of high-angle fractures and filling with mud and oil, well C41-38, 2680.00 m, coin diameter 2.0 cm. (D) Five groups, low-angle shear fractures, with the development of cross-bedding in the upper part with oil filling, well C41-38, 2680 m. (E) Bedding fractures in silt mudstone and a high-angle shear fracture along the junction of silt and silt mudstone, without fillings, Well C41-38, 2691.30 m. (F) Sub-parallel (lower part) and conjugate (upper part) shear fractures (top view), top in 2684.10 m. (G) High-angle shear fractures (top view) filled with oil, Well C41-38, top in 2665.41 m. (H) Grid-shaped shear fracture system (top view), no filling, Well C41-38, top in 2691.21 m. (I) Bedding and low-angle shear fractures without filling, Well C41-38, 2703.61 m. (J) Vertical tension fractures without filling, Well C41-38, 2707.11 m. (K) Low-angle opening shear fracture, Well C41-16, 2688.74–2688.81 m. (L) Vertical shear fractures (top view) with iron filling in the restricted fractures, Well C41-16, 2691.77 m. (M) Vertical shear fractures showing the development of a friction mirror on the fracture surface, Well C41-16, 2691.81 m. (N) Scratches on bedding-parallel fractures, Well C41-16, 2690.94 m. (O) Diagenetic and bedding shear fractures without filling, Well C41-16, 2669.77 m. The acute angle of the right triangular ruler indicates the direction of drilling. (P) Long vertical shear fracture without filling, Well C41-14, 2705.05–2705.26 m. (Q) Vertical shear fractures (top view) without filling, Well C41-14, 2702.60 m. (R) High-angle shear fractures without filling, Well C41-14, 2778.49–2778.53 m. (S) Friction mirror in a vertical shear fracture, Well C41-14, 2778.49 m. (T) Diagenetic fractures without filling, Well C41-14, 2702.78 m. The right indicates the drilling direction.
Some high-angle fractures developed with small fracture widths and no filling materials (Figure 2A); however, others were filled with oil (Figure 2C). Scratches were observed on the vertical cracks surface, along which fibrous calcite crystals developed (Figure 2B). Most of the vertical cracks had no filling materials, while some fractures showed oil filling (Figure 2G). Furthermore, the low-angle fractures often had large crack widths filled with calcite. The observation of oil filling in low-angle, high-angle, and vertical fractures indicated oil and gas migration or accumulation along the fracture system. Therefore, fractures are the channels or spaces for oil and gas migration in low-permeability reservoirs.
Some shear fractures showed fracture groups with fracture sets that were parallel to each other (Figure 2F) or X conjugate sets (Figures 2G,H). The tensile fractures were mostly vertical with a zig-zag shape in profile (Figure 2J). Generally, the fracture length was 0.4–18 cm and fracture width was 0.01–1.5 cm. Moreover, most of the tensile fractures had no filling, although occasional mud filling was observed.
Apart from the fracture cut across the bedding surface, several bed-parallel fractures were observed in the core (Figure 2E), most of which developed along the bedding surface. Some were diagenetic or contracted fractures, while others resulted from the structural replacement of the bedding surface under tectonic action (Li et al., 2009).
Well C41-16 had fewer fractures in the core compared to Well C41-38. The core fracture characteristics are shown in Figures 2K–O. All structural fractures were shear fractures, including low-angle (Figure 2K), vertical (Figures 2L,M), and bed-parallel (Figures 2N,O) fractures. The across-bedding was 4–13 cm in length and 1–3 mm wide. Most fracture surfaces were closed with no filling, while some showed iron oxide filling (Figure 2J). Friction mirrors on the crack surfaces were occasionally observed (Figure 2M). Bed-parallel fractures were also observed in the core, with the development of slickensides and mirrors (Figure 2N), which caused the rock to be crushed (Figure 2O).
Compared to the fractures in Wells C41-38 and C41-16, the core fracture was extremely undeveloped in Well C41-14 (Figures 2P–T). Only five high-angle structural fractures were observed, including three vertical and two oblique. The length and width of these fractures were 8–31 cm and 1–7 mm, respectively. No filling was observed inside the fracture. Moreover, the bed-parallel fractures developed in sections 2699.26–2706.86 m (Figure 2T).
The core observation showed that the fractures were generally not developed in the C41 block. They comprised structural and non-structural fractures. The structural fractures were mainly across-bedding shear fractures but were generally not as well developed. Most of the fractures were observed independently, with a few fractures developed in systems. The bed-parallel fractures were also developed. Among the three wells, the fractures in Well C41-38 were the most developed, while those in Well C41-14 were the least developed.
The core fractures of the above three wells included structural and non-structural fractures, the former of which were significantly developed. Most of the structural fractures (90%) were shear fractures. The remaining were tensile fractures.
The angle between the fracture dip angle and the bedding surface revealed the following five fracture types: vertical (dip angle >75°), high-angle (45° ≤ dip angle <75°), low-angle (15° < dip angle <45°), horizontal (<15°), and bedding-parallel shear fractures (Figure 3A). The first four are referred to as shear fractures across-bedding. More vertical and horizontal fractures were observed in the bedding cut fractures, accounting for 59 and 21% of total fractures, respectively. Relatively fewer high- and low-angle fractures were observed, accounting for 11 and 9% of total fractures, respectively. The bedding-parallel and across-bedding fractures affect the propagation, termination, and diversion of hydraulic fractures (HFs) (Huang et al., 2018).
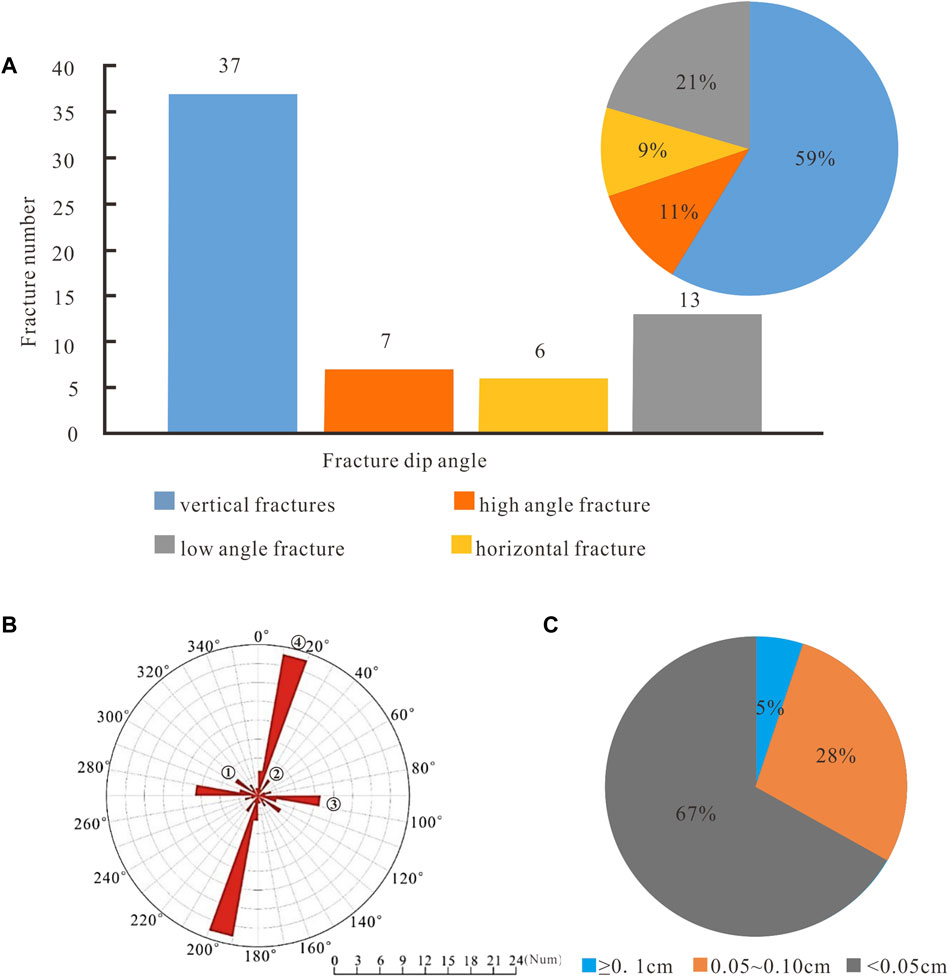
FIGURE 3. Fracture type, strike, and aperture of E2s4u in the C41 fault block of the Jiyang Depression in Bohai Bay Basin. (A) Type of core fracture dip angle. (B) Fracture strike rose diagram. (C) Fracture aperture.
The strike rose diagrams of the structural fractures (Figure 3B) revealed four dominant directions in the E2s4u reservoir. Fractures ④ in an average direction of 15° were most common, followed by fractures ③ with an average strike of 95°. Fractures ① and ② were less developed, with average strikes of 315° and 35°, respectively.
The core fracture aperture is usually larger than its real aperture owing to rock unloading; thus, correction is required (Van Golf-Racht and Chen, 1989). The real fracture aperture buried in strata was corrected using Eq. 1, where
The calculated results of the fracture aperture in E2s4u showed that most fracture apertures were less than 0.05 cm (67% of total fractures) (Figure 3C). While fractures with apertures of 0.05–0.10 cm accounted for 28% of total fractures, only 5% of fracture apertures were larger than 0.10 cm. Hence, the evidence indicated relatively weak tectonic stress when fractures were formed. Here, the high proportion (67%) of fracture apertures less than 0.05 cm may explain the low permeability of the E2s4u reservoir and the low productivity in the study area. In addition, the narrow aperture of these thin fractures can cause HF cross-over (Lee et al., 2015).
Overall, the structural fractures in the study area showed poor mineral filling. Most fractures (93.1% of total fractures) did not contain mineral fill (Figure 2). Owing to the lack of mineral fills, the mechanical strength of the mineral fill bond was not considered in hydraulic fracturing (Kolawole and Ispas 2020). The filling materials were oil, calcite, or iron oxide in 6.9% of the observed fractures (Figures 2C,F,J), with calcite the most common. The oil traces in the fractures were evidence of oil-gas once migration and accumulation. Thin section observation also revealed this phenomenon (Figure 4). Fractures can store and migrate oil and gas (Figure 4A), high-angle fracture reservoir oil and gas, and low-angle fractures as migration channels (Figure 4B). Large fracture and branch small fractures, as well as bedding-parallel fractures connected to the fracture net to store oil and gas (Figures 4C,D).
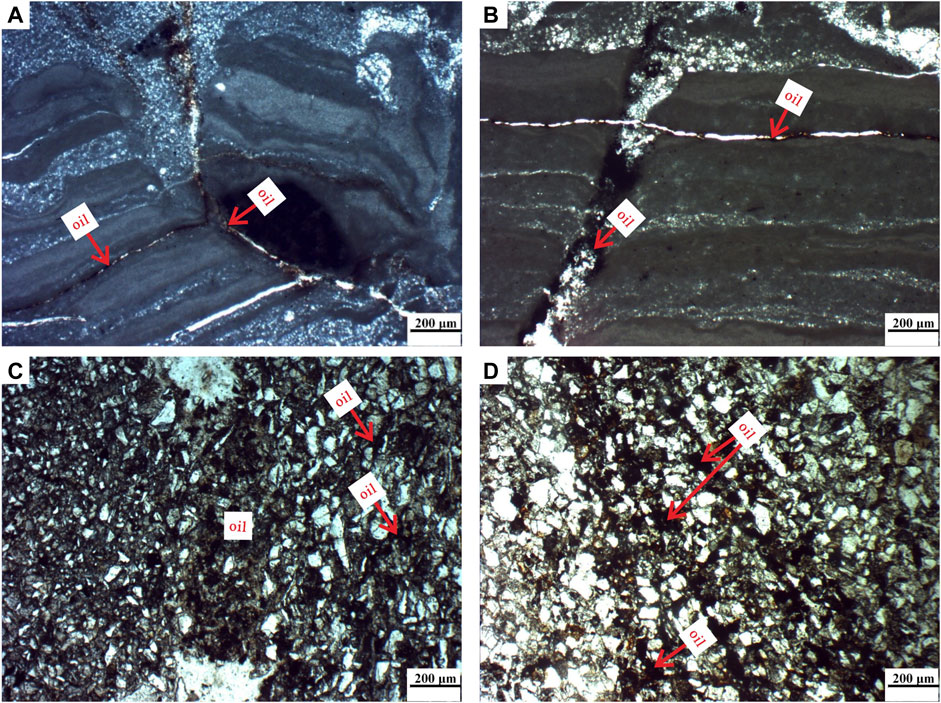
FIGURE 4. Oil fillings (dark brown) in microfractures of E2s4u in the C41 fault block of the Jiyang Depression in Bohai Bay Basin. From left to right from top to bottom are: (A–D): (A) oil filling in both high-angle and interlayer fractures of muddy limestone, Well C41-38, 2680 m, PPL×50. (B) Oil stored in the high-angle fracture that has migrated to the bedding-parallel fracture, Well C41-38, 2680 m, PPL×50. (C) A wide fracture in muddy siltstone partially filled with oil, with two small branched fractures filled with oil, Well C41-38, 2656.21 m, PPL×50. (D) Oil fillings in the bedding-parallel fracture group of muddy siltstone (location in Figure 2), Well C41-38, 2656.21 m, PPL×50.
The fracture line density (the number of fractures in the core per meter) and volume density (the area of cracks in the core per cubic meter) of the three wells were calculated. The results are as follows (Figure 5). Among the three core wells, the fractures in Well C41-14 were the least developed, while the fractures in Well C 41–38 were the most developed. Table 1 shows to which sand group the cores belonged. Thus, the fractures in the middle and upper C1-3 were the most developed, whereas those in the lower C4 were poorly developed. This result was obtained in a small area of 445 m east-west, 278 m north-south, and a depth of 10–62 m from west to east. As mentioned above, the primary porosity of the low-permeability reservoir rock was not developed and the rock was relatively tight. Therefore, the difference in fracture density demonstrates the heterogeneity in the reservoir of the study area.
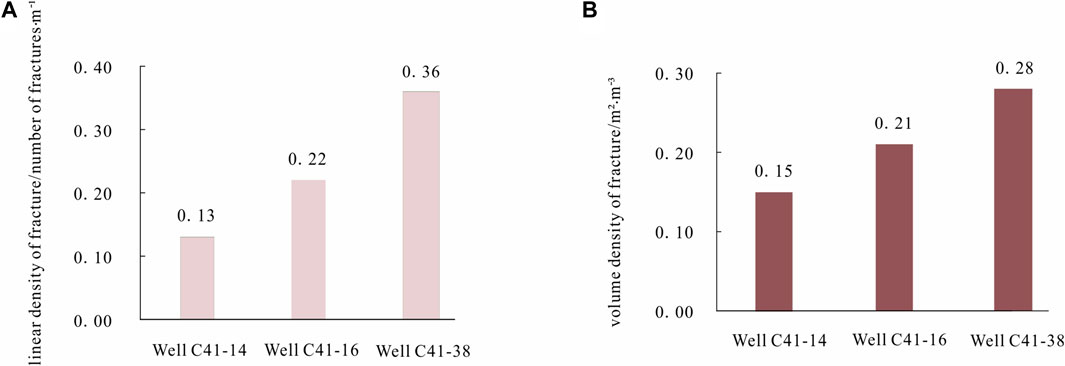
FIGURE 5. Core fracture density of the C41 fault block: (A) linear density and (B) volume density of the fracture.
Core fracture analysis revealed obvious differences in fracture characteristics, particularly in C3 of Well C41-38 and C4 of Well C41-14. These differences in fracture development indicated differences in reservoir heterogeneity. The lithology of the reservoir in Well C41-38 was fine sandstone and siltstone with uneven grain size, connecting with mudstone in sand layer C3. In addition, the bedding was well developed in the core of Well C41-38 (Table 1). Thus, the core in Well C41-38 indicated strong reservoir heterogeneity with more fractures. In contrast, the lithology of sand layer C4 in Well C41-14 was tight siltstone and the bedding was almost invisible (Table 1), representing weak reservoir heterogeneity with fewer fractures.
The effect of reservoir heterogeneity on the characteristics and evolution of fractures is an important research topic. The initiation, propagation, and termination of fractures with different reservoir heterogeneities contribute to hydraulic fracturing for further exploitation. Consequently, hydraulic fracturing can cause more fractures in low-permeability reservoirs. CT scanning with X-ray under uniaxial compression in real time can reveal the fracture evolution in three dimensions (Zabler et al., 2008; Cnudde et al., 2011; Zhang et al., 2020). The triaxial compression requires strict sample conditions, which cannot be placed into the instrument once removed. The present study applied uniaxial compression to simulate fracture initiation and propagation.
Two tight core rocks (samples CC05 and CC02) of different heterogeneity from fault block Chun 41 were selected. Their detailed characteristics are shown in Table 2. Their strata are E2s4u, whose sedimentary facies were the beach-bar of the shore-shallow lake. The lithology of sample CC05 is muddy siltstone, with mostly horizontal or ripple beddings (Table 2); thus, it represented a reservoir with strong heterogeneity. In contrast, CC02 showed no bedding development (Table 2); thus, it represented a reservoir with weak heterogeneity.
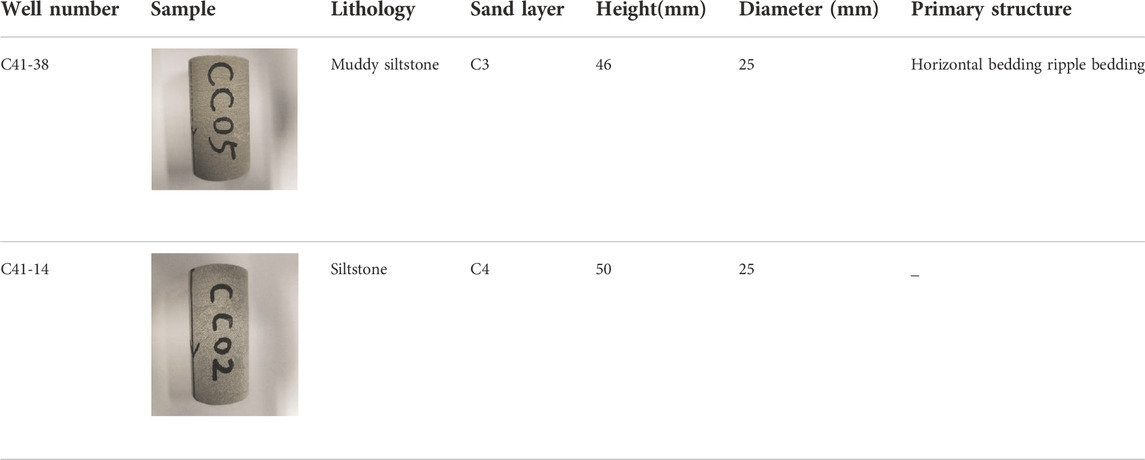
TABLE 2. Characteristics of the samples for CT scanning.
The rock in particular layers reflects the physical changes that the sediment has experienced throughout its history of burial, lithification, and uplift ( Fossen, 2016). Confining pressure is important in fracture evolution. Hence, it should be calculated. The top depths of the two samples are shown in Table 2. The uppermost strata of the two samples were Pliocene Minghuazhen Formation (N2m), top of 310 m in depth. Therefore, the difference between the two depths was the depth of sample overburden. The rock density was 2600 kg/m3 for siltstone, and g was 9.8 (ms2). Thus, the confining pressure (P) was calculated using Eq. 2, where P is the confining pressure (MPa),
The confining pressures of the two samples were 61 MPa and 62MPa, respectively, which were close in value (Table 2). This is an important factor in determining the maximum stress of loading.
CT scanning with X-ray can be used to fully display the small features of core rock through a massive image without destroying the sample (Zabler et al., 2008; Cnudde et al., 2011). As the cone-shaped X-ray penetrates the sample, a three-dimensional model of the sample is reconstructed via amplified images. During this process, different magnifications are used and several attenuated X-ray images are formed by 360° rotation (Figure 6). A CT image can truly reflect the pore structure and relative density inside the core rock. Therefore, the dynamic evolution of 3D fractures, including the initiation, propagation, and coalescence of micro-cracks in real time can be observed under different loading (Ketcham and Carlson 2001; Renard et al., 2009; Sun et al., 2020; Zhang et al., 2020).
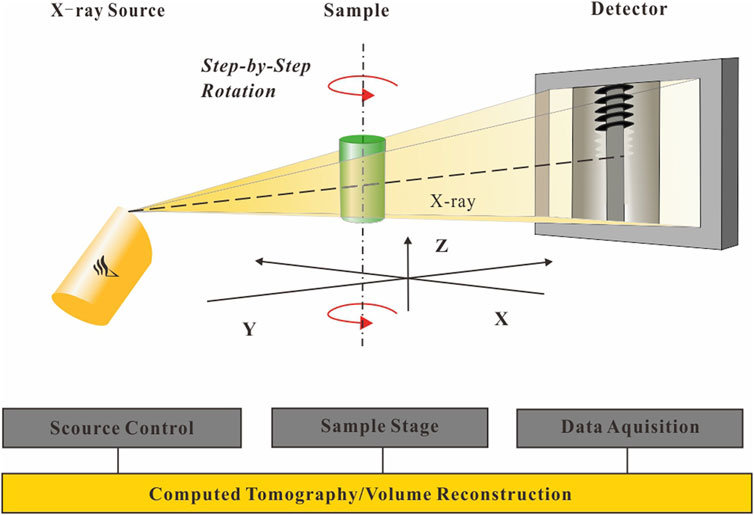
FIGURE 6. Method of CT scanning with X-ray.
A 148 kV MicroXCT-510 X-ray CT system was used to scan core the samples in real time under uniaxial load. The samples were rotated via a rotary table during scanning, thereby avoiding the disturbance of unloading on fracture evolution. Therefore, the simulation was closer to fracture evolution with a buried reservoir. Approximately 870–890 CT slices of each sample were scanned; thus, the precision of the reconstructed three-dimensional model by these images allowed full visualization of the fracture initiation and propagation (Sun et al., 2020).
The voxel size of the CT images were 0.0512 × 0.0512 × 0.0512 mm and 0.0573 × 0.0573 × 0.0573 mm, respectively; thus, each CT image was 0.0512 or 0.0573 mm thick. Therefore, cracks larger than 0.05 mm in width could be detected as relatively large and wide fractures, which appear as black areas (representing air), while small and narrow cracks appeared as gray cracks (Figure 6). Avizo software was used to reconstruct the dynamic evolution of the 3D fractures. In image processing, grayscale values of 0–255 were assigned to reveal the sample densities. Grayscale values less than 10 were marked as fractures and were represented in red.
The simulated experiment based on X-ray three-dimensional scanning was as follows: first, two samples were scanned to obtain the original fracture characteristics before loading. The detailed data are listed in Table 3. Second, the samples were loaded in uniaxial compression with quasi-static loading at 25, 50, 75, or 90% of the maximum stress. Two factors determined the maximum stress loading for each sample: lithology and confining pressure. The uniaxial compressive strength of siltstone is 60 MPa and the confining pressures of the two samples were 61 and 62 MPa, respectively (Table 4). Therefore, the maximum value of stress loading of each sample was 60 MPa, respectively. Third, real-time CT scanning was performed following the sample load-unload-scan procedure. Briefly, each sample was first loaded, then taken out and scanned. The procedures were repeated at different stresses until reaching the expected stress. Finally, low-density areas of each sample were marked in red in Avizo software to trace the fractures. Thus, the characteristics of fracture geometry, initiation, propagation, and density were obtained. Dynamic evolution of the 3D fractures was also reconstructed.
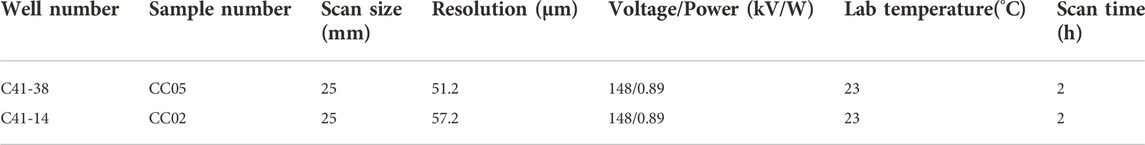
TABLE 3. Scanning information of the samples.
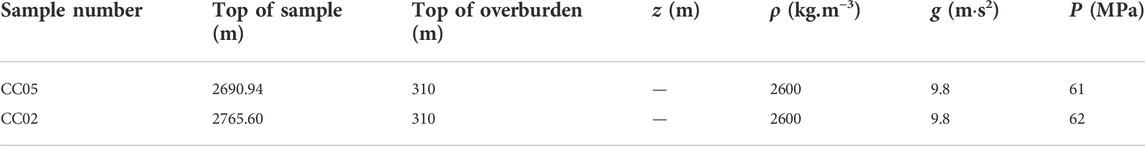
TABLE 4. Mechanic characteristics of the samples.
The fracture evolution of a low-permeability reservoir with strong heterogeneity was analyzed using sample CC05 under uniaxial compression. The results in real-time based on CT scanning are as follows (Figure 7).
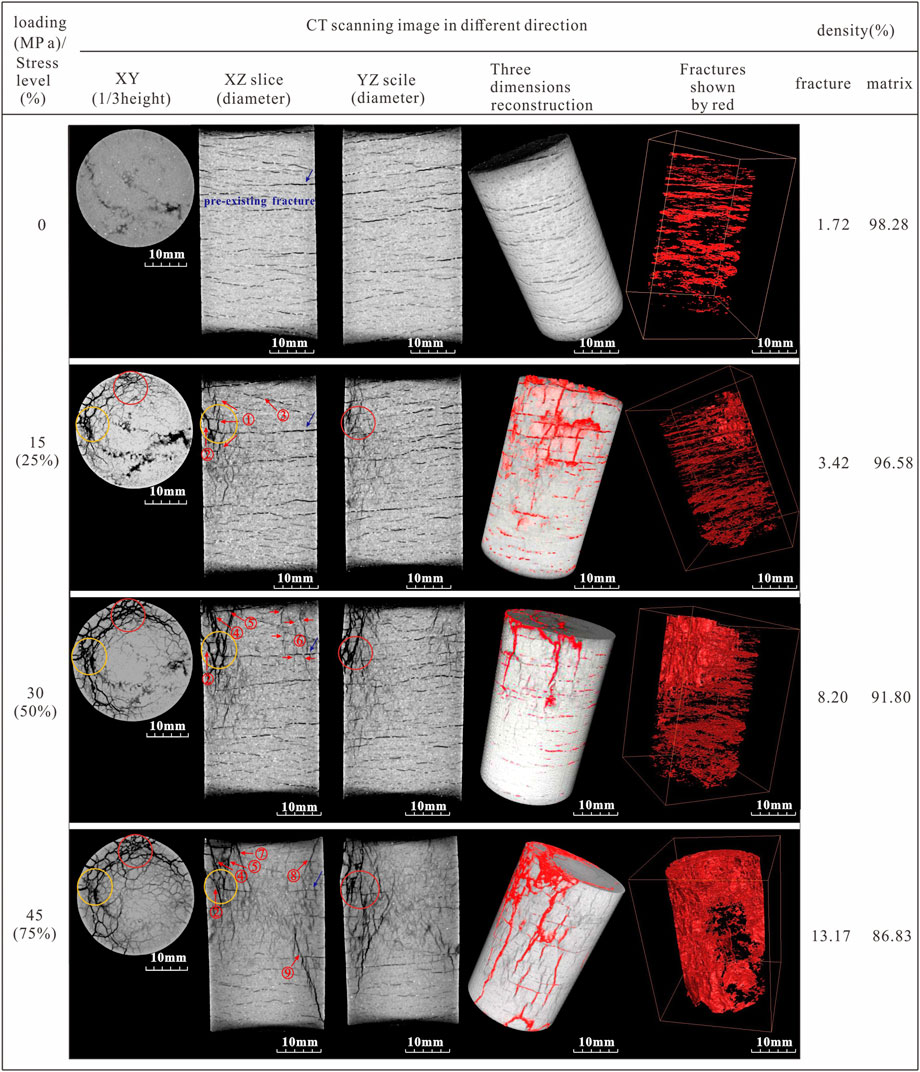
FIGURE 7. CT image of the fracture evolution of sample CC05 in a strong-heterogeneity reservoir. The yellow and red circles in the horizontal XY slice correspond to the yellow circle in the XZ slice and the red circle in the YZ slice, respectively.
The CT images revealed many bed-parallel and low-angle fractures inside sample CC05, the characteristics of which are shown in Figure 7. The left (YZ profile, slice from left to right) and front (XZ profile, slice from front to back) view slices showed many horizontal low-angle fractures inside the core. These features were also observed in the horizontal slice (XY profile). Most were small fractures with a zigzag shape in gray. The CT images showed fracture development along the bedding in profile, resulting in the formation of bed-parallel fractures. Therefore, the bedding, as an inhomogeneous surface, was crucial to the formation of the bed-parallel fracture.
In the three-dimensional perspective of the fracture represented by the red trace, the fractures were layered and not connected vertically. Before loading, the fracture volume density accounted for 1.72% of the total volume of the rock sample.
Horizontal CT slices (XY slices) can reveal fracture development in the plane. In XY image showed the initiation of many small visible net-shaped fractures along one existing fracture and the formation of large visible fractures with a zig-zag shape at the top of the sample. The fractures propagated along the termination of the pre-existing fractures (yellow circle) and connected to two nearly parallel large black fractures. One of the two nearly parallel large fractures terminated with many small fractures (red circle) in gray.
XZ profile (front view) slices are obtained vertical to the fractures to it better reveal fracture development during stress. Fracture ① developed in several tensile fractures with a dip angle of approximately 90°. These fractures terminated as horizontal fractures and developed in the left lateral en-énchelon. Fracture ② was a shear fracture with a dip angle of 70°, at 20° to σ1 (loading direction). It crossed the pre-existing bed-parallel fractures, consistent with the results observed in tri-axial tests (Lee et al., 2015). Fracture ③ developed at the upper portion of the sample. Thus, the fractures initiated from the top of the sample. The fractures labeled in the yellow circle corresponded to the yellow circles in the XY slice (Figure 7). These indicated that fracture development was related to the preexisting weak surface.
Foliation-parallel extensional fractures also developed along the preexisting fracture. YZ (left view) slice images can reveal the development of fracture surfaces along the strike (length direction). The fractures in the YZ slice in the present study showed similar evolution, with large cracks across-bedding and small cracks terminating at the bedding surface. However, the large cracks were not as obvious as those that developed in the XZ plane. The fractures labeled in the red circle corresponded to the red circle in the XY slice (Figure 7).
The fractures in the three-dimensional perspective appeared as red traces. They were connected by layered and across-bedding fractures and formed a bright red image. However, other fractures were observed as bed-parallel fractures that propagated via preexisting layered fractures. The fracture volume density accounted for 3.42% of the total volume of the rock samples, which was approximately two-fold that of that measured without loading (1.72%).
The fractures generally propagated faster than the former conditions and showed a distinct fracture style (Figure 7). On the plane, fractures continued to develop and new fractures were initiated (red and yellow circles). They propagated and developed toward the center of the sample, connecting into a network system of cracks covering almost the entire sample.
In the XZ slice, fracture ① continued to dilate, fracture ② developed a little, and fracture ③ almost healed. The obvious new cracks were the initiation of fractures ④ and ⑤. Fracture ④ appeared at the beginning of each lenticular crack of fracture ① and formed a tensile-shear fracture. The most obvious was the formation of shear fracture ⑤. Fractures ⑤ and ④ formed in a Y shape with an angle of 40°, at 20° to σ1. Moreover, certain small fractures, ⑥, began to develop opposite fractures ①-② and ④-⑤. The foliation-parallel extension fractures along the preexisting fracture continued to develop, but the aperture decreased.
In the YZ slice, the fractures showed evolution like those two slices. Large cracks were observed in the upper portion of the sample, propagated by the former small cracks. Smaller fractures occurred at the lower part and opposite the large fractures.
The three-dimensional CT images revealed that the across-bedding cracks continued to develop into through-going macro fractures. In the three-dimensional perspective, the fracture network continued to expand with increasingly large fractures in strong bright red. Other fractures further developed and were connected by small and across-bedding fractures. Under this loading condition, the increases in fracture opening and extension length jointly contributed to the fracture volume, which increased from 3.42 to 8.20% (more than two-fold).
Under a loading press of 45 MPa and a stress level of 75%, fractures propagated inside and down the sample (Figure 7). In the XZ slice, a new crack (No. ⑦), parallel to fracture ④), was initiated. To the right side, fracture ⑧ was initiated and a long shear crack (No.⑨) occurred, which extended almost to the bottom of the sample. Moreover, many near-parallel small cracks developed in the middle of the sample, connecting fractures ⑦ and ⑨ via a “soft linkage.” At this stage, the opening of many bed-parallel extensional fractures decreased or even healed.
In the YZ cross-section slice, the fractures showed an evolution like that in the XZ slice. In the left part (back of the sample), large cracks (below the red circle) developed downward; in the front of the sample, cracks appeared deep in the sample. Therefore, the fracture images showed increasingly large cracks around the circle and increasingly small cracks at the center (Figure 7). Furthermore, the bedding-parallel fractures that existed before loading were almost healed.
The three-dimensional CT images showed that the cracks continued to expand and extend as penetrating cracks. The longest penetrated vertically down the entire sample. The number of fractures increased significantly, the crack spacing became increasingly smaller, and the density of network cracks increased.
The three-dimensional red trace perspective showed that the net fracture ran through the upper part of the sample and partially reached the bottom. Moreover, no crack development was observed in the black area. At this stress level, the proportion of fracture volume increased from 8.20% to the final 13.17% of the test, although it was not an exponential increase.
Binomial fitting was performed between the obtained fracture volumes of sample CC05 under the above uniaxial loading pressure. The load and scan were performed four times, providing a total of four data points. Despite the lack of data, it still showed a parabolic result (Figure 8). The correlation coefficient between the fracture volume ratio and the axial pressure, 0.981, indicated that these factors were highly correlated. In general, the fracture volume increased with increasing uniaxial loading pressure, indicating the gradual initiation, propagation, and penetration of micro-fractures during continuous loading, thereby generating a fracture network system. However, the two were not directly proportional. After the axial pressure increased to 50%, the slope of the fitting curve gradually decreased, indicating that the fracture volume increased slowly after reaching a certain value.
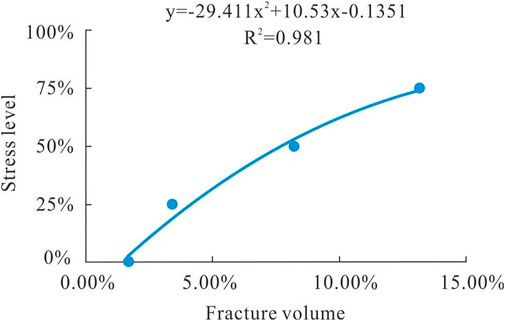
FIGURE 8. Relationship between fracture volume and stress level in strong-heterogeneity reservoir in sample CC05.
The relatively tight rock in low-permeability reservoirs such as sandstone and siltstone, with no bed-parallel or diagenetic fractures, is a type of reservoir showing weak heterogeneity. Sample CC02 was selected for fracture development and evolution tests as a representative of weak heterogeneous reservoirs (Figure 9).
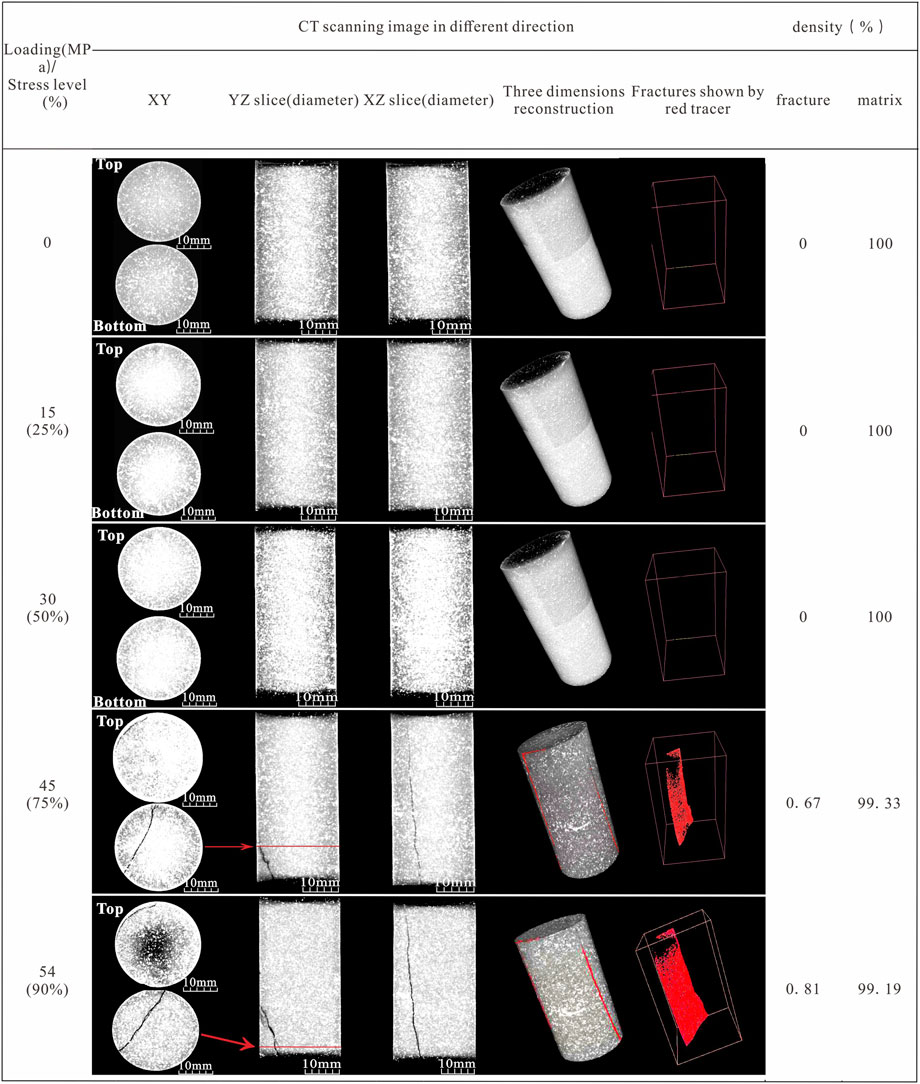
FIGURE 9. CT image of the fracture evolution of sample CC02 in weak-heterogeneity reservoir.
Scanning of the slice images showed no bedding or fractures inside the sample before loading. In addition, no cracks were initiated in the uniaxial compression with compression pressure values of 15 and 30 MPa and stress levels of 25 and 50%, respectively.
When the loading pressure was increased to 45 MPa and the stress level to 75%, a shear fracture with a high dip angle of 85° was finally initiated in the XZ slice. This shear fracture was long and straight, with a decreasing width from the bottom to the top. In the YZ slice, two fractures were initiated; whereas in the plane, two shear fractures were observed: stepping in en-énchelon in the middle with another terminating with horse-tailing microfractures (Figure 9).
The three-dimensional red tracer revealed the three-dimensional characteristics of the fracture. The fracture was not continuous in the upper sample (black image). The proportion of the fracture volume was only 0.67%, indicating a very undeveloped fracture in the sample.
When the loading pressure increased to 54 MPa, the fracture became straighter and wider. The three-dimensional red perspective, showed continuous connection of the fracture in the middle and lower parts of the sample, indicated with a bright red color. However, this fracture did not propagate toward the upper part of the sample. Moreover, although the proportion of fracture volume increased from 0.67% to 0.81%, it remained an undeveloped fracture in the sample.
Overall, the above tests revealed the fracture evolution law at different heterogeneities (Figures 7, 9). Fractures in the relatively strong heterogenetic low-permeability reservoir gradually initiated, propagated, and penetrated from top to bottom. Consequently, they formed a macroscopic crack and a vertical and horizontal network system. In contrast, fractures were difficult to form in the relatively weak heterogenetic low-permeability reservoir and formed as relatively large and long fractures once the loading exceeded the compressive strength of the rock. These results help to clarify the role of fractures in the hydraulic fracturing of oil wells.
Griffith reported that randomly oriented and distributed intragranular microfractures in rock controlled the brittle strength of rock. Microscopic cracks, pores, and other flaws weaken rocks. Stress is generally concentrated at the tips of open microfractures in a rock, and the concentration increases with decreasing thickness/length ratio of the microfracture (Figure 10A) (Fossen, 2016). Local atomic bonds can be broken by this concentration, causing microcrack growth and further increasing the stress concentration at its tips to promote continued crack propagation (Fossen, 2016). Thus, microscale heterogeneities in the form of microfractures reduce rock strength. Mechanical weak layers, such as bedding, pre-existing bedding-parallel fractures, or mudstone layers in the reservoir make it thinner. Compared to weakly heterogeneous rocks, strongly heterogeneous rocks show lower uniaxial compressive strength (Figure 10B). In uniaxial compression tests, fractures were more likely to occur (Figure 7).
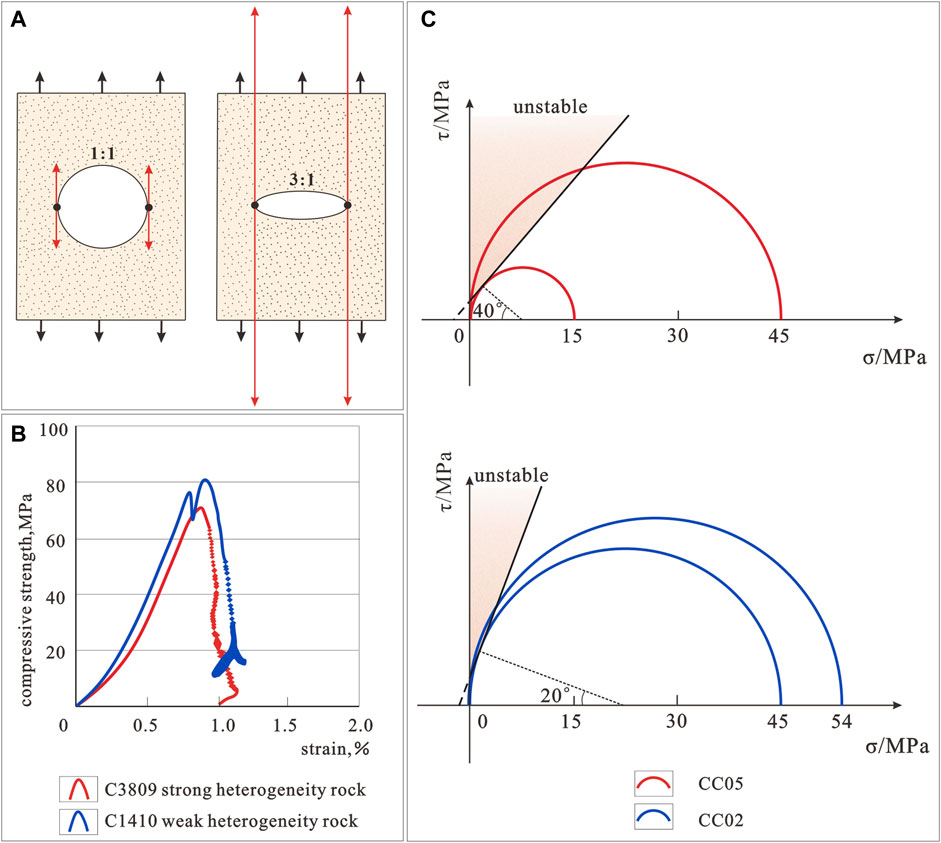
FIGURE 10. Effects of heterogeneity on the fracture mechanisms. (A) Illustration of local stress concentrations in a material with circular and elliptical holes (Fossen, 2016). Black arrows: remote stress. (B) Uniaxial compressive strength. (C) Mechanisms of fractures and heterogeneity.
Preexisting mechanic weak surfaces such as bedding, diagenetic fractures, and preexisting fractures lead to rock anisotropy stemming from sedimentary factors. The differences in critical differential stress may vary by several hundred percent, depending on the orientation (Fossen, 2016). Therefore, rock with a planar anisotropy will fail either along or across the weak surface. In sample CC05, the preexisting mechanically weak surfaces decreased the critical differential stress (Figure 10B) and the fractures occurred at 15 MPa. Most of the preexisting mechanically weak surfaces in CC05 were oriented perpendicular to σ1; thus, across-bedding shear fractures formed at 20° to σ1. New fractures were formed with gradually increasing loading. Therefore, fractures have a relatively large density and long development period (Figure 7, Figure 10C). Meanwhile, foliation-parallel extension fractures along the preexisting fracture developed at low stress (15 and 30 MPa) and were undeveloped or healed at high stress levels (45 MPa) (Figure 7). In contrast, without mechanically weak surfaces, the fractures were initiated only in relatively large differential stress (Figure 9, Figure 10C). Thus, fractures have a relatively small density and short development period (Figure 9).
The core observations and calculations showed that natural fracture (NF) volume densities of relatively strong and weak heterogeneity in E2s4u were 0.28 and 0.15 m2/m3, respectively. This result indicated an undeveloped fracture in the study area. Furthermore, enhanced oil and gas production can be achieved by fracturing. Fracturing efficiently provides a faster and higher conductivity pathway into the reservoir (Gil et al., 2011). Discontinuities such as faults, unbounded bedding planes, and joints may significantly influence fracture shape during fracturing (Warpinski and Teufel 1987). Moreover, the HF may terminate, cross, or bypass the NF (Kolawole and Ispas 2020). Furthermore, the height constraint of the NF within stress barriers may impede the HF from crossing and cause arrest (Morris et al., 2016; Huang et al., 2018), leading to NF dilation, reactivation by shearing, and both shearing and dilation (Kolawole and Ispas 2020). The HF crosses the NF in the high and medium-to-high approach angles by propagating, dilating, or not dilating the NF in high-normal confining stress and strong NF interface bonding (Meng & de Pater, 2010). During fracturing, the HF propagates from the tip of the NF and diverts parallel to the HF, which terminates to the HF or is constrained by the NF in unidirectional and bidirectional stepping (Potluri et al., 2005; Kolawole and Ispas 2020). Therefore, the heterogeneity of low-permeability reservoirs plays an important role in hydraulic fracturing.
These results and those of the natural fracture analysis demonstrate that a strong-heterogeneity reservoir is more favorable to the fracturing effect compared to a weak-heterogeneity reservoir. The results based on the CT scans showed that fractures initiated and propagated easily in the strong-heterogeneity reservoir with bedding or pre-existing bedding-parallel fractures (Figure 7). Therefore, HF is produced more easily compared to a weak-heterogeneity reservoir under the same fracturing pressure. Although fractures are arrested when their tips propagate to the weak layer, which constrains expansion in the length direction, further fractures are produced in the production layer to enhance the oil channel. In contrast, in low-permeability reservoirs with relatively weak heterogeneity, fractures are hard to initiate. Therefore, the heterogeneity and mechanical properties of reservoirs of the kick-off point play a vital role in fracturing.
Experimental and numerical investigation showed that the approach angle affected the HF and NF interaction table (Zhu et al., 2018). A high approach angle (larger than 60°) between the HF and NF caused the HF to more easily cross the NF compared to angles ≤60°. Moreover, when the angle decreased, the HF was arrested at the NF plane (Fatahi et al., 2017; Wang et al., 2018). Therefore, bedding parallel fractures and NFs with dip angles ≤30° made it easier for hydraulic cracks to pass through and form long hydraulic cracks, whereas natural fractures with dip angles ≥30° arrested HFs at the NF plane.
When a fracture is initiated, it grows in the vertical and planar directions (Figures 7, 9). Compared to the fracture vertical growth, fractures may grow efficiently in other directions in planar. A high approach angle (≥50°) and low differential horizontal stresses (≤10 MPa) resulted in the HF crossing the NF (Zhu et al., 2018). Therefore, the strike of the NF can affect the propagation and termination of the HF.
Considering the approaching angle and horizontal differential stress, the results of this study proposed an actual model of fracturing to illustrate the effects of natural fracture characteristics in different heterogeneity reservoirs to fracturing (Figure 11). The best fracturing direction was along approach angles of 50°–90° to the dominant natural fracture, together with low differential horizontal stresses.
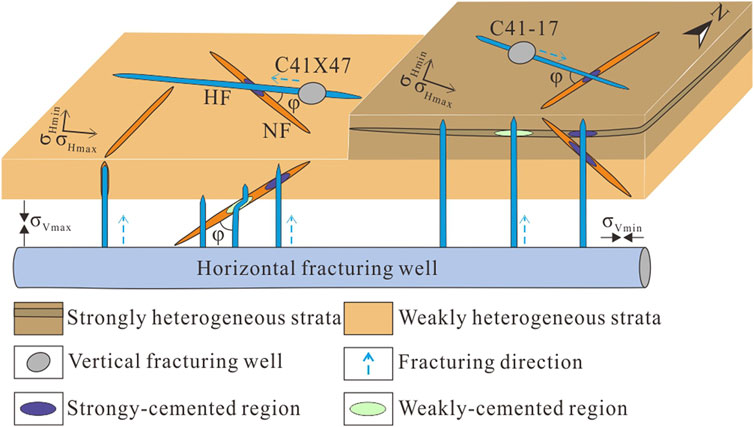
FIGURE 11. Effects of natural fracture characteristics in different heterogeneity reservoirs on fracturing.
As mentioned above, the preferred direction of the NF in the study area was 15° (Figure 3B). Hence, the best fracturing direction was 65°–105°, with an approach angle of 50°–90° (Figure 11). Wells C41-17 and C41X47 in the C41 block were selected for fracturing work. The simulated minimum principal stress in Well C41-17 was 55 MPa, while the maximum principal stress measured by acoustic emission was 66 MPa (Liu et al., 2003). Thus, the horizontal differential stress was 11 MPa, which met the needs for the best fracturing effect. As mentioned above, the HF will cross the NF easily at a high approach angle and small differential horizontal stresses. The hydraulic fracturing produced HFs in strikes of 64.1°and 51° in Wells C41-17 and C41X47, respectively (Figure 1B), which was consistent with the theoretical findings.
This study investigated the three-dimensional evolution of fracture initiation and propagation in different heterogeneity conditions of low-permeability reservoirs by analysis of the core fractures and X-ray computed tomography scans in uniaxial compression tests with loading and unloading. The following conclusions resulted from these analyses:
1) The heterogeneity of low-permeability reservoirs affects the development of natural fractures. In strong-heterogeneity reservoirs with a pre-existing mechanical weak surface (bedding, diagenetic, etc.), many structural fractures develop and the fracture density is high. In contrast, structural fractures do not develop in weakly heterogeneous reservoirs without a pre-existing mechanical weak surface. These cases develop few fractures and show a low fracture density.
2) The development and evolution of 3D fractures are controlled by reservoir heterogeneity, load value, and direction. CT scans of strong-heterogeneity reservoirs showed that the fractures initiated and propagated from shallow to deep depths under relatively small loading values. The initial crack was often a tensile fracture, which propagated into hybrid and shear fractures. These fractures intersected to form a complex and interconnected three-dimensional fracture body. In contrast, in weak-heterogeneity reservoirs with only large load values, the initial fractures often occur as large shear fractures. In addition, they step into the en-énchelon in the middle, terminating with horse-tailing microfractures in the plane. Therefore, a relatively simple 3D fracture system develops.
3) The reservoir heterogeneity controls the fracture stage and density. In strong-heterogeneity reservoirs, the fractures show long propagation and growth stages with large fracture densities. The fracture increase rate is positively correlated with the uniaxial loading value. In contrast, microfracture initiation is difficult in weak-heterogeneity reservoirs. Therefore, the fracture development period is relatively short, the formation period starts relatively later, and the fracture density is low.
4) A better fracturing effect can be achieved by selecting a reservoir with strong heterogeneity, along the direction at an angle >50° with respect to the natural fracture with small differential horizontal stresses.
The original contributions presented in the study are included in the article/Supplementary material. Further inquiries can be directed to the corresponding author.
LL coordinated the core observations; developed the initial study concept; contributed to the conceptualization, data curation, original writing, experimental analysis, revisions, and editing; and submitted the article. GS developed the initial study concept and performed the formal analysis, sample collection, and experimental analysis. YZ and XL contributed to data reduction and editing and also prepared the figures. All authors contributed to the article and approved the submitted version.
This study was supported by a Science and Technology Major Project (Grant No. 2017ZX05009001) and an Open Project of the State Key Laboratory of Petroleum Resources and Prospecting, China University of Petroleum (Grant No. PRP/open–1904).
The authors acknowledge the support of the Science and Technology Major Project and Open Project of the State Key Laboratory of Petroleum Resources and Prospecting, China University of Petroleum. Further, they thank Associate Professor Yanzhang Wang for his help in the sample testing based on CT Scanning by X-ray. In addition, they thank Shaoqun Yu and Cong Xu for their help in core data acquisition. Furthermore, they thank Tao Wang and Ruochen Cui for their help in figure modification. They thank Lucie for helping to polish the article. They also thank the two reviewers for their valuable advice to improve the quality of the manuscript.
GS was employed by Henan Geological Investigation and Designing Institute Co., Ltd.
The remaining authors declare that the research was conducted in the absence of any commercial or financial relationships that could be construed as a potential conflict of interest.
All claims expressed in this article are solely those of the authors and do not necessarily represent those of their affiliated organizations, or those of the publisher, the editors, and the reviewers. Any product that may be evaluated in this article, or claim that may be made by its manufacturer, is not guaranteed or endorsed by the publisher.
Cao, G. (2005). “Experiment on microfractures initiation and propagation and seepage properties of sandstone samples by using X-ray scan,” (Xi'an: Xi'an University of technology). master's thesis.
Chen, Y., Li, N., Han, X., Pu, Y., and Liao, Q. (2005). Research on crack development progress on non-interpenetrated media by using CT (In Chinese with English abstract). Chin. J. Mech. Eng. 24 (15), 2665–2670. doi:10.3321/j.issn:1000-6915.2005.15.011
Cnudde, V., Boone, M., Dewanckele, J., Dierick, M., Van Hoorebeke, L., and Jacobs, P. (2011). 3D characterization of sandstone by means of X-ray computed tomography. Geosph. (Boulder). 7, 54–61. doi:10.1130/ges00563.1
Ding, W., Wang, X., Hu, Q., Yin, S., Cao, X., and Liu, J. (2015). Progress in tight sandstone fractures reservoir (In Chinese with English abstract). Prog. Geoscience 30 (7), 737–750. doi:10.11867/j.issn.1001-8166.2015.07.0737
Fatahi, H., Hossain, M. M., and Sarmadivaleh, M. (2017). Numerical and experimental investigation of the interaction of natural and propagated hydraulic fracture. J. Nat. Gas Sci. Eng. 37, 409–424. doi:10.1016/j.jngse.2016.11.054
Gale, J. F. W., Reed, R. M., and Ho1der, J. (2007). Natural fractures in the Barnett Shale and their importance for hydraulic fracture treatments. Am. Assoc. Pet. Geol. Bull. 91 (4), 603–622. doi:10.1306/11010606061
Germanovich, L. N., Salganik, R. L., Dyskin, A. V., and Lee, K. K. (1994). Mechanisms of brittle fracture of rock with pre-existing cracks in compression. Pure Appl. Geophys. 143 (1-3), 117–149. doi:10.1007/BF00874326
Gil, I., Nagel, N., Sanchez-Nagel, M., and Damjanac, B. (2011). “The effect of operational parameters on hydraulic fracture propagation in naturally fractured reservoirs-getting control of the fracture optimization process,” in Proceedings of the 45th US Rock mechanics/geomechanics symposium, San Francisco, California, June 2011. ARMA-11-391.
Huang, J., Morris, J. P., Fu, P., Settgast, R. R., Sherman, C. S., and Ryerson, F. J. (2018). Hydraulic-fracture-height growth under the combined influence of stress barriers and natural fractures. SPE J. 24 (1), 302–318. doi:10.2118/189861-PA
Jin, Y., Zhang, X., and Chen, M. (2005). Initiation pressure models for hydraulic fracturing of vertical wells in naturally fractured formation (In Chinese with English abstract). Acta Pet. Sin. 26 (6), 113–114. doi:10.3321/j.issn.0253-2697.2005.06.026
Ketcham, R. A., and Carlson, W. D. (2001). Acquisition, optimization and interpretation of X-ray computed tomographic imagery: Applications to the geosciences. Comput. Geosci. 27, 381–400. doi:10.1016/S0098-3004(00)00116-3
Kolawole, O., and Ispas, I. (2020). Interaction between hydraulic fractures and natural fractures: Current status and prospective directions. J. Pet. Explor. Prod. Technol. 10 (4), 1613–1634. doi:10.1007/s13202-019-00778-3
Lee, H. P., Olson, J. E., Holder, J., Gale, J. F. W., and Myers, R. D. (2015). The interaction of propagating opening mode fractures with preexisting discontinuities in shale. J. Geophys. Res. Solid Earth 120, 169–181. doi:10.1002/2014jb011358
Li, D. P. (1997). Development of low permeability sandstone oilfield. Beijing: Petroleum Industry Press.
Li, H., Fan, C. W., Jiang, Z. X., Li, J., Li, C., Xu, X. H., et al. (2022). Natural fractures in low-permeability sandstone reservoirs in the LD-A HPHT gas field, yinggehai basin: Implications for hydrocarbon exploration and development. Front. Earth Sci. (Lausanne). 10, 934097. doi:10.3389/feart.2022.934097
Li, H., Tang, H., Qin, Q., Zhou, J., Qin, Z., Fan, C., et al. (2019). Characteristics, formation periodsand genetic mechanisms of tectonic fractures in the tight gas sandstones reservoir: A case study of xujiahe formation in YB area, sichuan basin, China. J. Petroleum Sci. Eng. 178, 723–735. doi:10.1016/j.petrol.2019.04.007
Li, J., Kong, X., Song, M., Wang, Y., Wang, H., and Liu, X. (2019). Study on the influence of reservoir rock micro-pore structure on rock mechanical properties and crack propagation (In Chinese with English abstract). Rock soil Mech. 40 (11), 4419–4156, 4164. doi:10.16285/j.rsm.2018.1866
Li, L., Sang, X., and Chen, X. (2017). Research and progress on fracture of low-permeability reservoir (In Chinese with English abstract). Prog. Geophys. 32 (6), 2472–2484. doi:10.6038/pg20170626
Li, L., Zhong, D. L., Shi, X. P., Tang, Z. B., Hu, Q. Y., Xu, Y., et al. (2009). Late Mesozoic–Cenozoic decollement structure and its deep geological background in Western Shandong, China. Prog. Nat. Sci. 19 (05), 603–613. doi:10.1016/j.pnsc.2008.08.006
Liu, X. T., Dai, J. S., Xu, J. C., and Wang, B. F. (2003). Finite element simulation of the present ground stress field of Sha-4 Member in the Chun-41 fault block. Petroleum Explor. Dev. 30 (3), 126–128. doi:10.3321/j.issn:1000-0747.2003.03.035
Meng, C., and de Pater, J. L. (2010). “Hydraulic fracture propagation in pre-fractured natural rocks,” in Proceedings of the American Rock Mechanics Association, Nagasaki. ARMA-10-318. doi:10.2118/140429-MS
Morris, J. P., Fu, P., Settgast, R. R., Sherman, C. S., Friedrich, M., and Leonard, P. (2016). The combined influence of stress barriers and natural fractures upon hydraulic fracture height growth. Am. Rock Mech. Assoc. 4, 2871–2876.
Potluri, N. K., Zhu, D., and Hill, A. D. (2005). “The effect of natural fractures on hydraulic fracture propagation,” in SPE European Formation Damage Conference, Sheveningen, The Netherlands, May 2005. SPE 94568. doi:10.2523/94568-MS
Renard, F., Bernard, D., Desrues, J., and Ougier-Simonin, A. (2009). 3D imaging of fracture propagation using synchrotron X-ray microtomography. Earth Planet. Sci. Lett. 286 (1-2), 285–291. doi:10.1016/j.epsl.2009.06.040
Shi, G. Y., Li, L., Yu, S. Q., and Xu, C. (2021). Development characteristics and stages of fractures in the Low-permeability reservoir of the Fourth Member of Shahejie Formation of Chun-41 fault block (In Chinese with English abstract). Geol. Sci. 56 (03), 854–866. doi:10.12017/dzkx.2021.044
Sun, X., Li, X., Zheng, B., He, J., and Mao, T. (2020). Study on the progressive fracturing in soil and rock mixture under uniaxial compression conditions by CT scanning. Eng. Geol. 279, 105884. doi:10.1016/j.enggeo.2020.105884
Van Golf-Racht, T. D., and Chen, Z. (1989). The engineering fundament of fractured reservoir (Chinese version). Beijing: Petroleum industry press.
Wang, R., Chen, M., and Sun, W. (2008). Quantitative research on the characteristics of microfracture and parameters for micro cracks in ultra-low permeability sandstone reservoir: Taking yan 25 and Zhuang 40 areas in ordos basin for example (in Chinese with English abstract). Acta Mineral. Sin. 28 (2), 215–220. doi:10.3321/j.issn:1000-4734.2008.02.016
Wang, W., Olson, J., Prodanovi, M., and Schultz, R. A. (2018). The impact of natural fracture thickness on hydraulic fracture interaction mechanics. Proceedings of the Unconventional Resources Technology Conference. Houston, Texas, USA, July 2018, doi:10.15530/urtec-2018-2902343
Warpinski, N. R., and Teufel, L. W. (1987). Influence of geologic discontinuities on hydraulic fracture propagation (includes associated papers 17011 and 17074 ). J. Petroleum Technol. 39 (2), 209–220. doi:10.2118/13224-pa
Zabler, S., Rack, A., Manke, I., Thermann, K., Tiedemann, J., Harthill, N., et al. (2008). High-resolution tomography of cracks, voids and micro-structure in greywacke and limestone. J. Struct. Geol. 30 (7), 876–887. doi:10.1016/j.jsg.2008.03.002
Zeng, L. (2004). Fissure and its seepage characteristics in low permeability sandstone reservoir (In Chinese with English abstract). Geoscience 39 (1), 11–17. doi:10.3321/j.issn:0563-5020.2004.01.002
Zeng, L., and Xiao, S. (1999). Fractures in the mudstone of tight reservoirs (In Chinese with English abstract). Exp. Pet. Geol. 21 (3), 266–269. doi:10.3969/j.issn.1001-6112.1999.03.015
Zhang, Y., Niu, S., Du, Z., Hao, J., and Yang, J. (2020). Dynamic fracture evolution of tight sandstone under uniaxial compression in high resolution 3D X-ray microscopy. J. Petroleum Sci. Eng. 195, 107585. doi:10.1016/j.petrol.2020.107585
Zhou, X., Zhang, L., and Fan, K. (2006). The research situation and progresses of natural fracture for low permeability in oil and gas basin (In Chinese with English abstract). Geol. Rev. 52 (6), 777–782. doi:10.16509/j.georeview.2006.06.008
Zhu, G., Sousa, R. L., Abdulla, M., Al-Rub, R., and Sassi, M. (2018). “Numerical investigation of the interaction between hydraulic fractures and nature fractures at reservoir scale,” in Proceedings of the 2Nd International Discrete Fracture Network, Seattle, Washington, USA, June 2018. ARMA-DFNE-18-0774.
Keywords: dynamic evolution, low permeability reservoir, reservoir heterogeneity, CT scanning by X-ray, uniaxial compression, Bohai Bay Basin, fracture
Citation: Li L, Shi G, Zhang Y and Liu X (2023) Relationship between the heterogeneity of low-permeability reservoirs and the dynamic evolution of fractures under uniaxial compression conditions by CT scanning: A case study in the jiyang depression of Bohai Bay Basin, China. Front. Earth Sci. 10:1018561. doi: 10.3389/feart.2022.1018561
Received: 13 August 2022; Accepted: 27 September 2022;
Published: 11 January 2023.
Edited by:
Jingshou Liu, China University of Geosciences Wuhan, ChinaReviewed by:
Cunhui Fan, Southwest Petroleum University, ChinaCopyright © 2023 Li, Shi, Zhang and Liu. This is an open-access article distributed under the terms of the Creative Commons Attribution License (CC BY). The use, distribution or reproduction in other forums is permitted, provided the original author(s) and the copyright owner(s) are credited and that the original publication in this journal is cited, in accordance with accepted academic practice. No use, distribution or reproduction is permitted which does not comply with these terms.
*Correspondence: Li Li, bGlsaUB1cGMuZWR1LmNu
Disclaimer: All claims expressed in this article are solely those of the authors and do not necessarily represent those of their affiliated organizations, or those of the publisher, the editors and the reviewers. Any product that may be evaluated in this article or claim that may be made by its manufacturer is not guaranteed or endorsed by the publisher.
Research integrity at Frontiers
Learn more about the work of our research integrity team to safeguard the quality of each article we publish.