 Mingming Sui1
 Fei Shen
- 1College of Civil Engineering, Nanjing Forestry University, Nanjing, China
- 2School of Geography, Nanjing Normal University, Nanjing, China
- 3Key Laboratory of Virtual Geographic Environment (Nanjing Normal University), Ministry of Education, Nanjing, China
- 4Jiangsu Center for Collaborative Innovation in Geographical Information Resource Development and Application, Nanjing, China
With the increasing popularity of high-precision applications of smartphone, more and more scholars carry out studies in the field of smartphone GNSS positioning. In the previous studies, more attention has been paid to data quality control, data preprocessing and observation models. However, the research on stochastic models is rare. The stochastic model is significant for the subsequent optimal positioning parameter estimation, meanwhile, the stochastic models of smartphones and professional geodetic receivers are very different for the completely different characteristics of smartphone GNSS observations. It is necessary to develop a stochastic model suitable for smartphone observations. Based on the characteristics of smartphone observations, this paper proposes an optimized stochastic model. The specific process of this method is as follows: firstly, the code-minus-phase (C-L) combi-nation and double-differenced measurement were used to quantify the noise of smartphone code and phase observations. Then, an optimized carrier-to-noise density ratio (C/N0) dependent stochastic model was proposed on the basis of the characteristic of smartphone observations. To validate the superiority of the proposed model, single point positioning (SPP) and real time kinematic (RTK) experiments were carried out by Xiaomi 8 in 2 days. The 3-dimensional root mean squares (RMS) of SPP were 6.18 and 5.38 m, with improvements varying within 0.00%-10.02% compared with the customary models. Likewise, the RMS of RTK were 0.14 and 0.24 m, with improvements fitting in range of 10.06%-39.92%. This research plays an important role in improving the positioning accuracy of smartphone and promoting the popularization of high-precision applications.
1 Introduction
The Global Navigation Satellite System (GNSS) is significant for the location-based services, including the positioning, navigation and timing (Paziewski and Crespi, 2020). With the development of mass-market GNSS chipsets, the receiver devices have expanded from high-quality geodetic receivers to low-cost receivers, even the smartphones. Due to the worse performance of GNSS chipsets in smart-devices, the smartphones are generally employed to low-precision applications (Zhang et al., 2018), e.g., personal and vehicle navigation, social networking, geocoding, etc. One milestone was the availability of the smartphone GNSS raw code and phase observations, which made the high-precision positioning with smartphones possible (Banville and Van Diggelen, 2016; Fu et al., 2020). Gradually, more and more smartphones began to provide GNSS observations to users. In response to the huge market demands, the theory and algorithms of smartphone positioning have be-come one of the most concerned and disputed topics.
In this context, a large number of researchers have made great efforts to evaluate the smartphone GNSS observations. It has been found that the phase observation of smartphone is not continuous due to the duty-cycling model. This model is initially designed to save the low power consumption and prevent battery drainage (Paziewski et al., 2019). However, the discontinuous phase observation hindered the phase-based positioning, such as Real-Time Kinematics (RTK) and Precise Point Positioning (PPP) (Paziewski, 2020; Xiaohong et al., 2017). Fortunately, some latest emerging smartphones can turn off this mode, such as the Xiaomi 8 smartphones. Due to the limitations of low-cost hardware, the embedded antennas expressed as a high susceptibility to the multipath and linear polarization (Pesyna et al., 2014; Håkansson, 2019). Even worse, the sophisticated observation noise and the severe multipath errors also lead to the low correlation be-tween carrier-to-noise density ratio (C/N0) and corresponding satellite elevation, resulting in that the smartphone noise is inconsistent with that of the geodetic receiver (Paziewski et al., 2019).
The stochastic model is used to describe the relative correlation and precision of GNSS observations, which is vital for the subsequent optimal parameter estimation and quality control. For GNSS observations from geodetic receivers, the elevation-dependent and the C/N0-dependent weighting strategy were usually employed (Braasch and Van Dierendonck, 1999). However, due to the impacts of multipath effects and other factors, the low correlation between C/N0 and corresponding satellite elevation suggested that the elevation-dependent weighting strategy may be no longer suitable for smartphone GNSS observations (Gao et al., 2021; Zhang et al., 2021; Yuan et al., 2022). Liu et al. (2019) had verified that C/N0-dependent stochastic model was more optimized than elevation-dependent for smartphone positioning (Paziewski et al., 2019; Wanninger and Heßelbarth, 2020). However, up to now, the parameters used in the elevation-dependent or C/N0-dependent stochastic model are empirical, which may not suit particularly well for characterizing the signals of smartphones. To achieve better positioning performance with smartphone, more refined stochastic models for smartphone are required.
Under these backgrounds, this study aims to propose an optimized stochastic model which can be used to adequately describe the quality of smartphone GNSS observation, according to the characteristics of the smartphone pseudorange and phase observations. In order to achieve this purpose, two tasks need to be carried out sequentially. Firstly, the code-minus-phase (C-L) and double-differenced (DD) linear combination are formed to retrieve the characteristics of smartphone code and phase observations. In the second task, an optimized C/N0-dependent stochastic model using the weighted least-squares method is investigated based on the results obtained from the first task. To validate this model, the standard point positioning (SPP) and RTK were performed by comparing the optimized stochastic model with the customary models.
Therefore, our study is organized as follows. In the following section, we describe the theories utilizing the C-L and DD measurements to compare the smartphone with geodetic receivers. Afterwards, an optimized C/N0-dependent stochastic model for pseudorange and phase observation using the weighted least-squares method is de-scribed in detail. Then, the effectiveness of the optimized stochastic model is validated in Section 3. Finally, the main conclusions are drawn.
2 Materials and methods
2.1 Smartphone GNSS observations analysis using linear combinations
2.1.1 The C-L linear combination
The fundamental equations for single-frequency GNSS observations expressed in units of meters are as follows (de Bakker et al., 2009):
where
The C-L linear combinations are derived as follows:
Apparently, the geometric terms are eliminated in the C-L combination. It is worth noting that the multipath error and unmodeled error of the phase observation can be ignored with respect to that of the pseudorange observation. Therefore, the
2.1.2 The pseudorange noise analysis using C-L observations
We proposed two different methods to isolate the pseudorange noise from other effects in code-minus-phase data, respectively. The first is by fitting a low-order polynomial to the data and then subtracting this polynomial from the data. The second, called doubled-differencing, is by subtracting the mean value from the double-differenced code-minus-phase data.
For the first method, the entire C-L measurements are segmented by intervals of consecutive
where
For the second method, since the double-differenced operator can effectively weaken or eliminate the receiver clock, the ionosphere delays and the troposphere delays for the short baseline, when the DD operator is employed for Eq. 3, only the DD phase ambiguity and the DD residual multipath errors are left. These can be removed by subtracting the mean value among consecutive
where
Because one DD measurement contains the difference between the measurements of the reference satellite and rover satellite, a pseudo carrier-to-noise density ratio (C/N0) is utilized (de Bakker et al., 2009):
where
2.1.3 The phase noise analysis using DD observations
In the above analysis, the carrier phase observations are treated as an accurate reference in the linear combinations to model the pseudorange noise. The phase noise is analyzed separately by forming the DD carrier phase measurements. A low-order polynomial is fitted over
where the second-order polynomial
In summary, the expectation and variance of the corresponding pseudorange and phase noise are summarized in Table 1. It is noted that the systematic errors can be removed or reduced to a negligible level, but the influence of multipath is unavoidable. This is the reason why we use ultra-short baseline later in our contribution to further eliminate the uncertainty errors.
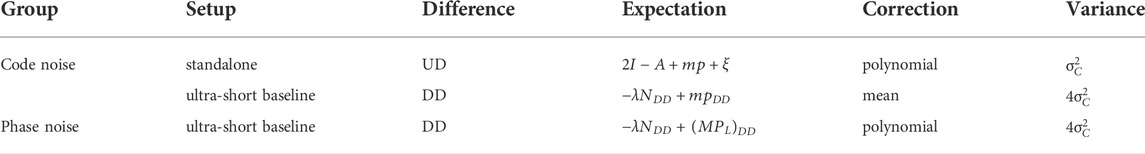
TABLE 1. Expectation and variance of different linear combinations.
2.2 An optimized stochastic model for smartphone GNSS, observations
2.2.1 The customary stochastic model for geodetic GNSS observations
Typically, the function of satellite elevation is generally used to describe the observation weight in GNSS positioning (Eueler and Goad, 1991). The well-known GNSS processing software, GAMIT, employed sine function as follows:
where
Besides, C/N0 dependent weighting is also an important method to construct the stochastic model (Braasch and Van Dierendonck, 1999). Compared with the elevation weighting strategy, an advantage of the C/N0 weighting is that it is more suitable for poor signal environments. Therefore, Hartinger and Brunner (1999) put forward
where
The underlying assumption of the above two stochastic models is that the accuracy of GNSS observation is decreased as the satellite elevation or C/N0 becomes lower. This situation is well suitable for the GNSS observations generated by geodetic receivers. However, Jacek et al. (2019) have proven that Eq. 8 is not suitable for smartphone measurements since the quality of smartphone observation is less correlated with the satellite elevation than satellite C/N0. Besides, the unreasonable determination of the factor
2.2.2 An optimized C/N0-dependent stochastic model for smartphone GNSS observations
• Stochastic model for pseudorange observations
The C/N0 values of the geodetic receivers are mainly concentrated around 40–50 dB-Hz. However, it has been illustrated that the values of the smartphones were generally 5–10 dB-Hz smaller than that of geodetic receivers. In fact, the
where
with
According to the weighted least-squares, it becomes straightforward to compute the optimal estimation of parameter
where
• Stochastic model for phase observations
Since the precision of carrier phase observations is much higher than that of pseudorange observations, carrier phase observations play the most significant role in phase-based positioning. Furthermore, due to the different contributions of code and phase DD multipath errors, we employ the variant of Eq. 10 to construct another C/N0-dependent stochastic model for carrier phase observations:
where
where
3 Experiments and results
3.1 Data collection
The experiment scenario is as shown in Figure 1. Three devices on parallel pillars were deployed to form two ultra-short baselines in an unobstructed sky environment. From left to right, two identical geodetic receivers (Topcon HIPER_SR) and one smartphone (Xiaomi 8) were mounted vertically, allowing the device to be continuously charged. The benchmark coordinate of each pillar was determined in advance by geodetic receivers in static model.
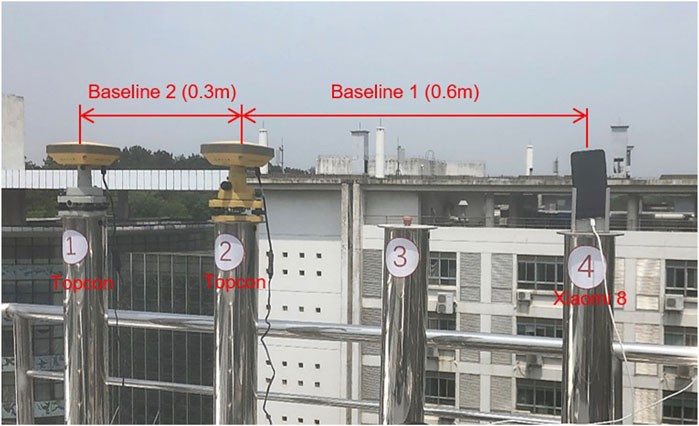
FIGURE 1. The setup of smartphone and geodetic receivers during data collection.
The GNSS observations from the smartphone were collected for 8 h with 1s interval using the GEO++ RINEX Logger ver.2.1.6 (Wübbena et al., 2018). Paziewski et al. (2021) and Wanninger and Heßelbarth (2020) found that the integer property of phase observations was easily destroyed mainly due to the contamination of the multipath and the observation noise. What’s more, despite the Xiaomi 8 is equipped with the dual-frequency GNSS chipset, the number of second signal (L5) which can be stably tracked is less than 5, as the sum of GPS IIF satellites transmitting the L5 signal is only 12. Due to this, we only took the GPS L1 as the experimental data in this work. It’s worth noting that the duty cycle is a mode in which the hardware clock is discontinuous, making the phase observations discontinuous (Linty et al., 2014). Fortunately, the duty cycle of the Xiaomi 8 used in this experiment can be turned off (Chen et al., 2019). Moreover, Netthonglang et al. (2019) determined the antenna reference point (ARP) of the Xiaomi 8 embedded GNSS antenna by averaging coordinates in northeast and east directions, which can be utilized to reduce the offset for the up component but neglect the horizontal components.
3.2 The C/N0 comparison between the smartphone and geodetic receiver
The C/N0 is essential for indicating the quality of the GNSS observations, as it is sensitive to the receiver hardware, propagation errors and satellites antenna (Hauschild et al., 2012). The Figure 2 shows the C/N0 as a function of satellites elevation for describing the signal properties of different equipment. We take this as an indication that there is a high positive correlation between the C/N0 and elevations for the geodetic receiver. In contrast, there seems to be no obvious correlation between the elevation and the C/N0 for the smartphone. The dispersion of the range at low elevations is obviously greater than the pattern at higher elevations (>50°). Due to the tiny size, the smartphone GNSS antenna gain varies little with the elevation angle, whereas the geodetic antenna gain varies closely with the incident angle. The findings are in line with the previous study reported by Paziewski et al. (2019). These can illustrate that the characteristics of smartphone signals are obviously different from that of the geodetic receiver.
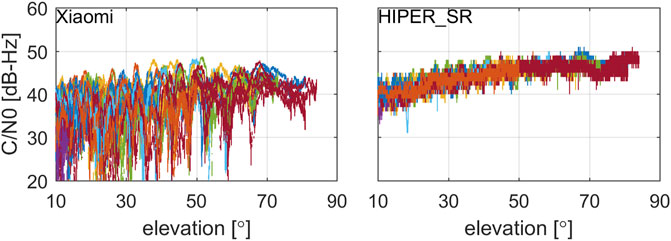
FIGURE 2. Measured C/N0 versus satellite elevation correspond to signals collected by Topcon HIPER_SR (right) and the Xiaomi 8 (left). Corresponding different satellites are distinguished by different colors.
In order to further analyze the signal strength, Figure 3 shows the frequency distribution histograms of C/N0 collected by the smartphone and the geodetic receiver. The C/N0 collected by the geodetic receiver fits in the range of 35–50 dB-Hz, only 1% of the values are less than 35 dB-Hz. Whereas in the case of the smartphone, these values fit in the range of 35–45 dB-Hz, only 4% of the values exceed 45 dB-Hz. What’s more, 20.0% of the values are lower than 35 dB-Hz. On the one hand, Figures 2, 3 demonstrate that the C/N0 of smartphone is about 5–10 dB-Hz weaker than that of the geodetic receiver at the same elevation angle. This also proves why we use 40 and 45 dB-Hz as the values of the
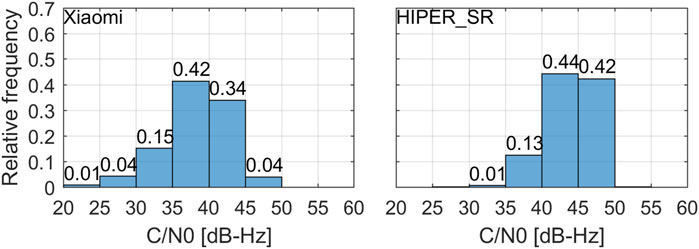
FIGURE 3. C/N0 frequency distribution histograms of GPS L1 collected by Topcon HIPER_SR (right) and the Xiaomi 8 (left). The relative frequencies were labeled on bins.
3.3 Noise assessment of pseudorange observations
Figure 4 depict residuals of C-L measurements for GPS PRN28 satellite computed from the geodetic receiver and the smartphone, respectively. The time series of the C/N0 and elevations are also presented in the bottom panel. In order to assess the magnitude of noise, the STD of the corresponding residual was used. The smartphone measurements are characterized with the STD of 2.96 m, the residuals fit the range of ±10 m. Whereas in the case of the geodetic receiver, those values are STD of 0.20 m and vary in the range of ±0.7 m. The Xiaomi 8 pseudorange observations are noisier by about one order of magnitude with respect to the Topcon HIPER_SR.
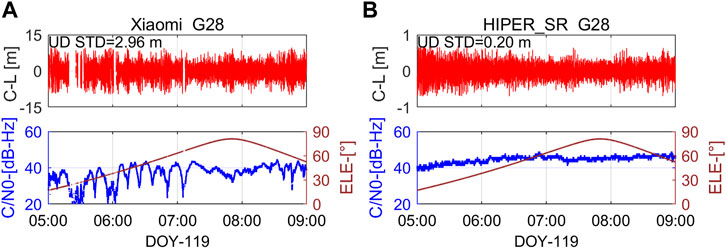
FIGURE 4. (A)Stand-alone Topcon code-minus-phase (C-L) measurements for GPS PRN28 on 29 April 2021. (B) Stand-alone Xiaomi 8 code-minus-phase (C-L) measurements for GPS PRN28 on 29 April 2021.
We further observed that the correlation between the smartphone noise and elevations is not obvious. For example, when the satellite elevation reaches its maximum (about 80°) at 7:50 UTC, the residuals are increasing slightly unexpectedly. While focusing on the C/N0 versus the residuals, the value of the residuals exhibits a decrease as a response to the increase of the C/N0. Therefore, the smartphone measurement errors have a stronger correlation with the C/N0 instead of elevations. Noticeably, the periodic effect is clearly visible and extremely unstable in the bottom pane, which is most likely caused by the multipath effect. These facts thereby explain why the C/N0 is more appropriate to indicate properties of smartphone signals instead of elevations.
Next, we attempt to evaluate the characteristic of pseudorange observation noise. Figure 5 shows the time series of DD C-L residuals for GPS L1 and the corresponding pseudo C/N0 using Eq. 6. The magnitude of the DD multipath is in line with the UD multipath, the time series share high similarity to previous results. By definition, the conclusions come from the UD measurements are also suitable for the DD measurements. Note that, the DD residuals were obtained from DD observations tracked by the geodetic receiver and the smartphone, which can reflect the sum of the smartphone and geodetic receiver noise. However, the smartphone observation noise is assumed to be an order of magnitude larger than that of the geodetic receiver, and the latter is consequently neglected. Hence, The DD observation residuals are predominately driven by the smartphone observations noise. As a result, even the baseline is formed by nonhomogeneous receivers in this work, we can still assess the characteristic of the smartphone observation noise. As expected, the STD of the smartphone is 4.88 m, which is only 0.46 m in the case of the geodetic receiver. Regardless of whether it is UD or DD, the pseudoranges of Xiaomi 8 are approximately ten times noisier than the Topcon HIPER_SR.
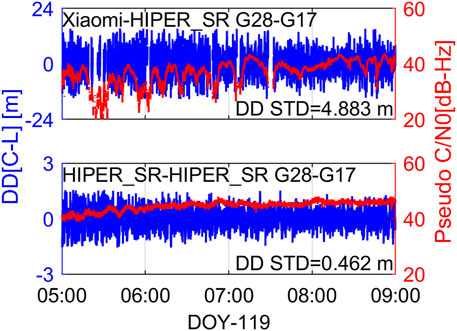
FIGURE 5. Double differenced code-minus-phase (C-L) residuals for GPS L1 on 29 April 2021.
3.4 Noise assessment of phase observations
Figure 6 shows the time series of DD phase residuals after subtracting the fitted low-order polynomial for GPS L1 and the corresponding pseudo C/N0. The STD of the DD residuals time series is 6 mm for the smartphone, while the value is 3 mm for the geodetic receiver. What’s more, owing to the frequent cycle slips and clock jumps are depicted as outliers (Paziewski et al., 2021), there are many gaps in the time series of the smartphone DD phase residuals compared with that of the geodetic receiver. These indicate the serious discontinuity of the smartphone phase observations. From the above, we have two key findings. First, the success rate of ambiguity resolution will be heavily degraded, even under the situation of duty-cycle off. Nearly all absences of data occurred at the moments where the C/N0 was low or exhibiting a sharp reduction. Second, it is worth noting that, the attenuation of smartphone phase noise is not as large as the pseudorange noise.
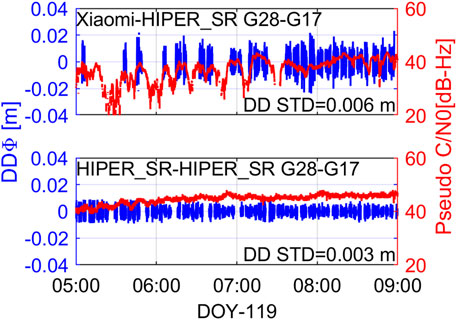
FIGURE 6. Double differenced phase (DD) residuals for GPS L1 on 29 April 2021.
3.5 C/N0-dependent stochastic model for pseudorange and phase observations
To verify the correctness of Eq. 11, Figure 7 present the data which encompasses all GPS L1 pseudorange observations over 8 h for the smartphone and geodetic receiver. Every point represents the STD of C-L measurements among 120 epochs. The red and blue line exhibit distributions of UD and DD STD, respectively. As expected, the lines fit well with the points over all distributed C/N0. For the short baseline (Xiaomi 8-Topcon HIPER_SR), the fitting precision for the UD (red) and DD (blue) fitting functions is 1.17 and 1.23 m, respectively. In addition, the corresponding value for the short baseline (Topcon HIPER_SR -Topcon HIPER_SR) is 0.05 and 0.11 m, respectively. Table 2 lists the fitted coefficients using UD C-L and DD C-L at special C/N0 for smartphone and geodetic receivers. Taking the DD C-L as example, the STD of smartphone code noise for 40 dB-Hz is 3.40 m, while the value is 0.40 m with respect to the geodetic receivers. The results illustrate that the code noise of Xiaomi 8 is approximately ten times greater than that of the geodetic receiver, which is also consistent with the analysis of C-L measurements in subsection 4.3. This also proves that it is feasible to use C-L linear combinations to fit the pseudorange observation noise.
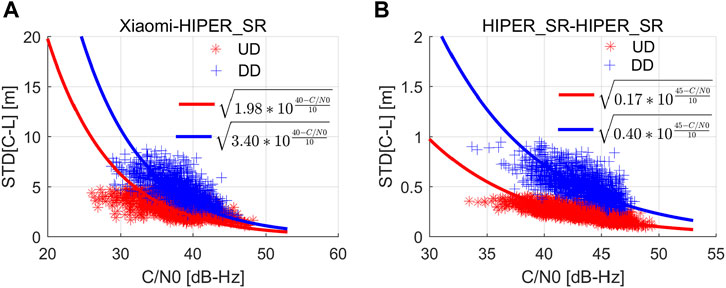
FIGURE 7. (A) UD and DD code-minus-phase (C-L) STD versus the measured C/N0 on short baseline (Xiaomi 8-Topcon HIPER_SR) for data segments of 120 s(B) UD and DD code-minus-phase (C-L) STD versus the measured C/N0 on short baseline (Topcon HIPER_SR-Topcon HIPER_SR) for data segments of 120 s.
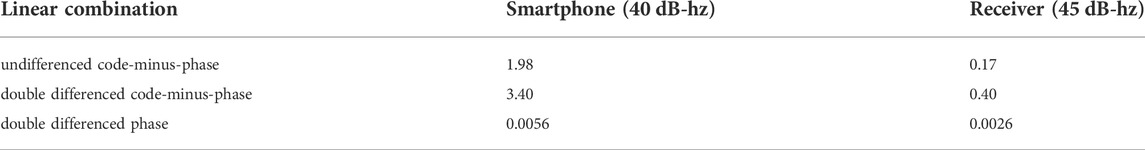
TABLE 2. Standard deviation (STD) of different linear combinations for Xiaomi 8 and Topcon (m).
Figure 8 present the distributions of carrier phase STD for the smartphone and the geodetic receiver, respectively. Similar to the pseudorange in fitting well with the data, the carrier phase fitting is also very good, which proves the reliability of the proposed model. For the short baseline (Xiaomi 8-Topcon HIPER_SR), the fitting precision for the and DD fitting functions is 0.0012 m. Besides, the corresponding value for the short baseline (Topcon HIPER_SR -Topcon HIPER_SR) is 0.0004 m. From the statistics given in Table 2, the STD of Xiaomi 8 carrier phase noise for 40 dB-Hz is 0.56 cm, the value of Topcon for 45 dB-Hz is 0.26 cm. It's worth mentioning that carrier phase observations of Xiaomi 8 are merely two times noisier than the geodetic receiver, which is consistent with the conclusions in subsection 4.3. The smartphone carrier phase noise is assumed to be two order of magnitude smaller than that of pseudoranges. These results explain why carrier phases are the key observations for high precision positioning rather than pseudoranges. To further verify the validity of the optimized C/N0 dependent stochastic model, we will turn to an analysis of SPP and RTK positioning solutions.
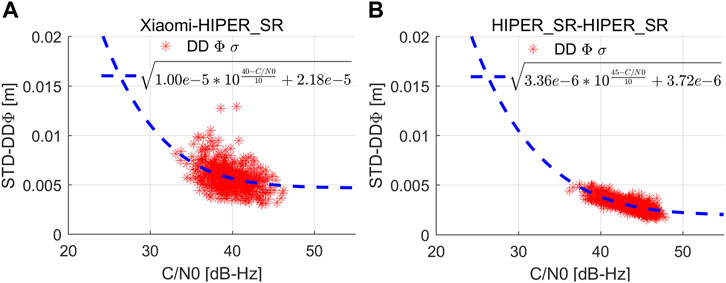
FIGURE 8. (A)Double differenced carrier phase (DD) STD versus the measured C/N0 on short baseline (Xiaomi 8-Topcon HIPER_SR) for data segments of 120 s. (B) Double differenced carrier phase (DD) STD versus the measured C/N0 on short baseline (Topcon HIPER_SR-Topcon HIPER_SR) for data segments of 120 s.
3.6 Positioning performance with optimized stochastic model
Based on the investigations of smartphone observations and stochastic model, the positioning performance of smartphones has been carried out extensively. To consolidate this work, we assessed the standard point positioning (SPP) and real-time kinematic (RTK) performance of smartphone under two baselines in 2 day, respectively. For the first day, the base station was set up at a geodetic control point 100 m away from the smartphone on 13 January 2021. For the other day, we use Continuously Operating Reference Stations (CORS) station in Nanjing Normal University to compose a 600 m baseline with the smartphone on 25 March 2021. The positioning performance are conducted with three stochastic models: 1) scheme 1 is the elevation-dependent stochastic model; 2) scheme 2 denotes the empirical C/N0-dependent stochastic model; 3) scheme 3 refers to the proposed optimized C/N0-dependent stochastic model. As the success rate of smartphone ambiguity resolution is fairly insufficient, we only investigate the positioning performance of RTK ambiguity-float solutions (Chen et al., 2019; Dabove and Di Pietra, 2019; Darugna et al., 2019).
Figure 9 visualizes the SPP results by Xiaomi 8 compared with the benchmark coordinates. The red, blue and green lines denote the positioning errors processed by schemes 1, 2 and 3, respectively. Tables 3 and 4 summarize the coordinate statistics of different positioning schemes. The root mean squares (RMS) for scheme 1 are (4.66, 4.02, 9.62) m and (4.56, 3.35, 8.67) m for north (N), east (E) and up (U) components on January 13 and March 25, respectively. In contrast, the values are (4.60, 3.33, 9.08) m and (4.05, 2.96, 7.85) m for scheme 3, with improvements of (1.29%, 17.16%, 5.61%) and (11.18%, 11.64%, 9.46%) for the N/E/U components when compared with scheme 1 on January 13 and March 25, respectively. In addition, the dispersion of red lines is larger than the blue lines, implying the STD values of scheme 3 with the improvements of (0.68%, 17.48%, 6.06%) and (15.61%, 12.01%, 17.89%) for the NEU components compared with scheme 1 on January 13 and March 25, respectively. The outcomes of scheme 2 are in reasonable agreement with scheme 3. These findings suggest that the C/N0-dependent stochastic model has better positioning performance for the smartphone with respect to the elevation-dependent models. It's worth noting that there is no differencing technique to eliminate high code noise in SPP experiments. Furthermore, considering scheme 3 and 2 are both based on C/N0, the SPP performance of the former cannot lead to accuracy enhancement with respect to the later.
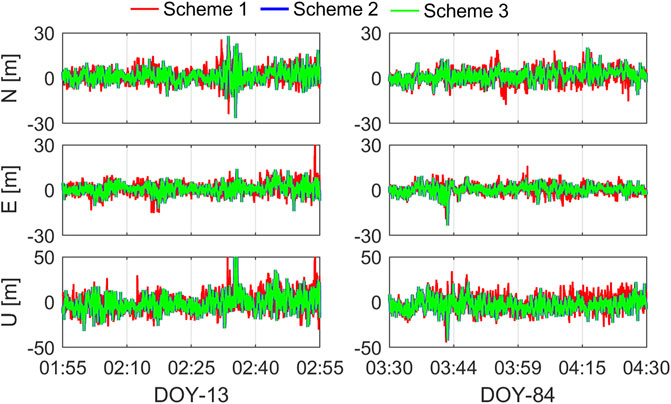
FIGURE 9. Positioning errors of standard point positioning with Xiaomi 8 on January 13 and March 25. The red, blue and green line denote three different stochastic models.
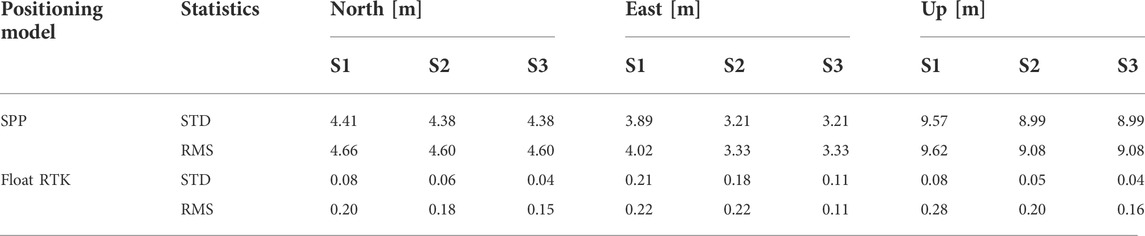
TABLE 3. Positioning performance of standard point positioning (SPP) and real-time kinematic (RTK) float solutions with Xiaomi 8 on 13 January 2021. STD denotes the standard deviation and RMS denotes the root mean square. S1 denotes the elevation stochastic model; S2 denotes the empirical C/N0 stochastic model; S3 denotes the optimized stochastic model.
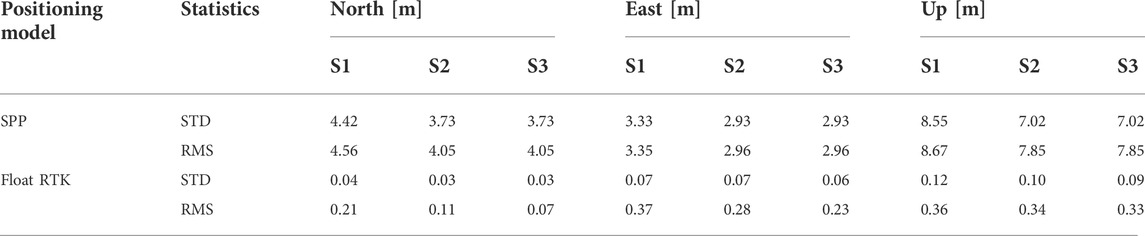
TABLE 4. Positioning performance of standard point positioning (SPP) and real-time kinematic (RTK) float solutions with Xiaomi 8 on 25 March 2021. STD denotes the standard deviation and RMS denotes the root mean square. S1 denotes the elevation stochastic model; S2 denotes the empirical C/N0 stochastic model; S3 denotes the optimized stochastic model.
Figure 10 shows the positioning errors of RTK float solutions compared with the known benchmark coordinates. Tables 3 and 4 prove that it is possible to achieve decimeter-level precision under reasonable environment for smartphone RTK. For scheme 1 on January 13 and March 25, the RMS errors are (0.20, 0.22, 0.28) m and (0.21, 0.37, 0.36) m for the N/E/U components, respectively. Compared with scheme 1 on January 13, the RMS errors of schemes 3 and 2 show the improvements of (25.00%, 50.00%, 42.86%) and (10.00%, 0.00%, 28.57%) for the N/E/U components, respectively. Likewise, the improvements are (66.67%, 37.84%, 8.33%) and (47.62%, 24.32%, 5.56%) for schemes 3 and 2 with respect to the scheme1 on March 25. Meanwhile, the STD errors of scheme 3 reach (0.04, 0.11, 0.04) m and (0.03, 0.06, 0.09) m for the N/E/U components on 2 days. Based on the statistics obtained, for scheme 3, not only the precision but also the accuracy has the best performance with respect to other schemes. The above results clearly depict that, scheme 3 is superior to scheme 1 and 2 for smartphone relative positioning, and scheme 2 is better than scheme 1.
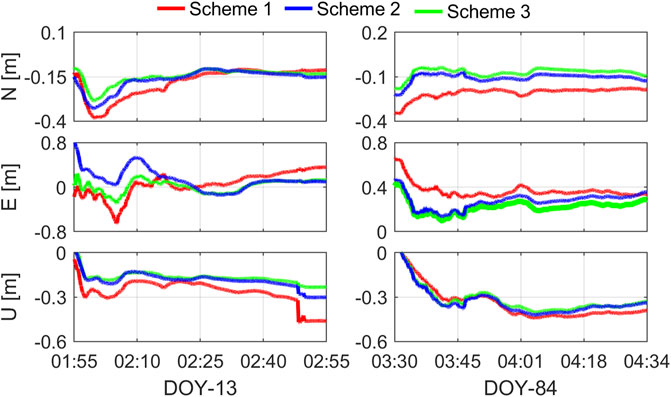
FIGURE 10. Positioning errors of real-time kinematic float solutions on January 13 and March 25. The red, blue and green line denote three different stochastic models.
4 Conclusion
In this study, we compared the quality of raw GNSS observations collected by the smartphone and geodetic receivers based on the C-L and DD linear combinations. According to the analyzed characteristics of the pseudorange and phase observations, an optimized C/N0-dependent stochastic model was proposed. Our study can be divided into the following three respects.
First, the analysis of C/N0 demonstrated a discernible discrepancy between the smartphone and geodetic receiver. Specifically, GPS C/N0 of Xiaomi 8 smartphones was approximately 5–10 dB-Hz lower than those of geodetic receivers. The strong correlation between the elevation and C/N0 was proved to be significant for geodetic receiver, but not valid for the smartphone. Second, the UD and DD C-L measurements based on the ultra-short baseline revealed that the code observation of Xiaomi 8 is about one order of magnitude noisier than that of Topcon receiver. While the phase observations of Xiaomi 8 are only two times noisier than that of Topcon receiver. Third, to verify the superiority of our model, the SPP and RTK were performed by taking advantage of the optimized C/N0 stochastic model and the customary models. With the use of the proposed model, the 3-dimensional RMS of SPP for the smartphone are 6.18 and 5.38 m on January 13 and March 25, with improvements of 6.22% and 10.02% compared with the elevation-dependent stochastic. Likewise, using the proposed model, the positioning accuracy of RTK float solutions are 0.14 and 0.24 m on January 13 and March 25, with improvements of 39.92% and 26.74% with respect to the elevation-dependent model. What’s more, the improvements are 29.41% and 10.06% compared with the empirical C/N0-dependent model on the corresponding days. As expected, the results suggest that the optimized C/N0-dependent stochastic model we proposed is superior to the elevation-dependent model and customary C/N0-dependent model for smartphone positioning.
Although the positioning using smartphone has been illustrated to achieve the decimeter-level positioning accuracy, there are still obstructions restricting the high-precision positioning for smartphone. Further efforts should be made, such as to explore the determination of phase center offset and the integer ambiguity resolution of smartphone phase observation. Brunner et al., 1999, Zhang et al., 2017.
Data availability statement
The original contributions presented in the study are included in the article/supplementary material, further inquiries can be directed to the corresponding author.
Author contributions
MS proposed and validated the improved method and wrote the paper; CG collected and made initial processing of the experiment data; FS provided supervision and polished the paper; all of the authors contributed to the discussion.
Funding
This work was funded by the National Natural Science Foundation of China (No. 41904018, No. 42077003), Natural Science Foundation of Jiangsu Province (No. BK20201374) and Laboratory of Land Satellite Remote Sensing Application, Ministry of Natural Resources of the People’s Republic of China(2022).
Conflict of interest
The authors declare that the research was conducted in the absence of any commercial or financial relationships that could be construed as a potential conflict of interest.
Publisher’s note
All claims expressed in this article are solely those of the authors and do not necessarily represent those of their affiliated organizations, or those of the publisher, the editors and the reviewers. Any product that may be evaluated in this article, or claim that may be made by its manufacturer, is not guaranteed or endorsed by the publisher.
References
Banville, S., and Van Diggelen, F. (2016). Precise positioning using raw GPS measurements from Android smartphones. GPS World 27 (11), 43.
Braasch, M. S., and Van Dierendonck, A. (1999). GPS receiver architectures and measurements. Proc. IEEE 87 (1), 48–64. doi:10.1109/5.736341
Brunner, F., Hartinger, H., and Troyer, L. (1999). GPS signal diffraction modelling: The stochastic SIGMA-Δ model. J. Geod. 73 (5), 259–267. doi:10.1007/s001900050242
Chen, B., Gao, C., Liu, Y., and Sun, P. (2019). Real-time precise point positioning with a Xiaomi MI 8 android smartphone. Sensors 19 (12), 2835. doi:10.3390/s19122835
Dabove, P., and Di Pietra, V. (2019). Single-baseline RTK positioning using dual-frequency GNSS receivers inside smartphones. Sensors 19 (19), 4302. doi:10.3390/s19194302
Darugna, F., Wübbena, J., Ito, A., Wübbena, T., Wübbena, G., and Schmitz, M. (2019). “RTK and PPP-RTK using smartphones: From short-baseline to long-baseline applications,” in Proceedings of the 32nd international technical meeting of the satellite, Miami, Florida, USA (Manassas, Virginia: Division of The Institute of Navigation), 3932.
de Bakker, P. F., Tiberius, C. C., Van Der Marel, H., and van Bree, R. J. (2012). Short and zero baseline analysis of GPS L1 C/A, L5Q, GIOVE E1B, and E5aQ signals. GPS Solut. 16 (1), 53–64. doi:10.1007/s10291-011-0202-3
de Bakker, P. F., van der Marel, H., and Tiberius, C. C. (2009). Geometry-free undifferenced, single and double differenced analysis of single frequency GPS, EGNOS and GIOVE-A/B measurements. GPS Solut. 13 (4), 305–314. doi:10.1007/s10291-009-0123-6
Eueler, H.-J., and Goad, C. C. (1991). On optimal filtering of GPS dual frequency observations without using orbit information. Bull. Geod. 65 (2), 130–143. doi:10.1007/bf00806368
Fu, G. M., Khider, M., and van Diggelen, F. (2020). “Android Raw GNSS measurement datasets for precise positioning,” in Proceedings of the 33rd international technical meeting of the satellite division of the Institute of Navigation, 1925.
Gao, R., Xu, L., Zhang, B., and Liu, T. (2021). Raw GNSS observations from Android smartphones: Characteristics and short-baseline RTK positioning performance. Meas. Sci. Technol. 32 (8), 084012. doi:10.1088/1361-6501/abe56e
Håkansson, M. (2019). Characterization of GNSS observations from a nexus 9 android tablet. GPS Solut. 23 (1), 21–14. doi:10.1007/s10291-018-0818-7
Hartinger, H., and Brunner, F. (1999). Variances of GPS phase observations: The SIGMA-ɛ model. GPS Solut. 2 (4), 35–43. doi:10.1007/pl00012765
Hauschild, A., Montenbruck, O., Sleewaegen, J.-M., Huisman, L., and Teunissen, P. J. (2012). Characterization of compass M-1 signals. GPS Solut. 16 (1), 117–126. doi:10.1007/s10291-011-0210-3
King, R. (1995). Documentation for the GAMIT GPS analysis software. Cambridge: Mass Inst of Technol.
Linty, N., Presti, L. L., Dovis, F., and Crosta, P. (2014). Performance analysis of duty-cycle power saving techniques in GNSS mass-market receivers.” in IEEE/ION position, location and navigation symposium-PLANS 2014. IEEE, 1096.
Liu, W., Shi, X., Zhu, F., Tao, X., and Wang, F. (2019). Quality analysis of multi-GNSS raw observations and a velocity-aided positioning approach based on smartphones. Adv. Space Res 63 (8), 2358–2377. doi:10.1016/j.asr.2019.01.004
Netthonglang, C., Thongtan, T., and Satirapod, C. (2019). GNSS Precise positioning determinations using smartphones.” in IEEE Asia Pacific conference on circuits and systems (APCCAS). IEEE, 401.
Paziewski, J., and Crespi, M. (2020). High-precision multi-constellation GNSS: Methods, selected applications and challenges. Meas. Sci. Technol. 31 (1), 010101. doi:10.1088/1361-6501/ab20a6
Paziewski, J., Fortunato, M., Mazzoni, A., and Odolinski, R. (2021). An analysis of multi-GNSS observations tracked by recent Android smartphones and smartphone-only relative positioning results. Measurement 175, 109162. doi:10.1016/j.measurement.2021.109162
Paziewski, J. (2020). Recent advances and perspectives for positioning and applications with smartphone GNSS observations. Meas. Sci. Technol. 31 (9), 091001. doi:10.1088/1361-6501/ab8a7d
Paziewski, J., Sieradzki, R., and Baryla, R. (2019). Signal characterization and assessment of code GNSS positioning with low-power consumption smartphones. GPS Solut. 23 (4), 98–12. doi:10.1007/s10291-019-0892-5
Pesyna, K. M., Heath, R. W., and Humphreys, T. E. (2014). “Centimeter positioning with a smartphone-quality GNSS antenna,” in Proceedings of the 27th international technical meeting of the satellite (Manassas, Virginia: Division of The Institute of Navigation), 1568–1577.
Wanninger, L., and Heßelbarth, A. (2020). GNSS code and carrier phase observations of a Huawei P30 smartphone: Quality assessment and centimeter-accurate positioning. GPS Solut. 24 (2), 64–69. doi:10.1007/s10291-020-00978-z
Wübbena, T., Darugna, F., Ito, A., and Wübbena, J. (2018). “Geo++'s experiments on android GNSS raw data,” in Proceedings of the GNSS raw measurements taskforce workshop, Prague, Czechoslovakia (Washington: GSA Headquarters).
Yuan, H., Zhang, Z., He, X., Li, G., and Wang, S. (2022). Stochastic model assessment of low-cost devices considering the impacts of multipath effects and atmospheric delays. Measurement 188, 110619. doi:10.1016/j.measurement.2021.110619
Zhang, X., Li, X., and Li, Pan. (2017). Review of GNSS PPP and its application. Acta Geod. Cartogr. Sinica 46 (10), 1399. doi:10.11947/j.AGCS.2017.20170327
Zhang, X., Tao, X., Zhu, F., Shi, X., and Wang, F. (2018). Quality assessment of GNSS observations from an android N smartphone and positioning performance analysis using time-differenced filtering approach. GPS Solut. 22 (3), 70–11. doi:10.1007/s10291-018-0736-8
Keywords: smartphone, GNSS positioning, stochastic model, carrier-noise-ratio, code-minus-phase observation, double-differenced measurement
Citation: Sui M, Gong C and Shen F (2022) An optimized stochastic model for smartphone GNSS positioning. Front. Earth Sci. 10:1018420. doi: 10.3389/feart.2022.1018420
Received: 13 August 2022; Accepted: 07 September 2022;
Published: 27 September 2022.
Edited by:
Mourad Bezzeghoud, Escola de Ciência e Tecnologia, Universidade de Évora, PortugalCopyright © 2022 Sui, Gong and Shen. This is an open-access article distributed under the terms of the Creative Commons Attribution License (CC BY). The use, distribution or reproduction in other forums is permitted, provided the original author(s) and the copyright owner(s) are credited and that the original publication in this journal is cited, in accordance with accepted academic practice. No use, distribution or reproduction is permitted which does not comply with these terms.
*Correspondence: Fei Shen, c2hlbi5mQG5qbnUuZWR1LmNu