- 1Hainan Key Laboratory of Marine Geological Resources and Environment, Haikou, China
- 2Marine Geological Institute of Hainan Province, Haikou, China
- 3Key Laboratory of Ocean and Marginal Sea Geology, South China Sea Institute of Oceanology, Chinese Academy of Sciences, Guangzhou, China
- 4Department of Geology, University of Vienna, Vienna, Austria
Summing fault heaves is the most commonly used method to evaluate upper crustal thinning. However, since fault deformation width (W) is often assumed as a constant in the range of 75–150 km, the stretching factor estimated from fault geometry (βf) accompanies significant uncertainty. Here we propose a new approach to determine brittle stretching factors on the foundation of numerical analyses of W and further compare our results to previous methods, with specific reference to the central part of Qiongdongnan Basin, South China Sea (SCS). Our results suggest that the value of W is generally less than 80 km and mostly less than 50 km in the northern SCS margin. We confirm that applying an overestimated value of W can lead to an underestimated amount of fault-related extension and overstatement of extension discrepancy in the rifted margin. Results also indicate an inverse discrepancy with our new method in the southeast of the basin. The difference in syn-rift sediment thickness across the rifted margin likely drove the lower crust flow causing a transition between inverse and positive extension discrepancies.
1 Introduction
Rifted margins are the result of thinning and breakup processes of the continental lithosphere, leading to the formation of new oceanic lithosphere. The upper crust shows complex structural patterns inherited from brittle deformation, ductile deformation, and subsidence. Fault geometry and polyphase faulting may be impacted by interactions with lower crust and mantle melting as well as mantle exhumation. This makes it challenging to resolve the crustal extension with fault growth and further understand potential hazardous earthquakes and related mechanisms of economically important hydrocarbon accumulations (Peron-Pinvidic and Manatschal, 2019; Sapin et al., 2021). Stretching factor (β) is a key parameter to quantify the amount of thinning. Previous studies revealed that the stretching factor measured from fault heaves (βf, Table 1) is far less than that determined by crustal thinning and subsidence analyses in rifted continental margins (Ziegler, 1983; Driscoll and Karner, 1998; Davis and Kusznir, 2004; Kusznir and Karner, 2007). This phenomenon is defined as extension discrepancy, which has been widely reported, including around the northern South China Sea (SCS) margins (Clift et al., 2002; Tsai et al., 2004; Bai et al., 2019). However, this discrepancy has remained a matter of controversy. Some authors argue that no such discrepancy exists, i.e., recognized faults are insufficient to evaluate the total amount of upper crust extension (Walsh et al., 1991; Reston, 2007; Crosby et al., 2008). There are studies, indicating that the discrepancy might be induced by unrecognized polyphase faulting (Reston, 2005), top basement faulting (Reston, 2009), and sequential faulting (Ranero and Perez-Gussinye, 2010). Furthermore, the method to calculate the stretching factor on basis of the fault heaves are highly dependent on the fault deformation width, which is not well constrained.
The practical method proposed by Davis and Kusznir (2004) to estimated βf in the reference frame of the extended continental lithosphere is given by
where x is horizontal coordinate; x0 is fault location coordinate measured from the seismic profile; β0 is a constant determined numerically after substituting Eq. 1 into Eq. 2; E is the amount of extension which is also measured from the profile; W is fault deformation width; which is built on basis of an assumption that W is known as a constant in the range of 75–150 km (Roberts et al., 1993; Davis and Kusznir, 2004). Whereas, the assumption ends up with same values of βf among different faults, as long as E and W stay constant. For instance, on the condition of same amount of extension, low-angle normal fault in deep-water and steep fault in shallow water share the same values of βf. This error in estimating brittle extension, in turn, questions the extension discrepancy. Therefore, better constraints on upper crustal thinning are required. In this study, we propose a new approach to brittle extension on the foundation of numerical analyses of W. We verify our approach by comparing it to conventional methods. Our new methods are applied to the central part of Qiongdongnan Basin which was magma-poor during rifting with no obvious evidences of asthenospheric melting (Clift and Sun, 2006). The optimization of W is aimed at improving the estimation accuracy of the upper crustal thinning and further investigations of both positive and negative extension discrepancies.
2 Geological setting
The SCS is the largest marginal sea in the west Pacific and surrounded by the Eurasian, Pacific and Indian Plates. The tectonically complex history was due to its position, affected by the opening of SCS (Taylor and Hayes, 1983; Briais et al., 1993), Red River strike-slip fault (Tapponnier et al., 1990; Leloup et al., 2001; Morley, 2002; Searle, 2006), oblique compression of Philippine Plate (Rangin, 1991; Hall et al., 1995), and back-arc spreading associated with the subduction of Pacific Plate to Eurasian Plate (Taylor and Hayes, 1980; Packham, 1996). Multi-stage rifting processes have taken place in the northern SCS margin, which transformed from active continental margin in the Mesozoic to passive margin in the Cenozoic (Savva et al., 2014). Due to a lack of seaward dipping reflectors (Barckhausen and Roeser, 2004; Franke et al., 2014; Brune et al., 2016), the northern SCS margin was classified into non-volcanic margin. With an advance in understanding of seismic and drilling data, the opinion about rifting-related magmatism is changing recently (Larsen et al., 2018; Sun et al., 2018; Ding et al., 2020; Li et al., 2022). However, general consensus so far is that the margin was not as magma-rich as NE Atlantic margins. The northern margin ranging from the South China Block to the oceanic crust of SCS covers a total width of over 400 km (Figure 1A). Three NE-trending extensional basins spread from east to west; Taixinan Basin, Zhujiangkou Basin and Qiongdongnan Basin.
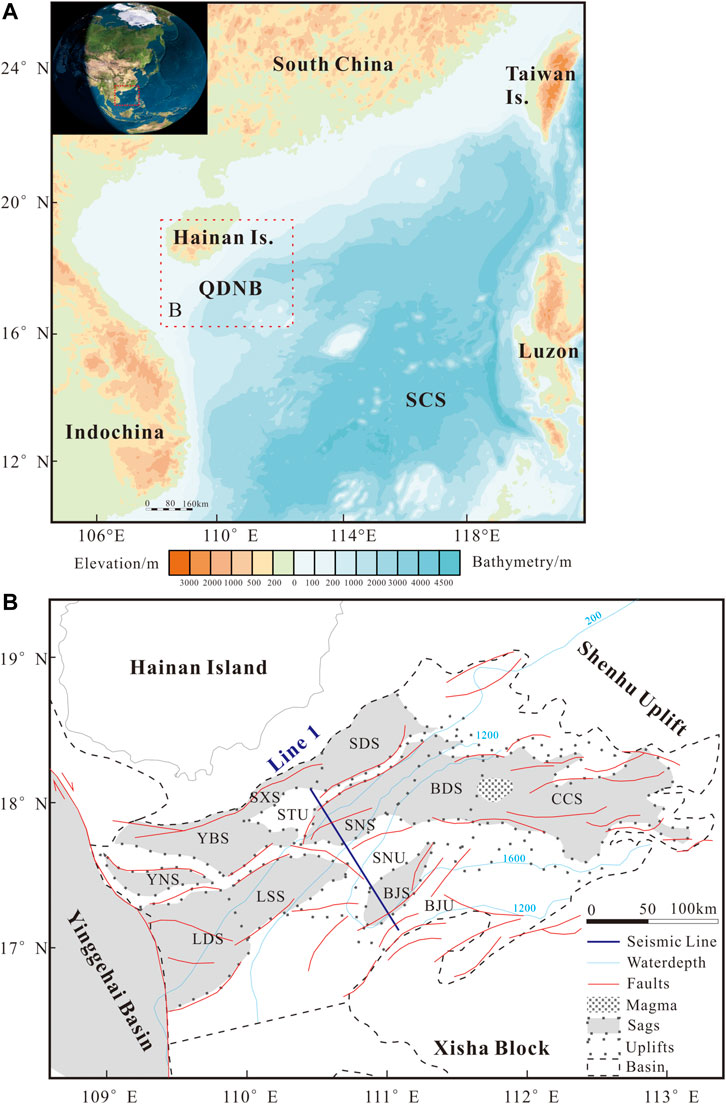
FIGURE 1. (A) Topography and bathymetry of the South China Sea (SCS) in the western Pacific. (B) Structural map of the Qiongdongnan Basin (QDNB; see location in Figure 1A). Location of a deep-reflection multichannel seismic profile (Line 1) across the central part of QDNB is shown. YNS, Yacheng Nan Sag; YBS, Yacheng Bei Sag; SXS, Songtao Xi Sag; SDS, Songtao Dong Sag; LDS, Ledong Sag; LSS, Liushui Sag; SNS, Songtao Nan Sag; BDS, Baodao Sag; CCS, Changchang Sag; BJS, Beijiao Sag.
The Qiongdongnan Basin on the northwest continental slope of SCS is located between Hainan Island in the northwest and the Xisha block in the southeast, which is featuring a narrow shelf and slope (Figure 1). The water depth deepens dramatically from 200 to 1,200 m at the Center Depression. The syn-rifting stage occurred from ∼45 Ma to ∼23 Ma, followed by the post-rift period. The unconformity formed at ∼23 Ma separates the basin evolution into two distinct stages: Paleocene, Eocene and Oligocene syn-rifting and Early Miocene to Quaternary post-rifting (Zhang et al., 2013). The syn-rift stage is characterized by well-developed NE-trending faults. In the eastern part, however, nearly EW-trending faults are present and rift-related magmatism was reported in the Changchang Sag (Figure 1B). In the western part, a large scale detachment fault cutting the Moho was identified, which is connected to the adjacent Red River Fault Zone (Zhao et al., 2018). Previous studies have focused on the distinct differences between the eastern and western Qiongdongnan Basin, including but not limited to structure (Zhang et al., 2013), sedimentation, subsidence (Zhao et al., 2013) and mechanism (Zhao et al., 2015).
3 Materials and methods
3.1 Seismic data
The deep-reflection multichannel seismic Line 1, provided by China National Offshore Oil Corporation, was chosen for this study (see location in Figure 1B). The profile is perpendicular to the structural strike and well-developed faults in the central part of Qiongdongnan Basin. Eighteen planar normal faults (F1 to F18; Figure 2) developed during the rifting were identified, which show variability in dips and sizes. F18 at the southeast end is the largest fault with greatest offset and low-angle dip. F3, F13, and F15 have steeper dip angles with θ > 50°. These faults, tilting SE and NW, compose a graben and half-grabens which exhibit features of both symmetric and asymmetric geometry. The profile recorded reflectors of the stratigraphic unconformities and Moho depth with discontinuity. The unconformities at S100 (∼45 Ma) and S60 (∼23 Ma) correspond to the start and end of the syn-rifting, respectively.
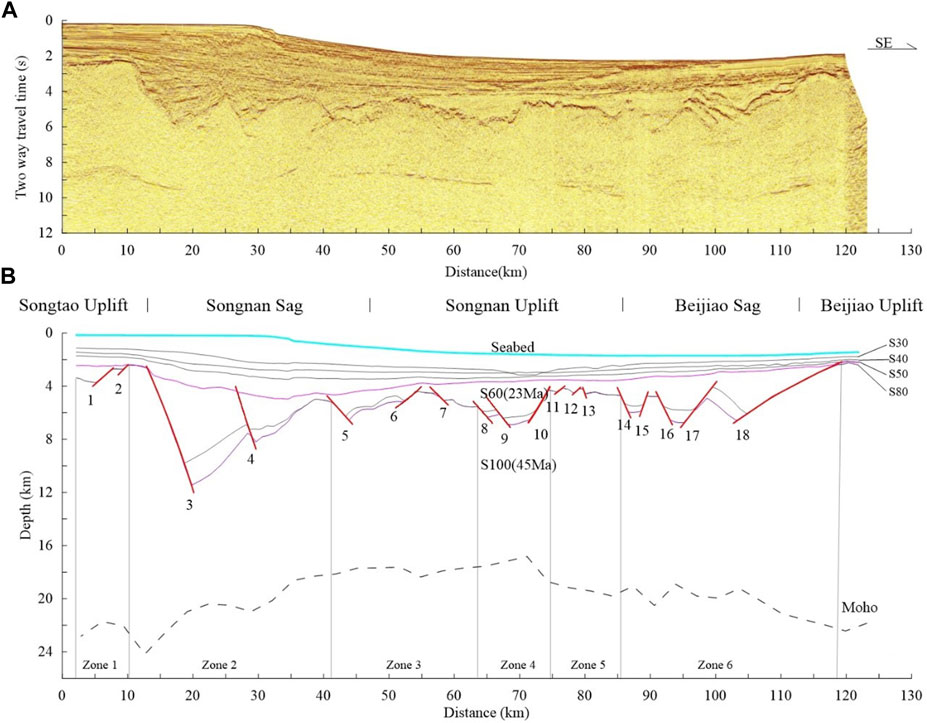
FIGURE 2. (A) Seismic profile of Line 1 (see location in Figure 1B). (B) Interpretation of Line 1 showing the Moho depth, major unconformities (S100–S30), and overall recognized 18 planar normal faults tilting SE and NW (F1 to F18). The unconformities of S100 (∼45 Ma) and S60 (∼23 Ma) are indicated.
3.2 Stretching factor evaluation with new method
3.2.1 Initial model setup
In the 2D model of brittle upper crust (Figure 3A), the instantaneous stretching is supposed as two results: brittle layer connected (Figure 3B) and disconnected (Figure 3C). The rotation of faults or beds (i.e., the dip maintains during thinning) was not counted for this model, as the brittle faults in deformation response incline to vertical shear, rather than the domino-style (Anderson, 1951; Westaway and Kusznir, 1993; Davis and Kusznir, 2004).
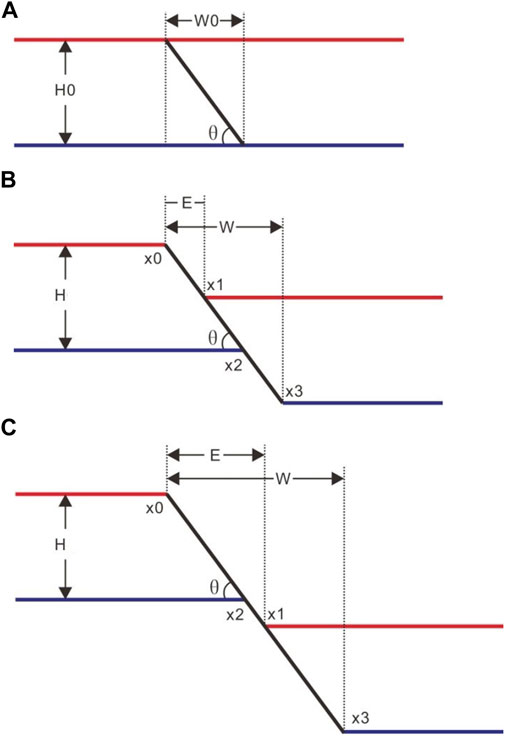
FIGURE 3. 2D model sketch to show the deformation of normal fault. (A) The initial (Andersonian) fault break. (B) Brittle layer displaced and connected. (C) Brittle layer displaced and disconnected, where H0 is the initial layer thickness, θ is fault dip, E is extension amount, W is fault deformation width, W0 is the initial width and x0 to x3 are horizontal co-ordinate of breakpoints, respectively. To simplify, the flexure response to gravity and loads is not showing. These equally apply to both brittle curved faults and bending layers, and do not affect the formula presented.
The stretching factor β is defined as the ratio of the final length to the initial length by Mckenzie (1978), which is shown in Figure 3:
Figure 3A shows the simple trigonometry:
From the geometry illustrated in Figures 3B,C, if taken x0 = 0:
Thus, substituting Eqs 4, 5 into Eq. 3 yields the average β:
Hence, both values of deformation width (W) and stretching factor (β) are highly dependent on the initial brittle crustal thickness and fault attitude. W is positively proportional to initial layer thickness (H0) and extension amount (E), and inversely proportional to dip (θ). β is the opposite of W.
Given that H is the layer thickness after stretching, x0 = 0, x1 = E, x2 = H0/tanθ and x3 = x2+E, H in case of fault displaced and connected (Figure 3B), is determined:
H where fault displaced and disconnected (Figure 3C) is as follows:
Combined with Eqs 7, 8, any horizontal coordinate (x) is given on account of the fact that measured vertical lengths are more reliable than horizontal lengths (Davis and Kusznir, 2004):
3.2.2 Parametric analysis
Quantitative analysis of W and β in different faulting geometries was conducted by applying Eqs 5–9, respectively. Sensitivity analysis of each individual parameter (H0, θ, E) based on Eqs 6–9 is given in Supplementary Figures S1–S3. H0 was examined from 5 km to 50 km with an increment of 5 km at each step in Figures 4, 5. At thicknesses over 50 km, a change of H0 had little impact on the outcome (Supplementary Figure S1).
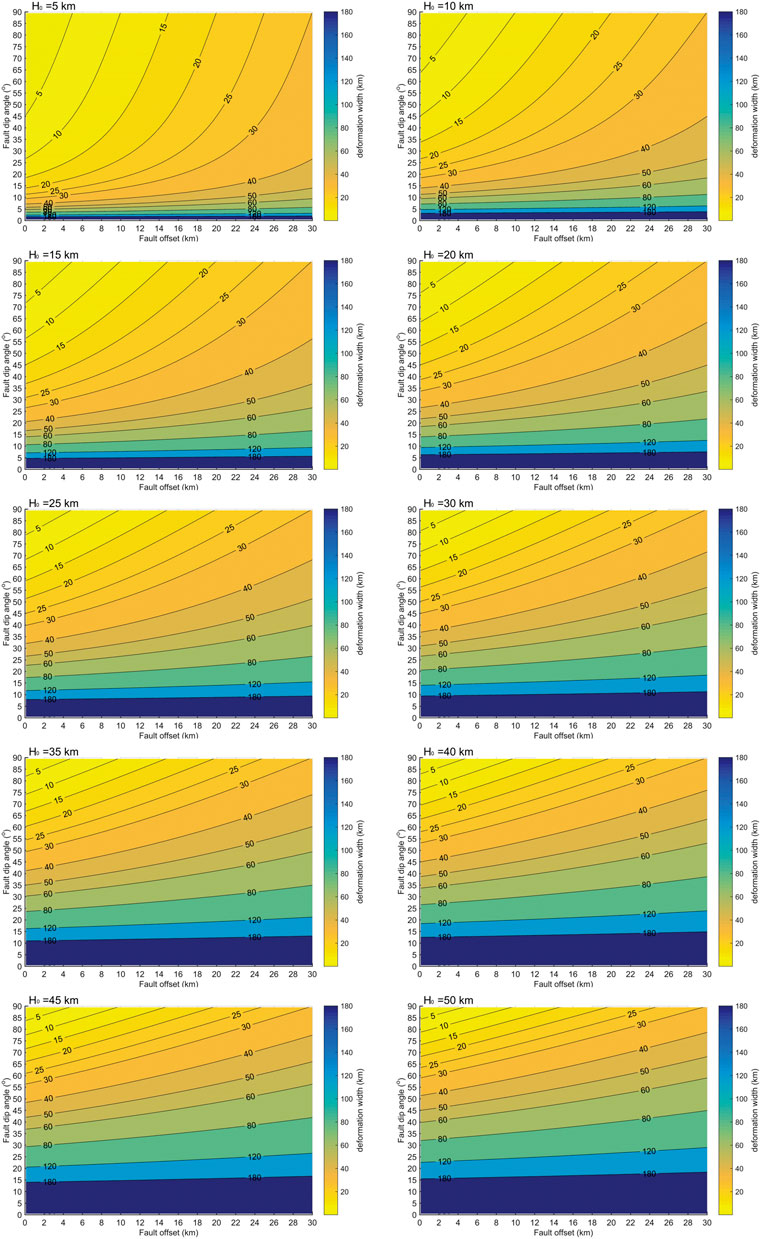
FIGURE 4. Comparison of deformation width (W) contour-plots in the parameter domain space (dip-offset) are shown at H0 = 5 km, 10 km, 15 km, 20 km, 25 km, 30 km, 35 km, 40 km, 45 km, and 50 km.
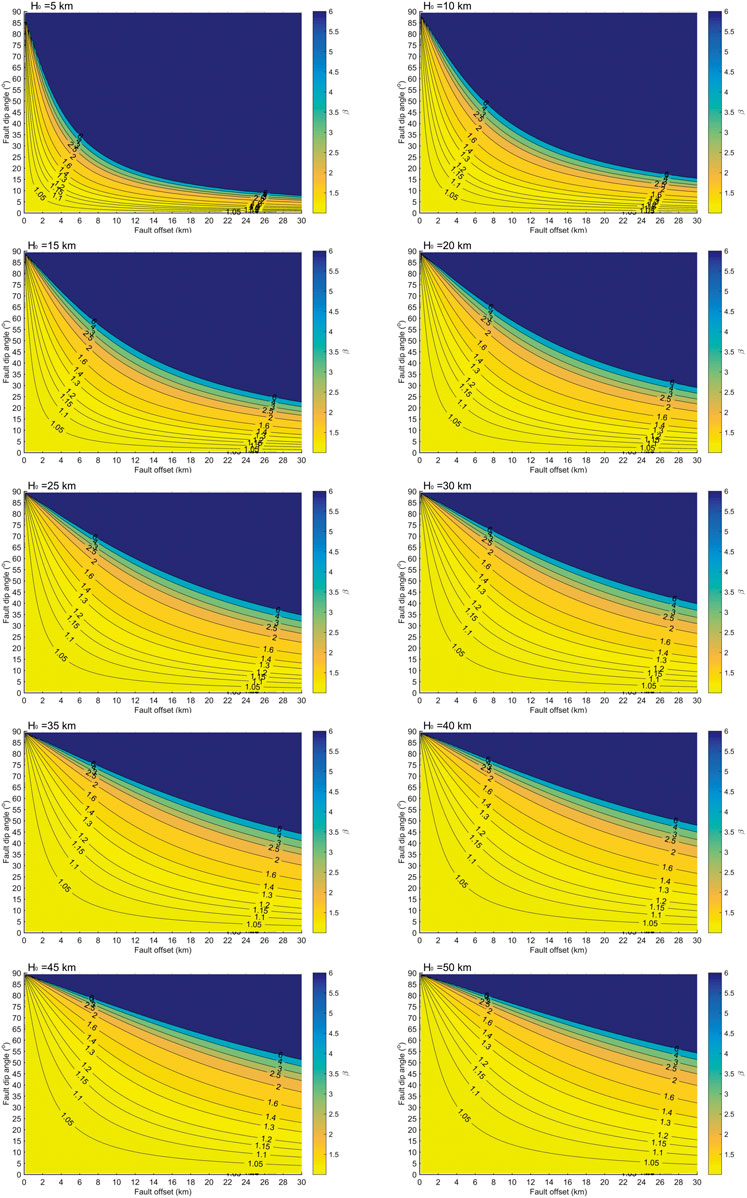
FIGURE 5. Comparison of β contour-plots in the parameter domain space (dip-offset) are shown at H0 = 5 km, 10 km, 15 km, 20 km, 25 km, 30 km, 35 km, 40 km, 45 km, and 50 km.
Figure 4 presents plots of varying W values in the parameter domain space (dip-offset) with a set of initial thickness values (H0 = 5, 10, ..., 50 km). The contour-plots show that the deformation width increases with the initial thickness in general. But it highlights that H0 has limited effect on W after H0 = 30 km. When H0 = 5 km–20 km, W changes exponentially at the central of the domain and linearly at the upper left and bottom of the domain. Specifically, in the case of H0 = 5 km, W is a single variable with dip when (θ < 5°). As the dip goes steeper (5°< θ < 12°), W is linear increasing with offsets at beginning (E < 10 km), then this trend changes to exponential growth. As long as θ > 45°, the trend converts back into linear growth. Overall, the exponential changes gradually to linear as H0 increases. After H0 reaches 40 km, the contours of W are characterized by linearly distribution. In practice, the value of W of subhorizontal listric fault should be larger than 120 km whether large or small scale (Figure 4 H0 = 10 km).
Figure 5 depicts β values in the parameter domain space (dip-offset) with the same set of initial thickness values (H0 = 5, 10, ..., 50 km). The contour-plots show that β decreases rapidly with increasing H0 = 5–30 km, then decreases slowly. With an increasing H0, β shows a transition from exponential decline to linear decline curves, particularly in the upper right part of the domain. In practice, high angle normal faults with small scale and low angle faults of large offsets achieve the same degree of thinning.
3.2.3 β function
White and McKenzie (1988) expressed β with a Gaussian function. On the basis of E measured from fault heaves, β(x) is mapped to a profile of β applying the continuous cosine function Eq. 1 (Davis and Kusznir, 2004). The form and width of the function, which does not alter the total extensions, are arbitrary and not critical (Davis and Kusznir, 2004). Based on these previous studies and line-types of β curves shown in Supplementary Figures. S1–S3, we choose a sine function after comparing with Eq. 1, which is defined as:
Replacing W in Eq. 10 by Eq. 5 gives the βw as follows:
As it is shown in Figure 6, the calculated curves using Eq. 11 are generally consistent with corresponding curves estimated from Eq. 9, slightly higher in the middle and lower in both flanks. This numerical approach incorporates the role of fault deformation width (W), which is neglected in the early model and leads to an underestimation of upper crustal stretching factor. This difference has implication on the evolution and development of rifted basins and margins. Moreover, faults are assumed to be planar in the model of Davis and Kusznir (2004). Since listric faults are common in the Qiongdongnan Basin as shown in Line 1 (Figure 2), this sine function is adequate to approximate faulting patterns in the study area.
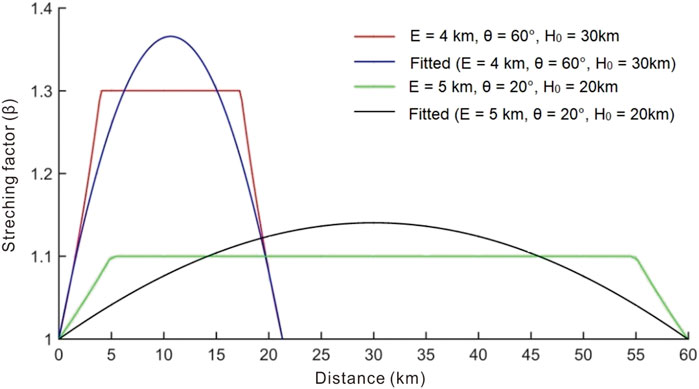
FIGURE 6. Two β profiles generated by Eq. 9 under the given of two parameter sets are shown in red and green, respectively. The best fit β curves by Eq. 11 with the corresponding parameter sets are presented in blue and black.
3.3 Stretching factors of upper and whole crust in the central part of Qiongdongnan Basin
The stretching factors of the upper crust (βuc) along Line 1 are estimated using three methods: the aforementioned method (βw), as well as methods based on fault geometry (βf) (Davis and Kusznir, 2004) and zone division (βz) (Zhao et al., 2018). Parameters for each fault and zone (Figure 2B) are given in Table 2.
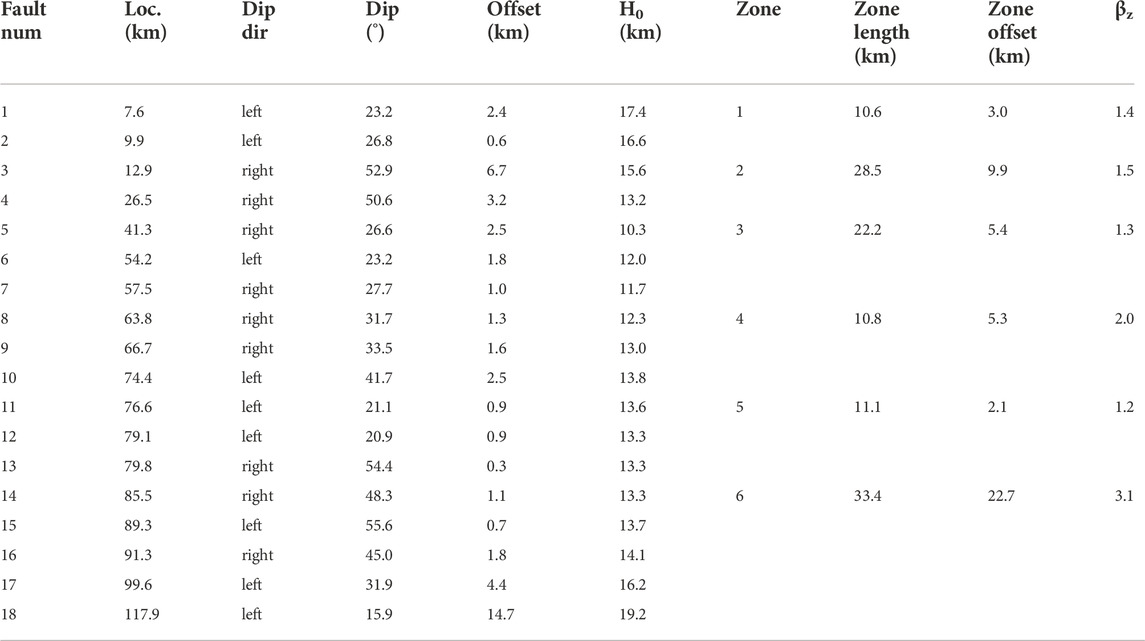
TABLE 2. Parameters of faults (F1 to F18 in Line 1; see location in Figure 2). Zone length, zone offset and βz of six zones (Figure 2B) are provided.
In Eqs 5–9, the initial thickness of the brittle layer (H0) is unknown. It is usually infeasible to estimate, because the transition of brittle and ductile crust is difficult to identify on the seismic profile. To assess the range of reasonable values, we propose 10 km as the H0 minimum, which corresponds to ∼33% of the initial whole crust thickness in the west of Qiongdongnan Basin (∼22–40 km; Zhao et al., 2018) as the case of the northern SCS at the Early Cenozoic suggested by Dong (2020). It also conforms to the 10–15 km range suggested for the transition depth of brittle and ductile crust in the present South China Block (Zuber et al., 1986; Clift et al., 2001). Furthermore, since faults do not cut through the Moho as shown in Figure 2A, thus we propose the present crust thickness (CT) at the breaking point (x2 in Figures 4B,C) on the footwall as the H0-maxima (Table 1; for H0 = CT in Figure 7A). In Eqs 1, 2, since W has been assumed ranging of 75–150 km, we also evaluate W at 150 km and 75 km. To account for the unrecognized or small-scale faults below the seismic resolution, the amount of fault heaves (βf) is increased by 40% (Walsh et al., 1991).
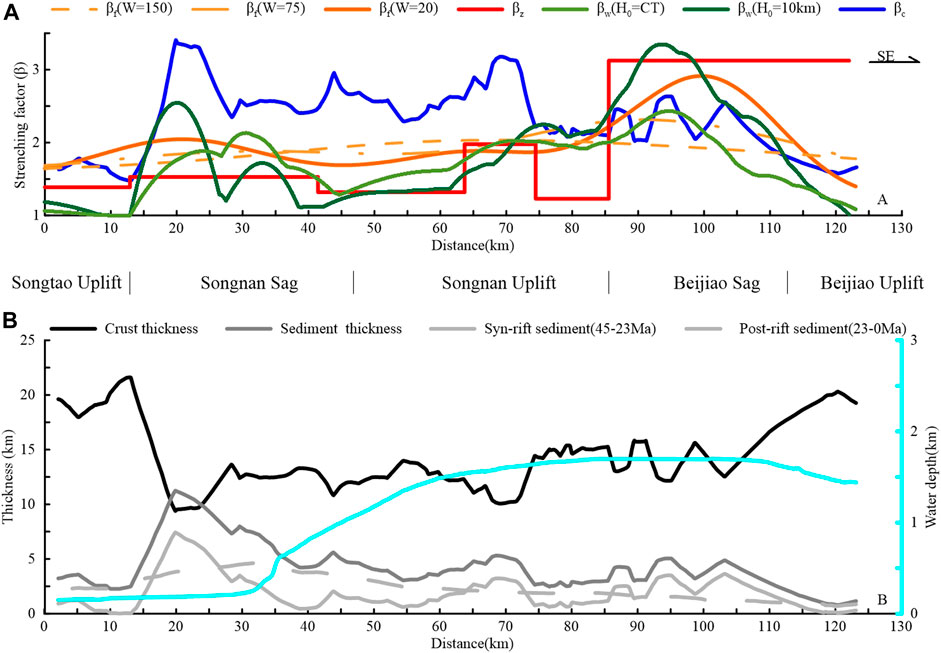
FIGURE 7. (A) β-Profiles along Line 1, evaluated by different methods and parameters. (B) Crust thickness, sediments thickness and water depth along Line 1. Sediment thicknesses of the total, syn-rift and post-rift are shown. The crust thinned sharply from 21.6 to 9.4 km over a ∼7 km distance at the north of Songnan Sag, which corresponds to the transition of thickest to thinnest crust.
The whole crust stretching factor (βc) is defined as the ratio of the initial crust thickness to the final crust thickness. The pre-rifted crustal thickness of the northern SCS margin is assumed to be 32 km in this study (Zhao et al., 2018). The thicknesses of syn-rift (45–23 Ma), and post-rift (23–0 Ma) sediments are estimated using two-way travel time (TWT) of the seismic data (Figure 2A). The time-depth conversion of the stratigraphic sequences is based on VSP data (Zhao et al., 2015). The crustal thickness is derived by assuming an average crustal P-wave velocity of ∼6.5 km/s as previous studies (Zhao et al., 2015).
4 Results
4.1 Upper crust thinning
In the upper crust, βw is 1–2.4 by assuming H0 = CT, while βw varies from 1 to 3.3 by applying H0 = 10 km to all faults (Figure 7A). The curve of βw (H0 = 10) exhibits β-maxima at a distance of ∼95 km with the highest frequency variation among all the three methods on upper crust.
βf shows a smooth function curve between 1.6 and 2.0 with W = 150 km for each fault set and between 1.7 and 2.3 with W = 75 km, while it expands to 1.4–2.9 with W = 20 km (Figure 7A). When applying lower values of W from 150 km to 20 km, the variation of βf is gradually amplifying; e.g., when W = 20 km, a peak of βf = ∼2.9 is indicated at the distance of ∼100 km. The curve of βf (W = 150 km) exhibits near-symmetry, while that of βf (W = 20 km) is characterized by asymmetry. All three βf -minima exceed those of βw and βz as the result of correction.
βz values of six zones (1.2–3.1; Table 1) are presented in Figure 7A. Compared to the other curves, βz is shown as a stepwise line with large Δβz, since values are estimated on the basis of averaging the exaggerated geometry of trough and crest in each zone.
4.2 Crustal thickness and thinning
Along Line 1, the crust thickness shows a large variation ranging from maxima of >20 km at the basin margins to a minimum of <10 km at a distance of ∼20 km (Figure 7B). The thinner crusts of ∼10 km at the two flanks of Songnan Sag and Songnan Uplift correspond to the maxima of βc. Between the distance of 20 and 110 km, the thickness varies around ∼12.5 km with a slight increase from ∼10 km to ∼15 km.
In Figure 7A, the extension discrepancy is indicated at a distance of c. 20–70 km, which is significant in the center of Songnan Sag and Songnan Uplift. However, it appears to be ambiguous in the Beijiao Sag and Southern Uplift where the water depth stabilizes at ∼1.6 km.
5 Discussion
5.1 Role of fault deformation width in estimating brittle crustal stretching factor
Fault deformation width (W) has been an unknown parameter and cannot be calculated (Roberts, 1993; Davis, 2004; Zhao, 2018), which is fundamentally important in determining the stretching factor of brittle crustal extension. Roberts (1993) set up W as constant of 75–150 km for contrastive analysis of backstripping and forward modelling in the North Sea, and it has since been adopted as default by subsequent works. However, the assumption contains potential uncertainties, because it is disregarding differences in faults heaves, dips and initial brittle crustal thicknesses. To capture the uncertainty derived from using the constant W range, we revisit the conventional method (Davis and Kusznir, 2004) and evaluate the role of W (Figure 8). Theoretically, applying the most favorable W value in the suggested range (75–150 km) to one single fault leads to Δβf = 0.14 at most. W, therefore, seems to have negligible impact on βf. However, its importance becomes more apparent as it decreases, e.g., Δβf = 0.8 if a maximum of 150 km and a minimum of 20 km are assigned to W. Even a proposed value of W (W = 75 km) results in a substantial underestimation (i.e., Δβf = 0.7).
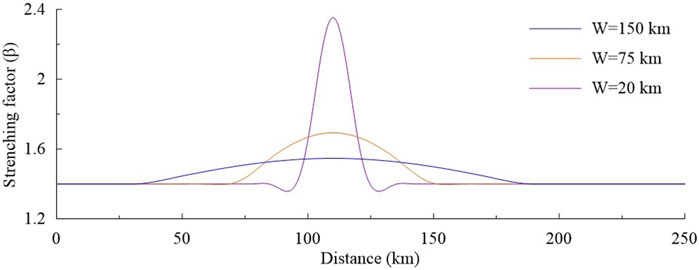
FIGURE 8. β-Profiles generated from different values of W and the same single fault based on Eqs 1, 2, all with 40% correction.
Our results indicate that W is generally less than 80 km and narrow it down to the range of 10–60 km even in the marginal case of H0 = 50 km with dip in the range of 30°–75° (Figure 4). Since the ductile-brittle transition is suggested between 10 and 15 km in the modern South China Block (Zuber et al., 1986; Clift et al., 2001), the W value in the northern SCS is proposed as less than 50 km (extreme case is H0 = 15 km in Figure 4). As we decrease W = 150 km to W = 20 km, the trend of βf curves changes to multi-wave converging towards the functions of βz and βw as shown in Figure 7A. Our findings demonstrate that W is an important control on the brittle extensional estimation, but has been overestimated in previous studies. A lower W value than the conventionally used range may lead to more accurate model outcomes. The discord is likely a critical cause for underestimation of the upper crustal stretching factor.
Stretching estimation based on current fault geometry shown in seismic image is insufficient to evaluate the brittle upper crust thinning due to undetected faulting. According to Reston (2005; 2007), polyphase faulting incurs geometric changes such as shallower-dipping, which could be crosscut by steeper normal faults developed in later stages. The extension by unrecognized faulting is generally corrected by increasing its value by a factor of 40% (Walsh et al., 1991). However, since more complex fault geometries have experienced larger heaves and stronger deformation, a different degree of correction is required in consideration of geometric complexity (Clift et al., 2001), and vice versa. Our method improves this accuracy by numerical analyses of W (Figure 7A). Our results show that βf at W = 150 stays mostly uniform over the entire profile with a slight maximum in the Songnan Sag, but peaks of βf curves at lower W values were recorded in the Beijiao Sag, with 2.3 for W = 75 and 2.9 for W = 20, respectively (Figure 7A). The peaks correspond to the βz trend, which shows the highest value in the Beijiao Sag and the second highest value in the Songnan Sag (Figure 7A). Although βz is less accurate by exaggerating both maxima and minima, it is advantageous to see the overall variation trend with limits.
5.2 Limitations
Our methodology underlines the importance of W, which is beneficial to estimate the upper crustal extension and can be applied to other studies on brittle extension. However, if the estimation requires sophisticated controls for the extension over time and depth, some improvements are required. Above all, the rotation of faults or beds has to be considered as the stretching factor βd is based on a domino-style fault block model, which can contribute critically to avoid underestimation of βf as well as the uncertainty of extension discrepancy. Several studies have indicated that initial dips of normal faults may subsequently rotate to shallower ones due to isostatic response (Spencer, 1984; Wernicke and Axen, 1988), particularly faults with large offsets (Buck, 1988), i.e., their initial dips are larger than the current dips identified from profiles. A numerical simulation model by Lavier and Manatschal (2006) confirmed that steep normal faults rotate to conjugate concave downward faults, which lead to crust thinning at magma-poor margins. A balanced kinematic model proved that sequential faulting turns high-angle normal faults into low-angle ones as accommodation of thinning, which is limited by lower crust, deforming in response to upper crust in the cold basin or lithosphere (Ranero and Perez-Gussinye, 2010). For instance, we infer that the original dip of F18 with offset up to ∼14.7 km could be much higher than 15.9°. It is supported by the cases that normal faults in the brittle upper crust develop at dips θ>45° and stay active at dips θ ≥ 30° with offset <10 km (Anderson, 1951; Byerlee, 1978; Sibson, 1985; Buck, 2007; Reston, 2007). This is one potential cause for the drastic drop of βw in the Beijiao Sag and Beijiao Uplift. Another aspect to consider is the inapplicability of heat flow on older basins and underestimation of crustal thinning affected by asthenospheric melting. During the rifting, heat flow increases due to lithosphere thinning and rising of the asthenospheric mantle, which is closely associated with the crustal stretching, flexural uplift, and subsidence. The thermal effect of depositing cold sediments on top of the lithosphere leads to a depression in the thermal gradient, extending down into the lithosphere (the thermal blanketing effect) (Karner, 1991; Kim et al., 2020). Such lithospheric and asthenospheric-scale mechanisms during rifting require comprehensive considerations of the thermal evolution in our numerical methods.
5.3 Insights into extension discrepancy
The extension discrepancy has been widely reported in the northern SCS (Clift et al., 2002; Tsai et al., 2004; Bai et al., 2019). In this study, significant extension discrepancy was also indicated at the distance of c. 20–70 km of Line 1 (Figure 7A), which corresponds to the Songnan Sag and Uplift characterized by asymmetrical half-grabens. In the Beijiao Sag which is dominated by grabens, positive extension discrepancy is indicated by βf when applying W = 150, while inverse discrepancy is widely discovered when evaluating βf with W = 20. We infer that the extension discrepancy in previous studies is over-predicted by an overestimated W. The inverse discrepancy has so far been overlooked in the northern SCS. A balancing of positive discrepancy and inverse discrepancy along the extension direction supports the presence of crustal extension discrepancy, as the same amount of thinning is expected across the entire profile at crustal scale (Reston, 2007), i.e. cross sectional area of crust along the extension direction maintains the uniform β during syn-rifting and post-rifting (Figure 9A).
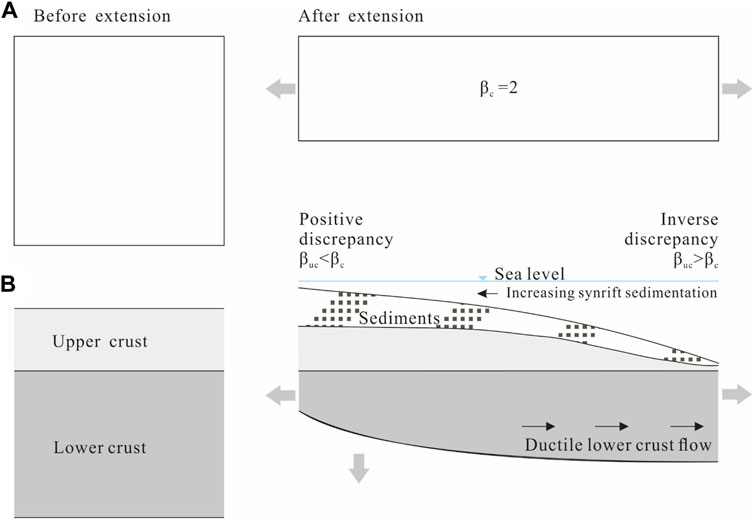
FIGURE 9. (A) Cross sectional area remains constant before and after extension; (B) Schematic illustrations showing that the pressure by variation of sediment thickness drives the ductile lower curst flowing.
Depth Dependent Stretching (DDS) or Depth Dependent Thinning (DDT) (Royden and Keen, 1980; Rowley and Sahagian, 1986; Roberts et al., 1993; Kusznir and Karner, 2007) seems to be the convincing model to explain the mechanism of extension discrepancy. However, the depth dependence at lithospheric level is unsuitable to explain the estimation in the central part of Qiongdongnan Basin where a local positive discrepancy is located next to a local inverse discrepancy. The potential explanations for inverse discrepancy include: 1) upper plate (hanging wall) of detachment fault of simple shear (Wernicke, 1985) which is in conflict with the observation showing symmetric grabens and asymmetric half-grabens, being firstly excluded. 2) top-down break up (Anderson, 2001). i.e., the first degree break-up of upper crust precedes that of lower crust as tensile stress instead of magmatism upwelling from asthenosphere takes charge. This is an attractive interpretation since the magmatism upwelling did not occur in the central part of Qiongdongnan Basin during rifting. However, this model suggests that the upper crust thinning is greater than that of lower crust, which results in an inverse discrepancy at the thinnest whole crust location (Reston and McDermott, 2014). It does not fit in the study area that a positive discrepancy is described at the thinnest crust. Moreover, previous studies (Davis and Kusznir, 2004) suggested that the breakup of lithosphere inclines to bottom up in the deep-water area, like the Beijiao Sag. 3) lower crust flow in hot lithosphere like northern SCS (Figure 9B). During rifting, the syn-rift sediments were deposited up to ∼8 km in the northwest (Figure 7B), which is closer to Hainan Island and exhibits positive discrepancy. The inverse discrepancy is predominant in the southeast where it shows relatively thin thickness of syn-rift sediments (up to 4 km; Figure 7B). Compared to the northwest, the southeast area was far away from provenance. Such variation in sediment thickness could contribute to a laterally differential pressure, which might drive the lower crust flow causing transitions between inverse and positive discrepancies. The ductile lower crust is generally inclined to flow along the rifting direction (McKenzie and Jackson, 2002). This is an elementary impact since sediment thickness is also dependent on subsidence associated with tectonic processes and thermal effects, which we will investigate further to understand the mechanism in the future studies.
6 Conclusion
We evaluate the role of fault deformation width in estimating upper crust extension. This parameter plays an important role in the determination of upper crustal stretching factor. Our results suggest that the value of W has often been overestimated in previous studies, and should be less than 80 km in general and less than 50 km in the northern SCS. The overestimated value of W causes a considerable underestimation of upper crustal stretching and over-reported extension discrepancy. When our new approach and/or a lower value of W (W = 20 km) are applied to estimation of the upper crustal extension in the central part of Qiongdongnan Basin, an inverse discrepancy is indicated in the deep-water area featured by symmetrical grabens. We suggest that the significant difference in syn-rift sediment thickness probably drives the lower crust flow causing a transition between inverse discrepancy and positive discrepancy in the central part of Qiongdongnan Basin.
Data availability statement
The original contributions presented in the study are included in the article/Supplementary Material, further inquiries can be directed to the corresponding author.
Author contributions
CH and ZZ designed the concept of the study. ZZ provided the new method and dataset. CH performed the statistical analysis. YX provided the base map of Figure 1A. ZZ and CH drafted the first version of the manuscript. CH and EL further developed the manuscript. CH, ZZ, and EL contributed to manuscript revision, read, and approved the submitted version.
Funding
This research was supported by CAS Youth Innovation Promotion Association, by National Key Research and Development Program of China (2021YFC3100604), by National Natural Science Foundation of China (NO. 42076077), by Guangzhou Municipal Science and technology program (NO. 201904010285).
Acknowledgments
We are grateful to handling editor and the two reviewers for their helpful and constructive reviews.
Conflict of interest
The authors declare that the research was conducted in the absence of any commercial or financial relationships that could be construed as a potential conflict of interest.
Publisher’s note
All claims expressed in this article are solely those of the authors and do not necessarily represent those of their affiliated organizations, or those of the publisher, the editors and the reviewers. Any product that may be evaluated in this article, or claim that may be made by its manufacturer, is not guaranteed or endorsed by the publisher.
Supplementary material
The Supplementary Material for this article can be found online at: https://www.frontiersin.org/articles/10.3389/feart.2022.1016529/full#supplementary-material
References
Bai, Y. L., Dong, D. D., Brune, S., Wu, S. G., and Wang, Z. J. (2019). Crustal stretching style variations in the northern margin of the South China Sea. Tectonophysics 751, 1–12. doi:10.1016/j.tecto.2018.12.012
Barckhausen, U., and Roeser, H. A. (2004). Seafloor spreading anomalies in the South China Sea revisited. Continent-Ocean Interact. within East Asian Marg. Seas. 149, 121–125. doi:10.1029/149gm07
Briais, A., Patriat, P., and Tapponnier, P. (1993). Updated interpretation of magnetic-anomalies and sea-floor spreading stages in the south China sea - implications for the tertiary tectonics of southeast-asia. J. Geophys. Res. 98, 6299–6328. doi:10.1029/92jb02280
Brune, S., Williams, S. E., Butterworth, N. P., and Muller, R. D. (2016). Abrupt plate accelerations shape rifted continental margins. Nature 536 201, doi:10.1038/nature18319
Buck, W. R. (1988). Flexural rotation of normal faults. Tectonics 7 959–973. doi:10.1029/Tc007i005p00959
Buck, W. R. (2007). The dynamics of continental breakup and extension. New York: Columbia University.
Clift, P. D., and Sun, Z. (2006). The sedimentary and tectonic evolution of the Yinggehai-Song Hong basin and the southern Hainan margin, South China Sea: Implications for Tibetan uplift and monsoon intensification. J. Geophys. Res. 111, 1–28. doi:10.1029/2005jb004048
Clift, P., Lin, J., and Barckhausen, U. (2002). Evidence of low flexural rigidity and low viscosity lower continental crust during continental break-up in the South China Sea. Mar. petroleum Geol. 19, 951–970. doi:10.1016/s0264-8172(02)00108-3
Clift, P., Lin, J., and Party, O. L. S. (2001). Patterns of extension and magmatism along the continent-ocean boundary, South China margin, 187. London, England: Geological Society, London, Special Publication, 489,
Crosby, A., White, N., Edwards, G., and Shillington, D. J. (2008). Evolution of the Newfoundland-Iberia conjugate rifted margins. Earth Planet. Sci. Lett. 273 (1-2), 214–226. doi:10.1016/j.epsl.2008.06.039
Davis, M., and Kusznir, N. (2004). Depth-dependent lithospheric stretching at rifted continental margins.” in Proceedings of national science foundation rifted margins theoretical institute. New York: Columbia University Press, 92
Ding, W. W., Sun, Z., Mohn, G., Nirrengarten, M., Tugend, J., Manatschal, G., et al. (2020). Lateral evolution of the rift-to-drift transition in the south china sea: Evidence from multi-channel seismic data and IODP Expeditions 367&368 drilling results. Earth Planet. Sci. Lett. 531, 115932. doi:10.1016/j.epsl.2019.115932
Dong, M., Zhang, J., Brune, S., Wu, S. G., Fang, G., and Yu, L. (2020). Quantifying postrift lower crustal flow in the northern margin of the south China sea. J. Geophys. Res. Solid Earth 125, 18910. doi:10.1029/2019JB018910
Driscoll, N. W., and Karner, G. D. (1998). Lower crustal extension across the northern Carnarvon basin, australia: Evidence for an eastward dipping detachment. J. Geophys. Res. 103 (B3), 4975–4991. doi:10.1029/97jb03295
Franke, D., Savva, D., Pubellier, M., Steuer, S., Mouly, B., Auxietre, J. L., et al. (2014). The final rifting evolution in the South China Sea. Mar. Petroleum Geol. 58, 704–720. doi:10.1016/j.marpetgeo.2013.11.020
Hall, R., Ali, J. R., Anderson, C. D., and Baker, S. J. (1995). Origin and motion history of the philippine sea plate. Tectonophysics 251 (1-4), 229–250. doi:10.1016/0040-1951(95)00038-0
Karner, G. D. (1991). Sediment blanketing and the flexural strength of extended continental lithosphere. Basin Res. 3 (4), 177–185. doi:10.1111/j.1365-2117.1991.tb00127.x
Kim, Y., Huh, M., and Lee, E. Y. (2020). Numerical modelling to evaluate sedimentation effects on heat flow and subsidence during continental rifting. Geosciences 10 (11), 451. doi:10.3390/geosciences10110451
Kusznir, N. J., and Karner, G. D. (2007). Continental lithospheric thinning and breakup in response to upwelling divergent mantle flow: application to the Woodlark, Newfoundland and Iberia margins, London, England: Geological Society, London, Special Publication, 389
Larsen, H. C., Mohn, G., Nirrengarten, M., Sun, Z., Stock, J., Jian, Z., et al. (2018). Rapid transition from continental breakup to igneous oceanic crust in the South China Sea. Nat. Geosci. 11(10), 782, doi:10.1038/s41561-018-0198-1
Leloup, P. H., Arnaud, N., Lacassin, R., Kienast, J. R., Harrison, T. M., Trong, T. T. P., et al. (2001). New constraints on the structure, thermochronology, and timing of the Ailao Shan-Red River shear zone, SE Asia. J. Geophys. Res. 106, 6683–6732. doi:10.1029/2000jb900322
Li, G., Mei, L., Pang, X., Zheng, J., Ye, Q., and Hao, S. (2022). Magmatism within the northern margin of the South China Sea during the post-rift stage: An overview, and new insights into the geodynamics. Earth-Science Rev. 225, 103917. doi:10.1016/j.earscirev.2022.103917
McKenzie, D., and Jackson, J. (2002). Conditions for flow in the continental crust. Tectonics 21 (6), 5-1–5-7. doi:10.1029/2002tc001394
Morley, C. K. (2002). A tectonic model for the tertiary evolution of strike-slip faults and rift basins in SE Asia. Tectonophysics 347, 189–215. doi:10.1016/s0040-1951(02)00061-6
Packham, G. (1996). Cenozoic SE asia: Reconstructing its aggregation and reorganization. Geol. Soc. Lond. Spec. Publ. 106 (1), 123–152. doi:10.1144/gsl.sp.1996.106.01.10
Peron-Pinvidic, G., and Manatschal, G. (2019). Mini review rifted margins: State of the art and future challenges. Earth Sci. Front. 7, 218. doi:10.3389/feart.2019.00218
Ranero, C. R., and Perez-Gussinye, M. (2010). Sequential faulting explains the asymmetry and extension discrepancy of conjugate margins. Nature 468 (7321), 294–299. doi:10.1038/nature09520
Rangin, C. (1991). The philippine mobile belt: A complex plate boundary. J. Southeast Asian Earth Sci. 6 (3-4), 209–220. doi:10.1016/0743-9547(91)90068-9
Reston, T. J. (2007). Extension discrepancy at North Atlantic nonvolcanic rifted margins: Depth-dependent stretching or unrecognized faulting? Geol. 35 (4), 367–370. doi:10.1130/G23213a.1
Reston, T. J. (2005). Polyphase faulting during the development of the west Galicia rifted margin. Earth Planet. Sci. Lett. 237, 561–576. doi:10.1016/j.epsl.2005.06.019
Reston, T. J. (2009). The extension discrepancy and syn-rift subsidence deficit at rifted margins. Pet. Geosci. 15 (3), 217–237. doi:10.1144/1354-079309-845
Reston, T., and McDermott, K. (2014). An assessment of the cause of the extension discrepancy with reference to the west Galicia margin. Basin Res. 26 (1), 135–153. doi:10.1111/bre.12042
Roberts, A. M., Yielding, G., Kusznir, N. J., Walker, I. M., and Dorn-Lopez, D. (1993). Mesozoic extensionin the north sea: Constraints from flexural backstripping, forward modelling and fault populations. London: Geological Society of London.
Rowley, D. B., and Sahagian, D. (1986). Depth-dependent stretching: A different approach. Geol. 14, 32–35. doi:10.1130/0091-7613(1986)14<32:dsada>2.0.co;2
Royden, L., and Keen, C. E. (1980). Rifting process and thermal evolution of the continental margin of Eastern Canada determined from subsidence curves. Earth Planet. Sci. Lett. 51 (2), 343–361. doi:10.1016/0012-821x(80)90216-2
Sapin, F., Ringenbach, J. C., and Clerc, C. (2021). Rifted margins classification and forcing parameters. Sci. Rep. 11 (1), 8199. doi:10.1038/s41598-021-87648-3
Savva, D., Pubellier, M., Franke, D., Chamot-Rooke, N., Meresse, F., Steuer, S., et al. (2014). Different expressions of rifting on the South China Sea margins. Mar. Petroleum Geol. 58, 579–598. doi:10.1016/j.marpetgeo.2014.05.023
Searle, M. P. (2006). Role of the Red River shear zone, yunnan and vietnam, in the continental extrusion of SE asia. J. Geol. Soc. Lond. 163, 1025–1036. doi:10.1144/0016-76492005-144
Sibson, R. H. (1985). A note on fault reactivation. J. Struct. Geol. 7 (6), 751–754. doi:10.1016/0191-8141(85)90150-6
Spencer, J. E. (1984). Role of tectonic denudation in warping and uplift of low-angle normal faults. Geol. 12 (2), 95–98. doi:10.1130/0091-7613(1984)12<95:rotdiw>2.0.co;2
Sun, Z., Jian, Z., Stock, J. M., Larsen, H. C., Klaus, A., Zarikian, A., et al. (2018). South China sea rifted margin” in. Proceedings of the International Ocean Discovery Program. College Station, TX: International Ocean Discovery Program. doi:10.14379/iodp.proc.367368.101.2018
Tapponnier, P., Lacassin, R., Leloup, P. H., Scharer, U., Zhong, D. L., Wu, H. W., et al. (1990). The ailao Shan Red River metamorphic belt - tertiary left-lateral shear between indochina and South China. Nature 343, 431–437. doi:10.1038/343431a0
Taylor, B., and Hayes, D. E. (1983). “Origin and history of the south China sea basin,” in The tectonic and geologic evolution of SouthEastern asia seas and islands, Part 2. Editor D. E. Hayes (Washington, DC: American Geophysics Union), 23
Taylor, B., and Hayes, D. E. (1980). “The tectonic evolution of the south China sea basin,” in The tectonic and geologic evolution of SouthEastern asia seas and islands, Part 1. Editor D. E. Hayes (Washington, DC: American Geophysics Union), 89.
Tsai, C. H., Hsu, S. K., Yeh, Y. C., Lee, C. S., and Xia, K. Y. (2004). Crustal thinning of the northern continental margin of the South China Sea. Mar. Geophys. Res. (Dordr). 25 (1-2), 63–78. doi:10.1007/s11001-005-0733-5
Walsh, W., and Yielding, G. (1991). The importance of small-scale faulting in regional extension. Nature 351, 391–393. doi:10.1038/351391a0
Wernicke, B., and Axen, G. J. (1988). On the role of isostasy in the evolution of normal-fault systems. Geol. 16, 848–851. doi:10.1130/0091-7613(1988)016<0848:Otroii>2.3.Co;2
Wernicke, B. (1985). Uniform-sense normal simple shear of the continental lithosphere. Can. J. Earth Sci. 22 (1), 108–125. doi:10.1139/e85-009
Westaway, R., and Kusznir, N. J. (1993). Fault and bed 'rotation' during continental extension: Block rotation or vertical shear? J. Struct. Geol. 15, 753–770. doi:10.1016/0191-8141(93)90060-n
Zhang, C. M., Wang, Z. F., Sun, Z. P., Sun, Z., Liu, J. B., and Wang, Z. W. (2013). Structural differences between the Western and eastern Qiongdongnan Basin: Evidence of indochina block extrusion and South China sea seafloor spreading. Mar. Geophys. Res. 34, 309–323. doi:10.1007/s11001-013-9187-3
Zhao, Z., Sun, Z., Liu, J., Pérez-Gussinyé, M., and Zhuo, H. (2018). The continental extension discrepancy and anomalous subsidence pattern in the western Qiongdongnan basin, south China Sea. Earth Planet. Sci. Lett. 501, 180–191. doi:10.1016/j.epsl.2018.08.048
Zhao, Z. X., Sun, Z., Wang, Z. F., Sun, Z. P., Liu, J. B., Wang, Z. W., et al. (2013). The dynamic mechanism of post-rift accelerated subsidence in Qiongdongnan Basin, northern South China Sea. Mar. Geophys. Res. 34 (3-4), 295–308. doi:10.1007/s11001-013-9188-2
Zhao, Z. X., Sun, Z., Wang, Z. F., and Sun, Z. P. (2015). The mechanics of continental extension in Qiongdongnan Basin, northern South China Sea. Mar. Geophys. Res. 36 (2-3), 197–210. doi:10.1007/s11001-014-9238-4
Ziegler, P. A. (1983). Crustal thinning and subsidence in the north-sea. Nature 304, 561–561. doi:10.1038/304561a0
Keywords: fault deformation width, crustal extension discrepancy, stretching factor β, brittle upper crustal extension, numerical modeling, Qiongdongnan basin
Citation: He C, Zhao Z, Lee EY and Xue Y (2023) An approach to determine brittle upper crustal thinning: Insights into crustal extension discrepancy in the central part of Qiongdongnan Basin. Front. Earth Sci. 10:1016529. doi: 10.3389/feart.2022.1016529
Received: 11 August 2022; Accepted: 27 September 2022;
Published: 10 January 2023.
Edited by:
Zhigang Li, School of Earth Sciences and Engineering, Sun Yat-sen University, ChinaReviewed by:
Chuang Sun, School of Earth Sciences and Engineering, Sun Yat-sen University, ChinaLiming Dai, OUC, China
Copyright © 2023 He, Zhao, Lee and Xue. This is an open-access article distributed under the terms of the Creative Commons Attribution License (CC BY). The use, distribution or reproduction in other forums is permitted, provided the original author(s) and the copyright owner(s) are credited and that the original publication in this journal is cited, in accordance with accepted academic practice. No use, distribution or reproduction is permitted which does not comply with these terms.
*Correspondence: Zhongxian Zhao, enh6aGFvQHNjc2lvLmFjLmNu
 Chao He
 Zhongxian Zhao3*
 Eun Young Lee
 Yulong Xue