 Kai Dong
 Dewei Yang1
- 1Nanjing Hydraulic Research Institute, Nanjing, China
- 2College of Water Resources and Hydropower, Sichuan University, Chengdu, China
- 3Nanjing R&D Hydro-Information Technology Co., Ltd., Nanjing, China
The seepage field of tailings dam is closely related to the safety state. Real-time evaluation of seepage field safety based on monitoring data is of great significance to ensure the safe operation of tailings pond. The premise of accurately evaluating the safety status is to ensure reliability of the data, and it is necessary to identify the anomalies of the monitoring data. Because of the complex influence factors of seepage field of tailings dam, the traditional anomaly identification method based on regression model fails due to its low fitting accuracy. Therefore, a novel abnormal identification method of monitoring data based on improved cloud model and radial basis function neural network model, which can accurately identify anomaly data and distinguish the environmental quantity response. Based on the coupling relationship between the seepage field and the slope stability, the surrogate model between the depth of saturation line and the safety factor of slope stability is constructed, and the real-time safety evaluation method of seepage field is put forward. The proposed methods are applied to an engineering example. The misjudgment rates of the abnormal data identification method are less than 5%, and it has better applicability than the traditional regression model. The constructed real-time safety evaluation model accurately reflected the health status of the seepage field, and realized the quantitative assessment of the safety of tailings dam. This provides reliable data support for the operation management and the risk control of tailings pond.
1 Introduction
A tailings pond is a place for storing tailings discharged after ore separation, which is usually composed of dams to intercept valley mouths or enclosures, and the tailings dam is a dam structure on the periphery of the tailings pond. The tailings dam is a dangerous source of artificial debris flow with high potential energy, and the loss of life, property and ecological environment caused by dam failure is immeasurable (Mcdermott, 2000; Koppe, 2020; Cui et al., 2021). The tailings dam is generally designed as a permeable structure, and the saturation line of dam is called lifeline. Safety evaluation based on monitoring data of rainfall, saturation line, water level and deformation of tailings dam is a common means to solve safety early warning problems (Wang et al., 2018), and the monitoring system of tailings dam is becoming more and more perfect (Nie et al., 2022). The depth of saturation line is the direct external response to the change of seepage field of tailings dam. Therefore, it is of great significance to realize the real-time safety evaluation of seepage field based on the monitoring data of the depth of saturation line to ensure the safe operation of the tailings pond project (Hui et al., 2017; Zhou et al., 2021).
In the seepage monitoring of tailings dam, the abrupt change of data may be caused by the monitoring error, the response of seepage field caused by the change of operating environment, or the abnormal characterization of structural deterioration of tailings dam. Therefore, accurate identification of abnormal values of monitoring data is the premise of scientifically judging the operation performance and safety status of tailings dams. At present, many mathematical theories and methods (Salazar et al., 2015; Li et al., 2021a; Li et al., 2021b; Li et al., 2022; He and Kusiak, 2017; Li et al., 2011) have been introduced in abnormal identification of monitoring data. The regression model can reflect the degree of influence of environmental quantity on effect quantity and is relatively mature, so it is widely used. For example (Erdogan 2012), used robust regression based on M estimation to determine abnormal measured values in the data series; Dai et al. (2019) introduced the BC (a) confidence intervals based on statistical model for crack identification of concrete dams. These methods all have high requirements on monitoring data, and the constructed models need to have high fitting accuracy. However, the supervision investment of tailings dam is less than that of reservoir dam, the safety monitoring items of some tailings dams are imperfect, and the automation level is low (Zhang et al., 2015). The seepage field of tailings dam is related to the original topography, starter dam and seepage drainage structure, etc. It is difficult to accurately establish the relationship between seepage field and influencing factors due to the influence of environmental factors such as dry beach length, temperature and rainfall. These factors lead to the low accuracy of the statistical regression model and the inability to identify abnormal data. Moreover, the identified abnormal data needs to distinguish the inducement. At present, the identification of inducement in tailings dam mostly depends on manual investigation and correction, which has low identification degree and poor timeliness. Therefore, the cloud model based on time series analysis is used to identify abnormal data, and the RBF neural network model is established to distinguish the environmental response based on the correlation between seepage field measuring points. The proposed method has good applicability and accuracy. In terms of safety evaluation of tailings dam, the numerical simulation methods based on monitoring data are mostly used. The seepage field of tailings dam is constructed by using seepage monitoring data, and then the safety factor of anti-sliding stability is calculated to determine the safety state of tailings dam (Yuan et al., 2015; Sitharam et al., 2017). (Ma 2012) established a numerical model of a tailings dam by Ansys, analyzed the seepage stability and deduced the safety factor of tailings dam by strength reduction method. Pak and Nabipour (2017) calculated the seepage field under different drainage systems and the corresponding stability safety factors, and evaluated the drainage system by comparing the safety factors. The numerical simulation method is accurate and objective, but the model and boundary conditions are only suitable for the specific time and the working conditions of tailings dams, and it is seldom used in real-time diagnosis of tailings dams at present. In addition, the subjective evaluation method (Xin and Wan, 2019; Yue et al., 2013) represented by expert scoring method has some applications because of its convenient operation and intuitive process and results, but this method has certain subjective randomness, and its reliability and accuracy are insufficient. Therefore, based on the coupling relationship between the seepage field and the stability of dam slope, a surrogate model between the depth of saturation line and the safety factor of slope stability is constructed, and a safety evaluation method based on monitoring data is proposed, which realizes the real-time evaluation of its safety state and ensures the timeliness and reliability of the evaluation results.
The main contributions of this work are as follows: 1) The improved cloud model was used to identify the abnormal data in the seepage monitoring data of tailings dam; 2) the RBF neural network model was used to distinguish the environmental response of the abnormal data; 3) the surrogate model between the depth of saturation line and the safety factor of slope stability was constructed, and The real-time safety evaluation model for seepage field of tailings dam was established; 4) a tailings dam project was considered as an example to verify the applicability and accuracy of the proposed methods.
2 Methodology
2.1 Identification method of abnormal data
The common causal analysis models for identification of abnormal monitoring data, such as the statistical regression model, have high requirements for fitting accuracy. However, due to the complexity of seepage field of some tailings dams and imperfect monitoring facilities, the statistical regression model established has low accuracy, poor anomaly identification effect and poor applicability. The cloud model is a time series analysis for a single measurement point, and focuses on the statistical law of the effect quantity itself, but does not involve other environmental quantities. Compared with the statistical model, it is more suitable for tailings dams which are difficult to establish the relationship between environmental quantity and effect quantity, and has better applicability. Therefore, this paper proposes a new identification method of abnormal data.
2.1.1 Principle of the cloud model
The cloud model (Li et al., 1995) was proposed based on probability theory and fuzzy mathematics theory, and has been widely used in information prediction, comprehensive evaluation, algorithm improvement and other research (Li et al., 2020; Lu et al., 2020; Hu et al., 2021). The cloud model reveals the uncertainty of any event by realizing two transformation models: The forward cloud generator which obtains quantitative values from qualitative concepts and the reverse cloud generator which realizes description from quantitative values to qualitative concepts. The cloud model is defined as: Let U be a universe of discourse for expressing the effect index of seepage monitoring of tailings dam with accurate numerical value, C is a qualitative concept to judge whether U has abnormal values, and a monitoring effect index x in U is a random implementation of C.
The normal cloud model is the most basic and widely used type, which is usually reflected by three numerical features. The expectation
2.1.2 Improved cloud model
The high monitoring frequency of the depth of saturation line of tailings dam and the small change range of adjacent measured values, and it is easy to identify the sudden change of data by using the change rate. Therefore, the cloud model is constructed by the daily change rate of the monitoring data, that is, the daily change rate
In the normal cloud model, the cloud droplets fluctuate randomly around the expected curve, and the fluctuation range is determined by the super entropy. According to the
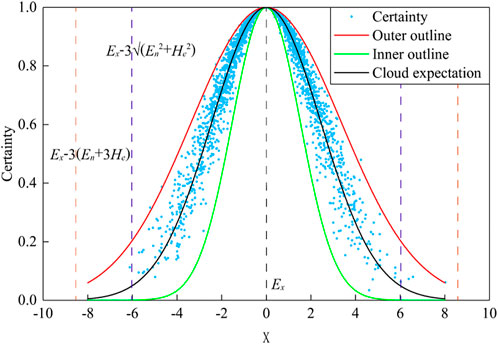
FIGURE 1. Schematic diagram of the cloud model and its threshold.
According to the generation principle of cloud droplet and the calculation method of statistics, the expectation and variance of normal cloud can be obtained, as shown in Eqs 5, 6.
The threshold setting refers to the Pauta criterion (Li et al., 2019), and the expectation
If the daily change rate of seepage monitoring data does not meet Eq. 7, it is judged as abnormal data, and then the environmental response is identified.
2.2 Distinction method of environmental quantity response
The reasons for abnormal monitoring data include environmental quantity response, measurement error, and characterization of structural deterioration (Xu et al., 2021). Environmental quantity response is the real response of the seepage field of tailings dam caused by environmental changes such as rainfall, reservoir water level, earthquake and tailings discharge. Measurement errors are instrument failures, human errors and environmental errors, etc. Characterization of structural deterioration is an anomaly of seepage field caused by structural deterioration of tailings dam, including local collapse, internal seepage channel anomaly and so on. Therefore, the outliers in the monitoring data identified by the improved cloud model based on the daily change rate need to identify the inducement. As a permeable structure, the response of seepage field of tailings dam to the change of environmental quantity is synchronous, that is, the measured values of each seepage monitoring point will respond synchronously and the change trend has strong correlation. Based on this characteristic, the artificial neural network model (Santillan et al., 2014) is used to distinguish the environmental quantity response. The artificial neural network of the outlier measurement point and the surrounding measurement points is trained. By comparing the relative error between the predicted value and the abnormal value, it can be judged whether the abnormal value is caused by the environmental quantity. Since the radial basis function (RBF) neural network can adopt a linear optimization algorithm that guarantees global convergence, and has the advantage of the only best approximation point (Bagheri et al., 2018), the RBF neural network is used to construct the identification model of environmental quantity response.
The RBF neural network includes the input layer, the hidden layer and the output layer. As shown in Figure 2, there are n input layer nodes, k hidden layer nodes and m outputs layer nodes in the model, where the output layer vector is the predicted value sequence of the saturation line of the target measuring point, and the input layer vector is measured values sequence of the saturation line of the associated measuring points. The mapping relationship of the RBF neural network can be divided into two parts. The first part is the process from the input layer to the hidden layer, which is a nonlinear transformation. The Gaussian function is used as radial basis function because of its simple form, radial symmetry and good practicability. The second part is the process from the hidden layer to the output layer, which is a linear transformation. In order to increase the commensurability of the monitoring data, the seepage monitoring data are standardized before training.
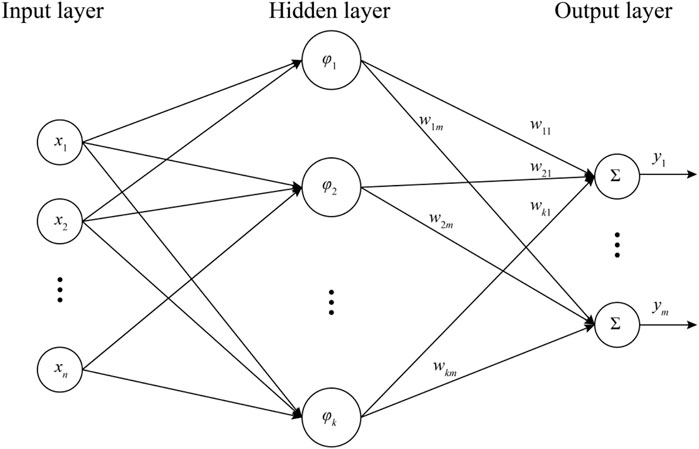
FIGURE 2. Schematic diagram of the RBF neural network.
The predicted value of the target measuring point is obtained by the environmental quantity response distinction model based on the RBF neural network. If the relative error between the predicted value and the abnormal measured value is within a certain range, it can be considered that the abnormal data is the response caused by the change of environmental quantity, and belongs to the normal measured value. Otherwise, the abnormal data still belongs to the abnormal measurement value.
The abnormal measurement value can be further identified in real-time monitoring by means of re-testing, instrument inspection, etc. If the re-measured value is a normal value, it is judged that the abnormal data is a mutation caused by the measurement error, and the original abnormal data is eliminated and modified, and the modified vaule adopts the predicted data of the model. Otherwise, it is considered that the abnormal data is caused by the structural deterioration of tailings dam, and an alarm is issued to remind the staff to check the structure of the tailings dam in the area and deal with the dangerous situation in time.
2.3 Real-time safety evaluation method
As a granular structure, the safety state of tailings dam is closely related to seepage field, and the most intuitive response to the change of seepage field is the monitoring data of the depth of saturation line (Hu et al., 2004; Lu & Chang, 2019). The decrease of the depth of saturation line will lead to a significant decrease in the static stability safety factor of tailings dam (Zhang et al., 2020). The safety evaluation is based on the coupling relationship between the depth of saturation line and the safety factor of dam slope stability.
The seepage fields under different dry beach length conditions are determined by seepage analysis, and then the safety factor series reflecting the stability of dam slope is calculated by the limit equilibrium method. As tailings dams is built step by step during operation, the safety factor corresponding to the same dry beach length may gradually decrease as the dam height increases (Wang et al., 2017). Therefore, the seepage field and the sequence of safety factors of slope stability under different heights of tailings dam are calculated respectively, so as to establish the functional relationship between the safety factor, the dam height and the depth of saturation line, as shown in Eq. 8:
Where Ks is the Stability safety factor of tailings dam slope,
Based on the surrogate model, the safety evaluation model of seepage monitoring points of tailings dam is constructed, which can reflect the health state of tailings dam in real time. And set the early warning threshold to send out the danger early warning in time.
Finally, the flow chart of this paper can be shown in Figure 3.
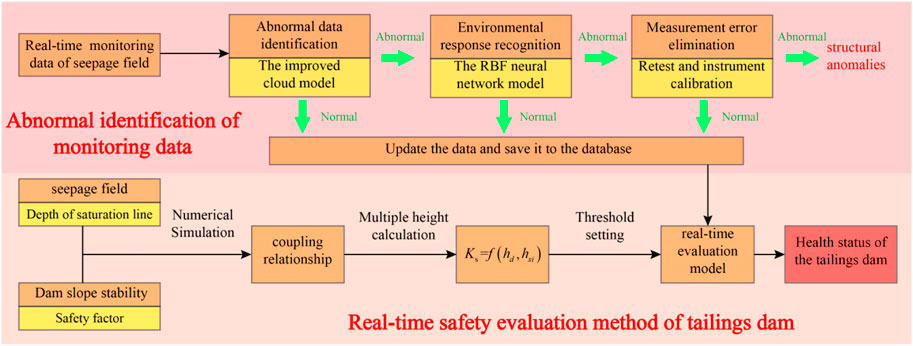
FIGURE 3. The flow chart of the paper.
3 Case study
3.1 Project specifications
The LS phosphogypsum tailings pond is stored by the wet method. The project was put into use in January 2006, and the final designed dam height is about 130 m. By September 2010, the tailings dam had accumulated to the 10 sub-dam, with a crest elevation of 2020 m and a accumulation height of 80 m. The elevation of the starter dam is 1970 m, the width of the crest is 5.0 m, and the height of the dam is about 30 m. The filling soil of the starter dam is mainly made of weathered materials by layered rolling, which has good compactness. The upstream slope is provided with rockfill drainage body, the dam bottom is provided with horizontal rockfill drainage body, and the downstream is provided with drainage prism at 1953.0 m elevation. The upstream dam construction method is adopted for tailings dam, and the accumulation dam is mainly composed of compacted phosphogypsum. The crest of the sub-dam is 5–8 m wide and 5 m high. The slope ratio of the outer slope is 1: 2.0, the slope ratio of the inner slope is 1: 1.5, and the total slope ratio of the accumulation dam is about 1: 4.0. The LS tailing pond is located in an east-west gully. In the stratigraphic structure of the dam site, except that the valley bottom and the gentle slope of the right abutment are covered with Quaternary alluvial-proluvial soil and slope residual cohesive soil, the whole dam foundation is composed of deep gray, gray-black thin-layered carbonaceous shale of Qiongzhusi Formation of Lower Cambrian and gray-white, dark gray medium-thick layered silty dolomite of Yuhucun Formation. The stratigraphic sequence is normal and there is no sign of fault. The seepage monitoring of the tailings dam adopts piezometric pipe. During the first safety appraisal in March 2008, nine piezometer tubes were buried at the sub-dams of Grade 2, Grade 4 and Grade 5, which were K1-9 observation points respectively. The topographic map of the LS tailings pond and the layout of monitoring points are shown in Figure 4.
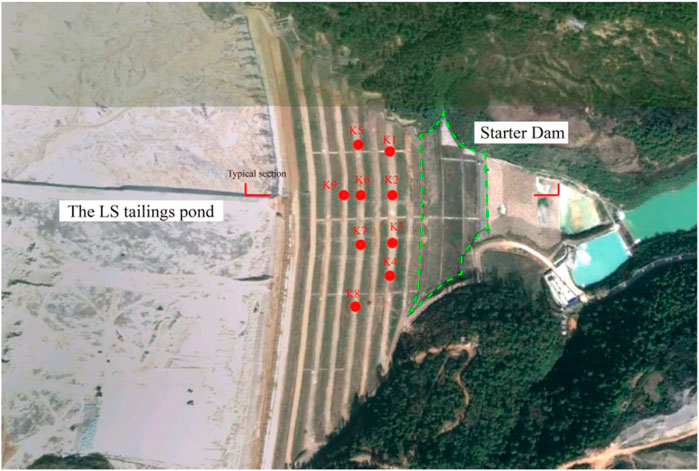
FIGURE 4. The topographic map of the LS tailings pond.
3.2 Discrimination of abnormal data
3.2.1 Identification of abnormal data
Based on the data of seepage monitoring of the LS tailings dam from June 2009 to October 2010, the statistical model, the cloud model and the improved cloud model are constructed to identify abnormal data. Figure 5 shows the identification result of K2 monitoring point. The monitoring facilities of the LS tailings dam are not yet perfect, and the environmental quantities such as the rainfall and the reservoir water level are missing in some periods, which leads to the low fitting accuracy of the statistical model. As shown in Figure 5, the pauta criterion based on the statistical model did not identify outliers. The cloud model based on the daily variation rate accurately depicts the abrupt change of seepage monitoring data, but it misses the judgment due to the wide control interval. The improved cloud model proposed in this paper can effectively identify five abnormal data of K2 monitoring point.
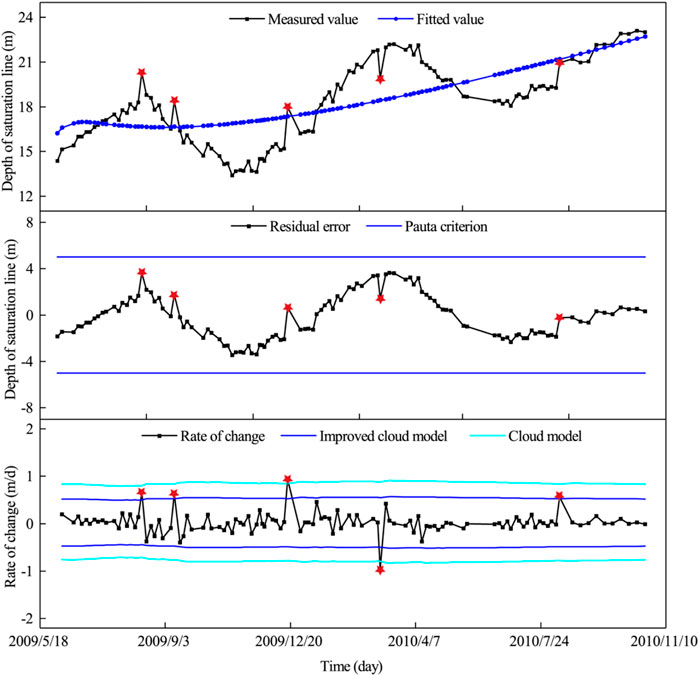
FIGURE 5. Identification results of the abnormal data of K2 measuring point.
Anomaly identification was carried out on the monitoring data of 2,436 times in total at 9 monitoring points, and the identification results are compared with the manual recognition. A total of 64 abnormal data points were identified through the manual recognition. The traditional cloud model missed 26 abnormal data points, with a missed judgment rate of 40.63%, while the improved cloud model missed only 1 abnormal data point, with a missed judgment rate of 1.56%. The results show that the proposed anomaly data identification method based on the improved cloud model solves the problem that the fitting accuracy of the statistical model is so low that it cannot be applied, and effectively reduces the missed judgment rate compared with the traditional cloud model. The method has good applicability and accuracy, and has strong application value for the abnormal data identification of the depth of saturation line of tailings dam.
3.2.2 Distinction of environmental quantity response
In order to verify the correlation among the monitoring points in the seepage field, the correlation analysis method (Dong et al., 2018) was used to analyze the data of 9 monitoring points of the depth of saturation line of the tailings dam. The result is that the correlation degree among each monitoring point is greater than 0.85, indicating that there is a strong correlation among the 9 monitoring points. The monitoring data is standardized. Then, the RBF neural network between the target monitoring point and the other monitoring points is established by taking the monitoring value sequence of the target monitoring point as the output vector and the monitoring value sequence of the other monitoring points as the input vector. 50 groups of data in the preceding section of monitoring data were selected for analysis, and 30 groups of data were taken as training samples, and the remaining 20 groups of data were taken as inspection samples. After the training samples are input into the network, the network adjusts the weights and the neuron centers according to the learning rules, so that the error index reaches the specified minimum value (Schwenker et al., 2001).
Then, the trained neural network is used to test the test samples. Except for the individual points with great fluctuation, the other test points are in good agreement, which shows that the constructed neural network model has good accuracy. The prediction results show that for the abnormal data of environmental response, the relative error between the measured value and the predicted value is within 5%, while for the abnormal data of non-environmental response, the relative error between the measured value and the predicted value are both above 8%. Therefore, the relative error threshold δ is set at 5%, which can effectively identify the environmental response. The constructed neural network model is used to identify the environmental response to the abnormal data in the historical monitoring data. If the relative error is less than δ, the abnormal data is considered to be caused by the environmental response, and the data is retained as normal data; if the relative error is greater than δ, the sudden change is excluded from the environmental response.
Figure 6 shows the identification results of the environmental quantity response of the K2 monitoring point. The relative errors of the abnormal data points 2, 3 and 5 are less than 3%, and the relative errors of the abnormal data points 1 and 4 are 8.34 and 9.45%, respectively. Therefore, it is determined that the abnormal data points 2, 3, and 5 are caused by the environmental response and are entered into the database as normal data, while abnormal data 1 and 4 are determined to be not caused by the environmental response and are retained as abnormal data points. This distinction method is used to distinguish the environmental quantity response of all abnormal data points, and the results show that 37 abnormal data of 64 abnormal data points are caused by the environmental response. Compared with the results of the artificial verification, two abnormal data are missed, and the error rate is 3.13%, which shows that the method is reasonable, effective and accurate, and meets the requirements of the engineering application.
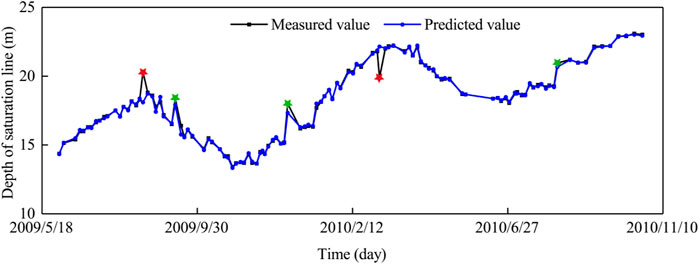
FIGURE 6. Distinction results of the environmental response of K2 monitoring point.
Since the data in this paper are historical data, it is impossible to further distinguish the measurement error and characterization of structural deterioration, and only the abnormal data identification and environmental impact identification are carried out on the historical data. The LS tailings dam has no structural variation during the operation, so the abnormal data after the distinction of environmental quantity response are considered to be caused by the measurement errors, which are eliminated and corrected.
3.3 Safety evaluation of the tailings dam
The LS tailings dam adopts the upstream classification dam construction method, filling and accumulating tailings in the upstream direction of the starter dam to build dams step by step, and each sub-dam is 5 m high. See Table 1 for the construction process. During the diagnosis period, the elevation of tailings dam was filled from 2010 to 2020 m. Taking the height of 2010 m as an example, the construction method of the real-time safety evaluation model of tailings dam based on the coupling relationship between the seepage field and the slope stability is described.
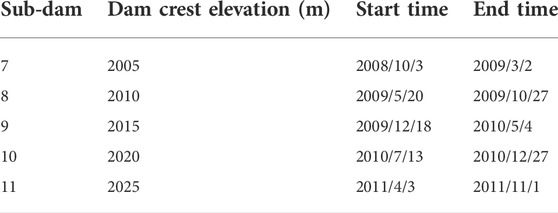
TABLE 1. Dam construction process of the LS tailings dam.
The typical section of the tailings dam is selected to establish a two-dimensional model. The section diagram and the arrangement of monitoring points are shown in Figure 7. According to the physical and mechanical test results and the geological prospecting data (Nanjing Hydraulic Research Institute, 2019), the values of calculation parameters are determined, as shown in Table 2.
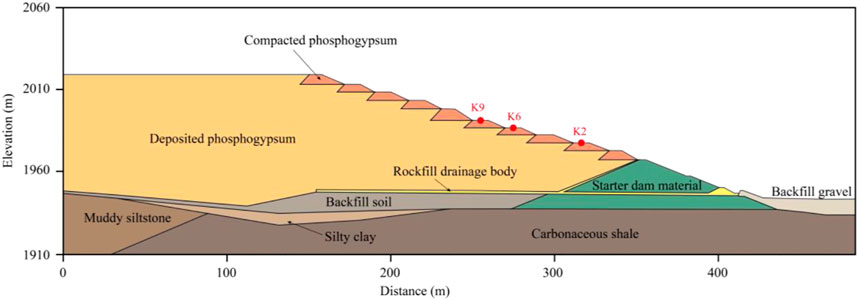
FIGURE 7. Typical geological profile and monitoring arrangement.

TABLE 2. Physical and mechanical parameters of the materials.
The model is surrounded by an impermeable boundary. The calculated water level is 2010 m upstream and 1948 m downstream. The dry beach lengths are 30, 50, 70, 90, 110 and 150 m respectively. The seepage fields under different dry beach length conditions are obtained by the seepage analysis, and some of the results are shown in Figure 8. With the increase of the dry beach length, the depth of saturation line gradually decreases. The safety factor of dam slope stability corresponding to the seepage field is determined by the limit equilibrium method, thereby establishing the coupling relationships between the depth of the saturation line of each monitoring point and the stability safety factor of dam slope. The surrogate models of the coupling relationships are fitted by polynomial, and the results are shown in Figure 9. The complex correlation coefficient of the model is 0.97, and the average error is less than 0.05%, indicating that the fitting accuracy is high.
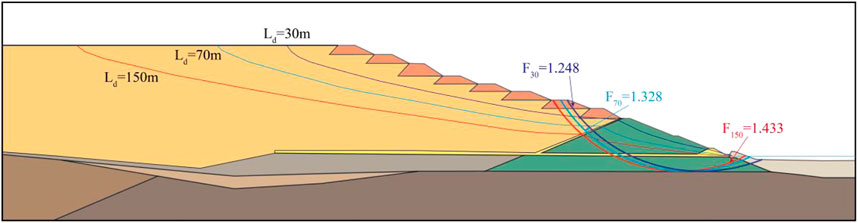
FIGURE 8. Simulation results of different dry beach lengths.
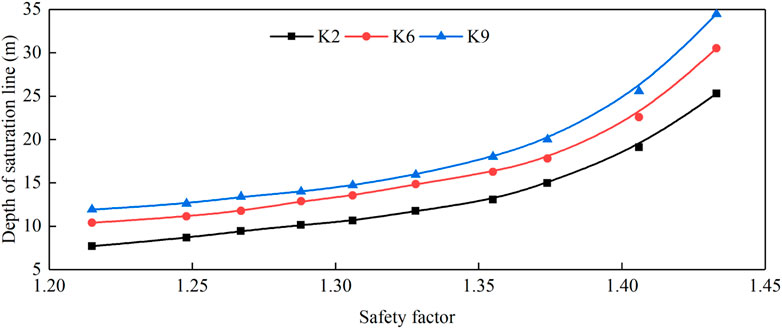
FIGURE 9. Coupling relationships of K2, K6 and K9 monitoring points.
With the increase of the tailings dam stacking height, the safety factor corresponding to the same dry beach length also decreases gradually. The surrogate models between the depth of saturation line and the safety factor of dam slope stability under different stacking heights are established respectively, and the functional relationship between the safety factor and height of dam and the depth of saturation line is constructed. According to the construction method of surrogate model of 2010 m elevation tailings dam, the surrogate models of 2015 and 2020 m elevation are constructed respectively. According to the stacking process of tailings dam, the surrogate model is selected dynamically, and the middle stacking height is determined by the surrogate models through linear interpolation, so a real-time health evaluation model is established.
Through the evaluation model, the stability safety factor of dam slope corresponding to the depth of saturation line at each monitoring point can be determined in real time, so as to reflect the safety state of tailings dam. The LS tailings dam belongs to Class 3 dam, and the corresponding threshold is set according to the specification (Ministry of Housing and Urban-Rural Development of the People’s Republic of China, 2013). The safety factor of 1.3 is orange warning and 1.235 is red warning (Dong et al., 2022). Based on the monitoring data after abnormal identification, the surrogate model of 2010 m elevation and the real-time health evaluation model are used to diagnose the health of the tailings dam. Figure 10 shows the diagnosis results of K6 monitoring point. With the increase of dam height, the diagnosis results of the surrogate model of 2010 m elevation gradually tend to be dangerous, and the relative error with the real-time safety evaluation model gradually increases, which further shows that it is necessary to consider the dam height when establishing the coupling relationship between the safety factor and the depth of saturation line. As shown in Figure 10, the safety factors of the monitoring points are all between 1.35 and 1.45, which is above the orange warning. The safety state of the monitoring point is relatively healthy, which is consistent with the actual situation. The reliability and accuracy of this method are verified, and the method can effectively reflect the changing trend of health state of tailings dam.
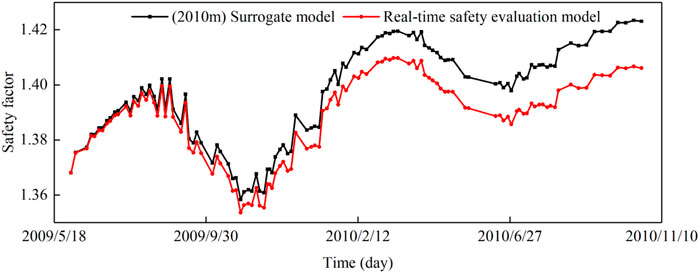
FIGURE 10. Evaluation results of K6 monitoring point.
4 Conclusion
1) The tailings dam is a dangerous source with high potential energy, and its damage consequences are serious. Seepage monitoring can intuitively reflect the safety status of the tailings dam. It is of great significance to realize the abnormal identification of monitoring data and the real-time safety evaluation to ensure the safe operation of the tailings pond project.
2) Based on the improved cloud model, a method for identifying abnormal data of the seepage monitoring was put forward. Combined with the RBF neural network model, a discrimination method for environmental quantity response of abnormal data was proposed. The methods solve the problem that the fitting accuracy of the constructed statistical model is too low to be applied, and realize efficient and accurate identification of abnormal data and discrimination of environmental factors.
3) Based on the numerical analysis results, the coupling relationship between the depth of saturation line and the safety factor of slope stability with the accumulation height was established, and a real-time evaluation model of health suitable for the accumulation process of tailings dam was proposed.
4) The application results of the LS tailings dam show that the error rate of the proposed identification method of abnormal data is less than 5%. The established real-time safety evaluation model can effectively evaluate the health state of tailings dam, which provides a novel method for safety assessment of the seepage field of tailings dam.
Data availability statement
The original contributions presented in the study are included in the article/Supplementary Material, further inquiries can be directed to the corresponding authors.
Author contributions
KD: Methodology, Conceptualization, Writing—Original Draft, and Validation. DY: Software and Data curation. JY: Supervision and Revision. JS: Review, Editing, and Validation. ZM and XL: Supervision and Editing. XP: Visualization and Funding acquisition.
Funding
This research was supported by the National Key R&D Program of China (Nos 2018YFC047106 and 2017YFC0804605), and the National Natural Science Foundation of China (51909174).
Conflict of interest
JY was employed by the company Nanjing R&D Hydro-Information Technology Co., Ltd.
The remaining authors declare that the research was conducted in the absence of any commercial or financial relationships that could be construed as a potential conflict of interest.
Publisher’s note
All claims expressed in this article are solely those of the authors and do not necessarily represent those of their affiliated organizations, or those of the publisher, the editors and the reviewers. Any product that may be evaluated in this article, or claim that may be made by its manufacturer, is not guaranteed or endorsed by the publisher.
References
Bagheri, V., Uromeihy, A., and Aghda, S. (2018). Predicting the probability of rockfalls occurrence caused by the earthquake of Changureh-Avaj in 2002 using LR, MLP, and RBF methods. Bull. Eng. Geol. Environ. 78 (5), 3119–3141. doi:10.1007/s10064-018-1323-5
Cui, S., Pei, X., Jiang, Y., Wang, G., Fan, X., Yang, Q., et al. (2021). Liquefaction within a bedding fault: Understanding the initiation and movement of the Daguangbao landslide triggered by the 2008 Wenchuan Earthquake (Ms = 8.0). Eng. Geol. 295, 106455. doi:10.1016/j.enggeo.2021.106455
Dai, B., Gu, C., Zhao, E., Zhu, K., Cao, W., and Qin, X. (2019). Improved online sequential extreme learning machine for identifying crack behavior in concrete dam. Adv. Struct. Eng. 22 (2), 402–412. doi:10.1177/1369433218788635
Dong, K., Mi, Z., and Yang, D. (2022). Comprehensive diagnosis method of the health of tailings dams based on dynamic weight and quantitative index. Sustainability 14, 3068. doi:10.3390/su14053068
Dong, W. J., Liu, S. F., and Fang, Z. G. (2018). On modeling mechanisms and applicable ranges of grey incidence analysis models. Grey Syst. theory Appl. 8 (4), 448–461. doi:10.1108/GS-04-2018-0019
Erdoğan, H. (2012). The effects of additive outliers on time series components and robust estimation: A case study on the oymapinar dam, Turkey. Exp. Tech. 36 (3), 39–52. doi:10.1111/j.1747-1567.2010.00676.x
He, Y., and Kusiak, A. (2017). Performance assessment of wind turbines: Data-derived quantitative metrics. IEEE Trans. Sustain. Energy 9 (1), 65–73. doi:10.1109/TSTE.2017.2715061
Hu, M. J., Guo, A. G., and Chen, S. Y. (2004). Reflections on anti-slide stability analysis of a gangue dam. Rock Soil Mech. 25 (5), 769–773. (in Chinese). doi:10.3969/j.issn.1000-7598.2004.05.030
Hu, Y., Wu, L., Pan, X., Wang, Z., and Xu, X. (2021). Comprehensive evaluation of cloud manufacturing service based on fuzzy theory. Int. J. Fuzzy Syst. 23, 1755–1764. doi:10.1007/s40815-021-01071-4
Hui, S., Charlebois, L., and Sun, C. (2017). Real-time monitoring for structural health, public safety, and risk management of mine tailings dams. Can. J. Earth Sci. 55, 221–229. cjes-2017-0186. doi:10.1139/cjes-2017-0186
Koppe, J. C. (2020). Lessons learned from the two major tailings dam accidents in Brazil. Mine Water Environ. 40 (1), 1–8. doi:10.1007/s10230-020-00722-6
Li, D. Y., Meng, H. J., and Shi, X. M. (1995). Membership clouds and membership cloud generators. J. Comput. Res. Dev. 32 (6), 6. (in Chinese).
Li, H., Deng, J., Feng, P., Pu, C., Arachchige, D., and Cheng, Q. (2021a). Short-term nacelle orientation forecasting using bilinear transformation and ICEEMDAN framework. Front. Energy Res. 9, 780928. doi:10.3389/fenrg.2021.780928
Li, H., Deng, J., Yuan, S., Feng, P., and Arachchige, D. (2021b). Monitoring and identifying wind turbine generator bearing faults using deep belief network and EWMA control charts. Front. Energy Res. 9, 799039. doi:10.3389/fenrg.2021.799039
Li, H., He, Y., Xu, Q., Deng, j., Li, W., and Wei, Y. (2022). Detection and segmentation of loess landslides via satellite images: A two-phase framework. Landslides 19, 673–686. doi:10.1007/s10346-021-01789-0
Li, H., Li, Z., Ma, F., and Liu, C. (2020). Similarity analysis of dam behavior characterized by multi-monitoring points based on cloud model. Int. J. Distributed Sens. Netw. 16 (5), 155014772092022. doi:10.1177/1550147720920226
Li, X., Li, Y., Lu, X., Wang, Y., and Zhang, P. (2019). An online anomaly recognition and early warning model for dam safety monitoring data. Struct. Health Monit. 19 (2), 796–809. doi:10.1177/1475921719864265
Liu, C., Li, D., Du, Y., and Han, X. (2005). Some statistical analysis of the normal cloud model. Inf. Control 34, 2. (in Chinese). doi:10.3969/j.issn.1002-0411.2005.02.023
Lu, F., Chen, G., Liu, Y., Li, Z., and Zou, T. (2020). Monet: Motion-based point cloud prediction network. doi:10.48550/arXiv.2011.10812
Lu, X. H., and Chang, X. S. (2019). Stability analysis of tailings dam based on the combination of seepage and stress. J. Phys. Conf. Ser. 1168 (2), 022067. doi:10.1088/1742-6596/1168/2/022067
Ma, S. Q., Cai, S. J., and Guo, M. (2012). Seepage-stability analysis of a mine tailings dam in yunnan province based on ANSYS. Appl. Mech. Mater. 226-228, 1406–1410. doi:10.4028/www.scientific.net/amm.226-228.1406net/AMM.226-228.1406
Mcdermott, R. K., and Sibley, J. M. (2000). The aznalcóllar tailings dam accident - a case study. Min. Res. Eng. 9 (1), 101–118. doi:10.1142/s0950609800000111
Ministry of Housing and Urban-Rural Development of the People’s Republic of China (2013). Tailings facility design specification. GB50863–2013. Beijing, China: China Planning Press. (in Chinese).)
Nanjing Hydraulic Research Institute (2019). Present situation of phosphogypsum stacking dam and stability evaluation after heightening. Nanjing: NHRI, Jiangsu. (in Chinese).
Nie, W., Luo, M., Wang, Y., and Li, R. (2022). 3D visualization monitoring and early warning system of a tailings dam—gold copper mine tailings dam in zijinshan, fujian, China. Front. Earth Sci. (Lausanne). 10 (2022), 800924. doi:10.3389/feart.2022.800924
Pak, A., and Nabipour, M. (2017). Numerical study of the effects of drainage systems on saturated/unsaturated seepage and stability of tailings dams. Mine Water Environ. 36 (3), 341–355. doi:10.1007/s10230-017-0468-y
Salazar, F., Morán, R., Toledo, M. Á., and Oñate, E. (2015). Data-based models for the prediction of dam behaviour: A Review and some methodological considerations. Arch. Comput. Methods Eng. 24 (1), 1–21. doi:10.1007/s11831-015-9157-9,
Santillan, D., Fraile-Ardanuy, J., and Toledo, M. A. (2014). Prediction of gauge readings of filtration in arch dams using artificial neural networks. Tecnol. Y Ciencias Del Agua 5 (3), 83–98.
Schwenker, F., Kestler, H. A., and Palm, G. (2001). Three learning phases for radial-basis-function networks. Neural Netw. 14, 439–458. doi:10.1016/S0893-6080(01)00027-2
Sitharam, T. G., and Hegde, A. M. (2017). Stability analysis of rock-fill tailing dam: An Indian case study. Int. J. geotechnical Eng. 11 (4), 332–342. doi:10.1080/19386362.2016.1221574
Wang, L., Yang, X., and He, M. (2018). Research on safety monitoring system of tailings dam based on internet of things. IOP Conf. Ser. Mat. Sci. Eng. 322 (5), 052007. doi:10.1088/1757-899X/322/5/052007
Wang, W. S., Yin, G. Z., Wei, Z. A., Jing, X. F., Yang, Y. H., and Chen, Y. L. (2017). Analysis of the dynamic response and stability of fine grained tailings dam by upstream embankment method in the area of high intensity earthquake. Chin. J. Rock Mech. Eng. 36 (05), 1201–1214. (in Chinese). doi:10.13722/j.cnki.jrme.2016.1221
Xin, B., and Wan, L. (2019). Evaluation index system and grading standard for major hazard source of tailings pond. IOP Conf. Ser. Earth Environ. Sci. 252 (5), 052156. doi:10.1088/1755-1315/252/5/052156
Xu, Y., Huang, H., Li, Y., Zhou, J., and Wang, Y. (2021). A three-stage online anomaly identification model for monitoring data in dams. Struct. Health Monit. 21 (12), 1183–1206. doi:10.1177/14759217211025766
Yuan, L. W., Li, S. M., Peng, B., and Chen, Y. M. (2015). Study on failure process of tailing dams based on particle flow theories. Int. J. Simul. Model. 14 (4), 658–668. doi:10.2507/IJSIMM14(4)8.322
Yue, Z., Xu, G., Feng, L., and Yang, G. (2013). Study on safety evaluation for tailing reservoirs based on the IAHP-fuzzy comprehensive evaluation. IEEE Conference Anthology. IEEE., 01-08 January 2013, China. doi:10.1109/ANTHOLOGY.2013.6785067
Zhang, C., Chai, J., Cao, J., Xu, Z., and Lv, Z. (2020). Numerical simulation of seepage and stability of tailings dams: A case study in lixi, China. Water 12 (3), 742. doi:10.3390/w12030742
Zhang, H., Zhao, Y. S., and Li, X. (2015). Research on monitoring of tailings reserviors based on the internet of things. Saf. Environ. Eng. 22 (06), 143–150. (in Chinese). doi:10.13578/j.cnki.issn.1671-1556.2015.06.028
Keywords: tailings dam, cloud model, RBF neural network model, abnormal monitoring data, seepage field, safety evaluation
Citation: Dong K, Yang D, Yan J, Sheng J, Mi Z, Lu X and Peng X (2022) Anomaly identification of monitoring data and safety evaluation method of tailings dam. Front. Earth Sci. 10:1016458. doi: 10.3389/feart.2022.1016458
Received: 11 August 2022; Accepted: 25 August 2022;
Published: 13 September 2022.
Edited by:
Yusen He, Grinnell College, United StatesReviewed by:
Varoujan Sissakian, University of Kurdistan Hewler, IraqGang Ma, Wuhan University, China
Jungao Zhu, Hohai University, China
Copyright © 2022 Dong, Yang, Yan, Sheng, Mi, Lu and Peng. This is an open-access article distributed under the terms of the Creative Commons Attribution License (CC BY). The use, distribution or reproduction in other forums is permitted, provided the original author(s) and the copyright owner(s) are credited and that the original publication in this journal is cited, in accordance with accepted academic practice. No use, distribution or reproduction is permitted which does not comply with these terms.
*Correspondence: Jinbao Sheng, amJzaGVuZ0BuaHJpLmNu; Zhankuan Mi, emttaUBuaHJpLmNu