 Wanbo Liu
 Zhenghui Zhu
 Ling-en Wang
94% of researchers rate our articles as excellent or good
Learn more about the work of our research integrity team to safeguard the quality of each article we publish.
Find out more
ORIGINAL RESEARCH article
Front. Earth Sci., 27 September 2022
Sec. Geoscience and Society
Volume 10 - 2022 | https://doi.org/10.3389/feart.2022.1014490
This article is part of the Research TopicMeta-Scenario Computation for Social-Geographical SustainabilityView all 60 articles
Data mining student information helps to understand the compulsory education population size, structure, distribution and flow characteristics. Here, the spatial evolution, regional disparity, and emerging spatiotemporal distribution patterns are analyzed based on statistical data of primary and secondary education in Liaoning Province from 2010 to 2020. Demographic and spatial analysis methods, population size and structural changes were used in the assessments. The scale of primary and secondary school students in Liaoning Province declined, the gender imbalance was alleviated, and the proportion of migrant students increased. The distribution of students in primary and secondary schools is clearly unbalanced, and an increasingly evident central direction of flow from the countryside to the city exists. The overall difference in distribution of primary and secondary school students in Liaoning Province exhibits a trend of narrowing and then expanding, which is largely due to the uneven distribution among the non-agricultural municipal district, agriculture-related municipal district, and agriculture-related county. The emerging hot spot analysis patterns were dominated by consecutive and intensifying cold spots, spatiotemporal persistent and intensifying hot spots. Overall, these educational statistics and spatial analysis results provide important insights into population and educational geography.
With the rapid development of industrialization and urbanization, population size and demographic structure have undergone major changes (Wu et al., 2021; Liu T et al., 2022). This has manifested as a decline in birth rate and number of births, resulting in a shortage of students. In addition to the large-scale migration and flow of population, the population has moved from villages to towns, and from small and medium cities to large cities (Wu, et al., 2019; Liu Z et al., 2022). Education urbanization is the result of population urbanization and the dualization of urban and rural education, which is reflected in the transfer of rural students to urban schools (Fowler and Walberg, 1991; Mei et al., 2015; Ye et al., 2019; Xu et al., 2021). This has a profound impact on the size and structure of the compulsory education school-age population in big cities (Ding et al., 2018). On one hand, school-ready children either move with their migrant worker parents to study in another place or they transfer to a central school with higher teaching quality and become local left-behind children (Han and Yu, 2020). On the other hand, the cross-scale flow of students from rural to urban areas in the compulsory education stage has led to the continuous adjustment of the number, scale and layout of schools (Kenny, 1982; Zhao et al., 2022), and promoted changes in the distribution system, method and scope of compulsory education schools (Zhao et al., 2012; Hamnett and Butler, 2013). The spatiotemporal distribution of the educational population forms the basic feature of educational development level of a region or country (Zhao et al., 2020). Further, the increase or decrease in the number of students in primary and secondary schools is an important indicator of expansion or shrinkage of compulsory education schools (Zhao et al., 2016). Therefore, scientifically understanding the temporal and spatial evolution pattern of the compulsory education population is important for promoting the optimal allocation of educational resources and for sustainable economic and social development.
Previous studies have measured the distribution characteristics of the number of students in compulsory education and the changes in the scope of school services based on school size (Yang et al., 2018; Liu et al., 2020; Zhang et al., 2020; Sajjad et al., 2022). Liu and Chen (2019) determined that the number of students in individual schools can affect the number of students in other schools through inter-school interactions. Some studies selected big cities or villages as case studies of typical regions, with interesting results. For example, Yin et al. (2016) found that the proportion of non-Beijing students in compulsory education in Beijing increased rapidly between 2001 and 2015. Liu and Liu (2017) conducted an empirical study in Biyang County, Henan Province from 2004 to 2016, and determined that the development in the county center had a strong radiation effect on the surrounding towns, resulting in a sharp decline in the number of primary and secondary school students in rural areas, and a concentration in the county center. In addition, some studies have been based on a nationwide provincial scale. Among these, based on the 1987–2014 “China Education Statistical Yearbook”, Wu et al. (2018) selected the number of urban and rural students in compulsory education, and investigated the temporal changes and inter-provincial differences of China’s education urbanization.
To summarize, extensive research has been conducted on temporal changes and spatial differences in the number of students in compulsory education in different regions, urban and rural areas, and between schools. However, the geographic interpretation of educational activities in existing research remains limited and misunderstood (Hones and Ryba, 1972) and analysis beyond the study area and across scales is lacking (Zhang et al., 2022). Further, trend research based on large research samples, a large research scope, and long-term time-series distribution patterns is rare, which is highly important to study the evolution law of population distribution. Geography focuses on spatial distribution patterns, regional differences, and scale correlations. It has a tradition of spatial analysis and map language, which helps to understand the spatiotemporal evolution of characteristics, such as population and cities, and to fully comprehend the concept of regional development differences and cross-spatial correlations; advancing civil society and government decision-making (Yu et al., 2022a; Yu et al., 2022b). For instance, Liaoning Province, a province with significant changes in population structure and a relatively high level of educational development, is undergoing a rapid urbanization process. Thus, to a degree, Liaoning Province represents the epitome of demographic changes and social structural transformation in China. Therefore, the current study is based on the statistical data of the development of compulsory education in Liaoning Province. Here, we construct a geographic database and combine mathematical statistics and spatial analysis methods using different spatial scales such as cities, counties, and towns, to analyze the regional and urban-rural differences in the distribution of students in compulsory education schools in Liaoning Province. In addition, the temporal change characteristics and spatial clustering and dispersion characteristics are investigated. The innovation of this study is based on vast research samples and rich research scales, and combining temporal information, spatial information and attribute information of school data to explore the evolution characteristics of the temporal and spatial distribution of compulsory education students. This study provides a new perspective for investigating the spatial distribution of students in schools to help provide additional case areas worldwide.
Liaoning Province is located in the southern part of northeast China (Figure 1). As an important old industrial base in China, Liaoning Province has recently faced a profound economic and social transformation, and its population structure has undergone drastic changes. From 2010 to 2020, the regional and per capita GDP increased from 1,389.6 billion yuan to 2,511.5 billion yuan and from 31,888 yuan to 57,713 yuan, respectively. Liaoning Province has entered a stage of negative population growth to become a society with fewer births and an aging population, and the population has demonstrated a historical trend of change. The main contradiction in population development has shifted from population number to population structure. The 2010 and 2020 census data showed that the permanent population of Liaoning Province declined from 4,374.63 ten thousand to 4,259.14 ten thousand, whereas the urbanization rate increased from 62.10% to 72.14%. The number of students in compulsory education in Liaoning Province decreased from 345.48 ten thousand in 2010 to 296.84 ten thousand in 2020. Due to the regional and urban-rural differences in the level of social and economic development, the population flow has exhibited a trend from villages to towns, and from small towns to large cities. The number of students studying in different locations during the compulsory education stage has increased from 22.95 ten thousand in 2010 to 26.26 ten thousand in 2020. By the end of 2020, Liaoning Province had jurisdiction over 14 prefecture-level cities including Shenyang and Dalian, 100 county-level administrative districts, and 1,350 township-level districts. Based on the administrative divisions of Liaoning Province by the end of 2020 and the “Liaoning Provincial Statistical Yearbook 2021”, this study delineated 23 non-agricultural municipal districts, 36 agricultural municipal districts, 41 counties (Figure 1). Among these, non-agricultural municipal districts refer to municipal districts that do not involve agriculture, rural areas and farmers. Agriculture-related districts and counties refer to municipal districts or counties that involve agriculture, rural areas, and farmers. According to the “Regulations on Statistical Division of Urban and Rural Areas” approved by the State Council of People’s Republic of China and the “China Counties Statistical Yearbook (2021),” we delineated Chengguan towns and agricultural towns to delineate urban and rural areas at the town scale. Among them, Chengguan towns and subdistricts were generally urban areas with a relatively developed economy and agglomerated population, and a high level of urbanization in the county, whereas agricultural towns and streets were primarily rural areas with relatively important primary industries.
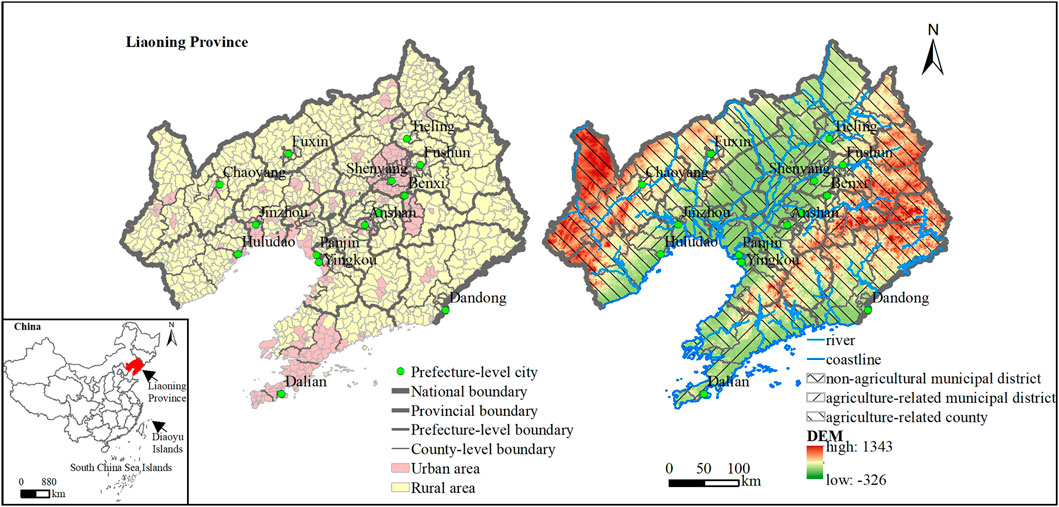
FIGURE 1. Location of Liaoning Province, China.
The data acquired in this study included basic geospatial data and socioeconomic statistics of Liaoning Province (Table 1). Data preprocessing included determining school lists and school coordinates as well as the extraction of student information. The school list was determined according to the research scope of compulsory education schools, and the reserved school type codes were 211 (primary school), 218 primary school teaching points, 219 (primary school classes attached), 311 (junior middle school), 312 (nine-year consistent system school), 319 (with ordinary junior high school classes), and 345 (twelve-year consistent schools). To determine school coordinates, we first compared and analyzed information from the Baidu map (https://map.baidu.com/), Baidu search engine (https://map.baidu.com/), and Google Earth satellite images to confirm the geographic location of each school. Then, we obtained the BD-09 geographic coordinates of each school using the Baidu Map Coordinate Picking System (https://api.map.baidu.com/). Finally, we used the Baidu Map APIs (forward and reverse geocoding function) provided by the Baidu Map Open Platform (https://lbsyun.baidu.com/) to convert the BD-09 geographic coordinates into WGS1984 geographic coordinates. To extract student information, we used 2020 as the standard year to identify 14 prefecture-level cities, 100 county-level administrative units, and 1,530 town-level administrative units in Liaoning Province. Then, we used Microsoft Excel 2019 and ArcGIS 10.7, according to the gender, source and education stage of the students, to summarize the number of students in each school into their respective research unit.
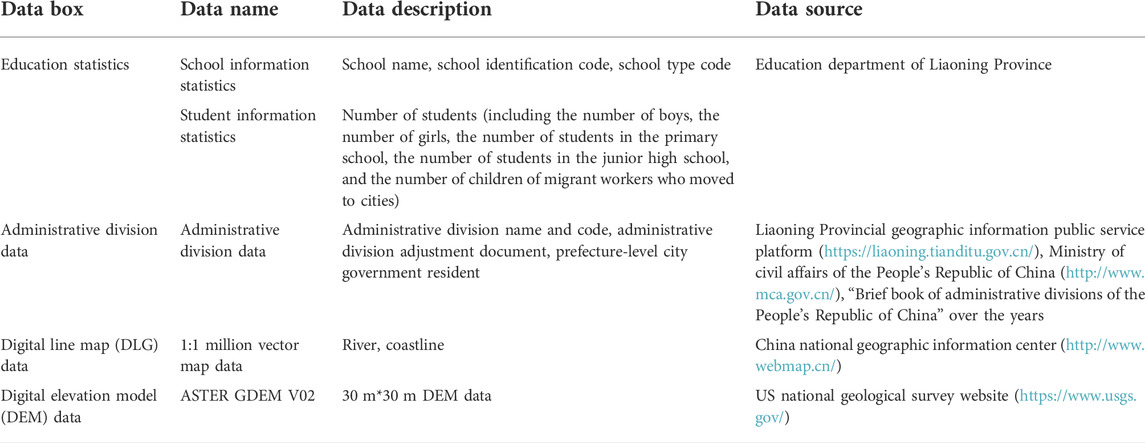
TABLE 1. Data sources and descriptions.
We used data from Liaoning Province between 2010 and 2020 in this study. First, a multi-dimensional analysis of the population, gender structure, student source composition, and education stage of primary and secondary school students was performed based on educational statistics and geospatial data, and using demographic methods. Next, using standard deviational ellipse and the center of gravity transfer method, the spatial evolution characteristics of primary and secondary school students at the municipal scale were analyzed. Third, using the one-stage decomposition method of Theil indices, the regional difference characteristics of primary and secondary school students at the county level were analyzed. Finally, using the emerging spatiotemporal hotspot analysis method, the emerging spatiotemporal distribution pattern of primary and secondary school students at the township level was analyzed. The technical route of this study is shown in Figure 2.
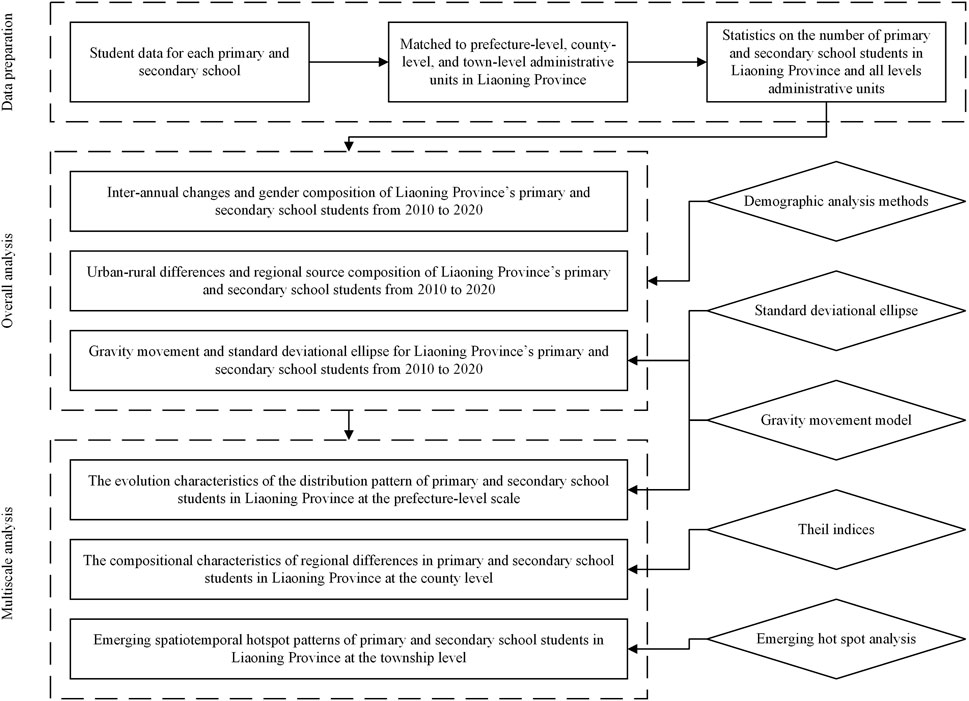
FIGURE 2. Flow diagram of this study.
Standard deviational ellipse, a classical method to analyze the directional characteristics of spatial distribution, primarily uses the center, long, and short axes as the basic parameters to quantitatively describe geographical elements and was first proposed by Lefever (Lefever, 1926). In physics, the “center of gravity” refers to the point of action where the force exerted on each point in the object produces a resultant force. The direction of the deviation of the center of gravity indicates the “high-density” part of the distribution of students in the school, while the migration of the center of gravity reflects the aggregation and displacement law of students in the study area. The size and declination angle (major semi-axis) of the standard deviation ellipse reflects the concentration and dominant direction of the spatial distribution pattern of school students, respectively. Using the spatial difference of the standard deviation ellipse and the center of gravity of students in Liaoning Province reflects the distribution characteristics of students in the two-dimensional space and identifies the core gathering area of students. This study used an ellipse with one standard deviation, which covered approximately 68% of the study element amount. The formula used is as follows (Bai et al., 2021):
In the formula,
Theil indices can be broken down into independent inter-group and intra-group gaps and are widely used to measure relative differences in phenomena such as economic development, income distribution, and population distribution (Xu et al., 2005; Yan and Bian., 2008). The expression is as follows:
where,
If the sub-region is used as the basic space unit, Theil indices
where:
If the interregional difference of the sub-region
Then the Theil indices
where:
Emerging hot spot analysis refers to the generation of a space-time cube of time and space NetCDF as input by specifying neighborhood distance and time step to perform Getis-Ord
Hot spot analysis is often used to reveal the spatial agglomeration features of a local area and identify statistically significant spatial clusters of high values (hot spots) and low values (cold spots). The calculation formula of Getis-Ord
In the formula:
where:
The Mann-Kendall trend analysis method is a nonparametric statistical test method for testing independent space-time column series. For a time series with a sample size of
When the statistic follows a normal distribution, the variance is as follows:
Corresponding z-scores and p-values were obtained using Mann-Kendall trend analysis. If the z-score was greater than 1.65, it indicates that the time series was in an upward trend, that is, the number of primary and secondary school students increased annually; if the z-score was less than −1.65, it infers that the time series was in a downward trend, that is, the number of primary and secondary school students decreased annually; if the z-score is greater than 1.65, it indicates that there was no significant change in the number of primary and secondary school students with time series. The significance level was determined according to the range of the p-value. According to z-scores and p-values, the significance of cold and hot trends in the number of primary and secondary school students was classified into several categories such as new, consecutive, intensifying, persistent, diminishing, sporadic, oscillating, historical, 16 hot and cold patterns, and no pattern detected (Li et al., 2021).
Figure 3A shows that the number of primary school students in Liaoning Province decreased from 218.25 ten thousand to 196.61 ten thousand, representing a decrease of 9.99%, and was accompanied by a decline in the sex ratio from 113.42 to 109.24 between 2010 and 2020. Figure 3B demonstrates that the number of junior high school students in Liaoning Province decreased by 21.22% from 127.23 ten thousand to 100.23 ten thousand, and was accompanied by an increase in the sex ratio from 110.07 to 111.11. We observed that the number of students in primary and junior high schools experienced an initial fluctuation followed by a slight increase. We determined that the ratio of primary to junior high school students rose from 1.72 to 1.96. In general, a reducing trend in the scale of primary and secondary school students in Liaoning Province occurred. In recent years, the number of students in school has remained stable, and the downward trend has been curbed. In addition, the imbalance between males and females has been alleviated to a certain extent.
FIGURE 3. Inter-annual changes and gender composition of Liaoning Province’s primary and secondary school students from 2010 to 2020.
Figure 4A shows that from 2010 to 2020, the number of local primary school students in Liaoning Province decreased from 201.48 ten thousand to 178.64 ten thousand, a decrease of 11.34%, accompanied by a decline in the sex ratio from 111.69 to 108.32. Figure 4B shows that the number of local students in junior high schools in Liaoning Province decreased by 23.38% from 62.92 ten thousand to 48.21 ten thousand, accompanied by an increase in sex ratio from 108.25 to 110.25 during the study period. We determined that the number of local students in primary and junior high schools initially fluctuated and decreased before becoming stabilized. The ratio of number of local students in primary schools to that in junior high schools rose from 1.66 to 1.94, suggesting that Liaoning Province has faced the increasing issue of low birthrate which has impacted compulsory education since the beginning of the 21st century.
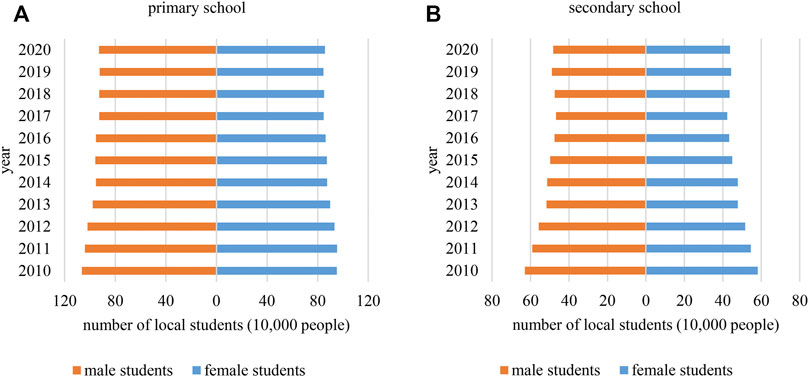
FIGURE 4. Inter-annual changes and gender composition of Liaoning Province’s primary and secondary school local students from 2010 to 2020.
Figure 5A shows that from 2010 to 2020, the number of migrant students in primary schools in Liaoning Province increased by 7.22% from 16.77 ten thousand to 17.98 ten thousand, accompanied by a decrease in the sex ratio from 136.70 to 118.74. Figure 5B shows that the number of migrant students in junior high schools increased from 6.18 ten thousand to 8.28 ten thousand, an increase of 34.02%, with a decrease in the sex ratio from 153.42 to 121.09. We observed fluctuation in both the number of migrant students in primary and junior high schools. The ratio of migrant students in primary schools to those in junior high schools declined from 2.71 to 2.17. This finding indicates a trend of increasing population mobility in Liaoning Province, with more children attending nearby schools, and more girls given this opportunity. Moreover, this suggests that the schooling needs of children of migrant workers have been met, and more children, especially girls, are no longer excluded. These further highlights that in addition to the exclusion issue of children in rural areas, the issue of urban migrant children requires attention.
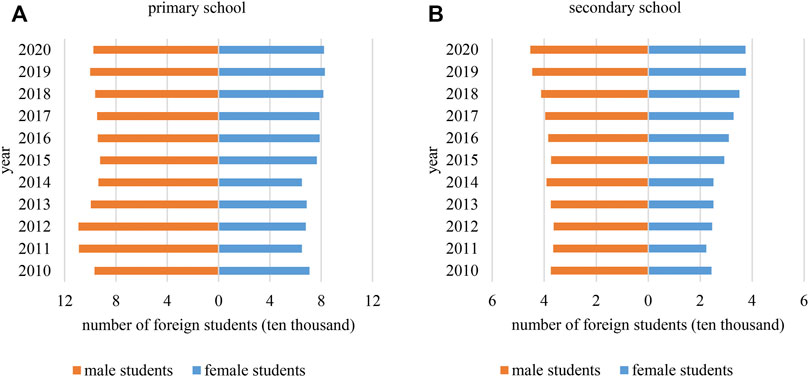
FIGURE 5. Inter-annual changes and gender composition of Liaoning Province’s primary and secondary school foreign students from 2010 to 2020.
As shown in Figure 6, the number of local students in urban areas was slightly higher than in rural areas in 2010, with the absolute scale being almost double that of rural areas in 2020. Over the past 10 years, the vast majority of students from different areas have been concentrated in urban areas, and this trend is becoming increasingly evident. We found that the number of local students in urban areas declined slightly before 2017 and then remained stable. After 2017, the number of urban and rural students exhibited an increase of 8.77% over the 10 years. However, the number of local students in rural areas continued to decline, with a 41.97% decrease over the 10 years. Similarly, we observed a fluctuating upward trend in the number of migrant students in urban areas, whereas in rural areas a fluctuating downward trend occurred, with an increase of 15.93% and a decrease of 21.25%, respectively. Overall, a gap between urban and rural areas appears to be growing as urban areas have been attracting the school-age population, leading to the continuous loss of students in rural areas. This is becoming an increasingly serious issue.
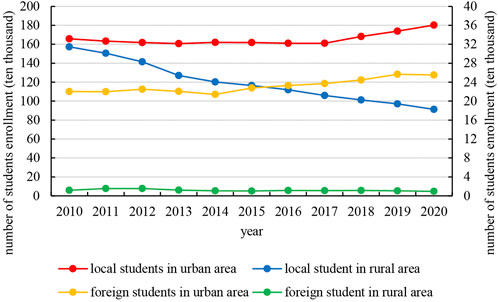
FIGURE 6. Urban-rural differences and regional source composition of Liaoning Province’s primary and secondary school students from 2010 to 2020.
As shown in Table 2 and Figure 7, the rotation angle of the standard deviational ellipse of primary and secondary school students fluctuated within the range of 41–52° for a long period of time, indicating that the distribution of primary and secondary school students mainly follows the northeast-southwest direction. In particular, the rotation angle of the standard deviation ellipse exhibited a decreasing trend, from 51.152° in 2010 to 41.657° in 2020. We also recorded an area of the standard deviational ellipse that was slightly changed, whereas the size of the ellipse remained stable. The aggregation area of primary and secondary school students exhibited a tendency of moving towards coastal areas. In addition, the influence of Dalian and Shenyang on the distribution of primary and secondary school students in Liaoning Province gradually increased. We determined that the major semi-axis primarily fluctuated in the range of 181–186 km, indicating an expansion trend. Whereas, the short semi-axis fluctuated in the range of 131–136 km, showing a shrinking trend. Based on the changes of the long and short semi-axes, we found that the distribution of primary and secondary school students exhibited a continuous expansion trend in the north-south direction and a continuous contraction trend in the east-west direction. Moreover, the flat rate exhibited a continuously increasing trend from 2010 to 2020, indicating that the distribution area of primary and secondary school students in Liaoning Province was approximately circular, with a flattening trend.
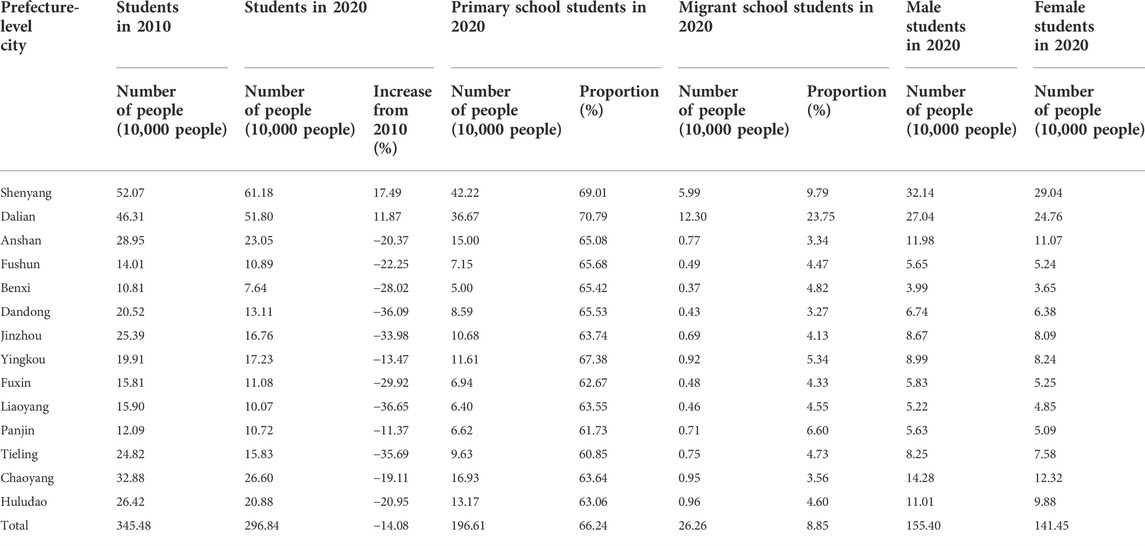
TABLE 2. Inter-city differences in the number of Liaoning’s primary and secondary school students in 2010 and 2020.
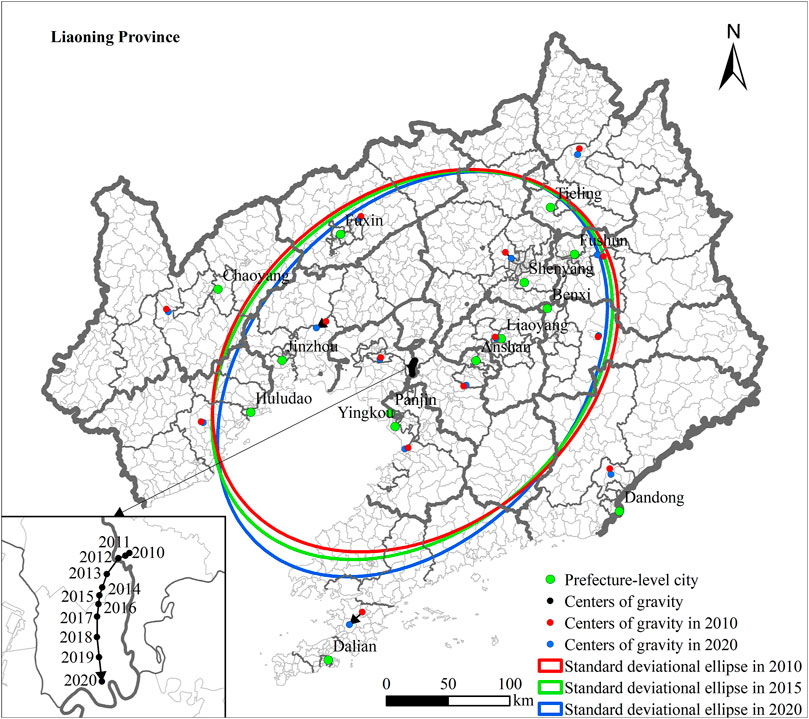
FIGURE 7. Gravity movement and standard deviational ellipse for Liaoning Province’s primary and secondary school students from 2010 to 2020.
Judging from the movement trajectory of the center of gravity (Table 2; Figure 7) from 2010 to 2020, the distribution center of gravity of primary and secondary school students in Liaoning Province shifted by a total of 12.022 km, with an apparent trend of moving south to west. More specifically, from 2010 to 2012, we determined that this moved 1.049 km in a west–south direction, from 2013 to 2017 it moved 7.172 km in a west-southwest direction, and from 2018 to 2020 it moved 3.802 km in a south-east direction. In conclusion, from 2010 to 2012, the center of gravity showed a westward dominant moving direction, with a shorter moving distance, whereas from 2013 to 2020, the center of gravity demonstrated a southward dominant moving direction, with a longer moving distance. This southward moving trend of the center of gravity became increasingly obvious with time.
Table 3 shows that in 2010 and 2020, Shenyang and Dalian ranked as the top two for the number of students; moreover, these were the only two cities with an increase in student numbers. We observed that the number of students in the remaining 12 prefecture-level cities decreased by 10%. This finding demonstrated the obvious siphon effect of Shenyang and Dalian, highlighting the significant differences and serious imbalance between cities. In 2020, except for Shenyang, Dalian, and Yingkou, the proportion of primary school students in the remaining 11 prefecture-level cities was lower than the average of Liaoning Province. This suggests that the number of students in these 11 prefecture-level cities will be insufficient in follow-up supply and is facing huge pressure from the weak natural growth of the school-age population. In 2020, Dalian had the highest proportion (almost 25%) of migrant students. Moreover, the number of migrant students in Dalian was nearly half of that in Liaoning Province, indicating that Dalian, as the most economically developed city in Liaoning Province, has great advantage in attracting population. However, it also experiences the pressure of migrant children attending school. In addition, we determined that the scale of migrant students in Shenyang was relatively large and associated with a high proportion. Whereas, the other 12 prefecture-level cities are experiencing enormous pressure from the loss of school-age population. In 2020, the number of female students was significantly lower than that of male students, and the gender ratio was severely unbalanced. Among them, Chaoyang City had the highest gender ratio, which is related to the low level of local economic and social development and the prevailing ideology of “prefer sons to daughters.” Conclusively, Dalian and Shenyang are facing the pressures associated with the supply to primary and secondary schools, whereas the remaining 12 prefecture-level cities are suffering with a reduced number of students enrolled in school.
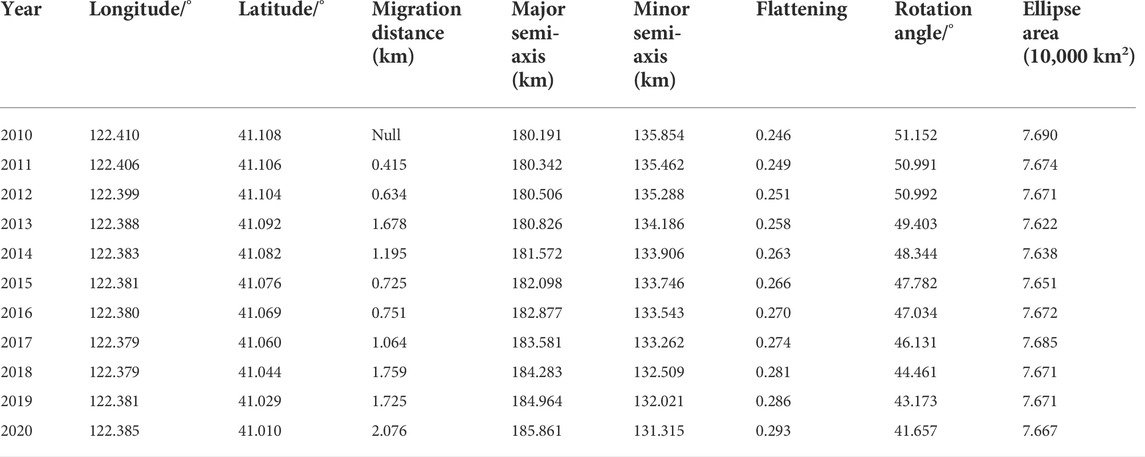
TABLE 3. Standard deviational ellipse parameters for Liaoning’s primary and secondary school students from 2010 to 2020.
In order to effectively observe the changes in the distribution centers of primary and secondary school students in various prefecture-level cities in Liaoning Province, as well as the relative positions of the centers of gravity and administrative centers which are represented by the prefecture-level city governments in different years, we calculated the coordinates of the center of gravity of the distribution of students in primary and secondary schools in prefecture-level cities in 2010 and 2020 and their distance from the administrative center (Table 4). According to Figure 7 and Table 4, the distance between the distribution center of primary and secondary school students in 14 prefecture-level cities in Liaoning Province (2010–2020) and the administrative center narrowed, with all shifting in the direction of the urban administrative center. The administrative center is often an economic and cultural center and this finding reveals that the center orientation of the distribution of students in schools was strengthened, with the students in primary and secondary schools showing a trend of flowing out from the edge and into the center. We detected that the center of gravity migration distance was the longest in Dalian, reaching 14.431 km, followed by Jinzhou (9.344 km) and Shenyang (6.660 km). This indicates that the distribution of primary and secondary school students in these cities has undergone a relatively drastic change in the centripetal direction, revealing clear educational urbanization in which rural students are first concentrated in urban schools.
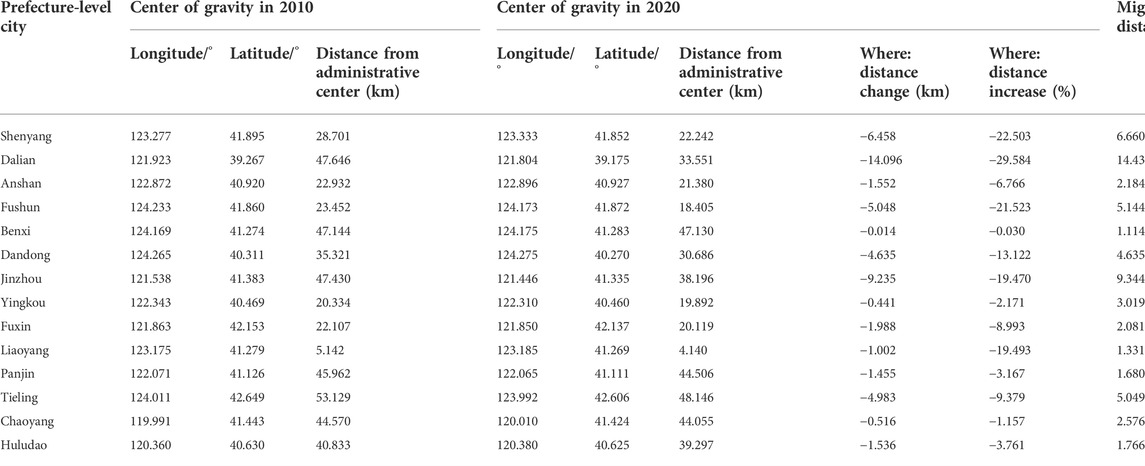
TABLE 4. Gravity parameters of the number of primary and secondary school students in 14 prefecture-level cities in Liaoning Province from 2010 to 2020.
Theil indices
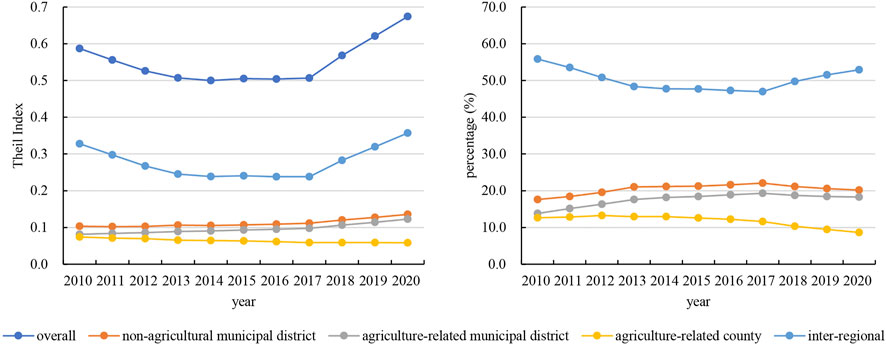
FIGURE 8. One-stage nested decomposition of Theil index of the distribution of students in primary and secondary schools of Liaoning Province from 2010 to 2020.
The contribution of regions to the overall difference in Liaoning Province first decreased from 55.87% (2010) to 46.99% (2017) and then increased to 52.92% in 2020 (Figure 8). The contribution of non-agricultural municipal districts and agricultural municipal districts increased from 17.63% to 13.84% in 2010, respectively, to 22.07% and 19.31% in 2017, and then decreased to 20.17% and 18.27% in 2020, respectively. The contribution of agricultural counties to the overall difference in Liaoning Province first increased from 12.66% (2010) to 13.25% (2012), and then decreased to 8.64% in 2020. Therefore, from 2010 to 2020, the contribution of the differences between the three major regions to the changes in the overall differences in Liaoning Province first declined and then increased, remaining at approximately 50%. This indicates that the expansion of the overall difference change in Liaoning Province was largely due to the uneven distribution among the three regions. The distribution of primary and secondary school students is unbalanced among the county-level administrative units in non-agricultural municipal districts and agricultural-related municipal districts, and there are large differences between county-level administrative units. However, the distribution of students in primary and secondary schools among the county-level administrative units in the agriculture-related counties and districts is relatively balanced, and the differences between the county-level administrative units are relatively small.
Using the Space-Time Pattern Mining (STPM) toolbox of ArcGIS Pro2.5 with the “Create Space Time Cube From Defined Locations” tool, and setting the time step interval to 1 year, we created the space time cube of the number of primary and secondary school students. This represented the changes in the number of primary and secondary school students in each township and street over time. Subsequently, we used emerging hot spot analysis to analyze the emerging spatiotemporal hot spot patterns. Based on Mann-Kendall trend analysis, we calculated a z-score of −2.647 and a p-value of 0.008, which indicated that with time, the overall change trend in the number of primary and secondary school students in Liaoning Province was decreasing.
According to analysis of the emerging spatiotemporal hotspots (Figure 9), we determined that the number of cold spots (595) for the primary and secondary school students in Liaoning Province from 2010 to 2020 was higher than the number of hot spots (362). In particular, hot spots were concentrated in the areas along the line from Shenyang to Dalian in central Liaoning Province. Conversely, cold-spot areas were concentrated in the eastern and western regions of Liaoning Province. Interestingly, hot and cold spot areas were separated by areas with no cold-spot pattern. Specifically, we identified 287 intensifying hot spots, with characteristics of aggregation distribution. Intensifying hot spots were mainly distributed in municipal districts of Shenyang City, municipal districts of Dalian City (except Pulandian district), Anshan City, Yingkou City and its surrounding areas, and a small number in Tieling City, Fuxin City, Chaoyang City, Jinzhou City, and Huludao City. This finding showed that in the past 11 years, significant hot spots were detected in at least 10 of the years, accompanied by a significant increase in the number of primary and secondary school students. We identified 60 persistent hot spots, mainly in Liaoyang City, Anshan City, and Yingkou City. These areas maintained a large number of primary and secondary school students for a long time, retaining an unaltered intensity of hot spots over time. We also detected 10 consecutive hot spots scattered in Gaizhou county-level city under Yingkou City, and Pulandian District under Dalian City, indicating that the number of primary and secondary school students in these areas had always been high. Historical hot spots were detected in a total of five township-level administrative units, which are located in Liaozhong District under Shenyang City, Panshan County under Panjin City, Wensheng District and Liaoyang County under Liaoyang City, and Liaoyang County under the jurisdiction of Liaoyang City. These five township-level administrative units were not significant hotspots in recent years, but have been hotspots for a long time previously. We also identified 463 consecutive cold spots, which were widely distributed in the eastern and western regions of Liaoning Province, indicating that the number of primary and secondary school students in these regions had always been small. In particular, we detected 99 intensifying cold spots, mainly located in Chaoyang City, Huludao City, Fuxin City, Jinzhou City, Tieling City, and Fushun City. This finding demonstrates that in the past 11 years, significant cold spots in urban and rural areas were present for at least the last 10 years, and accompanied by a significant increase in the number of primary and secondary school students. We further detected 32 new cold spots, which were widely distributed and scattered in Tieling, Dandong, Fuxin, and other prefecture-level cities. The number of students in primary and secondary schools in these areas was low for the first time in 2020, and no area exhibited a new high value for the number of students in primary and secondary schools. Liushan subdistrict, Xinfu District, and Fushun City were the only sporadic cold spots. This finding indicated that in the past 11 years, the number of primary and secondary school students was high for most of the years.
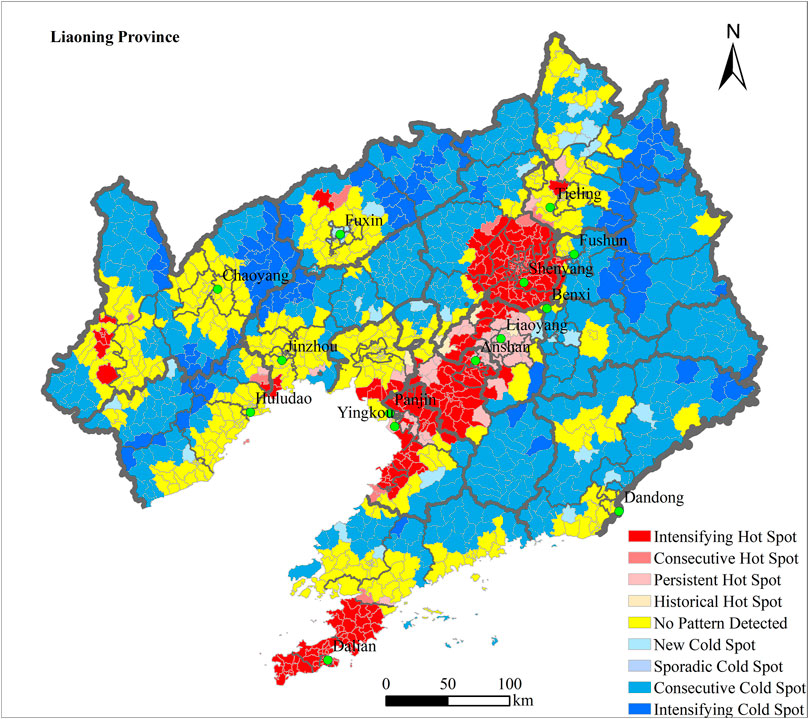
FIGURE 9. Emerging hot spot analysis of Liaoning Province’s primary and secondary school students from 2010 to 2020.
This study explores the spatial distribution characteristics of compulsory education students at different scales over time, as well as regional and urban-rural differences. Although the trend of population concentration in compulsory education helps to achieve the agglomeration effect, it has caused unfair allocation of compulsory education resources (Zheng et al., 2011), and aggravated the social and economic development between different regions and urban and rural areas. Differences strengthen the phenomenon of educational grouping, hindering the mobility of social classes (Song et al., 2021), and pose an important challenge to the quality and balanced development of urban and rural compulsory education. First, the population facing compulsory education is constantly flowing from rural areas to concentrate in urban areas. In order to allow more school-age children to receive equal education, reasonable plans and supporting measures should be given for the decommissioning of rural schools, and compulsory education schools in central urban areas should be added or expanded. Secondly, the uneven distribution of the population in compulsory education is an inevitable phenomenon in the process of social and economic development. The new-type urbanization construction must adhere to the concept of “people-oriented” and “serving the family”, and accelerate the process of urbanization of the floating population. Finally, due to the impact of low fertility and low birthrate, the number of students in primary and secondary schools has been reduced, the number of students in school has declined significantly, and the risk of population structure imbalance in compulsory education has increased. Thus, it is necessary to continuously improve the safety awareness of population development, build a fertility-friendly society, and achieve a long-term balanced development of the population with compulsory education.
This study surveyed thousands of compulsory education schools and millions of students in Liaoning Province and assigned them spatial attributes. Spatial panel data was formed and a geographic database was established through combinations with administrative division data in 2020. Next, we analyzed the spatiotemporal distribution characteristics of primary and secondary school students in Liaoning Province from 2010 to 2020, and identified emerging local characteristics based on the overall characteristics. Our findings were compared with the traditional hotspot analysis method, such as local indictor of spatial association (Local Moran’s I, LISA), Getis-Ord
Based on the theory and methods of spatial statistics, including emerging spatiotemporal hotspot analysis and the standard deviational ellipse method, as well as other methods such as Theil indices, the temporal and spatial variation characteristics and trends of the distribution of primary and secondary school students, and regional and urban-rural differences, in Liaoning Province from 2010 to 2020 were investigated. Our main findings were as follows:
(1) The number of students in primary and secondary schools in Liaoning Province has declined but stabilized in recent years, and the gender imbalance has been alleviated to a certain extent. The reduction in the scale of students in secondary schools was greater than that in primary schools. The number of migrant students has also grown rapidly, whereas the gender ratio has dropped.
(2) The distribution of primary and secondary school students in Liaoning Province mainly followed a northeast-southwest distribution, exhibiting a trend of spatial shrinkage. The distribution center of primary and secondary school students in Liaoning Province primarily moved to the south, with the agglomeration area showing a tendency to move to coastal areas. From 2010 to 2020, the distance between the distribution center of primary and secondary school students in 14 prefecture-level cities in Liaoning Province and the administrative center were narrowed, and the directivity of the center was strengthened, demonstrating the characteristics of outflow from the edge and inflow to the center. Among them, the most typical prefecture-level cities for education urbanization were Dalian and Shenyang.
(3) There was evident inter-city, regional and urban-rural differences in the scale of primary and secondary school students and their changing trends in Liaoning Province. Shenyang and Dalian exhibited a large-scale, rapid growth, and a high proportion of migrant students. The number of primary and secondary school students in other cities, most of which are local, has decreased, and this decline has been relatively intense. There were obvious regional differences among non-agricultural municipal districts, agricultural-related municipal districts, and agricultural-related counties. Urban areas have absorbed a large number of primary and secondary school students, and there is a serious loss of primary and secondary school students in rural areas.
(4) Consecutive cold spots and intensifying cold spots were the main emerging spatiotemporal hot spot patterns of primary and secondary school students in Liaoning Province, with the cold spot areas being mainly located in the eastern and west-ern regions of Liaoning Province. Hot spots were mainly located in the dual-core with their axis area consisting of central urban areas of Shenyang prefecture-level city and central urban areas of Dalian prefecture-level city in Liaoning Province, and were mainly manifested as emerging spatiotemporal persistent and intensifying hot spots.
The raw data supporting the conclusions of this article will be made available by the authors, without undue reservation.
Methodology, WL; software and validation, WL; formal analysis, WL and LW; writing—original draft preparation, WL and ZZ; writing—review and editing, WL; visualization, WL; funding acquisition, ZZ. All authors contributed to the article and approved the submitted version.
This work was supported by the Humanities and Social Sciences Research Project of Liaoning Provincial Department of Education (Grant no. LJKQR2021046), the National Social Science Foundation of China (Grant no. 18BRK037), and Youth Innovation Promotion Association of Chinese Academy of Sciences.
The authors declare that the research was conducted in the absence of any commercial or financial relationships that could be construed as a potential conflict of interest.
All claims expressed in this article are solely those of the authors and do not necessarily represent those of their affiliated organizations, or those of the publisher, the editors and the reviewers. Any product that may be evaluated in this article, or claim that may be made by its manufacturer, is not guaranteed or endorsed by the publisher.
Bai, B., Xue, Z. Q., Zhao, P., and Zhang, Z. (2021). Functionalizations of boron nitride nanostructures. Sci. China Technol. Sci.Geogr 64, 1–10. doi:10.15957/j.cnki.jjdl.2021.02.00110.1007/s11431-020-1559-2
Ding, X. S., Wu, Z. H., and Xia, B. S. (2018). An analysis of the scale and structure of the school-age population of compulsory education in big cities under the background of urbanization. J. Educ. Sci. HNNU. 17, 66–74. doi:10.19503/j.cnki.1671-6124.2018.04.009
Fowler, W. J., and Walberg, H. J. (1991). School size, characteristics, and outcomes. Educ. Eval. Policy Analysis 13, 189–202. doi:10.3102/01623737013002189
Getis, A., and Ord, J. K. (1992). The analysis of spatial association by use of distance statistics. Geogr. Anal. 24, 189–206. doi:10.1111/j.1538-4632.1992.tb00261.x
Hamnett, C., and Butler, T. (2013). Distance, education and inequality. Comp. Educ. 49, 317–330. doi:10.1080/03050068.2013.807165
Han, J. L., and Yu, J. Q. (2020). Children's educational choices by the new generation migrant workers' families in the trend of new-type urbanization. Soc. Sci. B 35, 4–13. doi:10.13262/j.bjsshkxy.bjshkx.200601
Hones, G. H., and Ryba, R. H. (1972). Why not a geography of education? J. Geogr. 71, 135–139. doi:10.1080/00221347208981469
Huang, J. X., Wang, J. F., Li, Z. J., Wang, Y., Lai, S. J., and Yang, W. Z. (2015). Visualized exploratory spatiotemporal analysis of Hand-Foot-Mouth disease in Southern China. PloS One 10, e0143411. doi:10.1371/journal.pone.0143411
Kenny, L. W. (1982). Economies of scale in schooling. Econ. Educ. Rev. 2, 1–24. doi:10.1016/0272-7757(82)90046-2
Langran, G. (1989). A review of temporal database research and its use in GIS applications. Int. J. Geogr. Inf. Syst. 3, 215–232. doi:10.1080/02693798908941509
Lefever, D. W. (1926). Measuring geographic concentration by means of the standard deviational ellipse. Am. J. Sociol. 32, 88–94. doi:10.1086/214027
Li, J., Zheng, B. Y., and Wang, J. F. (2021). Spatial-temporal heterogeneity of hand, foot and mouth disease in China from 2008 to 2018. Int. J. Geogr. Inf. Sci. 23, 419–430. doi:10.12082/dqxxkx.2021.190778
Liu, H. Y., Chen, W., and Li, S. (2019). Random loose packings of polydisperse adhesive microparticles with Gaussian size distribution. Powder Technol. 357, 64–73. doi:10.7523/j.issn.2095-6134.2019.01.01010.1016/j.powtec.2019.08.092
Liu, K., Liu, R. Z., Chen, T. T., and Nie, G. G. (2020). Scale and accessibility of school system and its spatial differentiation of elementary schools in Henan province. Sci. Geogr. Sin. 40, 1698–1709. doi:10.13249/j.cnki.sgs.2020.10.014
Liu, K., and Liu, R. Z. (2017). Spatial concentration tendency and unbalanced development of elementary and middle schools under the background of urbanization in central rural area: A case study of Biyang county in henan province. Geogr. Res. 36, 1680–1696. doi:10.11821/dlyj201709007
Liu, T., Peng, R. X., Zhuo, Y. X., and Cao, G. Z. (2022). China's changing population distribution and influencing factors: Insights from the 2020 census data. Acta Geogr. Sin. 77, 381–394. doi:10.11821/dlxb202202008
Liu, Z., Qi, H. G., and Liu, S. H. (2022). Labor shrinkage and its driving forces in China from 1990 to 2015: A geographical analysis. Appl. Spat. Anal. 15, 339–364. doi:10.1007/s12061-021-09414-2
Mei, H., Jiang, Q. B., Xiang, Y. Y., and Song, X. P. (2015). School consolidation: Whither China's rural education? Asian Soc. Work Pol. Rev. 9, 138–150. doi:10.1111/aswp.12053
Sajjad, M., Munir, H., Kanwal, S., and Asad Naqvi, S. A. (2022). Spatial inequalities in education status and its determinants in Pakistan: A district-level modelling in the context of sustainable development goal-4. Appl. Geogr. 140, 102665. doi:10.1016/j.apgeog.2022.102665
Song, Z. N., Hua, F. L., and Liu, S. L. (2021). Research progress and review of capitalization of compulsory educational resources. Prog. Geogr. 40, 1771–1787. doi:10.18306/dlkxjz.2021.10.013
Wu, J. W., Yu, Z., Wei, Y. H. D., and Yang, L. Q. (2019). Changing distribution of migrant population and its influencing factors in urban China: Economic transition, public policy, and amenities. Habitat Int. 94, 102063. doi:10.1016/j.habitatint.2019.102063
Wu, L., Jiao, H. F., Ye, L., and Tang, P. (2018). Temporal and spatial characteristics of provincial education urbanization in China and its influencing factors. Sci. Geogr. Sin. 38, 58–66. doi:10.13249/j.cnki.sgs.2018.01.007
Wu, L. X., Huang, Z. Y., and Pan, Z. H. (2021). The spatiality and driving forces of population ageing in China. PloS One 16, e0243559. doi:10.1371/journal.pone.0243559
Wu, Y. M., Wang, L., Fan, L. H., Yang, M., Zhang, Y., and Feng, Y. H. (2020). Comparison of the spatiotemporal mobility patterns among typical subgroups of the actual population with mobile phone data: A case study of beijing. Cities 100, 102670. doi:10.1016/j.cities.2020.102670
Xu, J. H., Lu, F., Su, F. L., and Lu, Y. (2005). Spatial and temporal scale analysis on the regional economic disparities in China. Geogr. Res. 24, 57–68. doi:10.11821/yj2005010007
Xu, W. W., Song, C. R., Sun, D. Q., and Yu, B. C. (2021). Spatiotemporal differentiation of the school-age migrant population in liaoning province, China, and its driving factors. Land 10, 1036. doi:10.3390/land10101036
Yan, Q. W., and Bian, Z. F. (2008). Study on population distribution inequalities based on the two-stage nested Theil decomposition method. Northwest Pop. J. 29, 103–106+110. doi:10.3969/j.issn.1007-0672.2008.05.005
Yang, H. M., Zhang, X. L., Li, L., Li, X. J., and Wang, B. (2018). Changing spatial pattern and accessibility of primary and secondary schools in a poor mountainous county: A case study of song county, henan province. Prog. Geog. 37, 556–566. doi:10.18306/dlkxjz.2018.04.011
Ye, L., Zeng, G., and Wang, Y. (2019). The influence of population urbanization and urban-rural development gap on education urbanization. Econ. Surv. 36, 9–15. doi:10.15931/j.cnki.1006-1096.20190521.002
Yin, D. T., Hu, Y. P., and Hao, W. Y. (2016). Interaction research between educational resources allocation and population development trend in Beijing. Popul. Econ. 37, 62–70. doi:10.3969/j.issn.1000-4149.2016.04.007
You, H. L., Yang, J., Xue, B., Xiao, X. M., Xia, J. H., Jin, C., et al. (2021). Spatial evolution of population change in Northeast China during 1992-2018. Sci. Total Environ. 776, 146023. doi:10.1016/j.scitotenv.2021.146023
Yu, H. S., Yang, J., Li, T., Jin, Y., and Sun, D. Q. (2022a). Morphological and functional polycentric structure assessment of megacity: An integrated approach with spatial distribution and interaction. Sustain. Cities Soc. 80, 103800. doi:10.1016/j.scs.2022.103800
Yu, H. S., Yang, J., Sun, D. Q., Li, T., and Liu, Y. J. (2022b). Spatial responses of ecosystem service value during the development of urban agglomerations. Land 11, 165. doi:10.3390/land11020165
Zhang, D. H., Zhou, C. S., and Xu, W. W. (2020). Spatial-temporal characteristics of primary and secondary educational resources for relocated children of migrant workers: The case of liaoning province. Complexity 2020, 1–13. doi:10.1155/2020/7457109
Zhang, Z. C., Luan, W. X., Tian, C., Su, M., and Li, Z. Y. (2022). Education equality and its influencing factors for migrant children in the compulsory education stage based on multi-source data: A case study of dalian, China. Front. Earth Sci. 10, 950853. doi:10.3389/feart.2022.950853
Zhao, C. X., Shao, J. A., Guo, Y., and Xu, X. L. (2016). Spatial pattern evolvement characteristics of rural schools and their development level in the mountainous area. Geogr. Res. 35, 455–470. doi:10.11821/dlyj201603005
Zhao, D., Wu, H. C., and Bruno, P. (2012). The impact of school closure on students’ schooling distance in rural areas: Based on GIS and ordinal logit model analysis. J. Educ. 8, 62–73. doi:10.3969/j.issn.1673-1298.2012.03.009
Zhao, Q. D., Huang, Y. H., and Liu, Y. S. (2020). Spatiotemporal evolution pattern and driving factors of higher-education population in China. Complexity 2020, 1–11. doi:10.1155/2020/1927364
Zhao, S. M., Rui, Y., and Yang, Y. H. (2022). The cross scale flow of students in the pre-school and compulsory education stages in the rural areas: A case study in chunhua county, shaanxi province. Geogr. Res. 41, 810–829. doi:10.11821/dlyj020210062
Zheng, T., Lv, B., and Zhang, C. (2011). Research on the inequity of compulsory education infrastructure for migrant children in beijing: A case study of fengtai district. Urban Dev. Res. 18, 115–123. doi:10.3969/j.issn.1006-3862.2011.10.019
Zhu, Y. L., Jing, C. F., Fu, J. Y., Du, M. Y., and Zhou, L. (2019). Analysis of space-time pattern of robbery crime based on space-time cube. Sci. Surv. Mapp. 44, 132–138. doi:10.16251/j.cnki.1009-2307.2019.09.019
Keywords: compulsory education, school student size, population distribution, education urbanization, spatial pattern evolution, regional disparity, urban-rural disparity
Citation: Liu W, Zhu Z and Wang L-e (2022) Spatiotemporal heterogeneity of primary and secondary school student distribution in Liaoning Province, China from 2010 to 2020. Front. Earth Sci. 10:1014490. doi: 10.3389/feart.2022.1014490
Received: 08 August 2022; Accepted: 12 September 2022;
Published: 27 September 2022.
Edited by:
Bing Xue, Institute for Advanced Sustainability Studies (IASS), GermanyReviewed by:
Huisheng Yu, Northeastern University, ChinaCopyright © 2022 Liu, Zhu and Wang. This is an open-access article distributed under the terms of the Creative Commons Attribution License (CC BY). The use, distribution or reproduction in other forums is permitted, provided the original author(s) and the copyright owner(s) are credited and that the original publication in this journal is cited, in accordance with accepted academic practice. No use, distribution or reproduction is permitted which does not comply with these terms.
*Correspondence: Zhenghui Zhu, enpoQGxubnUuZWR1LmNu
Disclaimer: All claims expressed in this article are solely those of the authors and do not necessarily represent those of their affiliated organizations, or those of the publisher, the editors and the reviewers. Any product that may be evaluated in this article or claim that may be made by its manufacturer is not guaranteed or endorsed by the publisher.
Research integrity at Frontiers
Learn more about the work of our research integrity team to safeguard the quality of each article we publish.