 Xiaoli Liu
 Tao Xia
 Jing Liu-Zeng
 Debeier Deng1
95% of researchers rate our articles as excellent or good
Learn more about the work of our research integrity team to safeguard the quality of each article we publish.
Find out more
ORIGINAL RESEARCH article
Front. Earth Sci. , 17 January 2023
Sec. Structural Geology and Tectonics
Volume 10 - 2022 | https://doi.org/10.3389/feart.2022.1012773
This article is part of the Research Topic Measuring and Modeling the Ground Deformation of Geological Disasters Using Modern Geodesy View all 11 articles
The 2020 Mw6.4 Nima earthquake is one of the largest normal-faulting earthquakes recently occurring north of the Banggong suture zone in remote central Tibet, where geologic investigation of active faults is extremely limited. We analyze jointly InSAR and GNSS observations over 9 months after the Nima earthquake and calculate the coseismic and postseismic displacement. The optimal coseismic slip model suggests this event is the result of moderate-angle down-dip slip on a complex reversed “S-shape” three-segmented structure at fault junctions of the West Yibu-Chaka fault, the Heishi fault, and an unmapped blind fault, with a small component of left-lateral slip. The superposition of seismic waves from faults with different strikes and dips accounted for a large non-double-couple component in the long-period point-source solutions. The geodetic moment released by the mainshock is 6.4 × 10¹⁸ N⋅m, equivalent to Mw 6.42. Coseismic rupture concentrated at a depth of 4–15 km, with a peak slip of 1.36 m at 8.5 km depth. The cumulative afterslip moment within 9 months after the mainshock is 1 × 10¹⁸ N m, about 15.6% of that released by the mainshock coseismic slip. The afterslips contributed largely to the release of additional strain energy. In addition, shallow creep on the northern part of the blind fault, and deep uplift on the east normal fault system are promoted by stress perturbations. A significant proportion of down-dip coseismic slip spreading to more than 20 km beneath the surface, and deep up-slip afterslip have implications for the rheology of down-dip extension of the dipping faults in northern Tibet. Two obvious stress loading zones of more than 1 bar highlight seismic hazards in the region, especially in the junction between normal faults and ends of the large-size sinistral Riganpei-Co and Jiangai-Zangbu faults. It is necessary to forecast accurately by longer-term afterslip observation over timescales of years for the faults. Compared with previous studies, our results suggest a more complex subsurface fault geometry linking the normal and strike-slip faults and dynamic stress adjustment in this poorly-known region of Tibet.
The Tibetan plateau comprises complex systems of connected and interacting faults. Several NS-trending rift systems developed in the central and southern part of the Tibet Plateau are aligned regularly and nearly perpendicular to the Himalayan collision arc due to the long-term effects of collision and compression of the India-Eurasia plates (Armijo et al., 1989; Tapponnier et al., 2001; Taylor et al., 2003; Kapp et al., 2008; Elliott et al., 2010; Yin and Taylor, 2011) (Figure 1). These rift systems are large in scale and accompanied by multiple groups of NS-trending normal fault systems. They are often associated with large EW-trending strike-slip faults, and together accommodate some of the spatially-varying strains in response to the India-Eurasia plate collision (Wang et al., 2014), and are bounded by the Bangong-Nujiang suture zone (BNS). There are significant differences in E-W extension rate and deformation styles on the northern and southern sides of the BNS. South of the BNS, the majority of E-W directed extension deformation is accommodated by several N-S normal-faulting systems (Molnar and Tapponnier, 1978; Armijo et al., 1989; Ha et al., 2019; Chevalier et al., 2020), with slip rates in the range of 1–3 mm/a (Harrison et al., 1995; Wu et al., 2015; Ha et al., 2019; Chevalier et al., 2020; Wang et al., 2020). However, the extension is not obvious in the central plateau north of the BNS, and the active tectonics is primarily marked by a series of discrete conjugate strike-slip faults. At the tail end of these faults, N-S normal-faulting plays a subsidiary role in the E-W extension of the plateau (Yin et al., 1999; Taylor et al., 2003; Taylor and An, 2009; Han et al., 2018). The late Quaternary slip rate of corresponding normal faults is mostly limited to 0.3–0.7 mm/a (Blisniuk and Sharp, 2003; Wu et al., 2015; Li et al., 2019).
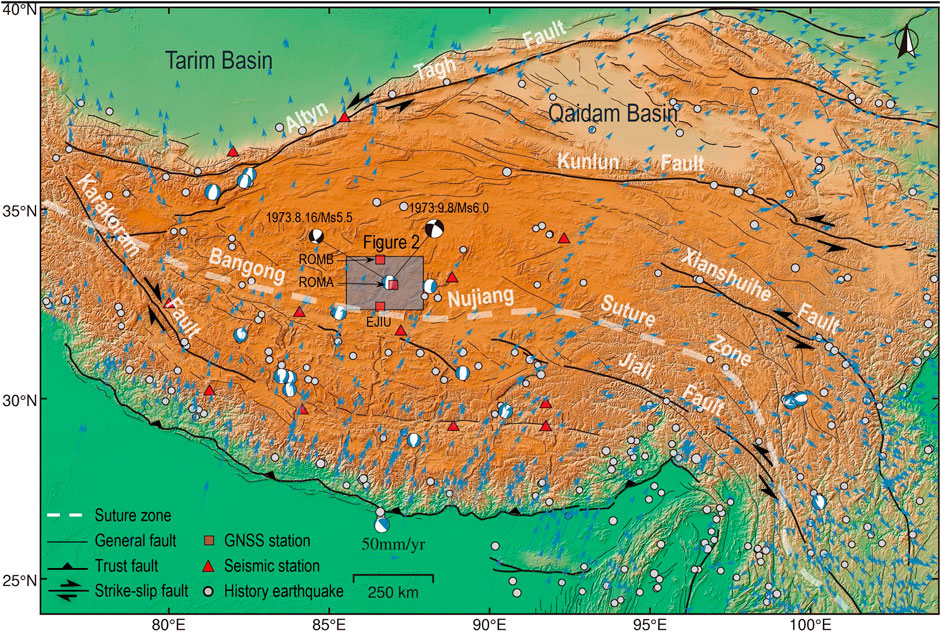
FIGURE 1. Topographic and tectonic setting map of the Tibetan plateau overlain. Light-blue circles, white and blue beach balls denote earthquakes with magnitude larger than Mw 4.5 and focal mechanisms of Mw ≥ 6 normal faulting earthquakes from 1 January 1966 to 1 April 2021 from the GCMT catalog, respectively. Black and white beach balls denote focal mechanisms of Ms ≥ 5.5 earthquake in 1973 (Molnar and Tapponnier, 1978). Red triangles denote the seismic stations used in this study. Black rectangles depict footprints of this study area. Black lines indicate regional active faults from Tapponnier (Tapponnier et al., 2001). Blue arrows indicates GPS velocities from Wang (Wang and Shen, 2020). Thrust faults have barbs on the upper plate, arrows indicate the direction of horizontal motion for strike-slip faults. The dashed white line is the Bangong Nujiang suture zone.
In central Tibet, NS-trending normal faults are kinematically linked with and subsidiary to the strike-slip faults. Moderate to large earthquakes are infrequent in central Tibet compared with the high seismicity in plateau margins. However, the Riganpei-Co, Yibu-Chaka, and Jiangai-Zangbu fault (RYJF) system (Figure 2) is important to note which held several moderate magnitude events since 1973. The ∼340 km long Riganpei Co fault is a NE-strike sinistral fault zone, conjugated with the EES-striking Gaize Dong-Co fault, lying on the southern side of the BNS (Taylor et al., 2003). It starts in Dongcuo Basin in the south, extends NEE∼NNE to the pull-apart Yibu Chaka basin, and then connects with the sinistral Jiangai-Zangbu fault on the north side of the basin (Taylor et al., 2003). The Yibu-Chaka basin is dissected by a series of NS∼NNE-striking normal faults into a symmetric horst-graben system, characterized by a negative flower structure (Gao et al., 2022). The largest graben is the Yibu-Chaka graben in the central of the basin, which connects two opposite dipping sets of domino normal fault blocks and is bounded by two primary normal faults (the west and east Yibu-Chaka faults, abbreviated as the WYF and EYF) (Li et al., 2021). A variety of late Quaternary features, including pressure ridges, sag ponds, and offset alluvial fans are identified along with the extensional fault system (Taylor et al., 2003). Well-defined offsets of 30–100 m of these units along the southwestern strike-slip portion of this fault were well-characterized and documented to estimate its Late Quaternary slip rate (Taylor et al., 2003).
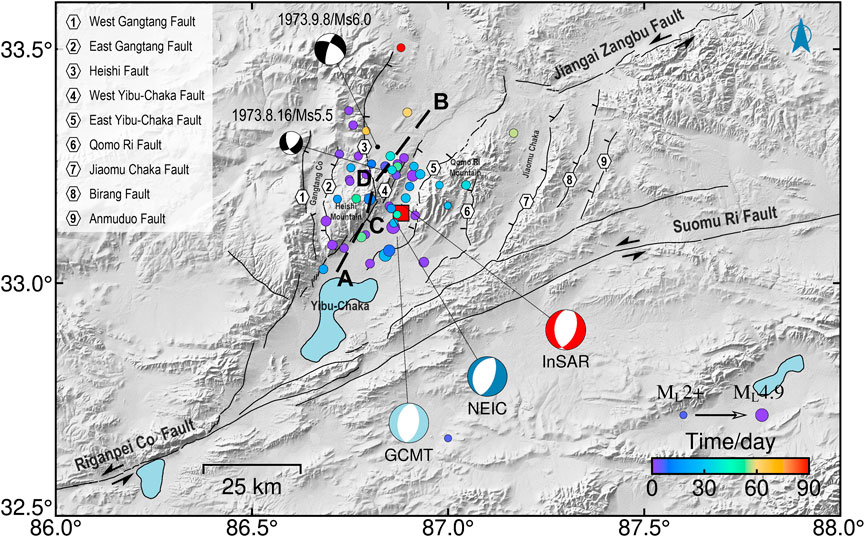
FIGURE 2. Topographic and tectonic setting map of the Yibu-Chaka graben. Black lines indicate regional active faults modified after Taylor and Yin (Taylor and An, 2009) and interpreted from satellite images. Focal mechanism solutions of the 2020 Nima event from different organizations in Table 1 and three color beach balls denote focal mechanisms of the mainshock from the GCMT and USGS catalogs, and this paper, respectively. The solid color circles are aftershocks within 9 months after the mainshock reported in the CENC (ML ≥ 2.7) catalogs, and the circle sizes indicate the magnitude of aftershocks. The black dash line is the derived fault trace via the geodetic dataset. Captions are as for Figure 1.
Recent moderate magnitude earthquakes of normal type are more frequent in this region. The Nima-Gaize earthquake sequence of Ms = 6.4, 5.9, and 5.4 in 2008 occurred in the junction of the southern end of the Riganpei-Co fault and the Gaize Dong-Co fault in southern-central Tibet (Ryder et al., 2010). A three Ms > 5.3 moderate earthquake sequence in 1973 occurred in the north of the Yibu-Chaka graben (Molnar and Tapponnier, 1978). The Nima Mw 6.4 earthquake in the center of the Yibu-Chaka graben on 22 July 2020 was the newest and strongest event in the RYJF system. The reported epicenter of the 2020 Nima earthquake was located in the Heishi range on the west of the Yibu-Chaka basin by the China Earthquake Networks Center (CENC) and the center of the Yibu-Chaka basin by the US Geological Survey (USGS), and the GCMT(https://www.globalcmt.org/CMTsearch.html) (Figure 2), respectively. Seismological long-period point-source moment tensor solution shows a relatively large non-double-couple (non-DC) component of >21% (Table 1). The significant non-DC component hints the mainshock is not properly represented with a single planar fault. This event may not be a simple shearing tectonic earthquake and is associated with geometrically complex shear faulting (Frohlich, 1994; Julian et al., 1998).
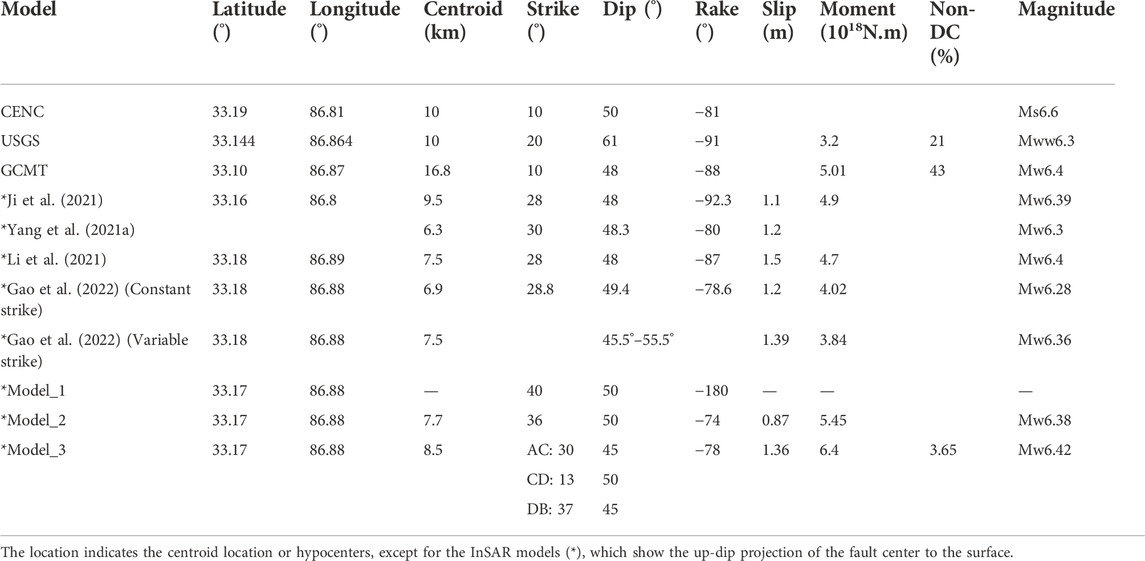
TABLE 1. Fault plane parameters for the mainshock from InSAR studies, and as listed in the CENC, USGS, and GCMT Catalogs.
Inversion of coseismic and postseismic deformations helps understanding the mechanics of fault interaction, the process of postseismic stress transfer, and viscous rheology properties of the lithosphere (Bürgmann and Dresen, 2008). InSAR is an ideal tool to study the 2020 Nima earthquake processing in this extremely remote part of Tibet. Several studies from InSAR data have suggested that the Nima earthquake occurred on the WYF with a constant-strike angle (Yang et al., 2021a; Ji et al., 2021; Li et al., 2021) or a previously unmapped branch with a variable-strike angle (Gao et al., 2022), instead of the EYF (Liu et al., 2021). Based on Sentinel-1 C-band Synthetic Aperture Radar (SAR) datasets after the mainshock, Yang et al. suggested that the postseismic deformation was dominated by aseismic slip with nearly pure normal faulting (Yang et al., 2021a). Gao et al. thought the postseismic deformation was caused by slow slip on a parallel branch to the west of the seismogenic fault. (Gao et al., 2022). Therefore, we inverted jointly continuous GNSS observations and Sentinel-1 datasets to determine the seismogenic fault, the coseismic and postseismic slip distributions associated with the 2020 Nima event. Furthermore, we calculated the Coulomb failure stress (CFS) change due to the coseismic and postseismic slip. Finally, we attempted to investigate fault interaction triggered by the event, the relationship between afterslip and aftershocks, as well as the mechanics of postseismic deformation.
The study area is located in central Tibet with an average altitude of greater than 4,300 m, where only a few GNSS stations are available. The known coseismic or postseismic slip models of the Nima earthquake are inverted using only the Sentinel-1 C-band SAR interferometry images (Yang et al., 2021a; Ji et al., 2021; Li et al., 2021; Gao et al., 2022). Three continuous GNSS stations near the deformation center (Figure 1) is deployed in 2018, under a collaboration between Tianjin University (led by Jing Liu-Zeng) and Institute of Geology, China Earthquake Administration. One of the GNSS stations, named station ROMA (86.88°E, 33.15°N; Point 1 in Figure 2) is just near the epicenter and recorded continuously sub-centimeter 3-D displacements. Therefore, to illuminate finely the geometry complexity of the seismogenic fault and the cause of postseismic deformation associated with this event, we combine the three GNSS observations and 101 Sentinel-1 image pairs from 14 July 2020 to 28 April 2021 (detailed information listed in Supplementary Table S2) to constrain jointly the fault geometry and slip distribution as the processing workflow in Figure 3.
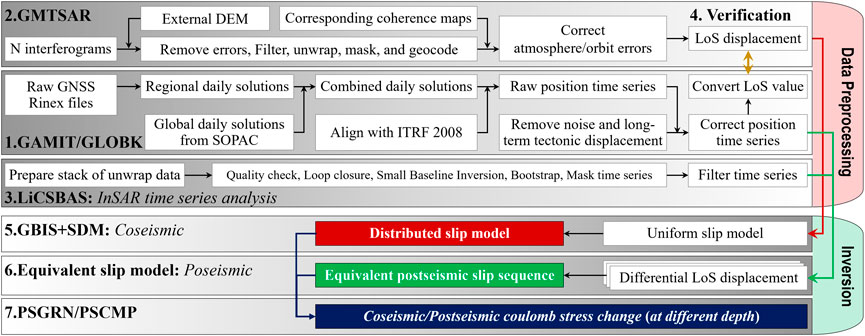
FIGURE 3. Inversion processing flowchart of coseismic and postseismic slip models with GNSS and InSAR datasets.
The raw RINEX files of three continuous GNSS stations are preprocessed using the GAMIT/GLOBK software (Herring et al., 2018) to separate irrelevant signals and obtain GNSS displacement time series. In Step 1 (Figure 3), we remove pole-shift, troposphere phase delay, Earth tide errors seasonal noise, and step signals caused by antenna replacement. The secular linear velocity in the ITRF2008 frame is estimated with an integrated pre-earthquake velocity field compiled with recently published velocities (McKenzie et al., 2000; England et al., 2013). We use the least square method to fit the original coordinate time series according to Eq. 1 to extract the post-seismic deformation from the total signal, without the long-term tectonic interseismic tectonic signal, seasonal noise, step signals, and derive a corrected time series is shown in Figure 4.
where
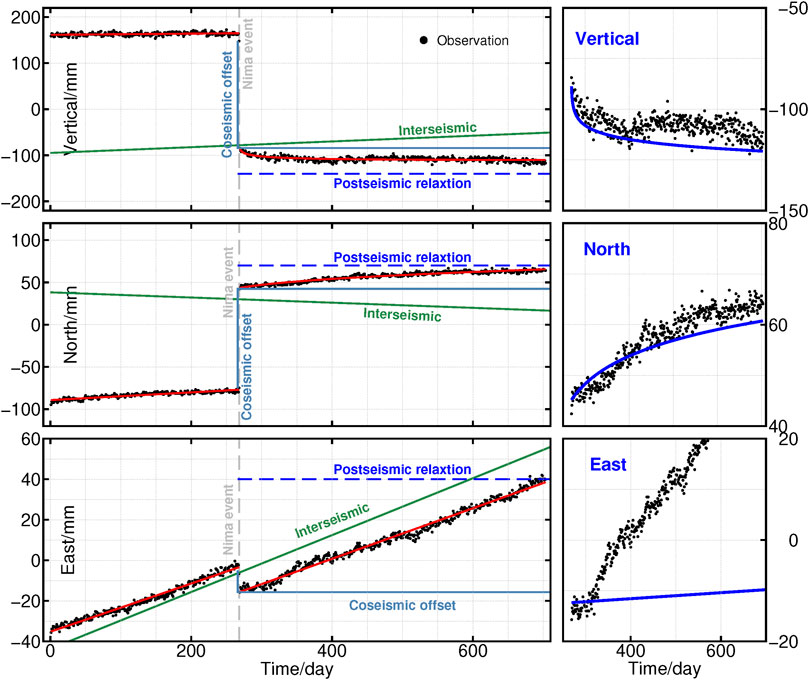
FIGURE 4. Position time series of postseismic transient motion in the second year at the near-field GNSS station ROMA (black dots) and the modeled curve (blue lines) for various combinations of Tibetan mantle transient and steady-state viscosities. The left panel shows the complete time series at this station, with the grey vertical lines, dark blue lines, and blue dashed lines representing the time of the mainshock, the coseismic offset, and the postseismic relaxation. The red and green lines in the left panel and blue lines in the right panel indicate the total signal, 1-dimensional linear fitting of the long-period interseismic tectonic estimate, and the modeled curve, respectively.
The coseismic SAR data are preprocessed with the open-source GMTSAR software (https://topex.ucsd.edu/gmtsar/). In Step 2 (Figure 3), Set a multi-look factor of 20:4 in the range and azimuth direction to improve the deformation field SNR and remove system noise. The orbit error and topographic phase are removed using precision orbit files and the 1 arc-second (∼30 m) resolution DEM from the Shuttle Rader Topography Mission (SRTM) (Farr and Kobrick, 2000). Interferograms were filtered and unwrapped respectively via the Goldstein filtering method (Goldstein and Werner, 1998) and the least-cost flow unwrapping method (Chen and Zebker, 2001). Tropospheric delay is removed via the GACOS model (Yu et al., 2018). Residual errors were removed by a linear fitting according to a one-dimensional covariance relation. Besides, some decorrelation regions in the interferograms associated with the Yibu Chaka lake and Jiangai Zangbu river water cover are masked (Figure 5).
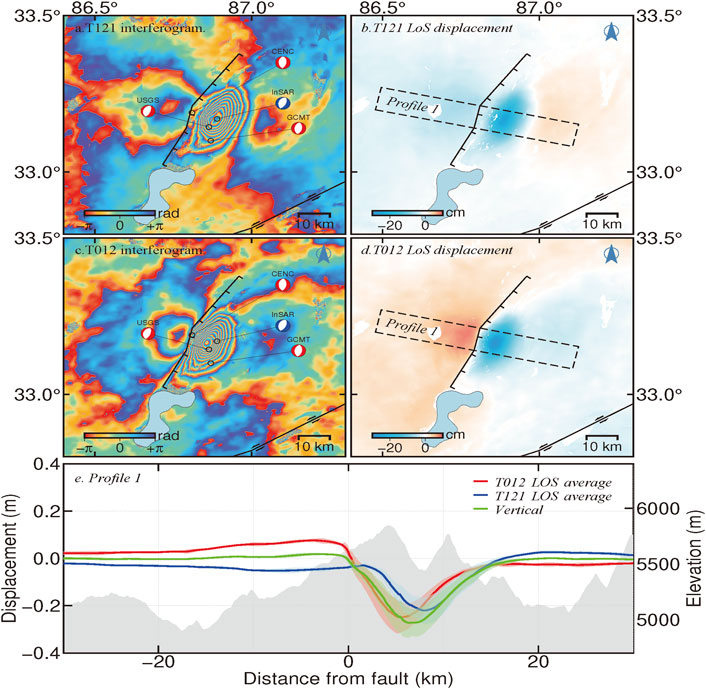
FIGURE 5. Coseismic LoS deformation of T012A and T121D for the 2020 Nima earthquake. The red, blue, and green solid lines and shadows in Panel e indicate coseismic LoS displacements of T012A and T121D and coseismic vertical displacements for the 2020 Nima earthquake of Profile 1 in Panel b.
In Step 3 (Figure 3), we downloaded 41 postseismic interferograms of T012A and 56 postseismic interferograms of T121D from 26 July 2020 to 28 April 2021 from the LiCSAR web portal (https://comet.nerc.ac.uk/COMET-LiCS-portal). We construct two groups of Spatial-temporal interference networks using the LiCSBAS method (Lazecký et al., 2020) to derive postseismic displacement time series (Figure 6, and Supplementary Figures S1–S7).
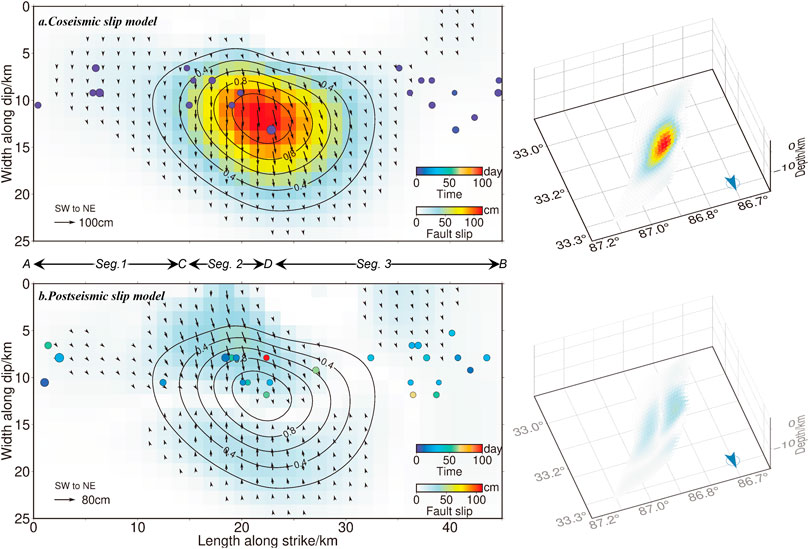
FIGURE 6. Two and three-dismension coseismic and postseismic slip models of the 2020 Nima earthquake. Color circle points indicate the initial 8-day and latter aftershocks, respectively. Characters (A,B) inidicate the faulting trace in Figures 2, 9, 10.
We used the GNSS displacement sequence of station ROMA near the epicenter as the reference position to verify the postseismic motions derived from InSAR data. We converted the east, north, and up-component motions of each GNSS station into the line of sight (LoS) direction by the affine transformation, respectively. And then a logarithmic empirical Eq. (2) is used to fit the GNSS and InSAR displacement sequences, respectively.
where A represents afterslip amplitude; t is the time series after the mainshock
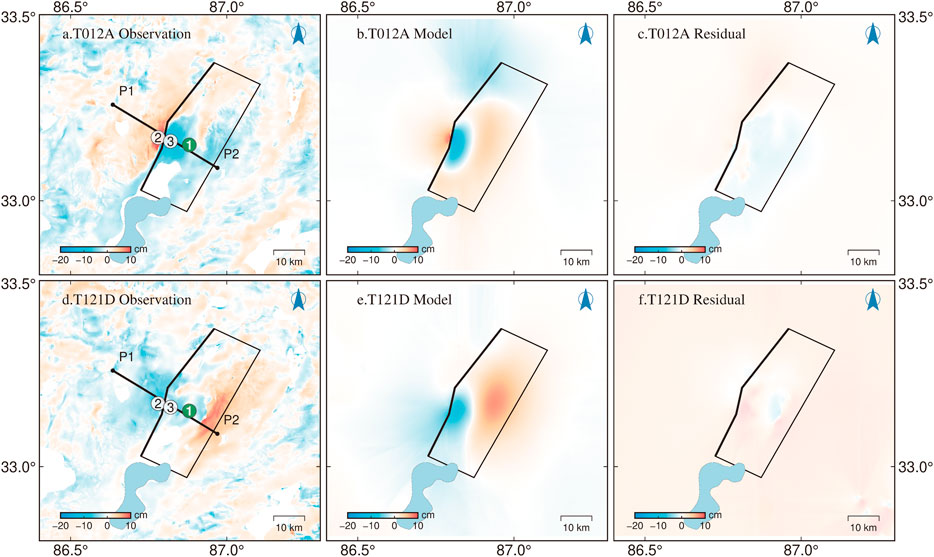
FIGURE 7. Postseismic deformation of the 2020 Nima earthquake inverted by the SDM method with residuals between the observations and simulated postseismc deformation by the model. Black box shows the surface projection of the rupture fault plane, which is derived from the optimal distributed slip model and thick black west side denotes the inferred seismogenic fault trace. The thick black line between P1 to P2 indicates the profile be addressed in Figure 8. The circles marked with 1, 2 and 3 indicate sample points in Supplementary Figure S8.
In Step 5 (Figure 3), we carry out a nonlinear inversion algorithm with the GBIS software package (Bagnardi and Hooper, 2018) based on the Okada model (Okada, 1985), to search for an optimal uniform slip model (Figure 5) and a subsample data of coseismic LoS displacement. The downsampled ascend and descend LoS displacement sequence, and the corrected GNSS east, north, and up-direction displacement sequence are inputted as three single data sets, and the distributed coseismic slip is modeled with the SDM software package (www.gfz-potsdam.de) (Wang et al., 2011) based on the layered earth structure in Figure. S13, with Poisson’s ratio of 0.25. With the same layered model, each fault plane was subdivided into an array of rectangular patches 1 km ×1 km, Green’s functions on each patch are computed by the PSGRN code (Wang et al., 2006). The weight ratio of GNSS and InSAR is set to 2, the smooth factor is 0.2. The initial fault parameters refer to the searched uniform slip model parameters (strike, dip, width, and length). For a fitting model with a high correlation coefficient and low residual error, it is necessary to adjust adequately the fault strike and dip (Table 1). Detailed inversion procedures are described in (Xia et al., 2022).
There is no obvious surface rupture observed, which makes it difficult to directly ascertain the seismogenic fault. Previous InSAR research suggested different results on the seismogenic fault for the 2020 Nima earthquake, such as the east-dip WYF with a constant strike (Yang et al., 2021a; Ji et al., 2021; Li et al., 2021) or an unmapped east-dip branch fault with variable strikes and dips (Gao et al., 2022), instead of the west-dip EYF determined by geology (Liu et al., 2021). To determine the geometry parameters of the seismogenic fault, we check multiple alternative slip models (Table 1). For Model 1, referring to the previously mapped EYF (Line 5 in Figure 2), we set the bounds of [−90°, 0°] for the dip angle [0°, 50°], for the strike angle in 5° intervals, but the derived rake is -180° with a very small fitting degree of 30.3%. This result shows that the focus mechanism is pure strike-slip and incompatible with the regional tectonic background and the seismological focus mechanism solutions (Table 1). For Model 2, referring to the mapped WYF, we set a constant strike angle of 36°, a variable dip of [0°, 90°]. The root-mean-square (RMS) misfit residuals between the model and observations decreases with increasing dip, but the improvement is imperceptible for dips of >50°, and a corresponding rake of ∼74° with a not too high correlation coefficient of 88%.
We found the RMS misfit is sensitive to changing the strike of the fault planes, which hints the seismogenic fault is not a straight single fault rather than a curve with variable strike and dip. We suppose the seismological trace along the trace ACDB in Figure 2 (Model 3 in Table 1), and set the bounds of [0°, 60°] for the dip angle, [0°, 50°] for the strike angle in 5° intervals, the misfit decays steeply, the correlation coefficient is greater than 99%. The RMS misfit residuals between the observations and simulated coseismic displacements are 0.6 cm and 0.7 cm in the LOS direction of T012A, T121D; and 1.7 cm and 1.4 cm in the East-West and North-South direction of GNSS observation, respectively (Supplementary Figure S9). As shown in Figure 6, the coseismic slip model is generally consistent with that suggested by (Gao et al., 2022), and shows more details than that derived by (Yang et al., 2021a; Ji et al., 2021; Li et al., 2021). Therefore, the model (segment 1: strike/dip/rake =28°/45°/−78°, segment 2: strike/dip/rake =13°/50°/−78°, segment 3: strike/dip/rake =36°/45°/−78°) is selected as our optimal coseismic slip model for the following analysis. The final model is a three-segmented fault with variable dips and strikes, and an average slip of −78°. Based on equations (8.83–8.91) in Thorne and Wallace (Lay and Wallace, 1995), the percentage of CLVD component is calculated and is 3.65. The peak slip of 1.36 m occurred at a depth of 8.5 km. Assuming a shear modulus of 30 GPa, the seismic moment tensor is
It is difficult to separate the mainshock and the initial 8-day aftershocks in InSAR observations. We can only derive the coseismic deformation with the first 8-day postseismic deformation and the latter postseismic deformation. In Step 6 of Figure 3, as the same time windows and periods for InSAR and GPS observations, we firstly carry out the equivalent postseismic slip model (Li and Bürgmann, 2021) to derive differential LoS displacement sequence (Supplementary Figures S10, S11), and then combine the corrected GNSS displacement sequence to fit the postseismic slip models (Supplementary Figure S12) as the same procedure in Section 2.3. Error evaluation of the derived postseismic displacement and more data processing detailed can be found in another paper (Morishita et al., 2020). The pattern of observations and simulated postseismic displacements by the model is consistent with that of the coseismic, a significant displacement region occurred in the subsidence zone of the coseismic rupture and extend farther to the east of the coseismic rupture fault (Figure 7), the RMS misfit residuals are 1.3 cm and 1.4 cm in the LOS direction of T012A, T121D; and 1.1 and 1.3 cm in the East-West and North-South direction of GNSS observation, respectively. As shown in Figures 7E,F, the residuals mainly occurred near regions with large afterslip and the bottom right corner. So that, we think our postseismic slip model (Figure 6) is reliable.
The equivalent postsesimic slip shows afterslip occurred mainly near Segment 2 and the junction of Segment 2 and 3 (Figure 6). The cumulative afterslip moment within 9 months after the mainshock is
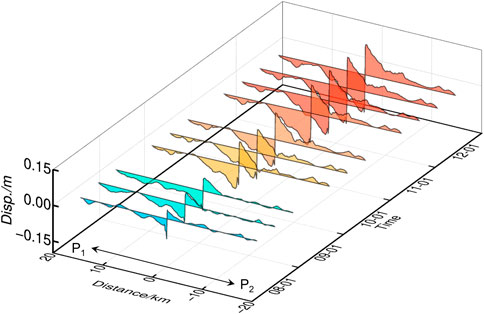
FIGURE 8. Cumulative postseismic displacement sequence of T012A along the profile P1-P2 in Figure 7. The color gradient from blue to red indicates amplitude of the displacement increment over time.
To characterize the process of postseismic stress transfer and the relationship between afterslip and aftershocks, based on a biviscous Burgers body (Supplementary Figure S13) with the friction coefficient of 0.4, Young’s modulus of 30 GPa, Poisson’s ratio of 0.25, we calculated the CFS change with depth (2–20 km) by the coseismic and postseismic faulting model (Figures 9, 10), as well as the profile of the coseismic CFS on the faulting surface with depth (Figure 11).
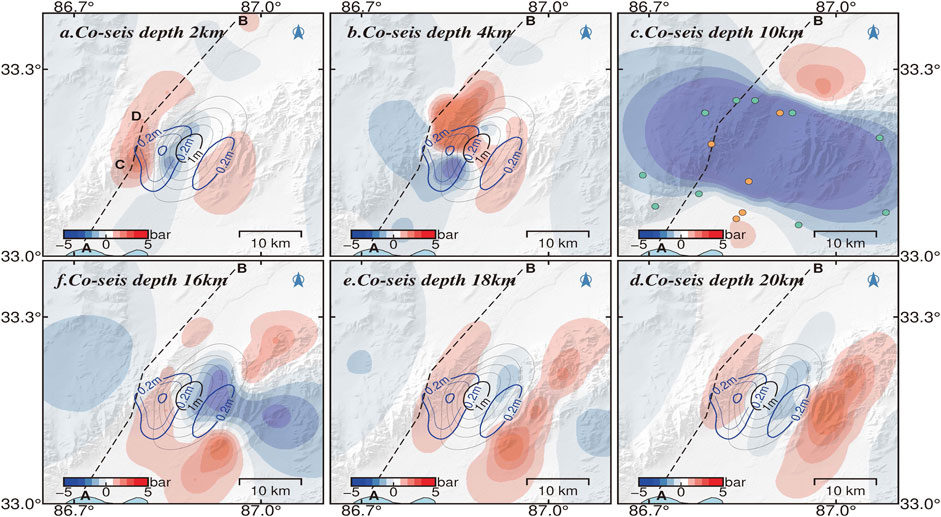
FIGURE 9. Coseismic Coulomb stress changes at different depths for the 2020 Nima earthquake. The dotted line AB indicates the seismogenic fault. The black (0.2 m interval) and blue (0.1 m interval) lines indicate the coseismic and postseismic slip isoline projected on the surface, respectively. The green and yellow circles represent the latter aftershocks of 4 ≥ M ≥ 3 and ≥4, respectively.
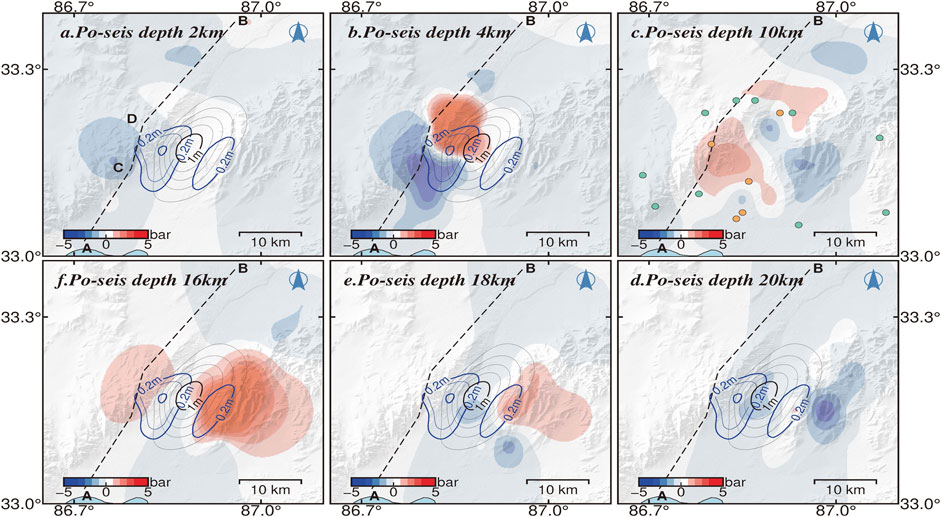
FIGURE 10. Postseismic Coulomb stress changes at different depths for the 2020 Nima earthquake. Captions are as for Figure 9.
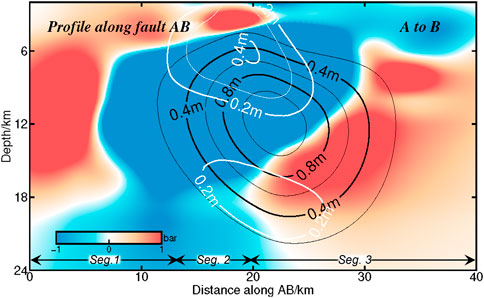
FIGURE 11. Coseismic Coulomb stress change at different depths along the faulting trace. The black and white lines indicate the coseismic and postseismic slip isoline projected on the surface, respectively. Caption is as for Figures 2, 6.
As shown in Figure 12, our finial coseismic slip model suggests a complex reversed “S-shape” fault structure consisting of three segments within different dips of 45°–50°. The dip value is close to the other results (Table 1), and also consistent with the field observed fault dip of 45°–50°(Liu et al., 2021). No low-angle fault plane is found for this earthquake.
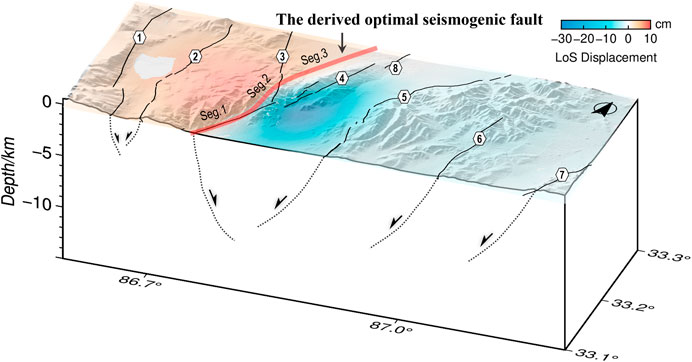
FIGURE 12. 3D structure of the active normal faults in the Yibu-Chaka graben and the derived optimal seismogenic fault of the 2020 Nima earthquake. Black lines in the section indicate normal faulting. Caption is as for Figures 2, 6.
The overall trend of the seismogenic fault is about 28° and is well consistent with the orientation of regional existing geologic structures and the region shearing stress direction (Taylor et al., 2003). Large angle rotation of the rupture direction is unusual during earthquake propagation (Preuss et al., 2019). The seismogenic fault trace of the 2020 Nima earthquake shows two distinct rotations along the strike. As shown in Figure 12, Segment AC (strike/dip = 28°/45°) stretches about 15 km almost along the preexisting N36°E-striking WYF associated with sharp fault morphology (Molnar and Tapponnier, 1978). The significant slip concentrates on Segment CD (strike/dip = 13°/50°) at depths of 4–15 km. The rupture did not go on along the WYF, but rotated by about 15° to the north and along the bend of ∼8 km near the intersection of the WYF and the HF. From the epicenter (located near point D) to the north, along Segment DB (strike/dip = 37°/45°), the rupture caused again a rotation of ∼24°, and keep the N37°E direction and is parallel to the northern segment of the WYF.
The first rotation of the rupture strike was near the intersection of the WYF and the HF, with a lower fracture coefficient of the rock at the multi-faulting junction and thus stress localization, stress at the fault tip more easily exceeds a critical value and then promotes rupture propagation. The InSAR-derived source occurred near the north end (point D) of the bend, which may be in response to stress localization in such a relatively weak material condition (Dayem et al., 2009). The second rotation occurred on Segment DB, which is located in the hanging wall of the WYF and away from the central graben. This segment is not a previously mapped fault and is buried under the unconsolidated Holocene alluvium of the Nanliu and Jiangai-Zangbu rivers. The stress field around mature fault zones is often misaligned with existing faults (Preuss et al., 2019), and then promotes the reactivation of inactive and potentially blind or unknown branches, on account of long-term reorientation of stresses because of strain accumulation, construction complexity, and so on. Therefore, we suggest that it is likely to be a younger blind fault parallel to the remote stress field, which is reactivated during this event. In addition, the aftershock distribution pattern is not a familiar band along the seismogenic fault, rather than a fan with the center axis of the seismogenic fault (Figure 2). Such a fan pattern is consistent with the lateral extension of the negative flower structure of the Yibu-Chaka graben. Taken together, the relaxation process of the 2020 Nima earthquake may be dominated by the multi-segmented fault rupture, consisting of the inherited activity of the preexisting WYF and the dynamic-triggering activity of the blind fault.
More generally, the multi-segmented rupture of moderate earthquakes had been observed in other regions by geodetic data. The 2008 Nima-Geizhe double earthquakes (Mw 6.4 and Mw 5.9) occurred in the southern end of the Yibug-Caka-Rigen fault, and rupture two parallel NNE-trending normal faults (He and Gilles, 2010). The 2018 Mw 6.4 earthquake simultaneously ruptured the north segment of the east-dip sinistral Milun Fault and an unknown west-dipping fault, but the postseismic slip occurred only in the south segment of the Milun fault (Yang et al., 2018). The 2017 Sulphur Peak M5.3 earthquake simultaneously triggered shear and extensional fractures on a group of intersecting faults (Pollitz et al., 2019). The synthetic inversion result of remote seismic waves, InSAR, and aftershock precise location datasets uncover the 2020 Stanley Mw 6.5 earthquake was mainly strike-slip, with both normal dip-slip and thrust components with a non-DC component ratio of 35%, which reflect the simultaneous rupture of a group of opposite-dipping sinistral faults and normal faults (Yang et al., 2021b).
The non-DC component reflects the complexity of the focal mechanism (Zhu and Ben-Zion, 2013). Like the Stanley earthquake, the 2020 Nima earthquake ruptured a multi-segmented fault with variable strike and dip and produced also a non-DC component of 3.65%, which may be associated with the existence of splay subfaults (Kuge and Lay, 1994), although the value is less than the results from the long-period point-source solutions (Table 1), possibly because of different source data and estimation procedures. When shearing ruptures of intersected faulting planes are not parallel to each other with different geometry, observed seismic waves from these faults with different strikes are added together and indistinguishable, and then resolved as a single event. In this way, the sum of the moment tensors of the different faults will give a seeming composite mechanism with an obvious non-DC component (Julian et al., 1998), which hints at the predictable geometry complexity of the seismogenic fault. The 2020 Nima earthquake indicates that moderate earthquakes may also occur on the complex fault structure, particularly in geologically complex regions, although do not contribute to building topographic relief (Wang et al., 2014).
The spatiotemporal distribution of postseismic deformation provides important clues to the mechanism of afterslip. Yang et al. suggested that the postseismic deformation was dominated by aseismic slip (Yang et al., 2021a), which is inconsistent with the result of slow slip on a parallel branch to the west of the seismogenic fault suggested by Gao et al. (Gao et al., 2022). As shown in Figure 7, the postseismic slip zone was complementary to the coseismic slip zone in space (Wallace et al., 2018), and the significant postseismic slip concentrated on Segment 2. The latter M ≥ 3 aftershocks mostly occurred in the negative coseismic CFS zone (Figure 9). Although the stress along Segment AC had fully released, that along Segment CD is still loading weakly beneath the focus depth. The cumulative seismic moment was not fully released by the mainshock and aftershocks. The cumulative postseismic moment over 9 months is ∼15.6% of the seismic moment and is larger than 8% over 6 months estimated by Yang et al. (Yang et al., 2021a), but the moment contributed by aftershocks is only a few percent of the total postseismic moment. Therefore, afterslip may mostly contribute to the release of additional seismic energy.
In addition, two relatively obvious stress loading zones occurred on Segment DB at the 4 km depth and on the EYF at the 16 km depth, respectively (Figure 10), the corresponding CFS change exceed 1 bar (Figure 11). Meanwhile, the rake angle of the upper and lower portion of the postseismic slip are opposite and with a 42 cm down-dip peak slip at the depth of ∼4 km and a 31 cm peak up-slip at the depth of ∼18 km, respectively (Figure 7). All focal mechanism solutions of aftershocks of M > 4.5 reported by the GCMT (Supplementary Table S3) showed primarily normal faulting with a minor left-lateral strike-slip component, and all of the aftershocks occurred in the depth of 6–9 km (Figure 7). Moreover, around the north of the seismogenic fault, Li et al. found some tectonic extension cracks and surface breaks related to surface shaking (Li et al., 2021). Therefore, we prefer to suggest that creeping into the shallow zone could be facilitated by stress perturbations. Migration of the latter aftershocks (except the first 8 days), spreading generally out on the northwest and northeast sides of the seismogenic fault (Figure 2), shows the dynamic stress-releasing process after the mainshock. Taking together, such a slight deep up-slip afterslip, the lack of aftershocks in the afterslip zone, as well as the stress loading along the EYF, indicated a triggered activity on the west-dipping EYF or more normal faults on the east side of the graben. In this way, as a result of the shear stress changes and redistribution of upper crustal material from the hanging wall of the east normal faults, the weak uplift occurs as material flows in toward rupture tips along fault slip direction (Ryder et al., 2010).
In the case of Nima, the mainshock and all aftershocks occurred in the upper crust of <10 km (Figure 7), but the coseismic rupture and afterslip extended more than 20 km beneath the surface, rather than was limited to the shallow upper crust. It is obvious substantial down-dip slip occurred on the fault plane from the surface down to the depth, larger than the effective viscoelastic layer thickness of ∼10 km in central Tibet (England et al., 2013; Liu-Zeng et al., 2020) and the long-term equivalent elastic thickness of 10–12 km in the Tibetan plateau (Molnar and Chen, 1983; Molnar and Lyon-Caent, 1989; Chu et al., 2009). Meanwhile, the slight deep upslip afterslip occurred in the transition zone of brittle-ductile shear deformation. These deep stress loading/releasing regimes reveal where extension of the negative flower structure at depth, which is not shallow. The extensional structure may extend deeper at depth and broader at lateral direction and reflects the complex faulting at this region. It is implications for the rheology of down-dip extension of the dipping faults or shear zones in northern Tibet (England et al., 2013; Liu-Zeng et al., 2020) and provides clues to the rheological properties of the lower crust of the Tibetan plateau (Shi et al., 2012; England et al., 2013).
The epicenter of the 2020 Nima earthquake occurred at the center of the Yibu-Chaka graben, but the northern segment of the seismogenic structure didn’t spread along the high-relief western edge of the graben. Such an apparent spatial mismatch between moderate magnitude earthquakes and long-term geomorphic expression of major active faults is surprisingly common in southern Tibet. For instance, in the 2008 Mw 6.3 Damxung earthquake, the 2005 Mw 6.2 Zhongba earthquake, and the 1992 Mw 6.1 Nyemo earthquake (Elliott et al., 2010), the Mw 5.5+ Xaitongmoin earthquake sequence in the 1990s (Wang et al., 2014), don’t always occur on previously mapped faults associated with clear surface geomorphology.
The 2020 Nima earthquake implies that the potentially seismic disasters in widespread extensional zones in Tibet can occur away from the previous mapped active faults in the graben (Taylor et al., 2003), and may be more broadly distributed than implied by the clear surface topography (Wang et al., 2014). The interaction of two opposite-dipping faults is promoted by stress transfer, which can enhance seismic hazards within years after an earthquake (Jia et al., 2021). Two obvious stress loading zones of more than 1 bar, around the EYF and the east-dip blind fault, have increased the future earthquake risk. Especially, the junction between normal faults and ends of the large-scale sinistral Riganpei-Co and Jiangai-Zangbu faults has the potential for an M > 7 seismic rupture (Li et al., 2021).
We invert the coseismic and postseismic displacement of the 2020 Nima earthquake using jointly InSAR and GNSS datasets over the first 9 months. Our results suggest the Nima earthquake ruptured a complex reversed “S-shape” structure with variable strike and dip at multi-fault junctions. Multiple faults were ruptured during the event, including at least the east-dip West Yibu-Chaka fault, the northeast-dip Heishi fault, and a previously unmapped younger east-dip blind fault, and then promoted to reactivation of the west-dip normal fault system on the east side of the Yibu-Chaka graben. The geometry complexity of the seismogenic fault may lead to the large non-DC component in the long-period point-source solutions. The Coulomb failure stress change calculated by the coseismic and postseismic slip model shows that significant stress at the shallow depth of <10 km was released mainly by the mainshock and aftershocks. The shallow creep at the depth of ∼4 km around the junction between the northern segment of the West Yibu-Chaka fault and the blind fault could be facilitated by stress perturbations. The deep uplift of >16 km depth extended within the brittle-ductile transition zone down-dip of the coseismic rupture zone. It indicates the rheology of the down-dip extension of the dipping faults in northern Tibet. The Coulomb failure stress change of >1 bar around the East Yibu-Chaka fault and the blind fault highlights seismic hazards in the region, especially in the junction between normal faults and ends of the large-scale sinistral Riganpei-Co and Jiangai-Zangbu faults. It is necessary to forecast accurately by longer-term afterslip observation over timescales of years for the faults.
The original contributions presented in the study are included in the article/Supplementary Material, further inquiries can be directed to the corresponding author.
XL and JL-Z conceived and designed the experiments; XL, TX, and DD performed the ex-periments; TX and PY analyzed the InSAR data; ZJ, PW, and WW analyzed the GNSS data; XL wrote the paper, and all co-authors contributed to the writing. All authors have read and agreed to the published version of the manuscript.
This work is supported by Science for Earthquake Resilience, China Earthquake Administration (XH22003C), the National Natural Science Foundation of China (U1839203 and 42011540385).
Our thanks go to Teng Wang, Minhan Sheng, Guixi Yi, Changsheng Jiang, Li Li, Shengle Li, Hongwei Tu, Guichun Wei, and Wei Wang for their help and discussions. All Sentinel-1A SAR data are copyrighted by the European Space Agency. Atmospheric corrected data were downloaded from the Generic Atmospheric Correction Online Service for InSAR. Most figures were made using the public domain Generic Mapping Tools (Wessel and Smith, 1998).
The authors declare that the research was conducted in the absence of any commercial or financial relationships that could be construed as a potential conflict of interest.
All claims expressed in this article are solely those of the authors and do not necessarily represent those of their affiliated organizations, or those of the publisher, the editors and the reviewers. Any product that may be evaluated in this article, or claim that may be made by its manufacturer, is not guaranteed or endorsed by the publisher.
The Supplementary Material for this article can be found online at: https://www.frontiersin.org/articles/10.3389/feart.2022.1012773/full#supplementary-material.
Armijo, R., Tapponnier, P., and Han, T. (1989). Late Cenozoic right-lateral strike-slip faulting in southern Tibet. J. Geophys. Res. 94 (B3), 2787–2838. doi:10.1029/JB094iB03p02787
Bagnardi, M., and Hooper, A. (2018). Inversion of surface deformation data for rapid estimates of source parameters and uncertainties: A bayesian approach. Geochem. Geophys. Geosyst. 19 (7), 2194–2211. doi:10.1029/2018gc007585
Blisniuk, P. M., and Sharp, W. D. (2003). Rates of late Quaternary normal faulting in central Tibet from U-series dating of pedogenic carbonate in displaced fluvial gravel deposits. Earth Planet. Sci. Lett. 215 (1-2), 169–186. doi:10.1016/s0012-821x(03)00374-1
Bürgmann, R., and Dresen, G. (2008). Rheology of the lower crust and upper mantle: Evidence from rock mechanics, geodesy, and field observations. Annu. Rev. Earth Planet. Sci. 36 (1), 531–567. doi:10.1146/annurev.earth.36.031207.124326
Chen, C. W., and Zebker, H. A. (2001). Two-dimensional phase unwrapping with use of statistical models for cost functions in nonlinear optimization. J. Opt. Soc. Am. A 18 (2), 338–351. doi:10.1364/josaa.18.000338
Chevalier, M.-L., Tapponnier, P., van der Woerd, J., Leloup, P. H., Wang, S., Pan, J., et al. (2020). Late quaternary extension rates across the northern half of the yadong-gulu rift: Implication for East-West extension in southern Tibet. J. Geophys. Res. Solid Earth 125 (7), e2019JB019106. doi:10.1029/2019JB019106
Chu, R., Zhu, L., and Helmberger, D. V. (2009). Determination of earthquake focal depths and source time functions in central Asia using teleseismic P waveforms. Geophys. Res. Lett. 36 (17), L17317. doi:10.1029/2009GL039494
Dayem, K. E., Houseman, G. A., and Molnar, P. (2009). Localization of shear along a lithospheric strength discontinuity: Application of a continuous deformation model to the boundary between Tibet and the Tarim Basin. Tectonics 28 (3), 2264. doi:10.1029/2008TC002264
Elliott, J. R., Walters, R. J., England, P. C., Jackson, J. A., Li, Z., and Parsons, B. (2010). Extension on the Tibetan plateau: Recent normal faulting measured by InSAR and body wave seismology. Geophys. J. Int. 183 (2), 503–535. doi:10.1111/j.1365-246X.2010.04754.x
England, P. C., Walker, R. T., Fu, B., and Floyd, M. A. (2013). A bound on the viscosity of the Tibetan crust from the horizontality of palaeolake shorelines. Earth Planet. Sci. Lett. 375, 44–56. doi:10.1016/j.epsl.2013.05.001
Farr, T. G., and Kobrick, M. (2000). Shuttle radar topography mission produces a wealth of data. Eos Trans. AGU. 81 (48), 583–585. doi:10.1029/EO081i048p00583
Frohlich, C. (1994). Earthquakes with non-double-couple mechanisms. Science 264 (5160), 804–809. doi:10.1126/science.264.5160.804
Gao, H., Liao, M., Liang, X., Feng, G., and Wang, G. (2022). Coseismic and postseismic fault kinematics of the july 22, 2020, Nima (Tibet) Ms6.6 earthquake: Implications of the forming mechanism of the active N-S-trending grabens in qiangtang, Tibet. Tectonics 41 (3), e2021TC006949. doi:10.1029/2021TC006949
Goldstein, R. M., and Werner, C. L. (1998). Radar interferogram filtering for geophysical applications. Geophys. Res. Lett. 25 (21), 4035–4038. doi:10.1029/1998gl900033
Ha, G., Wu, Z., and Liu, F. (2019). Late quaternary vertical slip rates along the southern yadong–gulu rift, southern Tibetan plateau. Tectonophysics 755, 75–90. doi:10.1016/j.tecto.2019.02.014
Han, S., Li, H., Pan, J., Lu, H., Zheng, Y., Liu, D., et al. (2018). Co-Seismic surface ruptures in qiangtang terrane: Insight into late cenozoic deformation of central Tibet. Tectonophysics 750, 359–378. doi:10.1016/j.tecto.2018.11.001
Harrison, T. M., Copeland, P., Kidd, W. S. F., and Lovera, O. M. (1995). Activation of the nyainqentanghla shear zone: Implications for uplift of the southern Tibetan plateau. Tectonics 14, 658–676. doi:10.1029/95tc00608
He, J., and Gilles, P. (2010). Poroelastic triggering in the 9-22 january 2008 nima-gaize (Tibet) earthquake sequence. Geology 38 (10), p907–p910. doi:10.1130/g31104.1
Herring, T., King, R. W., Floyd, M., and McClusky, S. (2018). Introduction to GAMIT/GLOBK release 10.7. Cambridge: Massachusetts Institute of Technology.
Ji, Z., Zhang, Y., and Wang, S. (2021). Coseismic deformation field and fault slip distribution inversion of the Ms 6.6 Nima, Xizang earthquake by Sentinel-1A InSAR data. Prog. Geophys. 1, 1–10. doi:10.6038/pg2021EE0489
Jia, K., Zhou, S., Zhuang, J., and Jiang, C. (2021). Stress transfer along the western boundary of the bayan har block on the Tibet Plateau from the 2008 to 2020 yutian earthquake sequence in China. Geophys. Res. Lett. 48, e94125. doi:10.1029/2021gl094125
Julian, B. R., Miller, A. D., and Foulger, G. R. (1998). Non-double-couple earthquakes 1. Theory. Rev. Geophys. 36 (4), 525–549. doi:10.1029/98RG00716
Kagan, Y. Y., and Houston, H. (2005). Relation between mainshock rupture process and Omori’s law for aftershock moment release rate. Geophys. J. Int. 163 (3), 1039–1048. doi:10.1111/j.1365-246X.2005.02772.x
Kapp, P., Taylor, M., Stockli, D., and Ding, L. (2008). Development of active low-angle normal fault systems during orogenic collapse: Insight from Tibet. Geol. 36 (1), 7–10. doi:10.1130/g24054a.1
Kuge, K., and Lay, T. (1994). Systematic non-double-couple components of earthquake mechanisms: The role of fault zone irregularity. J. Geophys. Res. 99, 15457–15467. doi:10.1029/94jb00140
Lazecký, M., Spaans, K., González, P. J., Maghsoudi, Y., Morishita, Y., Albino, F., et al. (2020). LiCSAR: An automatic InSAR tool for measuring and monitoring tectonic and volcanic activity. Remote Sens. 12 (15), 2430. doi:10.3390/rs12152430
Li, K., Kirby, E., Xu, X., Chen, G., Ren, J., and Wang, D. (2019). Rates of Holocene normal faulting along the Dong Co fault in central Tibet, based on 14C dating of displaced fluvial terraces. J. Asian Earth Sci. 183, 103962. doi:10.1016/j.jseaes.2019.103962
Li, K., Li, Y., Tapponnier, P., Xu, X., Li, D., and He, Z. (2021). Joint InSAR and field constraints on faulting during the Mw 6.4, july 23, 2020, nima/rongma earthquake in central Tibet. JGR. Solid Earth 126 (9), e2021JB022212. doi:10.1029/2021JB022212
Li, Y., and Bürgmann, R. (2021). Partial coupling and earthquake potential along the xianshuihe fault, China. JGR. Solid Earth 126 (7), e2020JB021406. doi:10.1029/2020JB021406
Liu, F.-c., Pan, J.-w., Li, H.-b., Sun, Z.-m., Liu, D.-l., Lu, H.-j., et al. (2021). Characteristics of quaternary activities along the Riganpei Co fault and seismogenic structure of the july 23, 2020 Mw6.4 Nima earthquake, central Tibet. Acta Geosci. Sin. 42 (1), 139–154. doi:10.3975/cagsb.2021.010402
Liu-Zeng, J., Zhang, Z., Rollins, C., Gualandi, A., Avouac, J.-P., Shi, H., et al. (2020). Postseismic deformation following the 2015 Mw7.8 gorkha (Nepal) earthquake: New GPS data, kinematic and dynamic models, and the roles of afterslip and viscoelastic relaxation. J. Geophys. Res. Solid Earth 125 (9), e2020JB019852. doi:10.1029/2020JB019852
McKenzie, D., Nimmo, F., Jackson, J. A., Gans, P. B., and Miller, E. L. (2000). Characteristics and consequences of flow in the lower crust. J. Geophys. Res. 105 (B5), 11029–11046. doi:10.1029/1999JB900446
Molnar, P., and Chen, W.-P. (1983). Focal depths and fault plane solutions of earthquakes under the Tibetan Plateau. J. Geophys. Res. 88 (B2), 1180–1196. doi:10.1029/JB088iB02p01180
Molnar, P., and Lyon-Caent, H. (1989). Fault plane solutions of earthquakes and active tectonics of the Tibetan Plateau and its margins. Geophys. J. Int. 99 (1), 123–154. doi:10.1111/j.1365-246X.1989.tb02020.x
Molnar, P., and Tapponnier, P. (1978). Active tectonics of Tibet. J. Geophys. Res. 83 (B11), 5361–5375. doi:10.1029/JB083iB11p05361
Morishita, Y., Lazecky, M., Wright, T. J., Weiss, J. R., Elliott, J. R., and Hooper, A. (2020). LiCSBAS: An open-source InSAR time series analysis package integrated with the LiCSAR automated sentinel-1 InSAR processor. Remote Sens. 12 (3), 424. doi:10.3390/rs12030424
Okada, Y. (1985). Surface deformation due to shear and tensile faults in a half-space. Bull. Seismol. Soc. Am. 75, 1135–1154. doi:10.1785/bssa0750041135
Pollitz, F. F., Wicks, C., Yeck, W. L., and Evans, J. (2019). fault slip associated with the 2 september 2017 M 5.3 Sulphur peak, Idaho, earthquake and aftershock sequence. Bull. Seismol. Soc. Am. 109 (3), 875–887. doi:10.1785/0120180206
Preuss, S., Herrendörfer, R., Gerya, T., Ampuero, J.-P., and van Dinther, Y. (2019). Seismic and aseismic fault growth lead to different fault orientations. J. Geophys. Res. Solid Earth 124 (8), 8867–8889. doi:10.1029/2019JB017324
Ryder, I., Bürgmann, R., and Sun, J. (2010). Tandem afterslip on connected fault planes following the 2008 Nima-Gaize (Tibet) earthquake. J. Geophys. Res. 115 (B3), B03404. doi:10.1029/2009JB006423
Shi, X., Kirby, E., Furlong, K. P., Wang, E., Meng, K., Phillips, F. M., et al. (2012). Preliminary constraints on rheology of the deep crust beneath central Tibet from late pleistocene—early Holocene shorelines. Geophys. Res. Abstr. EGU2012-10796 (14), 1.
Tapponnier, P., Zhiqin, X., Roger, F., Meyer, B., Arnaud, N., Wittlinger, G., et al. (2001). Oblique stepwise rise and growth of the Tibet Plateau. Science 294 (5547), 1671–1677. doi:10.1126/science.105978
Taylor, M., and An, Y. (2009). Active structures of the Himalayan-Tibetan orogen and their relationships to earthquake distribution, contemporary strain field, and Cenozoic volcanism. Geosphere 5 (3), 199–214. doi:10.1130/ges00217.s1
Taylor, M., Yin, A., Ryerson, F. J., Kapp, P., and Ding, L. (2003). Conjugate strike-slip faulting along the Bangong-Nujiang suture zone accommodates coeval east-west extension and north-south shortening in the interior of the Tibetan Plateau. Tectonics 22 (4), 1361. doi:10.1029/2002TC001361
Wallace, L. M., Hreinsdóttir, S., Ellis, S., Hamling, I., D'Anastasio, E., and Denys, P. (2018). Triggered slow slip and afterslip on the southern hikurangi subduction zone following the kaikōura earthquake. Geophys. Res. Lett. 45 (10), 4710–4718. doi:10.1002/2018gl077385
Wang, H., Elliott, J. R., Craig, T. J., Wright, T. J., Liu-Zeng, J., and Hooper, A. (2014). Normal faulting sequence in the Pumqu-Xainza Rift constrained by InSAR and teleseismic body-wave seismology. Geochem. Geophys. Geosyst. 15 (7), 2947–2963. doi:10.1002/2014GC005369
Wang, M., and Shen, Z.-K. (2020). Present-day crustal deformation of continental China derived from GPS and its tectonic implications. J. Geophys. Res. Solid Earth 125 (2), e2019JB018774. doi:10.1029/2019JB018774
Wang, R., Lorenzo-Martín, F., and Roth, F. (2006). PSGRN/PSCMP—A new code for calculating co- and post-seismic deformation, geoid and gravity changes based on the viscoelastic-gravitational dislocation theory. Comput. Geosciences 32 (4), 527–541. doi:10.1016/j.cageo.2005.08.006
Wang, R., Schurr, B., Milkereit, C., Shao, Z., and Jin, M. (2011). An improved automatic scheme for empirical baseline correction of digital strong-motion records. Bull. Seismol. Soc. Am. 101 (5), 2029–2044. doi:10.1785/0120110039
Wang, S., Chevalier, M.-L., Pan, J., Bai, M., Li, K., Li, H., et al. (2020). Quantification of the late Quaternary throw rates along the Yadong rift, southern Tibet. Tectonophysics 790, 228545. doi:10.1016/j.tecto.2020.228545
Wessel, P., and Smith, W. (1998). New, improved version of generic mapping tools released. Eos Trans. AGU. 79 (47), 579. doi:10.1029/98eo00426
Wu, Z., Long, C., Fan, T., Zhou, C., Feng, H., Yang, Z., et al. (2015). The arc rotational-shear active tectonic system on the southeastern margin of Tibetan Plateau and its dynamic characteristics and mechanism. Geol. Bull. China 34 (01), 1–31.
Xia, T., Liu, X., Yu, P., Deng, D., Yue, Z., and Gao, T. (2022). Coseismic rupture model of the 2021 shuanghu M5.7 earthquake based on sentinel-1A. J. Geodesy Geodyn. 42 (5), 533–540. doi:10.14075/j.jgg.2022.05.017
Yang, J., Xu, C., Wen, Y., and Xu, G. (2021a). The july 2020 Mw 6.3 Nima earthquake, central Tibet: A shallow normal-faulting event rupturing in a stepover zone. Seismol. Res. Lett. 93 (1), 45–55. doi:10.1785/0220210057
Yang, J., Zhu, H., Lay, T., Niu, Y., Ye, L., Lu, Z., et al. (2021b). Multi-fault opposing-dip strike-slip and normal-fault rupture during the 2020 Mw 6.5 Stanley, Idaho earthquake. Geophys. Res. Lett. 48 (10), e2021GL092510. doi:10.1029/2021GL092510
Yang, Y.-H., Hu, J.-C., Tung, H., Tsai, M.-C., Chen, Q., Xu, Q., et al. (2018). Co-seismic and postseismic fault models of the 2018 Mw 6.4 hualien earthquake occurred in the junction of collision and subduction boundaries offshore eastern taiwan. Remote Sens. 10 (9), 1372. doi:10.3390/rs10091372
Yin, A., Kap, P. A., and Paul, A. (1999). Significant late Neogene east-west extension in northern Tibet. Geology 27, 787–790. doi:10.1130/0091-7613(1999)027<0787:SLNEWE>2.3.CO;2
Yin, A., and Taylor, M. H. (2011). Mechanics of V-shaped conjugate strike-slip faults and the corresponding continuum mode of continental deformation. Geol. Soc. Am. Bull. 123 (9-10), 1798–1821. doi:10.1130/b30159.1
Yu, C., Li, Z., Penna, N. T., and Crippa, P. (2018). Generic atmospheric correction model for interferometric synthetic aperture radar observations. J. Geophys. Res. Solid Earth 123 (10), 9202–9222. doi:10.1029/2017jb015305
Keywords: normal faulting earthquake, 2020 Nima earthquake, InSAR, GNSS, coseismic deformation, postseismic deformation, Tibetan plateau
Citation: Liu X, Xia T, Liu-Zeng J, Deng D, Jia Z, Wang P, Yu P and Wang W (2023) Coseismic and early postseismic deformation of the 2020 Nima Mw 6.4 earthquake, central Tibet, from InSAR and GNSS observations. Front. Earth Sci. 10:1012773. doi: 10.3389/feart.2022.1012773
Received: 05 August 2022; Accepted: 07 November 2022;
Published: 17 January 2023.
Edited by:
Zhenjie Wang, China University of Petroleum (Huadong), ChinaReviewed by:
Wanpeng Feng, School of Earth Sciences and Engineering, Sun Yat-sen University, ChinaCopyright © 2023 Liu, Xia, Liu-Zeng, Deng, Jia, Wang, Yu and Wang. This is an open-access article distributed under the terms of the Creative Commons Attribution License (CC BY). The use, distribution or reproduction in other forums is permitted, provided the original author(s) and the copyright owner(s) are credited and that the original publication in this journal is cited, in accordance with accepted academic practice. No use, distribution or reproduction is permitted which does not comply with these terms.
*Correspondence: Xiaoli Liu, bGl1eGwuakAxNjMuY29t; Jing Liu-Zeng, bGl1X3plbmdAdGp1LmVkdS5jbg==
Disclaimer: All claims expressed in this article are solely those of the authors and do not necessarily represent those of their affiliated organizations, or those of the publisher, the editors and the reviewers. Any product that may be evaluated in this article or claim that may be made by its manufacturer is not guaranteed or endorsed by the publisher.
Research integrity at Frontiers
Learn more about the work of our research integrity team to safeguard the quality of each article we publish.