 Wei Yan
 Zirui Li
- 1Institute of Geology, China Earthquake Administration, Beijing, China
- 2China Earthquake Networks Center, Beijing, China
- 3Ningxia Seismological Brueau, Yinchuan, China
Borehole strain observations are widely used to research slow earthquakes, volcanic activity and seismic precursors. Due to the high resolution and sensitivity, borehole strain monitoring records not only tectonic signals, but also signals from environmental disturbances. Based on the analytical solution of the displacement caused by the punctate load model, this paper derives the equation of the peripheral strain field, which provides a theoretical basis for the quantitative calculation of the load effect of borehole strain observation, and proposes a method for calculating the strain effect of two-dimensional and three-dimensional irregularly shaped loads. The results show that, 1) For the two-dimensional irregular shape load model, we can calculate it by vector superposition after load scattering. 2) For the three-dimensional irregular shape load model, we can calculate by assigning different weights to the scattering points after load scattering using two-dimensional irregular shape load method. The convergence process during the vector superposition shows the correctness and feasibility of the method, and the study can provide a research basis for the quantitative analysis of the influence of peripheral load disturbance in borehole strain observation.
1 Introduction
Borehole strain observation is one of the most important observations for obtaining information on crustal stress changes prior to earthquakes. A borehole strain observation network has been established in the Plate Boundary Observation (PBO) project in the United States (David et al., 2002). The main advantage of drilling strain observation is its high accuracy and the fact that the data can be self-checked (Chi, 1993; Li et al., 2004; Ouyang et al., 2009). Since 1990, more than 100 strain observation points have been built in Chinese earthquake precursor observation system, providing a large amount of data support for crustal deformation monitoring. Many researchers have explored the deformation characteristics before earthquakes (Zhang et al., 2009; Qiu et al., 2010; Niu et al., 2012; Qiu, 2014). In addition, the borehole strain observations provide important data support for volcano monitoring, volcanic process detection and eruption modeling (Bonaccorso et al., 2016; Linde et al., 2016; Currenti et al., 2017; Laiolo et al., 2019). However, the observation data are greatly disturbed by the economic construction around the observatory, such as the construction of buildings, reservoir storage, and the accumulation of rocks.
Theoretical analysis of the influence of load on the observation of surrounding deformation is of great research significance in the observation of earthquake precursors monitoring (Yang et al., 2002; Huang, 2005; Zhang, 2013). Since the actual loads are mostly irregular in shape, many researchers use numerical analysis to discuss the displacements and strains in the near field around the loads (Wang, 2000; Wang et al., 2002; Du et al., 2004). Some other researchers have obtained an approximate analytical solution to this problem by reducing the model to a punctate load model (Hu et al., 2002; Qiu, 2004; Li et al., 2007; Luo et al., 2008). Since the simplified model can only provide approximate solutions in the near field, this paper focuses on the exact solution of the strain field due to irregularly shaped loads. This paper gives the calculation of the strain field around the point load based on the analytical solution of the displacement caused by the point load model, and provides the calculation of the strain field caused by irregularly shaped loads in two and three dimensions. The strain sign obeys the elasticity rule, i.e., the tension is positive and the pressure is negative.
2 Analytical solution of strain and its distribution characteristics for punctate load model
When a vertical force P is applied to the surface of a uniform, isotropic semi-infinite elastomer (Figure 1), the vertical normal stress and horizontal displacement at any point M(x,y,z) can be calculated using the Boussinesq (Boussinesq, 1885) solution.
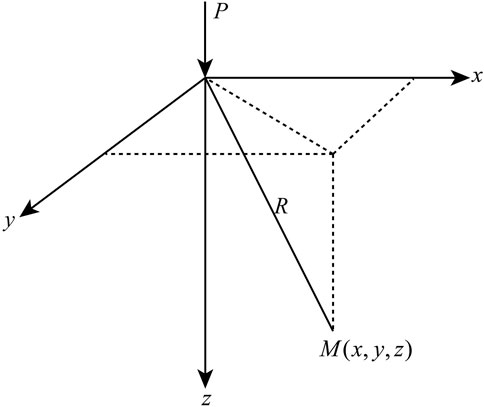
FIGURE 1. The sketch map of punctate load model’s coordination system.
The x-direction linear stress σx, y-direction linear stress σy, x-direction displacement u and y-direction horizontal displacement v of point M(x,y,z) can be expressed as follows.
Among them, R is the distance from point M to point P, E is Young's modulus and μ is Poisson's ratio, and the relationship between R and the coordination can be described as Eq. 5.
According to the relationship between displacement and linear strain, the linear strain in the x and y directions can be calculated from the first-order derivatives of the displacements u and v, respectively.
According to the relationship between area strain and two orthogonal linear strains, the area strain εs can be expressed as Eq. 8.
Eqs. 6–8 are analytical solutions for the strain field around the punctate load model, and we can use them to solve for the strain parameters at any point around the location of the force P.
Taking sandy soil (Capar and Ishibashi, 2010) as an example, Young's modulus E=4×10⁷Pa, Poisson's ratio μ=0.25 and load force P=2×10⁴N, the spatial distribution of strain field of horizontal slices at depth of 0.1m can be calculated. The results are shown in Figure 2.
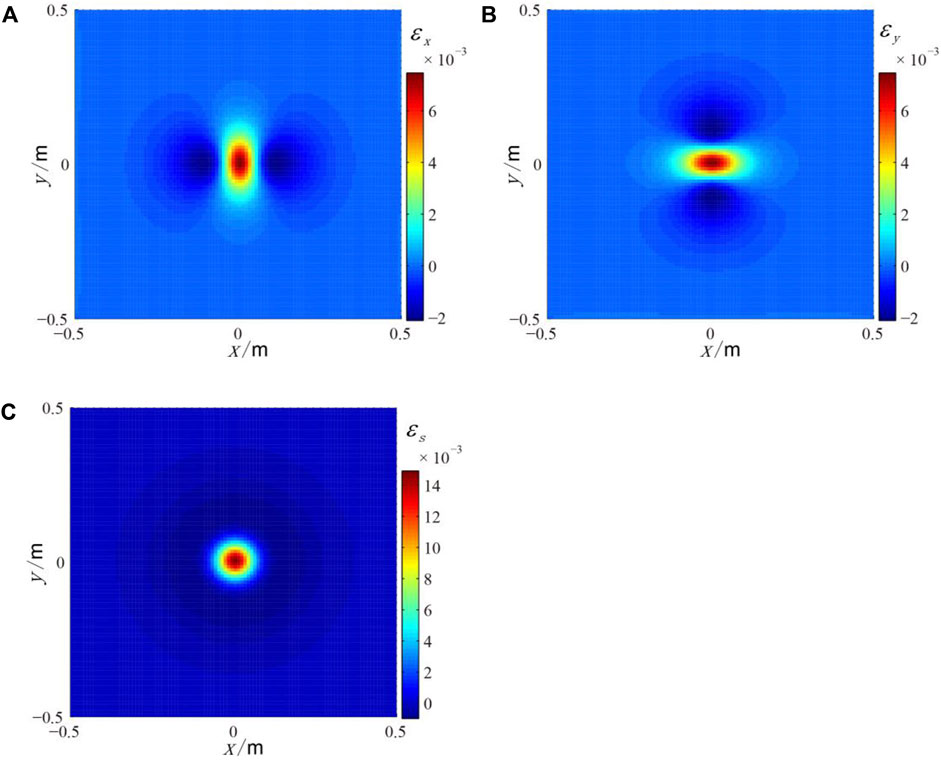
FIGURE 2. The strain field distribution around the punctate load model of horizontal slices at depth of 0.1 m (A) The linear strain εx; (B) The linear strain εy; (C) The area strain εs.
As can be seen in Figure 2, the linear strain distribution exhibits tensile strain (positive values) in a small area close to the load center, while it exhibits compressive strain (negative values) far from the load center (Figures 2A,B). The regional strain distribution shows the phenomenon of expansive strain close to the load center and compressive strain far from the load center (Figure 2C).
3 Analytical solution of strain and its distribution characteristics for irregular load model
Since point load is an ideal simplified model, and the actual load is often irregular in shape, it is necessary to discuss the calculation method of irregular shape load model when analyzing the actual model. In this paper, the irregular loads are classified as two-dimensional irregular and three-dimensional irregular shape loads.
3.1 Two-dimensional model
According to the superposition principle, for the two-dimensional irregularly shaped load model, the total force P can be dispersed as Pi assuming that the number of scattered meshes is n. The analytical solution of the scattered strain for the two-dimensional irregular load model can be calculated using Eqs. 6, 7, and the relationship between the variables is as follows.
The process of scattering the irregular load is shown in Figure 3. In the calculation of the actual load, the linear strains εxi, εyi at each scattering point of M can be calculated using Eqs. 6, 7, respectively, and then the vector superposition strains εx, εy can be calculated using Eqs. 10, 11.
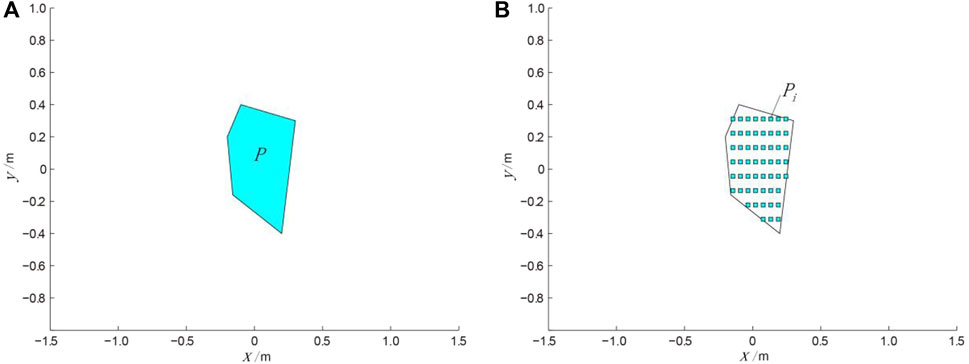
FIGURE 3. The scattering process diagram of two dimensional irregular load model. (A) Original irregular load shape; (B) the irregular Load shape after scattering.
Because of the scattered processing, it is necessary to verify the convergence characteristics of the calculated results with the change of number of grids n. Figure 4 shows the horizontal displacements and linear strains at point M (1.5m, -1.5m, -0.2m) versus the number of grids n for Young's modulus E=4×10⁷Pa, Poisson's ratio μ=0.25, and total load force P=2×10⁴N.
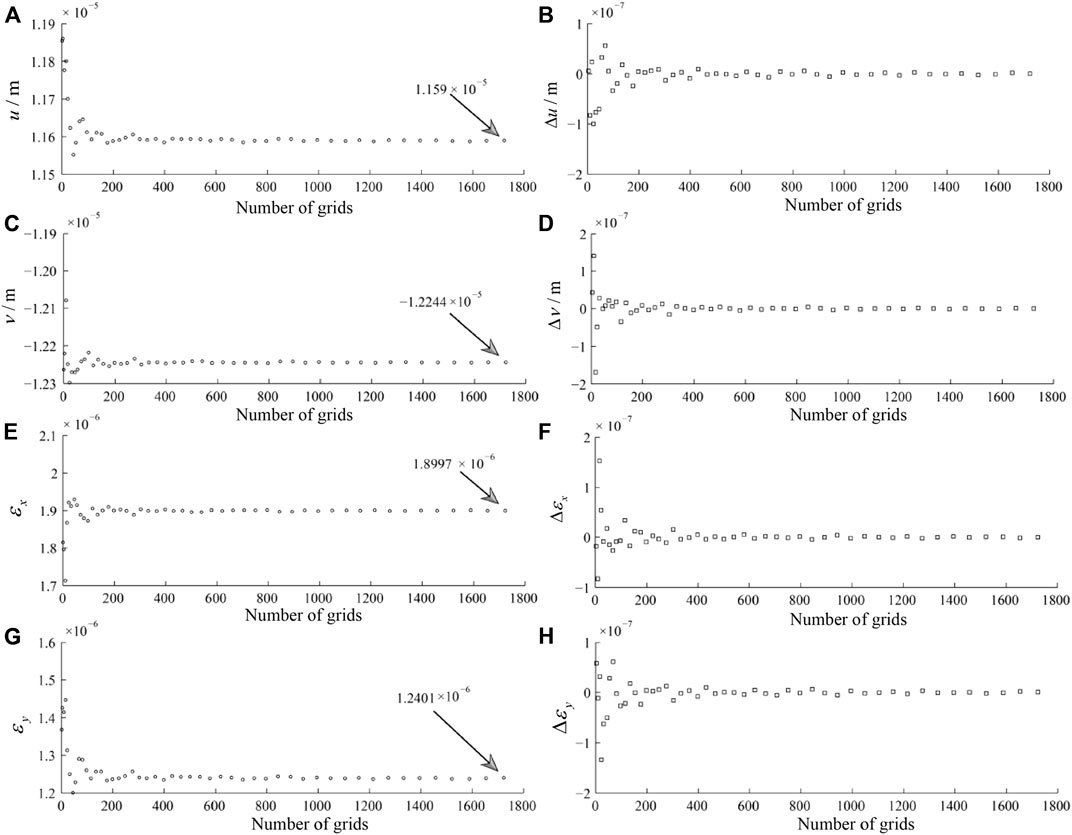
FIGURE 4. The relationship between the horizontal displacement and linear strain and the change of grid count n in the point of M(1.5 m, −1.5 m, −0.2 m) using the model of two dimensional irregular load (A) the relationship between displacement u and number of grids n; (C) the relationship between displacement v and number of grids n; (E) the relationship between linear strain εx and number of grids n; (G) the relationship between linear strain εy and number of grids n; (B),(D),(F),(H) are the first-order differences of data of (A),(C),(E),(G) respectively.
It can be seen from Figure 4 that the displacements u and v converge to 1.159 × 10⁻⁵ m and -1.2244 × 10⁻⁵ m, respectively, as the grid number n increases (Figures 4A,C). The linear strains εx and εy converge to 1.8997×10⁻⁶ and 1.2401×10⁻⁶, respectively (Figures 4E,G). The first-order differences of the above parameters all converge to 0, indicating that the scattering method is correct and feasible for calculating the load model with two-dimensional irregular shapes.
For the two-dimensional irregular shape load shown in figure 3, taking sand-rock as an example (Young's modulus E = 107 Pa, Poisson's ratio μ = 0.25, load force P = 10 N), the spatial distribution of horizontal strain field at 0.2m depth is shown in Figure 5.
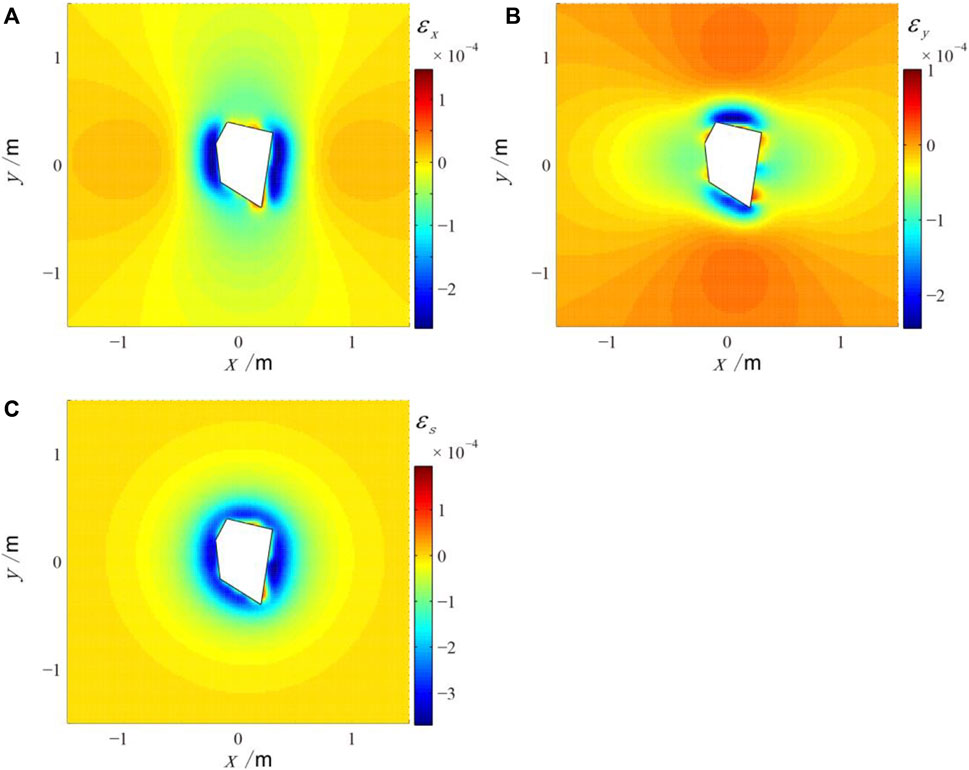
FIGURE 5. The strain field displacement around the 2D irregular load model in the depth of 0.2 m (A) The linear strain εx; (B) The linear strain εy; (C) The area strain εs; the white polygon represents the shape of irregular load.
As can be seen in Figure 5, the strain field around the two-dimensional irregular load is compressed (negative values). In the near field, the regional strain εs is related to the shape of the load. In the far field, the strain field is almost circular, which indicates that in the far field, the irregular load can be reduced to a point-like load model. In other words, when the irregular load is close to the borehole strain gauge, we cannot reduce the whole load to a point-like load model for calculation.
3.2 Three-dimensional model
The method for solving the effects of 3D irregular loads is essentially similar to that of the 2D load model. It is also based on the scattering of irregularly shaped loads (Figure 6). The differences between the two are as follows. 1) for 3D irregular shape loads with uniform density, the height Hi of the scattered points is redistributed to the total load P as weights (Figure 7); 2) for 3D irregular shape loads with non-uniform density, the scattered height Hi and density ρi can be used as weights to redistribute the load.
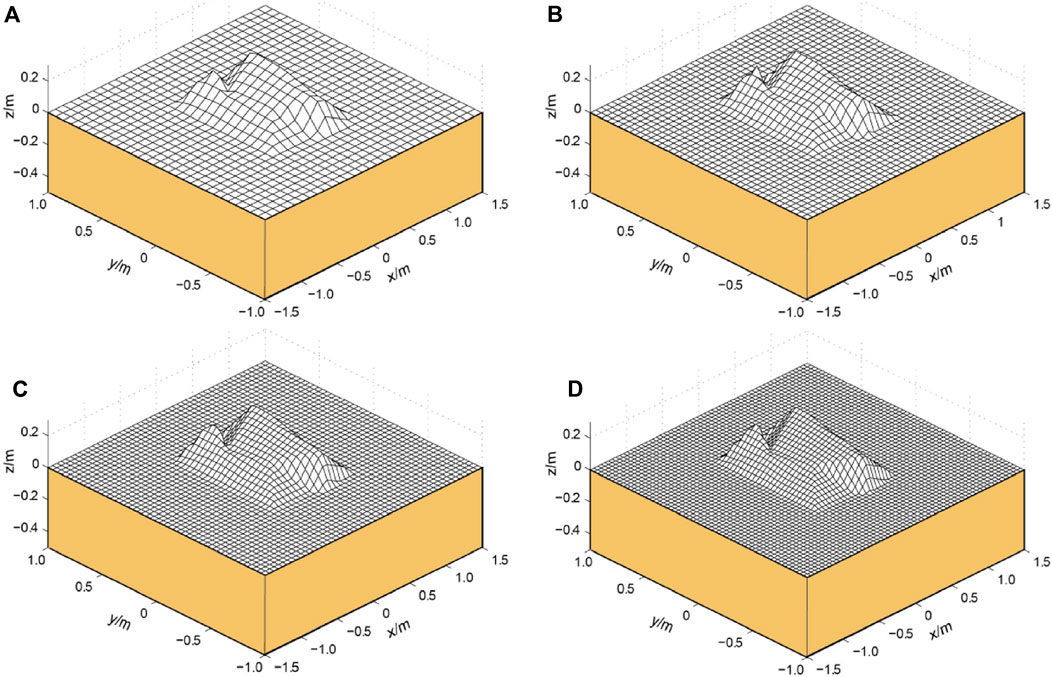
FIGURE 6. The scatter process diagram of three dimensional irregular load model in different grid count n. (A) n = 30; (B) n = 40; (C) n = 50; (D) n = 60.
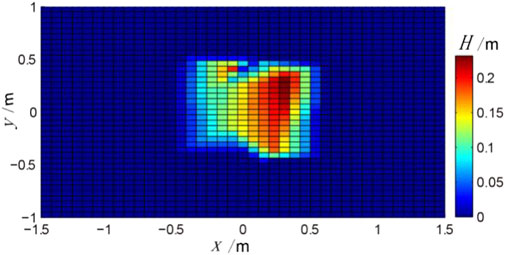
FIGURE 7. The height distribution of three dimensional irregular load model.
Since there is no obvious difference between the inhomogeneous and homogeneous densities in the processing, in order to illustrate the method of load modeling clearly, this paper focuses on the method of establishing the 3D load model with homogeneous density. Similar to the two-dimensional irregular shape load model, due to the existence of the scattering process, the convergence characteristics of the computational results with the number of grids n need to be verified, and the computational results are shown in Figure 8.
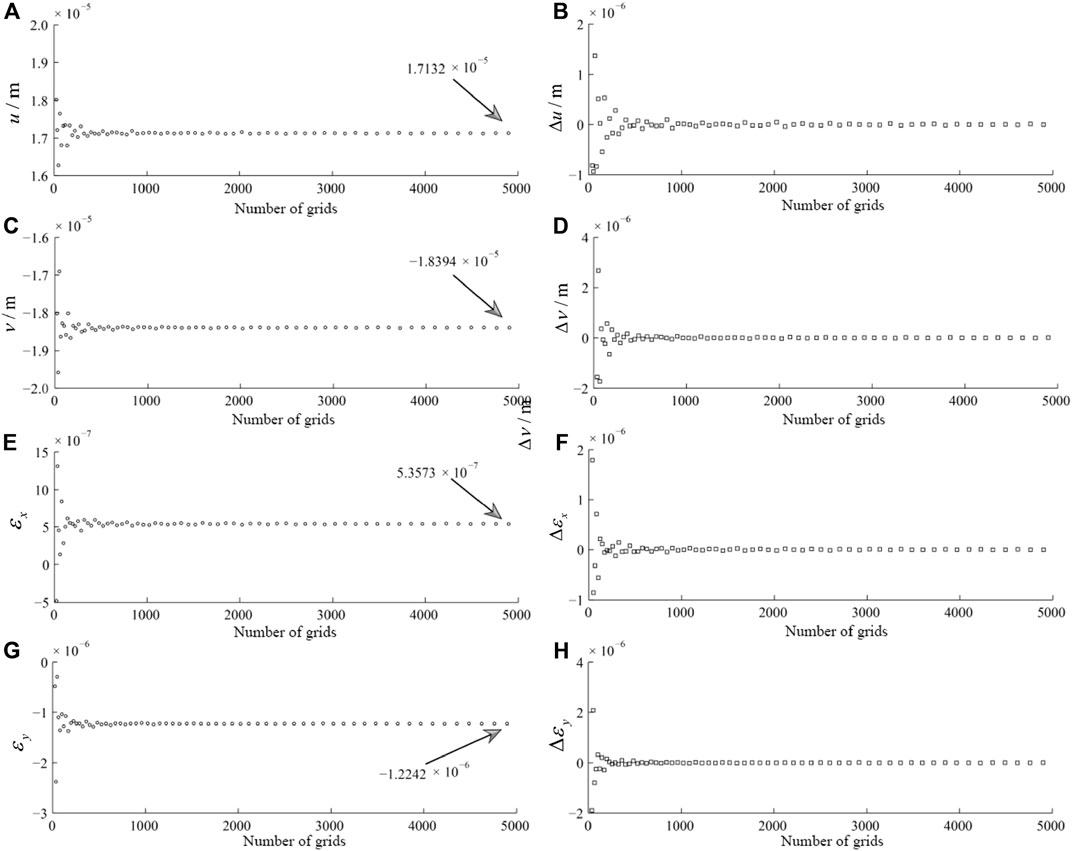
FIGURE 8. The relationship between the horizontal displacement and linear strain and the change of number of grids n in the point of M(1.5 m, −1.5 m, −0.1 m) using the model of three dimensional irregular load (A) the relationship between displacement u and number of grids n; (C) the relationship between displacement v and number of grids n; (E) the relationship between linear strain εx and number of grids n; (G) the relationship between linear strain εy and number of grids n; (B),(D),(F),(H) are the first-order differences of data of (A),(C),(E),(G) respectively.
Figure 8 shows the horizontal displacements and strains at point M (1.5m, -1.5m, -0.1m) versus the number of grids n using a three-dimensional irregular load model with Young's modulus E=4×10⁷ Pa, Poisson's ratio u=0.25, and total load P=2×10⁴ N. It can be seen that the displacements u and v converge to 1.7132×10⁻⁵m and -1.8394×10⁻⁵m, respectively, as the number of grids n increases (Figure 6a, c). The linear strains εx and εy converge to 5.3573×10⁻⁷ and -1.2242×10⁻⁷, respectively (Fig. 6e,g). The first-order differences of the above parameters all converge to 0, indicating that it is correct and feasible to calculate the three-dimensional irregular shape load model by the scattering method.
For the three-dimensional irregular shape load shown in Figure 6, the spatial distribution of the horizontal strain field at a depth of 0.2 m for sandstone, for example, is shown in Figure 9.
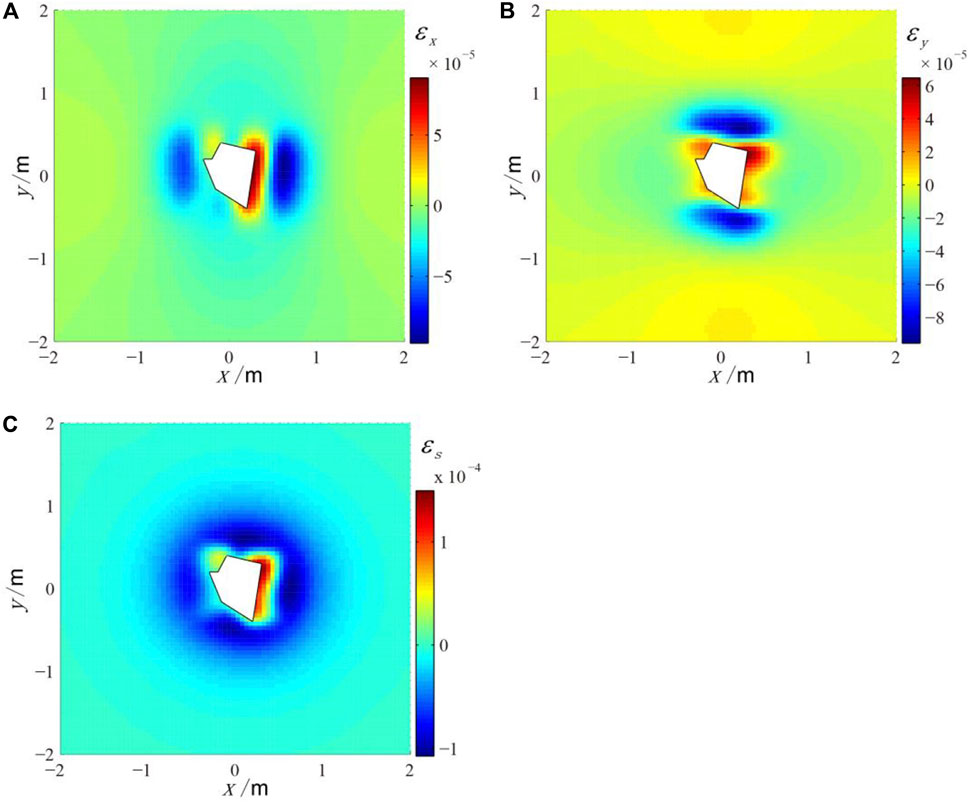
FIGURE 9. The strain field displacement around the 3D irregular load model in the depth of 0.2 m (A) The linear strain εx; (B) The linear strain εy; (C) The area strain εs; the white polygon represents the shape of irregular load.
As can be seen from Figure 9, the spatial distribution of the strain field in the 3D irregular load model is more complex than that in the 2D irregular load model. This inhomogeneity is not only related to the irregular distribution of the planar projection shape of the irregular load, but also to the inhomogeneity of its elevation distribution.
We summarize the procedure for calculating the strain field around irregular loads in two and three dimensions (Figure 10). First, we spread out the irregularly shaped loads. Using the point load model (Eqs. 6, 7), we calculated the strains in the x and y directions caused by each scattered point to the point of calculation. After vector superposition, the strain value of the irregular load model at that point can be obtained.
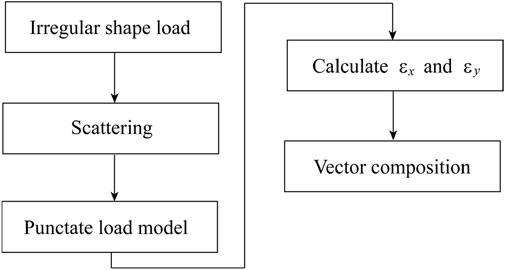
FIGURE 10. The calculation process of the strain field around the irregular loads.
4 Conclusion
Quantitative analysis of the effect of load is important for the analysis of high-precision borehole strain observation data. Different from the previous methods of simplifying the irregular load model to a punctate model, this paper proposes a method to obtain the exact solution of the strain field around the irregular load. In fact, we can simplify the irregularly shaped load to a punctate load only under the assumption that the distance is long enough. However, when the distance is long, the magnitude of the load effect also decreases nonlinearly. Therefore, the point-like simplified model cannot accurately solve the effect of short-distance loads on the observed strain in the borehole.
This paper gives quantitative calculation methods and analytical solution examples for borehole strain observations due to irregular loads in two and three dimensions. The work is carried out to provide a theoretical analysis of the effect of peripheral loads on borehole strain observations. The in-hole strain observation includes both volumetric and line strains, and this work is targeted to quantitatively analyze the load-on-line strain observation data caused by environmental factors.
Through the above calculation and analysis, we can get the following conclusions.
1) The effect of the punctate load on the observed strain in the borehole can be calculated by Eqs. 6, 7. The characteristics of the strain field around the point-like load can be described as follows. Tensile strain occurs in a small area at the center of the compressive load, compressive strain occurs away from this area, and the strain value decreases rapidly with increasing distance.
2) The calculation process of the strain field around irregular loads in two and three dimensions can be described as follows. Based on the dispersed irregularly shaped loads, using the point load model, we can calculate the strains in the x and y directions. After vector superposition, we can get the strain values of the irregular load model.
3) The relationship between horizontal displacement, linear strain and grids number variation shows that it is correct and feasible to calculate two-dimensional and three-dimensional irregular shape load models by scattering method.
Data availability statement
The original contributions presented in the study are included in the article/Supplementary Material, further inquiries can be directed to the corresponding author.
Author contributions
WY designed the algorithm and calculated the cases, Email: ywpro@163.com; ZL checked the calculation results.
Funding
This paper is supported by the National Key Research and Development Program of China under grants 2021YFC3000705-06, 2017YFC1500502-05 and The National Natural Science Foundation of China under grants 2021YFC3000705-06.
Acknowledgments
This work has been consulted and discussed with Niu Anfu of China Earthquake Network Center and Zhang Jing of Institute of Seismic Prediction, China Earthquake Administration.
Conflict of interest
The authors declare that the research was conducted in the absence of any commercial or financial relationships that could be construed as a potential conflict of interest.
Publisher’s note
All claims expressed in this article are solely those of the authors and do not necessarily represent those of their affiliated organizations, or those of the publisher, the editors and the reviewers. Any product that may be evaluated in this article, or claim that may be made by its manufacturer, is not guaranteed or endorsed by the publisher.
References
Bonaccorso, A., Linde, A., Currenti, G., Sacks, S., and Sicali, A. (2016). The borehole dilatometer network of mount etna: A powerful tool to detect and infer volcano dynamics. J. Geophys. Res. Solid Earth 121, 4655–4669. doi:10.1002/2016JB012914
Boussinesq, J. (1885). Application des Potentiels a L’etude de l’equilibre et due Mouvement des Solides Elastique. Paris: Gauthier-Villars.
Capar, O. F., and Ishibashi, I. Recovery of elastic parameters for cross-anisotropic sandy soil via elastic wave measurements. https://scholarsmine.mst. edu/ icrageesd/05icrageesd/session01/21.May 2010, Proceedings of the International Conferences on Recent Advances in Geotechnical Earthquake Engineering and Soil Dynamics, San Diego, California, 21.
Chi, S. (1993). Test and observation results of a shallow borehole YRY-2 borehole strain gauge at 8 stations in North China. J. Seismol. 15 (2), 224–230.
Currenti, G., Zuccarello, L., Bonaccorso, A., and Sicali, A. (2017). Borehole volumetric strainmeter calibration from a nearby seismic broadband array at Etna volcano. J. Geophys. Res. Solid Earth 122, 7729–7738. doi:10.1002/2017JB014663
David, S., Willam, P., and Mark, Z. (2002). EarthScope: Acquisition, construction, integration and facility management. A Collab. Propos. NSF.
Du, R., Qiao, X., and Wang, Q. (2004). Crustal deformation-GPS observation research on water storage load of the three gorges reservoir of the yangtze river. Adv. Nat. Sci. 14 (9), 1006–1011.
Hu, W., Zhang, J., Xie, Z., Wang, Z., An-yin, L., Feng, J., et al. (2002). Experiments and mechanical analysis of the effect of load on borehole strain measurement. Earthquake 22 (3), 95–104. doi:10.3969/j.issn.1000-3274.2002.03.016
Huang, Q. (2005). Study on load transfer factor of thick sandy soil on Key roof layers. J. Geotechnical Eng. 27 (6), 672–676.
Laiolo, M., Ripepe, M., Cigolini, C., Coppola, D., Della Schiava, M., Genco, R., et al. (2019). Space- and ground-based geophysical data tracking of Magma Migration in shallow feeding system of Mount Etna Volcano. Remote Sens. (Basel). 11, 1182. doi:10.3390/rs11101182
Li, H., Ma, H., and Zhang, J. (2004). FZY-1 component borehole strain meter design. Seismic Geomagnetic Observation Res. 25 (1), 69–77.
Li, Z., Wu, S., Guang, C., Zhong, J., and Yuan, L. (2007). Using point load superposition method to study short-leveling anomaly data across fault in Tianma. Earthq. Res. 30 (1), 35–38.
Linde, A. T., Kamigaichi, O., Churei, M., Kanjo, K., and Sacks, S. (2016). Magma chamber recharging and tectonic influence on reservoirs: The 1986 eruption of izu-oshima. J. Volcanol. Geotherm. Res. 311, 72–78. doi:10.1016/j.jvolgeores.2016.01.001
Luo, M., Chi, S., and Ma, H. (2008). Absolute stress measurement and borehole strain measurement. Beijing, China: Seismological Press, 170–177.
Niu, A., Zhang, L., and Yan, W. (2012). Analysis of short-term precursor phenomena of topographic deformation near the focus of wenchuan earthquake in. Earthquake 32 (2), 52–63.
Ouyang, Z., Zhang, J., and Zheng, C. (2009). New progress of comprehensive observation technology for crustal deformation deep wells. Int. Earthq. Dyn. 11, 1–13.
Qiu, Z. (2004). Theoretical analysis of minimum "quiet" distance from borehole strain observation point to surface load disturbance source. J. Rock Mech. Eng. 23 (23), 4063–4067.
Qiu, Z., Zhang, B., and Chi, S. (2010). Anomalous strain changes observed at Guzan station before the Wenchuan earthquake in 2010. Chin. Sci. Ser. D 40 (8),2010 1031–1039.
Qiu, Z. (2014). Several issues concerning monitoring strong earthquake precursors with dense borehole strain network. J. Seismol. 36 (4), 738–749.
Wang, H. (2000). Surface vertical displacements and level plane changes in the front reservoir area caused by filling the Three Gorges Reservoir. J. Geophys. Res. 105 (B6), 13211–13220. doi:10.1029/2000jb900072
Wang, H., Hsu, H., and Zhu, Y. (2002). Prediction of surface horizontal displacements, and gravity and tilt changes caused by filling the Three Gorges Reservoir. J. Geodesy 76 (2), 105–114. doi:10.1007/s00190-001-0228-3
Yang, G., Wu, Y., Yu, B., and Wang, W. (2002). Research on deep plate load test of high-rise buildings. Geol. Explor. 38 (4), 90–93.
Zhang, J., Jiang, X., Fang, Y., and Wang, W. (2009). Quantitative analysis of surface tectonic deformation by comprehensive deformation observation. Earthquakes 29 (2), 32–39.
Keywords: borehole strain observation, punctate load model, irregular shape load, superposition principle, scattering
Citation: Yan W and Li Z (2023) Analytical solution for the influence of irregular shape loads on near borehole strain observations. Front. Earth Sci. 10:1011614. doi: 10.3389/feart.2022.1011614
Received: 04 August 2022; Accepted: 31 October 2022;
Published: 17 January 2023.
Edited by:
Luan Thanh Pham, VNU University of Science, VietnamReviewed by:
Lan Cui, Institute of Rock and Soil Mechanics (CAS), ChinaMelouah Oualid, University of Ouargla, Algeria
Chengquan Chi, Hainan Normal University, China
Copyright © 2023 Yan and Li. This is an open-access article distributed under the terms of the Creative Commons Attribution License (CC BY). The use, distribution or reproduction in other forums is permitted, provided the original author(s) and the copyright owner(s) are credited and that the original publication in this journal is cited, in accordance with accepted academic practice. No use, distribution or reproduction is permitted which does not comply with these terms.
*Correspondence: Wei Yan, eXdwcm9AMTYzLmNvbQ==