 Jiaxu Jin1,2
 Xinlei Zhang
 Xiaoli Liu
95% of researchers rate our articles as excellent or good
Learn more about the work of our research integrity team to safeguard the quality of each article we publish.
Find out more
ORIGINAL RESEARCH article
Front. Earth Sci. , 10 January 2023
Sec. Geohazards and Georisks
Volume 10 - 2022 | https://doi.org/10.3389/feart.2022.1006642
This article is part of the Research Topic Geological Disasters in Deep Engineering Mechanism, Warning and Risk mitigation View all 39 articles
Freeze–thaw damage of rock mass poses a great threat to the safety of rock engineering, ground buildings, and low-temperature storage of liquefied natural gas (LNG) in cold regions. By collecting acoustic emission (AE) signals of sandstone during uniaxial compression failures, this paper analyzed the critical slowdown phenomenon of different types of sandstone during the freeze–thaw failure. According to the auto-correlation coefficients and the variance of AE signals under different windows and steps, the precursors were determined and a warning model of rock engineering failure precursors based on the critical slowdown principle was proposed. Then the Grey Wolf Optimizer (GWO) algorithm was used to optimize the initial weights and thresholds of the back propagation (BP) neural network, and the influence factors of rock engineering failure under different working conditions were input as training sets to train the network. The results showed that the correlation coefficients between the predicted value and real value of the GWO-BP neural network reached 99.90% and 98.81% respectively, indicating that the accuracy of the BP neural network prediction was improved. This study provides a new method for rock engineering failure early warning, and has great theoretical and guiding significance for enriching and improving the rock mass AE monitoring technology.
Globally, more than 25% of the land area is covered by permafrost, while the distribution of cold regions is more extensive. Under the condition of freezing and thawing, the corresponding damage of rocks in cold regions will lead to a series of engineering problems, such as the frost heaving, cracking of oil pipelines and tunnel surrounding rocks, instability and failure of the supporting structure, erosion and weathering of slope engineering, instability of the high-risk rock mass, storage of liquid resources, and weathering of rock cultural relics (Liu et al., 2018). The freeze–thaw damage of rocks is mainly caused by the volume expansion of 9% frozen water in pores (pores or cracks) and the thermal stress at low temperature conditions (B et al., 2018, Girard et al., 2013). Under such conditions, the frost heaving force in the saturated pores caused by water/ice phase transition can cause cracks and defects, further leading to the destruction of rock engineering in cold regions (Kock et al., 2015; Park et al., 2015; Tan et al., 2018; Kong et al., 2020). Zhao et al. studied the creep failure mechanism of rock cracks under hydraulic pressure and derived the compression-shear fracture criterion of rock under hydro-mechanical coupling (Liu et al., 2022; Zhao et al., 2019). Therefore, to develop an early warning model of rock engineering failure is of great significance for engineering safety evaluation.
The energy theory research shows that the fundamental roles of rock deformation and failure are the dissipation and release of energy. The instability and failure of rocks are the result of the sudden release of internal energy, the main forms of which are the kinetic energy and acoustic emission (Zhao et al., 2019). Therefore, the theory based on the view of energy can well describe the deformation and failure of rocks. AE is a non-destructive monitoring method which can identify the crack propagation and the failure mechanism of materials and structures, and it is widely used in civil engineering due to its high sensitivity and accurate evaluation. AE parameters as another characterization of waveform are widely used in the study of the critical slowdown phenomenon. When the complex dynamic system approaches the critical point before mutation, there is a phenomenon called critical slowdown, which is manifested by the increase of precursor variance and auto-correlation coefficients (Leemput et al., 2013; Maturana et al., 2020). Critical slowdown phenomenon has great potential in revealing whether complex dynamic systems are prone to catastrophic mutations. Lei et al. (2004) pointed out that AE signals of the sandstone failure have obvious stage characteristics, the cumulative AE count has a good correspondence with the sandstone damage, and the sudden large-scale increase of self-correlation coefficients and the variance of AE count can be employed as precursors of the sandstone engineering failure. When the rock is close to collapse, there will be a series of key deceleration characteristics, including the significant increase of the AE count and density value per unit time (Lei et al., 2004; Huang et al., 2016), indicating that the AE signals generated in the process of rock failure make a critical change (Xia et al., 2022), Kong et al. (2015) believed that under the triaxial compression conditions of different confining and pore pressures, the AE characteristics of coal and rock samples underwent a critical deceleration process. The variance and auto-correlation coefficients of AE count and time series increased before the failure of coal and rock. Therefore, the variance and auto-correlation coefficients could be used as the precursors of coal failure. Compared with the AE cumulative signals as the mutation points of precursors, the time delay between precursors and mutation points was shortened within a reasonable range, accounting for 2%–10% of the total loading time (Kong et al., 2015).
With the development of digital signal technology, the neural network as an intelligent algorithm has excellent nonlinear adaptive characteristics and is suitable for parallel processing and hardware implementation (Rumelhart et al., 1986). Due to the improper parameter selection into local minimum in some cases, the algorithm converges to the mean square error gradient descent direction, meanwhile its convergence speed is slow, thus the back propagation (BP) neural network is very sensitive to the initial weight threshold. Chai et al. optimized the BP neural network through the wavelet analysis, removed the noise of the initial data by the wavelet function, and employed the BP neural network and the gradient descent method to train and adjust the neural network parameters. Although the accuracy of the prediction results has been improved, the convergence speed has been reduced (Chai et al., 2016). Xie et al. proposed a new damage constitutive model related to Weibull distribution and statistical damage theory. (Xie et al., 2020). The finite element method of seepage-damage coupling was carried out in FORTRAN in Zhao Yanlin’s study (Zhao et al., 2021). Grey Wolf Optimizer (GWO) algorithm was proposed by Mirjalili et al. (2014) by simulating the social class and predatory strategy of Grey Wolf. Since this algorithm has the characteristics of strong global search ability, fast convergence speed, and simple implementation, it can make up for the deficiency of BP neural network algorithm and has been widely used (Zhang and Zhou, 2015).
In summary, previous studies on the critical slowing of rock failure have made a lot of achievements, but there are few reports on establishing an early warning model of rock failure in cold regions based on neural networks through the critical slowing characteristics of rock failure. Therefore, this paper intends to carry out uniaxial compression experiments of sandstone with different saturations, and explore the critical slowing down phenomenon of acoustic emission signals in the process of rock uniaxial compression experiments. According to the critical slowing down phenomenon of sandstone compression failure, a precursory signal model for rock engineering failure is proposed based on GWO-BP algorithm.
The equipment used in the uniaxial compression test is the WDW-300E microcomputer controlled electronic universal testing machine made in China. The maximum test force is 300 kN, the effective measurement range is 0.4%–100% of the maximum test force, and the measurement accuracy is less than or equal to ±1%. The axial range of deformation is 0–5 mm, the radial range is 0–3 mm, and the measurement accuracy is less than or equal to ±1%. The DS5-8B AE instrument used in the AE signal acquisition test in the uniaxial compression process has two to eight channels. The continuous data pass rate of DS5-8B acoustic emission instrument is 65.5 MB/S, the pass rate of waveform data is 48 MB/S, interface form is USB3.0, data acquisition method is multi-channel synchronous acquisition, software operating environment for win7/8/10 operating system, the storage method is full waveform acquisition, and all channels can continuously store waveform data for several hours to ensure that no doubtful data is lost during acquisition, the sampling rate is 10 M per channel when using 2 channels, 5 M or 6 M per channel when using 4 channels, and 3 M or 2.5 M per channel when using 8 channels. External parameter sampling frequency is 30 KHz and 25 KHz, external parameter conversion accuracy is 16bit, external parameter input range is±5 V or ±10 V. The loading device and data acquisition system are shown in Figure 1.
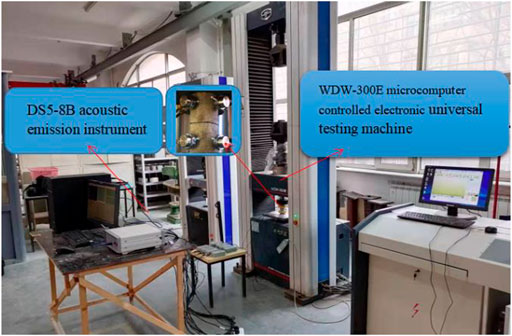
FIGURE 1. The loading device and data acquisition system.
All the test rock blocks were taken from the fresh sandstone of a rock slope in the transition section between Sichuan Basin and Qinghai Tibet Plateau of the Sichuan-Tibet railway. The surface water and rivers in the study area have obvious erosion and cutting effects on the mountain and subgrade. Both groundwater and water-bearing rocks receive atmospheric precipitation in summer, and supplied by melting ice in winter, The annual average temperature is 7.1°C, the extreme maximum temperature is 23.4°C, and the extreme minimum temperature is −19.1°C, The external forces are mainly hydraulic erosion and freezing and thawing, which are typical plateau landforms. All test samples were derived from the same non-jointed rock core. The rock samples had high homogeneity, small discreteness and relatively large porosity, so they can ensure different gradient water content (Zhang et al., 2019). According to the International Society for Rock Mechanics (ISRM) test procedure, the experimental rock samples were processed, and the size of the specimens was specified as Ф50 mm×100 mm. The accuracy of the rock sample processing meets that the non-parallelism error of the two ends shall not be greater than 0.05 mm, and the end surface roughness error is not greater than 0.02 mm. Then, the ultrasonic detector was used to test the sound velocity of the specimens with uniform texture and complete appearance. After the test, the rock samples with large dispersion were removed, then the rock samples with similar quality were selected as the test rock sample. The initial dry density of the rock sample is 2.33
Crack initiation and propagation of rock materials are often accompanied by the release of elastic waves, which can be recorded as AE signals through the AE monitoring system (Dai et al., 2019). Kong et al. (2017) divided the failure stage into the quiet, linear increase, rapid increase, and saturation stages according to the AE cumulative count curve (Kong et al., 2017). Yang et al. (2018) divided the failure stage of sandstone into three stages according to the AE signals: initial compaction, slow growth, and rapid growth stages. Based on the previous studies and the change of ringing count in the process of rock failure, the rock failure stage can be divided into four stages: initial compaction (OA stage), slow growth (AB stage), rapid growth (BC stage) and failure (CE stage). Figure 2 describes the load–displacement curves and the ringing counts of seven rocks with different saturations.
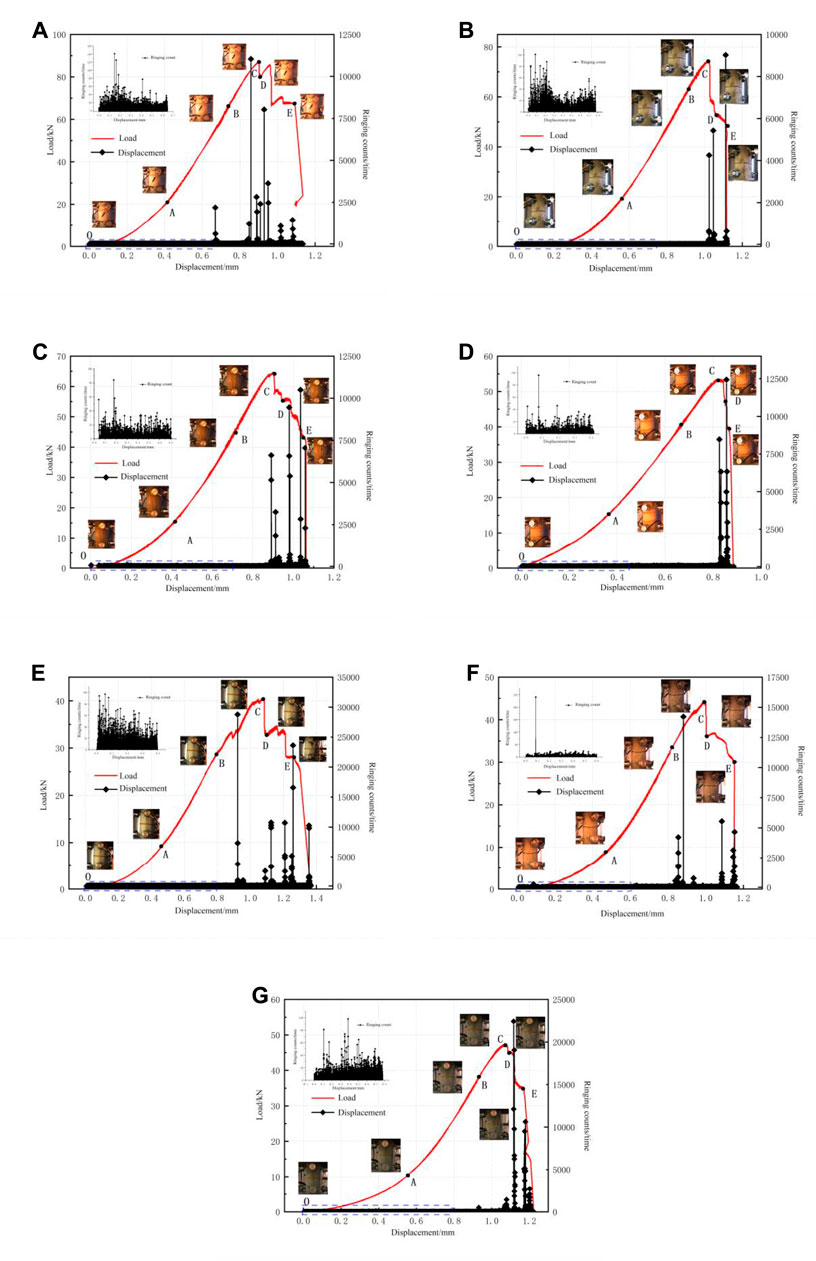
FIGURE 2. The acoustic emission (AE) signal of loading process: (A) 0%, (B) 30%, (C) 60%, (D) 75%, (E) 85%, (F) 95%, (G) 100%.
As a kind of porous medium material, sandstone contains many primary cracks and fissures. In the initial compaction stage (OA), the unclosed cracks and pores in the original interior of the rock sample were closed due to compression, the force on the rock sample failed to form a linear relationship with the displacement, and the load-displacement curve tended to be concave. At this time, the ringing count generally had a short-term mutation. This is because during the initial contact process, due to the inertia effect, the instantaneous stress would be too large, resulting in a sudden increase in the ringing count at the initial stage. With the increase of saturation, the OA stage obviously prolonged under a certain axial pressure, that is, (g) in Figure 2 corresponded to the longest OA stage. This is due to the increase of water molecular content, a part of hydraulic pressure offset the axial pressure, which prolonged the closure time of initial microcracks and pores.
With the progress of loading, the initial pores and cracks of the rock samples had been closed. This stage was the slow growth stage (AB). The load increased linearly with the displacement. The rock samples showed elastic deformation under uniaxial pressure. The acoustic emission events were relatively few, and the acoustic emission activity remained basically in a stable state during the whole process.
During the rapid growth stage (BC), the load-displacement curve of this stage showed a convex trend, which was an obvious nonlinear growth stage. Cracks began to form inside the rock sample and developed cumulatively. The propagation of cracks continuously demanded for energy. Externally, the AE activity was relatively quiet, and the ringing count fluctuation was small. However, there were many sudden changes during this stage as polymerization appeared in the rock sample in the loading process of microcracks, resulting in large fluctuations of the ringing count. Therefore, in the monitoring and early warning of rock mass engineering in cold regions, it was necessary to pay attention to these fluctuations to avoid misjudgment in monitoring and early warning.
With the increase of axial pressure, the internal energy of the rock sample continued to accumulate. When the internal structure of the rock sample reached the bearing limit, the penetrating cracks appeared and the sample was destroyed. At this time, the acoustic emission activity became extremely active. The rock sample entered the failure stage (CE), and the ringing count suddenly increased obviously. After the peak stress, the microcracks and pores in the sandstone continued to expand. Even at a small stress level, the acoustic emission count was still at a high level.
Critical slowdown refers to the dispersion and fluctuation phenomenon conducive to the formation of new phases in the dynamic system near the critical point before it changes from one phase state to another (Scheffer, 2009). During the failure process of rock samples, the change of crack motion form during the initiation and propagation of cracks to the failure process of crack instability can be regarded as the transformation process from one phase to another, which is accompanied by the surge of ringing count. This change trend is not only manifested as an increase of the signal amplitude, but also accompanied by a slow recovery rate and the weakening ability to recover to the old phase (Nes and Scheffer, 2007; Scheffer et al., 2009).
According to the critical moderation principle, the variance is a characteristic quantity that describes the extent to which the data in the sample deviates from the mean
where
The auto-correlation coefficient is a statistic that describes the correlation between different moments of the same variable. The auto-correlation coefficient of the variable
Assume that the stage variable has a forced disturbance with the period
where
where
Equation 4 is analyzed by the variance:
When the dynamic system approaches the critical point, the recovery rate of small amplitude disturbance will be slower and slower, and the recovery rate λ, the auto-correlation coefficient α, and the variance will be close to 0, 1, and infinity respectively. Therefore, the increase of auto-correlation coefficient and variance can be used as precursors for the system to approach the critical point.
The AE signals collected by sandstone in the process of uniaxial compression were used to investigate the variation law of the critical slowdown in different windows and lag steps. Due to the similar law obtained by different saturations, the critical slowdown in the process of sandstone compression under saturation is listed here.
In the process of studying the auto-correlation coefficient and variance of critical slowdown characteristics in dynamic systems, there were advantages and disadvantages in parameter data (Dakos et al., 2012). Firstly, the meanings of the window length and lag step length were defined. Here the window length referred to the basic unit for sequence calculation, the lag step length to the lag sequence length from the sequence of the selected window length to another new sequence, the variance to that of the new sequence obtained by the selected window length and the lag fixed step length, and the auto-correlation coefficient to the correlation between the sequence of selected window length and the new sequence obtained by the lag fixed step length. The parameter amount of the data representing system was particularly important: the larger the amount of data selected was, the more reliable the early warning signal in the system was (Carpenter et al., 2011). At the same time, as a non-destructive monitoring technology, the AE technology has been widely used in geotechnical engineering monitoring. Therefore, the AE signal was selected to study the influence of different window lengths and lag steps on the critical slowdown phenomenon.
By using the AE signals collected in the uniaxial compression process of sandstone, the changing rule of critical slowdown with different window and lag step lengths was found. Different window lengths and lag steps have an impact on the stability of the auto-correlation coefficient and variance. According to Figure 3, the influence of different window lengths on variance and auto-correlation coefficient was studied when the window lengths were 1,000, 1,500 and 2000 with the same lag step. According to Figure 4, the influence of different lag steps on variance and auto-correlation coefficient was studied when the lag steps were 100, 200 and 300 with the same window length.
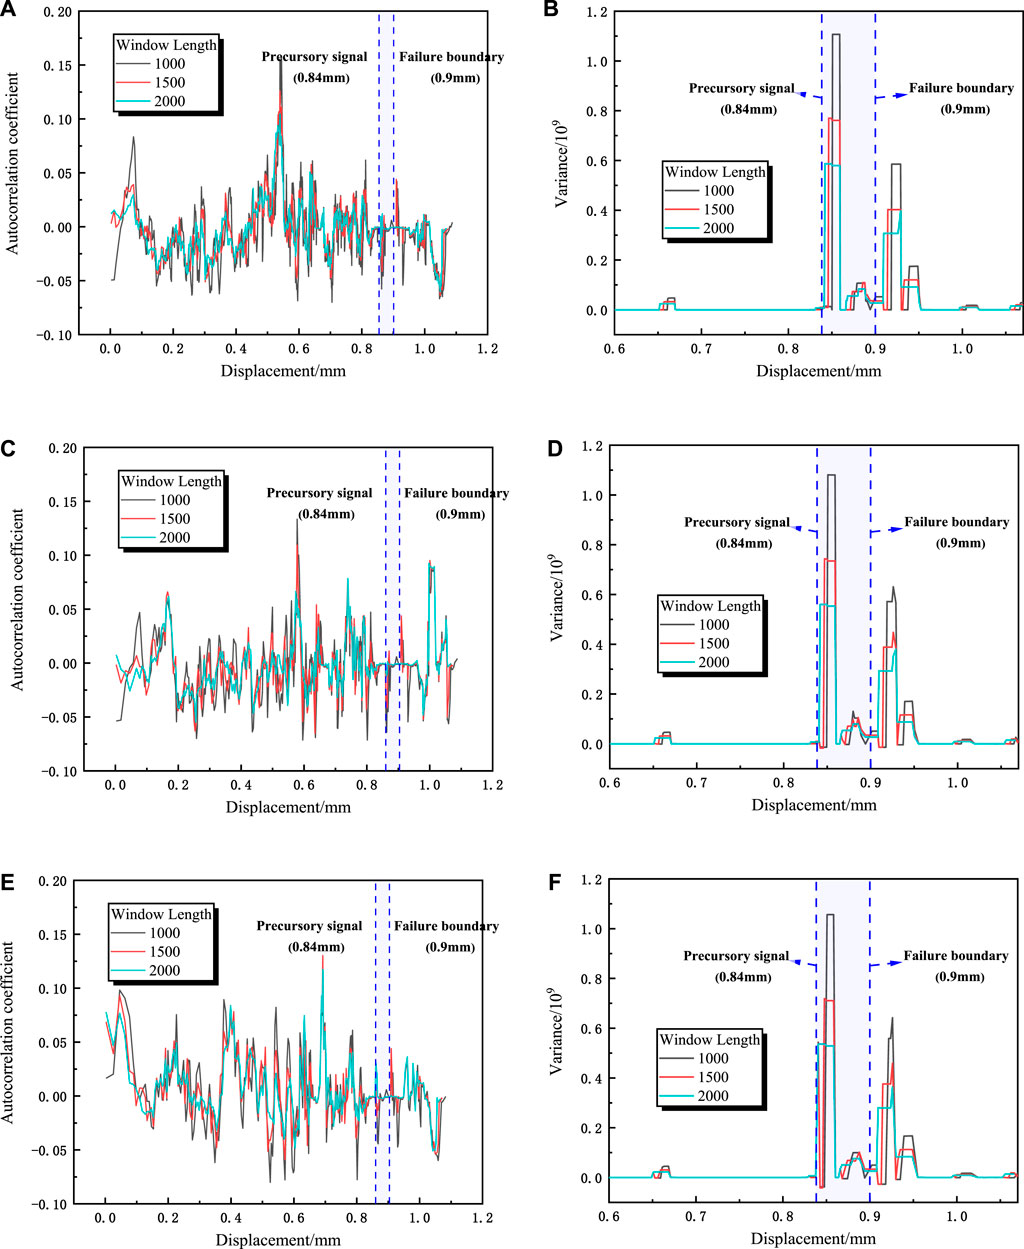
FIGURE 3. The self-correlation coefficient and variance variation characteristics of different window lengths (A,B):lag step length 100, (C,D):lag step length 200, (E,F):lag step length 300).
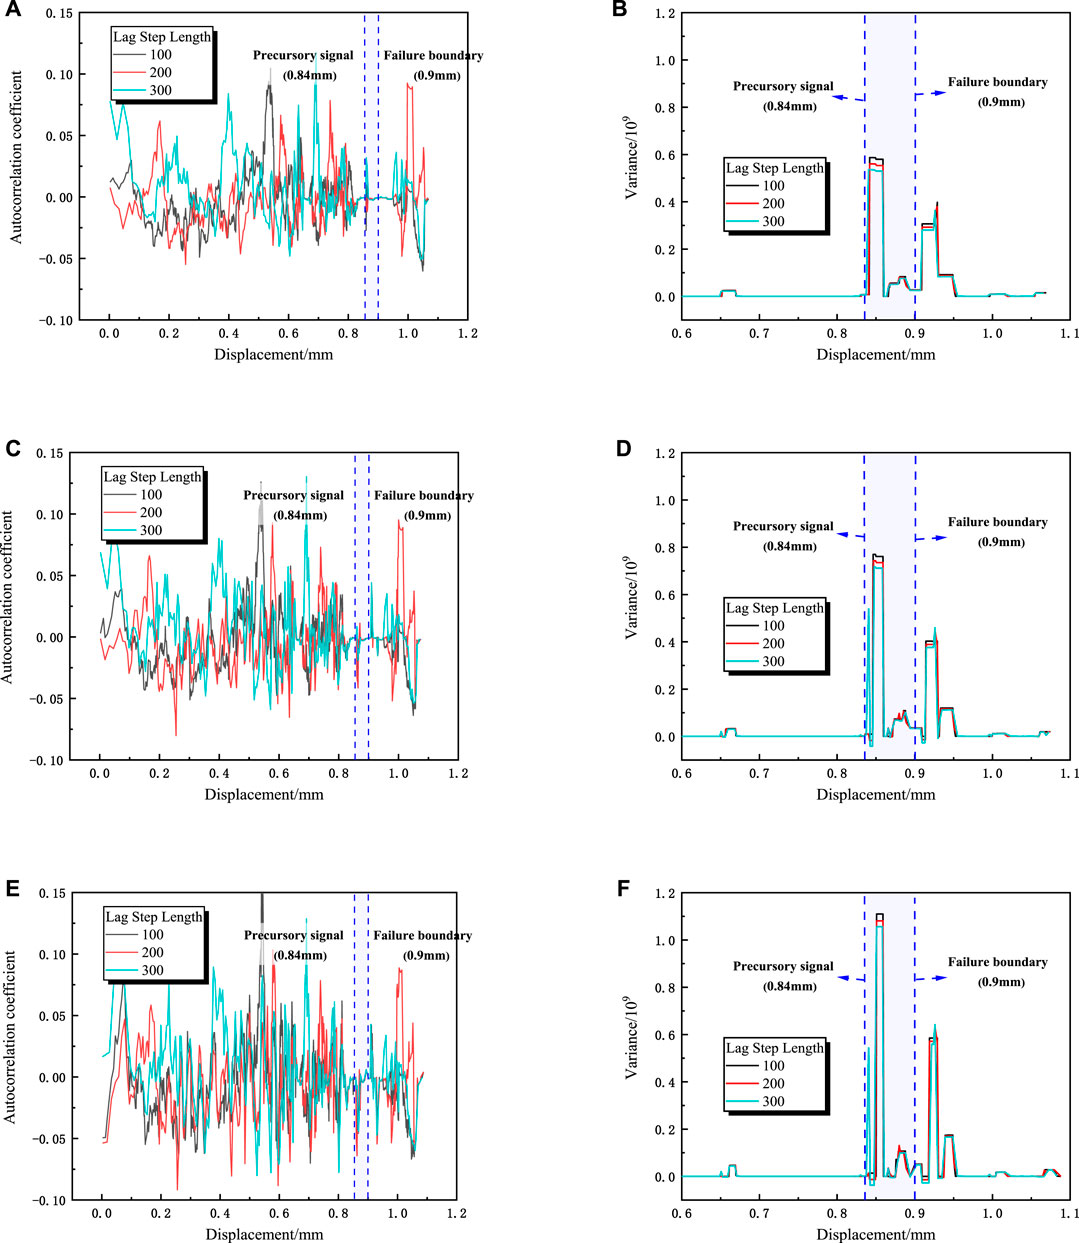
FIGURE 4. The self-correlation coefficient and variance variation characteristics of different lag steps (A,B):window length 2000, (C,D):window length 1,500, (E,F):window length 1,000).
From Figures 3A,B,E, it can be seen that when the lag step is constant, the auto-correlation coefficient curves corresponding to the window lengths of 1,000, 1,500 and 2000 are almost coincident, and the fluctuation trend is consistent. With the increase of window length, the fluctuation shows a gradually stable trend. With the increase of lag step, the fluctuation range of auto-correlation coefficient curve also increases. For the variance curve, the variances under the same lag step and different window lengths are no longer coincident, and the variation ranges are slightly different. The fluctuation range decreases with the increase of the window length, but the mutation point is slightly advanced with the increase of the window length. The variance curves of different lag steps are basically coincident under the same window length—The variance curve does not change with the lag step length. It can be seen from Figure 4 that under the same window length, the auto-correlation coefficient curves corresponding to different lag steps are chaotic and do not show certain rules, but most of the variance curves corresponding to different lag steps overlap. When the lag step is 100, the variance of the precursor signal is the largest. When the lag step is 200 and 300, the variance of the precursor signal decreases in turn. And with the increase of lag step, the variance curve mutation point corresponding to the smaller displacement. Comparing Figures 4B,D,F, with the increase of the window length, the amplification of the inflection point of the variance curve corresponding to the same lag step decreases, consistent with the conclusion of Li et al. (2021), Wei et al. (2018).
Through the comparison between Figure 3 and Figure 4, it can be found that the precursor points located by the auto-correlation coefficient and variance are about 0.84 mm, and the failure position is 0.9 mm, reaching 90% of the sandstone strength, which can better characterize the sample entering the dangerous fracture stage. By comparing the auto-correlation coefficient curve and the variance curve, it is found that the auto-correlation coefficient curve has more peaks, that is, more spurious signals are generated in the auto-correlation coefficient curve. Compared with the auto-correlation coefficient, the variance trend is more intuitive, the mutation point (precursor point) is easier to be identified, and is less affected by the lag length selection. Therefore, in terms of monitoring and early warning, the variance trend is more suitable as a precursor for the failure of sandstone samples.
The BP neural network algorithm is a widely used neural network, which is essentially a gradient descent method. The objective function to be optimized is very complex, which leads to the slow convergence of the BP neural network algorithm. The selection of BP neural network structure lacks a unified and complete theoretical guidance, instead it generally depends on experience. Therefore, how to select an appropriate network structure for application is an important issue. Aiming at overcoming the shortcomings of BP neural network, the GWO algorithm is employed.
GWO is a new swarm intelligence optimization algorithm proposed by Mirjailili et al. (2014). Its core is to optimize the dynamic process of parameters by simulating the hunting process of grey wolves in searching, enclosing, and attacking prey. In order to mathematically model the social hierarchy of wolves when designing GWO, the optimal scheme is defined as α, and the second and third best schemes are β and δ respectively. The GWO algorithm is the process of expelling and surrounding the optimization target by ω under the guidance of α, β, and δ wolves (Gupta and Deep, 2019). The diagram is shown in Figure 5.
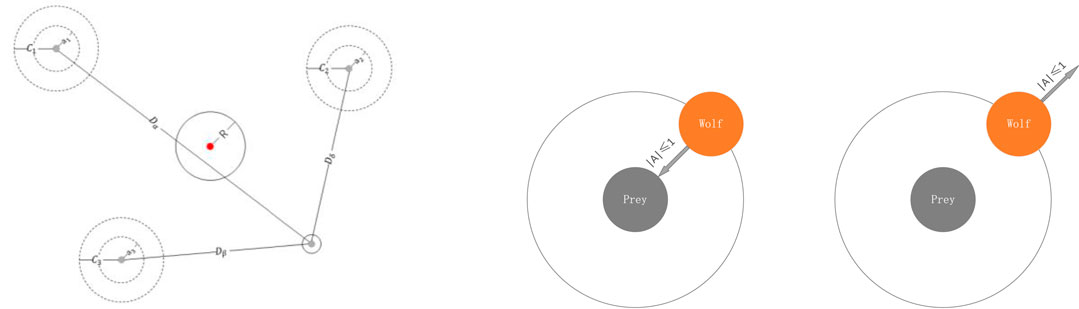
FIGURE 5. Chart of grey wolf searching and attacking prey.
The first step is to lock the target and surround it. The following equations are proposed:
where t denotes the current iteration,
where
The last step is attacking, which is to obtain the optimal solution. The solution is mainly obtained by reducing the value of
Equation 6 defines the step length and the direction of
Based on the divergence of mathematical modeling, the global search of the GWO algorithm is realized by adjusting the value of
BP model randomly allocates the weight matrix and threshold of the hidden layer neurons between the input layer and hidden layer, containing many variable parameters that are difficult to control, and the results are unstable. The GWO-BP algorithm can effectively extract the optimal matrix connecting weights and thresholds, and can dynamically optimize the penalty factor and kernel parameters of the BP neural network, so as to achieve the relatively stable prediction results. The core of the GWO-BP algorithm is to take the weights and thresholds of the BP neural network as the position information
1) Extract the feature vectors and normalize these data.
2) Initialize the deviations and weights, and set the minimum error, maximum number of iterations, and learning rate.
3) Initialize the GWO algorithm, set the number of wolves and the maximum number of iterations, use the initial deviations and weights as the initial solutions to find the optimal solution.
4) For the training of BP neural network, use the output of each layer to calculate the training errors and adjust the deviations and weights of each layer, repeat this operation until the maximum number of iterations or error is less than the threshold.
5) Test the BP neural network by using the test data to determine whether the accuracy meets the requirements.
Freeze–thaw damage of rock mass poses a great threat to the safety of rock engineering, stone buildings, and low-temperature storage of liquefied natural gas (LNG) in cold regions. How to prevent and manage freeze–thaw disasters is what this paper considered, and what is more suitable than managing freeze–thaw disasters is for preventing disasters. At present, with the improvement of monitoring means, plenty of real-time monitoring data of rock engineering can be extracted, therefore, in this paper, the AE equipment is used as the monitoring method to analyze the critical slowdown in the process of rock failure, and the precursors of rock failure is obtained, a warning model of rock failure in cold regions is proposed through the GWO-BP neural network. The specific steps are as follows:
1) The failure process of engineering rock samples in cold regions under different environments was selected for AE monitoring.
2) The critical slowdown of rock samples under various working conditions was analyzed to obtain the failure precursors.
3) The GWO-BP neural network was constructed, and the effective influencing factors were selected to predict the precursors and strength. In this paper, 105 groups of experiments under 21 working conditions of sandstone in cold regions were carried out to establish and test the network.
4) The AE signal of rock engineering was monitored, and the GWO-BP neural network was imported to obtain the strength value at this time. Compared with the precursor points, the early warning was carried out.
BP neural network is usually composed of input layer, hidden layer and output layer. The number of input and output neurons is determined by the parameters needed for modeling, while the number of nodes and layers in hidden layer is not fixed, which will have a certain impact on the performance of BP neural network. In the present study, as listed in Table 1, The input layer consisted of five neurons, one for each independent variable, which typically influenced the sandstone failure process, these variables included saturation, density, longitudinal wave velocity, freeze-thaw times and porosity. The output layer consisted of only one neuron,i.e. precursory signal. Generally speaking, too few neurons in the hidden layer will lead to a decrease in the prediction accuracy of the network, and there will be under-fitting. Increasing the number of neurons can improve the accuracy of the model, but if the number of nodes is too large, it may make the model over-fitting. Therefore, in the construction of this model, the hidden layer selected one layer since one hidden layer was considered sufficient for developing a sound neural network, and the number of neurons in the hidden layer was determined to be 10 by using the method of minimizing network error, which had the highest accuracy. The training algorithm used the Levenberg-Marquardt back propagation method to minimize the mean squared error (MSE) (Low MSE indicates good performance of neural network). With the increase of training error, the influence of the output error of the model on the parameters will increase, and the speed of parameter updating will be faster, but the parameters will be disturbed by a large number of abnormal data at the same time, and it is very easy to diverge. In this paper, the training error was set to 0.01 of the default. The maximum number of training times was selected to be 15,000. In the GWO model, the population was 20 and the maximum number of iterations was 15.
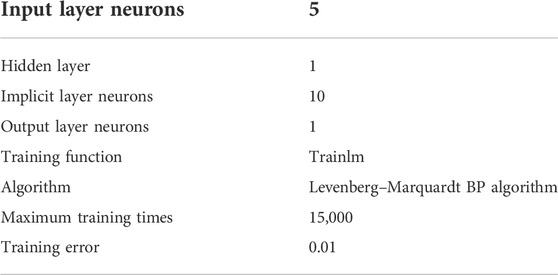
TABLE 1. Selection of neural network parameters.
Firstly, the precursors were predicted according to the uniaxial tests of 105 frozen–thawed sandstones. 4 groups of parallel tests (84 in total) under each working condition are selected for network training. One is selected for each working condition to predict the precursor signals, and the correlation between the predicted value and the real value was used to determine the pros and cons of the prediction.
Then, according to the intensity prediction of AE signals, the number of AE ringing, energy, duration, and impact number were extracted as characteristic parameters. A total of 84,760 groups of data were selected, and 84,700 groups of data were randomly selected for network training. The remaining 60 groups of data were used to test the accuracy of the network.
By comparing the results of the precursors and intensity in GWO-BP and BP predictions (Figures 6, 7), it is found that the correlation between the BP neural network prediction value and the real value is 0.8514. The correlation coefficient between the predicted value and the real value of BP neural network optimized by GWO reaches 0.9990 and 0.9881 respectively, which greatly improves the prediction accuracy. The predicted value of the GWO-BP neural network is credible. The precursor warning model provides a new guarantee for the safety of rock engineering in cold regions.
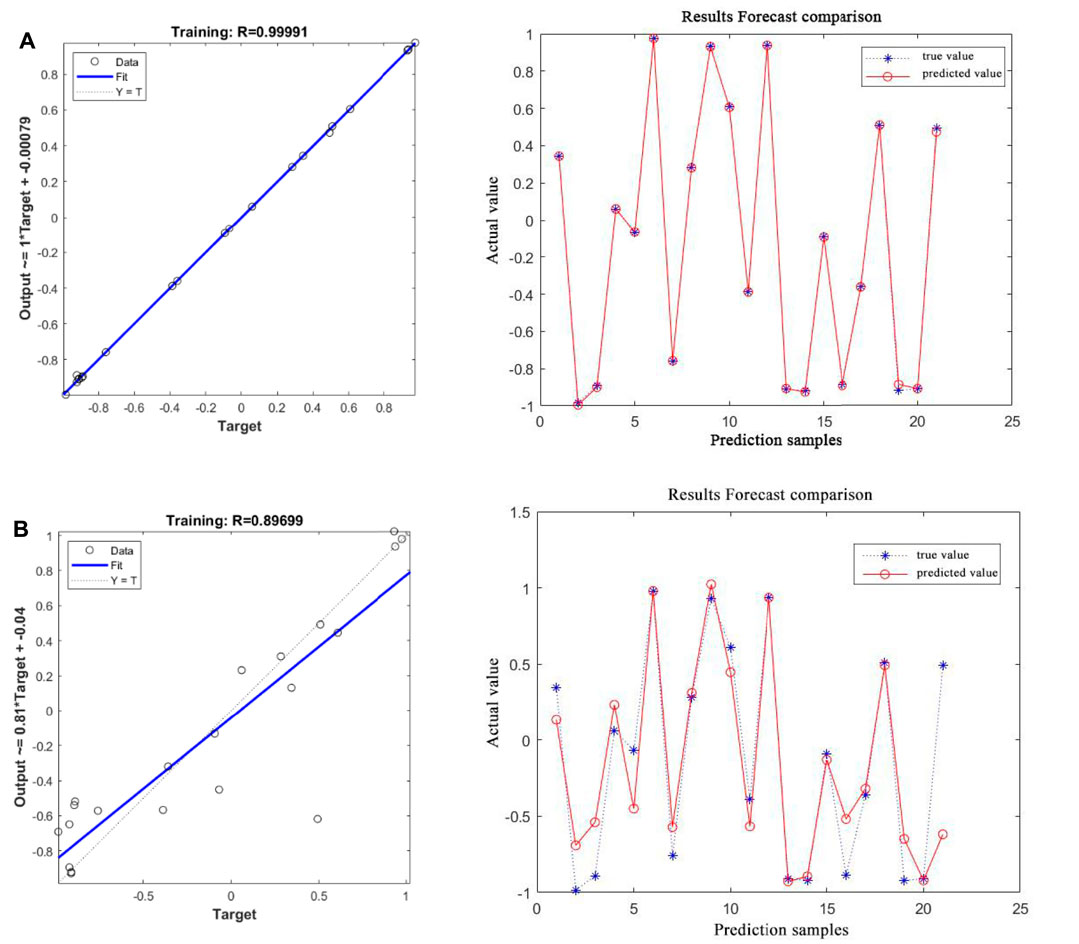
FIGURE 6. Comparison of the prediction results of precursors: (A) GWO-BP, (B) BP.
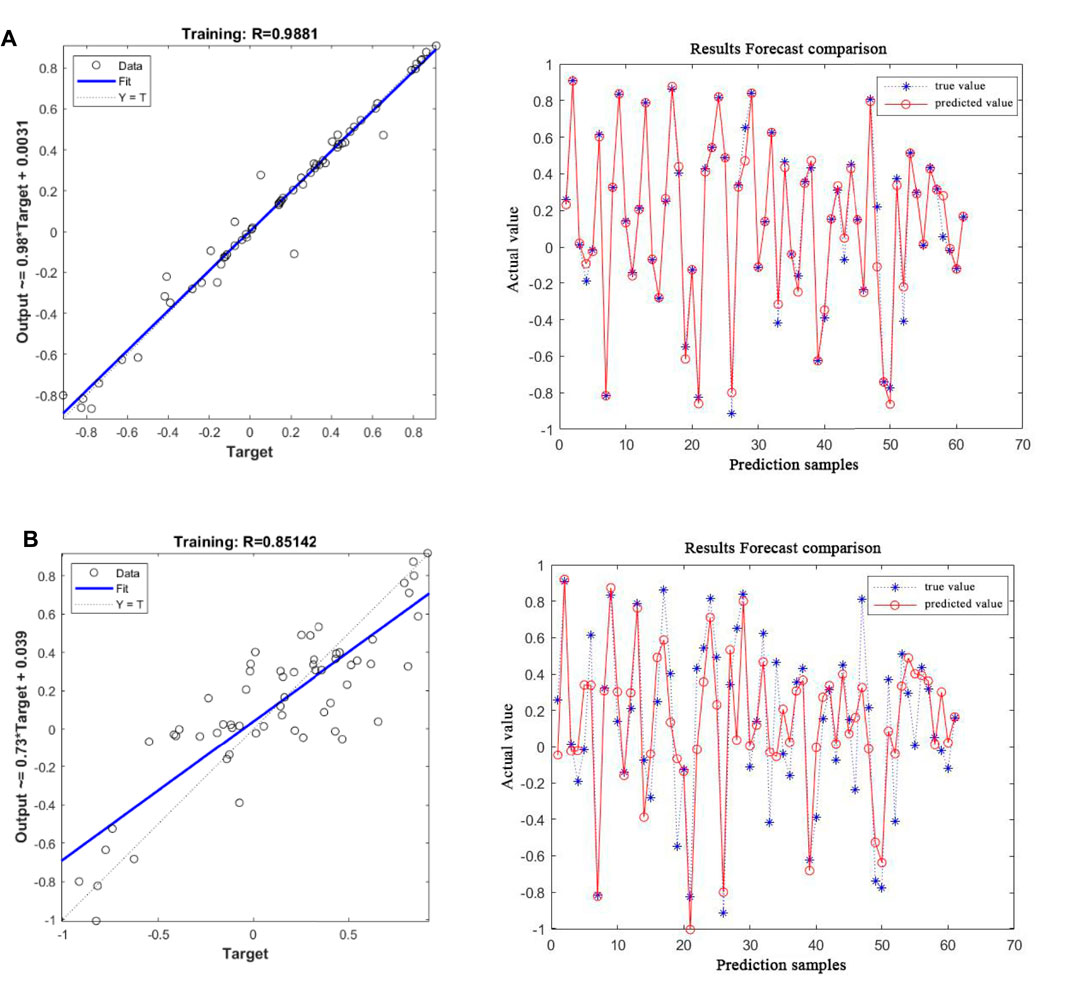
FIGURE 7. Comparison of the strength prediction results: (A) GWO-BP, (B) BP.
In this paper, TAW is used to load the freeze-thaw sandstone with different saturations, and the loading process is recorded by acoustic emission. The critical slowing down theory is used to analyze the acoustic emission signal during the loading process of sandstone. Based on GWO-BP algorithm, the precursor signal warning model of rock failure in cold region is constructed. The conclusions are as follows.
1) During the whole loading process, the acoustic emission ringing count corresponds well with the damage and failure process of sandstone, showing obvious stages. Therefore, according to the change of ringing count in the failure process of rock samples, the damage and failure process of sandstone is divided into initial compaction stage, slow growth stage, rapid growth stage and failure stage. There are many mutations in the ringing count in the rapid growth stage, so the on-site monitoring and early warning need to eliminate these false signals through improved algorithms to improve prediction accuracy.
2) The window length and lag step length have little effect on the occurrence time of the precursory characteristics of the variance, but have a great influence on the stability of the auto-correlation coefficient. Compared with the auto-correlation coefficient, the variance trend is more intuitive and the precursory points are easier to identify. Therefore, in terms of monitoring and early warning, the variance trend is more suitable as a precursory point for sandstone sample failure prediction.
3) The grey wolf algorithm is introduced to optimize the penalty factor and kernel parameters of BP neural network. An early signal warning model is constructed based on GWO-BP algorithm to warn the failure of rock failure. After data comparison, the correlation coefficient between the predicted value obtained by this model and the real value reaches 0.999 and 0.9881, and the prediction effect is excellent. Precursory signal warning model provides a new guarantee for the safety of rock engineering in cold regions.
The original contributions presented in the study are included in the article/supplementary material, further inquiries can be directed to the corresponding authors.
JJ provided the research direction and research plan of the manuscript, XZ was responsible for obtaining experimental data and writing the first draft of the article, XL was responsible for revising the first draft, YL was responsible for analyzing experimental data and drawing, and SL was responsible for developing the GWO-BP neural network.
This work was supported by the National Key Research and Development Program of China (Grant No. 2018YFC1504801), National Natural Science Foundation of China (Grant No.52079068, Grant No.52274206), and State Key Laboratory of Hydroscience and Hydraulic Engineering (Grant No. 2021-KY-04).
The authors declare that the research was conducted in the absence of any commercial or financial relationships that could be construed as a potential conflict of interest.
All claims expressed in this article are solely those of the authors and do not necessarily represent those of their affiliated organizations, or those of the publisher, the editors and the reviewers. Any product that may be evaluated in this article, or claim that may be made by its manufacturer, is not guaranteed or endorsed by the publisher.
Carpenter, S. R., Cole, J. J., Pace, M. L., Batt, R., Brock, W. A., Cline, T., et al. (2011). Early warnings of regime shifts: A whole-ecosystem experiment. Science 332 (6033), 1079–1082. doi:10.1126/science.1203672
Chai, Y., Huang, D., and Ling, Z. (2016). “A short-term traffic flow prediction method based on wavelet analysis and neural network,” in Control & Decision Conference, Yinchuan, China, 28-30 May 2016.
Dai, S., Liu, X., and Nawnit, K. (2019). Experimental study on the fracture process zone characteristics in concrete utilizing DIC and AE methods. Appl. Sci. 9 (7), 1346. doi:10.3390/app9071346
Dakos, V., Nes, E., D'Odorico, P., and Scheffer, M. (2012). Robustness of variance and autocorrelation as indicators of critical slowing down. Ecology 93 (2), 264–271. doi:10.1890/11-0889.1
Girard, L., Gruber, S., Weber, S., and Beutel, J. (2013). Environmental controls of frost cracking revealed through in situ acoustic emission measurements in steep bedrock. Geophys. Res. Lett. 40 (9), 1748–1753. doi:10.1002/grl.50384
Gupta, S., and Deep, K. (2019). “Hybrid grey wolf optimizer with mutation operator: SocProS 2017, volume 2,” in Soft computing for problem solving. Editors J. C. Bansal, K. N. Das, A. Nagar, K. Deep, and A. K. Ojha (Berlin, Germany: Springer).
Huang, Y.-H., Yang, S.-Q., Tian, W.-L., Zeng, W., and Yu, L.-Y. (2016). An experimental study on fracture mechanical behavior of rock-like materials containing two unparallel fissures under uniaxial compression. Acta Mech. Sin. 32 (03), 442–455. doi:10.1007/s10409-015-0489-3
Kock, T. D., Boone, M. A., Schryver, T. D., Stappen, J. V., Derluyn, H., Masschaele, B., et al. (2015). A pore-scale study of fracture dynamics in rock using X-ray micro-CT under ambient freeze-thaw cycling. Environ. Sci. Technol. 49 (5), 2867–2874. doi:10.1021/es505738d
Kong, L., Wang, Y., Sun, W., and Qi, J. (2020). Influence of plasticity on unfrozen water content of frozen soils as determined by nuclear magnetic resonance. Cold Regions Sci. Technol. 172, 102993. doi:10.1016/j.coldregions.2020.102993
Kong, X., Wang, E., He, X., Li, D., and Liu, Q. (2017). Time-varying multifractal of acoustic emission about coal samples subjected to uniaxial compression. Chaos Solit. Fractals 103, 571–577. doi:10.1016/j.chaos.2017.07.015
Kong, X., Wang, E., Hu, S., Li, Z., Zhan, T., Fang, B., et al. (2015). Critical slowing down on acoustic emission characteristics of coal containing methane. J. Nat. Gas Sci. Eng. 24, 156–165. doi:10.1016/j.jngse.2015.03.020
Leemput, I. A. V. D., Wichers, M., Cramer, A. O. J., Borsboom, D., Tuerlinckx, F., Kuppens, P., et al. (2013). Critical slowing down as early warning for the onset and termination of depression. Proc. Natl. Acad. Sci. U. S. A. 111, 87–92. doi:10.1073/pnas.1312114110
Lei, X., Masuda, K., Nishizawa, O., Jouniaux, L., Kusunose, K., Ma, W., et al. (2004). Detailed analysis of acoustic emission activity during catastrophic fracture of faults in rock. J. Struct. Geol. 26 (2), 247–258. doi:10.1016/s0191-8141(03)00095-6
Li, H., Shen, R., and Qiao, Y. (2021). Acoustic emission signal characteristics and its critical slowing down phenomenon during the loading process of water-bearing sandstone. J. Appl. Geophys. 194, 104458.
Liu, Q., Zhao, Y., Tang, L., Liao, J., Wang, X., Tan, T., et al. (2022). Mechanical characteristics of single cracked limestone in compression-shear fracture under hydro-mechanical coupling. Theor. Appl. Fract. Mech. 119, 103371. doi:10.1016/j.tafmec.2022.103371
Liu, X., Han, G., Wang, E., Wang, S., and Nawnit, K. (2018). Multiscale hierarchical analysis of rock mass and prediction of its mechanical and hydraulic properties. J. Rock Mech. Geotechnical Eng. 10, 694–702. doi:10.1016/j.jrmge.2018.04.003
Maturana, M. I., Meisel, C., Dell, K., Karoly, P. J., Freestone, D. R., Grayden, D. B., et al. (2020). Critical slowing down as a biomarker for seizure susceptibility. Nat. Commun. 11 (1), 2172. doi:10.1038/s41467-020-15908-3
Mirjalili, S., Mirjalili, S. M., and Lewis, A. (2014). Grey wolf optimizer. Adv. Eng. Soft. 69, 46–61.
Nes, E., and Scheffer, M. (2007). Slow recovery from perturbations as a generic indicator of a nearby catastrophic shift. Am. Nat. 169 (6), 738–747. doi:10.1086/516845
Park, J., Hyun, C. U., and Park, H. D. (2015). Changes in microstructure and physical properties of rocks caused by artificial freeze–thaw action. Bull. Eng. Geol. Environ. 74 (2), 555–565. doi:10.1007/s10064-014-0630-8
Rumelhart, D. E., Hinton, G. E., and Williams, R. J. (1986). Learning representations by back-propagating errors. Nature 323, 533–536. doi:10.1038/323533a0
Scheffer, M., Bascompte, J., Brock, W. A., Brovkin, V., Carpenter, S. R., Dakos, V., et al. (2009). Early-warning signals for critical transitions. Nature 461 (7260), 53–59. doi:10.1038/nature08227
Scheffer, M. (2009). Critical transitions in nature and society. New Jersey, United States: Princeton University Press.
Tan, X., Chen, W., Liu, H., Wang, L., Ma, W., and Chan, A. (2018). A unified model for frost heave pressure in the rock with a penny-shaped fracture during freezing. Cold Regions Sci. Technol. 153, 1–9. doi:10.1016/j.coldregions.2018.04.016
Wei, Y., Li, Z., and Kong, X. (2018). The precursory information of acoustic emission during sandstone loading based on critical slowing down theory. J. Geophys. Eng. 15 (5), 2150–2158.
Xia, Y., Liu, B., Zhang, C., Liu, N., Zhou, H., Chen, J., et al. (2022). Investigations of mechanical and failure properties of 3D printed columnar jointed rock mass under true triaxial compression with one free face. Geomech. Geophys. Geo. Energy. Ge. Resour. 8 (1), 26–24. doi:10.1007/s40948-021-00331-9
Xie, S., Lin, H., Wang, Y., Chen, Y., Xiong, W., Zhao, Y., et al. (2020). A statistical damage constitutive model considering whole joint shear deformation. Int. J. Damage Mech. 29 (6), 988–1008. doi:10.1177/1056789519900778
Zhang, J., Deng, H., Taheri, A., Ke, B., and Liu, C. (2019). Deterioration and strain energy development of sandstones under quasi-static and dynamic loading after freeze-thaw cycles. Cold Regions Sci. Technol. 160, 252–264. doi:10.1016/j.coldregions.2019.01.007
Zhang, S., and Zhou, Y. (2015). Grey wolf optimizer based on powell local optimization method for clustering analysis. Discrete Dyn. Nat. Soc. 2015, 1–17. doi:10.1155/2015/481360
Zhao, Y., Liu, Q., Zhang, C., Liao, J., Lin, H., and Wang, Y. (2021). Coupled seepage-damage effect in fractured rock masses: Model development and a case study. Int. J. Rock Mech. Min. Sci. 144, 104822. doi:10.1016/j.ijrmms.2021.104822
Keywords: freeze-thaw cycle, acoustic emission, critical slowdown, precursors, GWO-BP neural network
Citation: Jin J, Zhang X, Liu X, Li Y and Li S (2023) Study on critical slowdown characteristics and early warning model of damage evolution of sandstone under freeze–thaw cycles. Front. Earth Sci. 10:1006642. doi: 10.3389/feart.2022.1006642
Received: 29 July 2022; Accepted: 30 September 2022;
Published: 10 January 2023.
Edited by:
Fengqiang Gong, Southeast University, ChinaReviewed by:
Yanlin Zhao, Hunan University of Science and Technology, ChinaCopyright © 2023 Jin, Zhang, Liu, Li and Li. This is an open-access article distributed under the terms of the Creative Commons Attribution License (CC BY). The use, distribution or reproduction in other forums is permitted, provided the original author(s) and the copyright owner(s) are credited and that the original publication in this journal is cited, in accordance with accepted academic practice. No use, distribution or reproduction is permitted which does not comply with these terms.
*Correspondence: Xiaoli Liu, eGlhb2xpLmxpdUB0c2luZ2h1YS5lZHUuY24=; Xinlei Zhang, NDcyMTIwNjM4QHN0dS5sbnR1LmVkdS5jbg==
Disclaimer: All claims expressed in this article are solely those of the authors and do not necessarily represent those of their affiliated organizations, or those of the publisher, the editors and the reviewers. Any product that may be evaluated in this article or claim that may be made by its manufacturer is not guaranteed or endorsed by the publisher.
Research integrity at Frontiers
Learn more about the work of our research integrity team to safeguard the quality of each article we publish.