 Ma Qianrong
 Jia Fang
 Wu Xiaoxue3
 Zhi Rong
 Feng Guoling
95% of researchers rate our articles as excellent or good
Learn more about the work of our research integrity team to safeguard the quality of each article we publish.
Find out more
ORIGINAL RESEARCH article
Front. Earth Sci. , 21 September 2022
Sec. Atmospheric Science
Volume 10 - 2022 | https://doi.org/10.3389/feart.2022.1004612
This article is part of the Research Topic Extreme Climate Events: Variability, Mechanisms, and Numerical Simulations View all 17 articles
The persistent heavy precipitation that occurred in most of West China (WC) during August 11–18, 2020, generated the highest rainfall record since recording began in 1961 and was selected as one of the top 10 worst national natural disasters of 2020 in China. Favorable circulation was sustained during August; WC was positioned between two anomalous high-pressure centers over the Tibetan Plateau and Sea of Japan and an anomalous low-pressure center over Mongolia located on its north side, which created a stable and long trough and formed a low-pressure center over WC. At 200 hPa, the subtropical westerly jet was much stronger than average and southward, and the South Asian High (SAH) was strong and extended eastward to 150°E. At 500 hPa, the western Pacific subtropical high (WPSH) was westward and exceptionally strong, which helped abundant water vapor reach the southeastern part of WC and provided favorable dynamic and thermodynamic conditions for precipitation in this region. In addition, the eastward extension of the SAH promotes the westward extension of WPSH, which collectively enhanced the precipitation in WC. At 850 hPa, the low-level jet corresponding to the west-extending subtropical high from the Sea of Japan to WC further enhanced and guided the water vapor transport to WC. In addition, the Mei-Yu front over the Yangtze River Basin in June and July strengthened the northwestward spread of diabatic heating, transient energy, and wave activity fluxes, which likely influenced the large-scale circulation factors and reinforced the precipitation in WC in August 2020.
The WC mainly refers to the areas 28°N–36°N and 100°E–108°E and exhibits complex terrain, including plateaus, basins, plains, and hills (shown in Figure 1). Precipitation in WC has two predominant peaks, with the highest precipitation in summer and the second in autumn (Wei et al., 2018a; Zhou et al., 2021). The autumn precipitation in WC is regarded as the last rain belt associated with the retreat of the East Asian summer monsoon (Ding and Wang 2008; Han et al., 2018). Therefore, the variability in autumn precipitation in WC is a major concern for the scientific community (Gao and Guo 1958; Zhang et al., 2019; Zhou et al., 2021). However, under the combination of the Indian, East Asian, and Tibetan Plateau monsoons, abundant summer precipitation in WC (Zhu and Yu 2003; Wang et al., 2016; Xu et al., 2021) is prone to trigger various geological disasters, such as landslides and debris flows, which seriously affect human life and cause large economic losses (Nie and Sun 2022). A more in-depth understanding of precipitation during different seasons in WC has practical application value for improving the accuracy of climate predictions and disaster prevention.
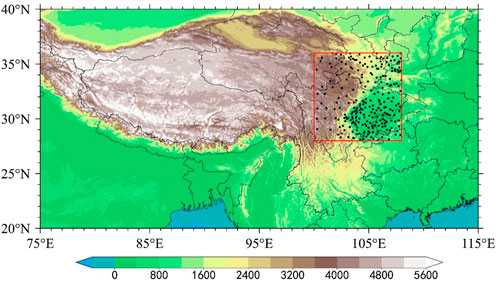
FIGURE1. Spatial distribution of the 250 meteorological stations (Dots) in western China and the geographical features (Unit: m).
Because of global warming since the second half of the 20th century, precipitation and precipitation extremes have exhibited significant changes and have been detected worldwide (Alexander et al., 2006; Stocker et al., 2014; Zhan et al., 2020). China has frequently experienced severe droughts and heavy floods. In particular, numerous studies on summer precipitation changes in China have detected interdecadal variations since the late 1970s (Wang et al., 2017, Ma et al., 2021). The annual precipitation has increased significantly in southeast, northeast, and western China and decreased from southwest China to northeast Inner Mongolia during the past decades (Shang et al., 2019). Autumn precipitation and rainy days in WC exhibited a significant reduction before the 1990s and increased after the 2000s (Yuan and Liu 2013; Wang et al., 2015; Wei et al., 2018), but the precipitation intensity has been enhanced (Wang et al., 2015; Zhang et al., 2019). Summer precipitation had decreased along a geographical band from the western Sichuan Basin to the southeastern part of Gansu Province, with an increasing trend found in the western Tibetan Plateau, eastern Sichuan Basin, and southwestern Shaanxi Province (Lu et al., 2014; Han et al., 2016; Wang et al., 2016; Jia et al., 2018; Shang et al., 2019). Lai et al. (2010) determined that summer precipitation intensity had increased and led to more floods and landslides. Because summer precipitation in WC has a substantial impact on agricultural production and disaster prevention, a better understanding of precipitation variability is critical for the development of the social economy.
Numerous studies have focused on the physical mechanism of precipitation variability in WC. Anomalous large-scale atmospheric circulation has also been emphasized. The variations in precipitation in WC were closely related to the western Pacific subtropical high (WPSH). When the WPSH extends westward and intensifies, warm and wet air from the south can be effectively delivered to WC, leading to increased precipitation (Zhu and Yu 2003; Wang et al., 2016; Zhou et al., 2019; Zhou and Wang 2019). Notably, the SAH also has a considerable impact on precipitation in WC. Chen et al. (2016) reported a significant positive correlation between summer water vapor content in southwest China and the SAH intensity index, area index, and eastward extension index. The abnormally strong SAH is conducive to water vapor transport from the South China Sea to the eastern Sichuan Basin; when accompanied by the upward movement from a low to a high level, precipitation is significantly enhanced (Chen et al., 2016). In addition, the position of the SAH has a significant influence on the regionality of precipitation in WC. When the SAH extended eastward and northward, more precipitation occurred in the western Sichuan Basin and reversed in the east (Wang et al., 2016). Numerous previous studies have shown that variations in precipitation in the WC are closely related to the East Asian jet stream (EAJS). The increase in sea surface temperature in the central equatorial Pacific had caused a southward shift of the EAJS, resulting in abnormal descending branches and less autumn precipitation in WC (Wei et al., 2018). In contrast, when the EAJS was strengthened and extended northward, precipitation increased in this region (Wang and Zhou 2019; Zhou et al., 2019; Zhou and Wang 2019). The strengthening of the WPSH and northward displacement of the EAJS have contributed to the enhancement of water vapor transport from the Bay of Bengal, South China Sea, and western Pacific, which enhances the precipitation in WC (Wei et al., 2018; Zhou et al., 2019).
In most areas of China, precipitation mainly occurs in the summer, among which the most typical is the Mei-Yu front in the Yangtze–Huai River Basin. An extreme Mei-Yu front in 2020 was sustained for approximately 62 days from June 1 to August 1. Precipitation anomalies have led to serious flooding in these areas (Zhao et al., 2021). During the Mei-Yu period, the periodic strengthening of the EAJS and SAH ridgeline moved northward and stabilized around 37°N–40°N and 26°N–28°N, which resulted in strong divergence in the upper troposphere, contributing to the upward movement and precipitation in most of southern China (Ding et al., 2021). The “two ridges and one trough” type existed in the middle and high latitudes of Eurasia at 500 hPa, and the WPSH was abnormally strong, westward, and continuous (Qiao et al., 2021). Meanwhile, the Northwest Pacific Anticyclone (WNPAC) at 850 hPa in the lower troposphere was also abnormally enhanced and directly affected the water vapor transport conditions in most of southern China (Zhao et al., 2021). Crucially, extremely heavy rainfall occurred in WC during August 2020, which has been regarded as one of the top 10 worst national natural disasters in China in 2020 (http://www.mem.gov.cn/xw/yjglbgzdt/202101/t20210102_376288.shtml). Waterlogging, landslides, and other disasters caused by heavy rain result in heavy losses and threats to human lives and property (Chen et al., 2022; Tang et al., 2022). Therefore, this study investigated the underlying relationship between the anomalous August precipitation in WC and the associated circulations in 2020.
The remainder of this paper is organized as follows. Section 2 introduces the data and methods used in this study. The spatiotemporal variations in the August 2020 precipitation over WC and the associated mechanisms are presented in Section 3. Finally, the conclusions and discussion are presented in Section 4.
The daily observed precipitation data were obtained from the National Meteorological Information Center of the China Meteorological Administration, covering 2020 meteorological stations throughout China from 1961 to 2021. Because of the errors caused by missing data, only stations missing less than 5% of the total time series were retained, and the missing data from these retained stations were estimated using the inverse distance method (Eischeid et al., 2000). Finally, 250 stations in WC (shown in Figure 1) were chosen for this study.
The monthly and daily reanalysis data of ERA5 from 1961 to 2021 were provided by the European Center for Medium-Range Weather Forecasting (ECMWF), including potential height, temperature, zonal wind, meridional wind, vertical velocity, and specific humidity. The horizontal resolution was 1.0° × 1.0°, and the vertical layer was 1,000–1 hPa with 37 layers. In addition, the ERA5 dataset from July to August 2020 were used in this study.
The vertically integrated water vapor transport flux (WVT) was calculated from 1,000 to 300 hPa using the method proposed by Trenberth (1991). The wave activity flux (WAF) defined by Takaya and Nakamura (2001) was used to study the propagation of the Rossby wave train. The formula used is as follows:
where
where
The apparent heat source (
where
To verify the synoptic-scale transient waves, uʹ and vʹ were obtained by the 2.5–6-day bandpass filtering technique at 200 hPa because of the transient wave activity major concentration in the upper troposphere (Chen et al., 2012). The transient disturbance kinetic energy kʹ is defined as:
The Hybrid Single Particle Lagrange Integrated Trajectory (HYSPLIT) model was developed jointly by NOAA’s Air Resources Laboratory and the Australian Bureau of Meteorology, and is widely used in tracking particles, moisture, or gas sources and transmission. In this study, HPSPLIT4.9 was used to capture the direction and proportion of water vapor.
To quantitatively depict the variability in the WPSH and SAH, the WPSH intensity index and SAH intensity index were calculated using traditional methods. Related methods were introduced by the National Climate Center of the China Meteorological Administration (http://cmdp.ncc-cma.net, in Chinese). The range of the 5,880-gpm contour at 500 hPa and the 12,500-gpm contour at 200 hPa were used to describe the WPSH and SAH, respectively.
Figure 2 shows the spatial distribution and the corresponding station-averaged time series of August precipitation during 1961–2021 in WC to understand the characteristics and causes of the extraordinary precipitation. The spatial patterns of the precipitation increased from the northwest to the southeast (Figure 2A). High values were located in the Sichuan Basin, and low values occurred in high-elevation areas, which spanned 50–450 mm. The precipitation in WC exhibited an indistinctive increasing trend during 1961–2021 (Figure 2B). Notably, the precipitation in August 2020 was more than twice that of the previous record. After removing the value for 2020, precipitation in this region showed a slightly decreasing trend.
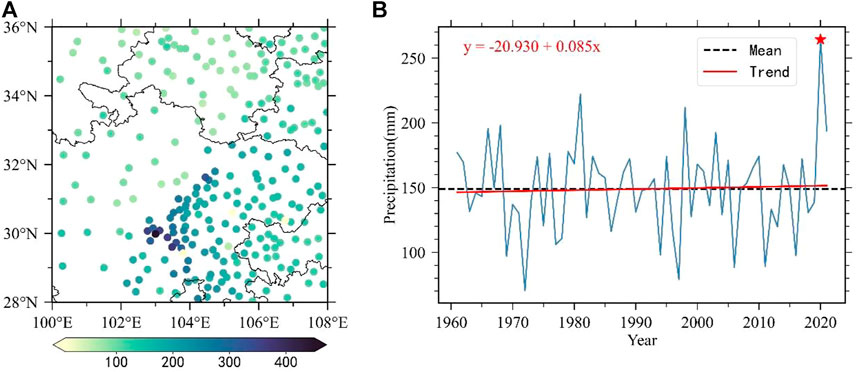
FIGURE 2. Spatial distribution of the climatology (A) precipitation distribution and (B) the station-averaged precipitation series in August during 1961–2021 in WC (Dashed black line and the red solid line represent the climatological mean and linear trend, respectively. Unit: mm).
The spatial distribution of the precipitation in August 2020 (Figure 3A) varied from the climatology mean (Figure 2A), which exhibited a heavy precipitation belt in middle WC along 104°E–105°E and relatively lower precipitation in western and eastern WC. The precipitation anomaly percentage further confirmed that extraordinary precipitation occurred in middle WC (Figure 3B). The precipitation at 161 stations exceeded the historical average and were primarily scattered in the western Sichuan Basin, southeast Gansu, and southwest Shaanxi. The precipitation at 44 stations in Sichuan Province has been recorded since 1961. In addition, persistent heavy precipitation occurred in WC during August 11–18, 2020 (Figures 3C,D), which was defined as one of China’s top ten national natural disasters in 2020 (http://www.mem.gov.cn/xw/yjglbgzdt/202101/t20210102_376288.shtml). Chen et al. (2022) reported that this extraordinary precipitation caused waterlogging and mudslide disasters that affected 8.523 million people and caused 58 deaths. In addition, there were two consecutive heavy precipitation processes in late August 2020: from August 23 to 24 and from August 30 to 31. Therefore, it is of great significance to analyze the characteristics of the record-breaking precipitation that occurred in WC in August 2020.
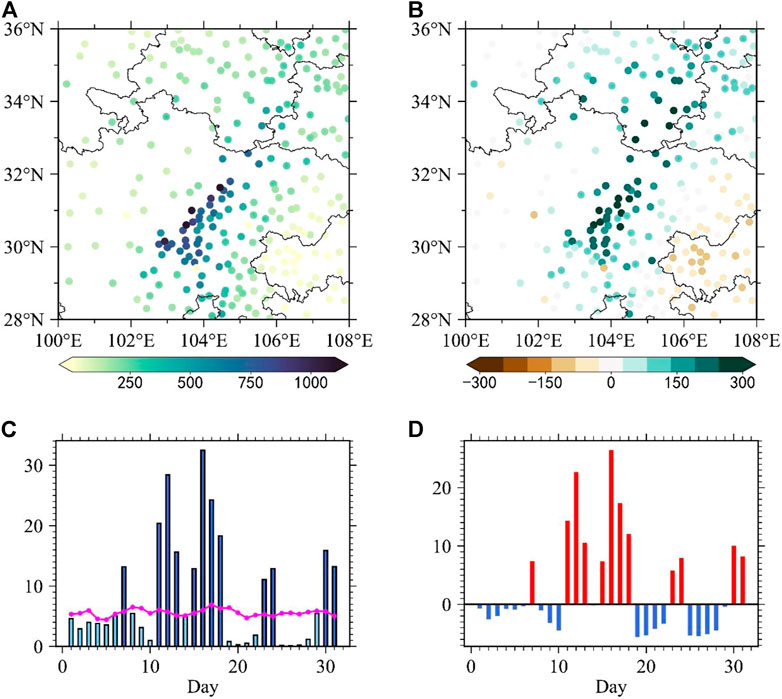
FIGURE 3. Spatial distribution of (A) precipitation (Unit: mm) and (B) precipitation anomaly percentage (Unit: %) in August 2020 in WC. (C) and (D) show the daily precipitation and precipitation anomalies (Unit: mm) in August 2020 in WC (Dark blue histogram and red line in (C) represent precipitation exceeding the August 2020 average and climatological daily mean precipitation in August during 1961–2021, respectively).
Atmospheric circulation anomalies can directly cause precipitation anomalies. Thus, this section analyzes the circulation characteristics associated with the August 2020 precipitation anomaly in WC. The variable responses to the local anomalous atmospheric circulation for this extraordinary precipitation event are shown in Figure 4. The zonal wind at 200 hPa over East Asia to the Western Pacific (50°E–180°E, 30°N–40°N) was strong and southward, and the subtropical westerly upper-level jet was strong and southward. The maximum jet centers were located near (50°E–80°E, 30°N–40°N) and (150°E, 50°N). The WC was located south of the jet stream axis (50°E–80°E, 30°N–40°N). The jet stream and SAH were significantly stronger than normal in August 2020 (Figure 4A). In the middle troposphere, the WPSH was predominantly westward and stronger than usual (Figure 4B), which caused the southwest airflow on the southwest side of the WPSH northwestward, reaching the southern part of the WC and providing abundant water vapor for precipitation in this region. Meanwhile, in the middle latitudes of 500 hPa, anomalous low pressure and two high-pressure centers were observed over Mongolia, the Tibetan Plateau, and the Sea of Japan, respectively. WC was located in the middle of the two high-pressure centers and was affected by the low-pressure center. The abnormal low pressure over Mongolia was beneficial for the cold air transported southward, which finally mingled with warm and wet air in WC, forming substantial and persistent precipitation. At 850 hPa (Figure 4C), a south low-level jet corresponding to the west-extending subtropical high from the western Pacific Ocean to the eastern part of WC provided abundant water vapor conditions for precipitation. At the same time, strong divergence at the upper level and strong convergence at the lower level over WC combined with deep and strong vertical movement from the lower level to the upper level (Figure 4D) provided adequate dynamic conditions for precipitation.
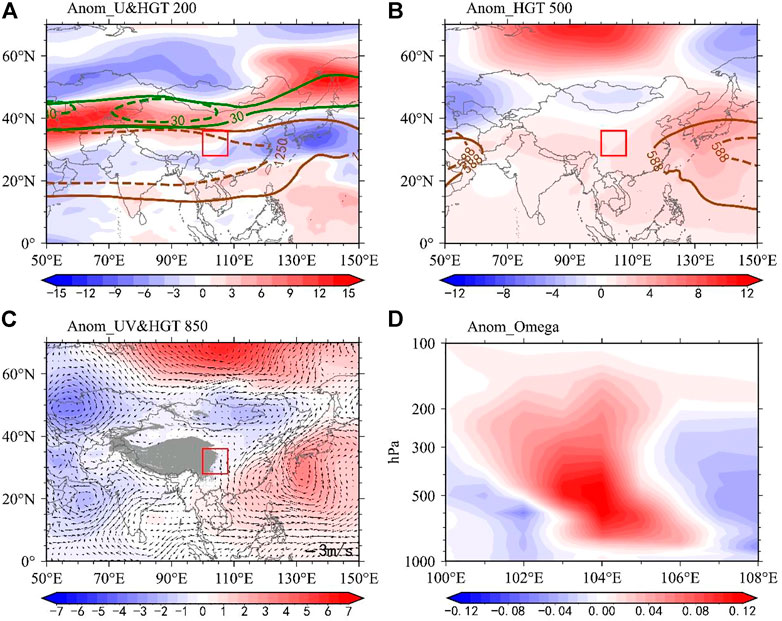
FIGURE 4. Characteristics of the anomalous atmospheric circulation in August 2020: (A) 200 hPa zonal wind anomaly (shading, Units: m·s−1; the dashed and solid green lines represent the 30 m·s−1 isoline in the climatological mean and August 2020; the dashed and solid brown lines are the same as the green lines but for the 12,500 isolines at 200 hPa); (B) 500 hPa geopotential height anomaly (shading, Units: gpm; the dashed and solid brown lines are the 5,880 isolines in the climatological mean and August 2020); (C) 850 hPa geopotential height (shading, Units: gpm) and wind field anomalies (vectors, Units: m s−1); (D) regional averaged vertical velocity anomalous height-longitude profile (Units: 10–1 Pa·s−1). The red rectangular frame in (A–C) shows the location of WC, and the shaded gray areas in (C) exhibit the 850 hPa terrain.
In conclusion, the characteristics of the atmospheric circulation fields in August 2020 were favorable for sustained heavy precipitation in WC. At 200 hPa, the westerly jet stream was strong and was located just north of WC. The strong divergence at the upper level corresponded to a strengthened SAH and discernable convergence at the lower level. The above coupling effect further strengthened the south wind, convergence at the lower level, and vertical movement, which formed a positive feedback loop to maintain the precipitation process. Moreover, the WPSH was significantly westerly, so the warm and wet moisture from the southwest side of the WPSH could reach the WC.
In addition to the dynamic conditions provided by favorable circulation, persistent precipitation also requires continuous water vapor transport. Figure 5 compares the climatological mean and August 2020 water vapor transport characteristics over WC. In Figure 5A, the westward water vapor from the western Pacific Ocean and the eastward water vapor transport from the Arabian Sea in the Indian Ocean and Bay of Bengal are the main moisture sources for August precipitation in WC. The water vapor converged predominantly in eastern and southern WC, which provided favorable conditions for precipitation in this region (Figure 2A). Obtained by the clustered daily backward track of water vapor in August from 1979 to 2020, Figure 5C shows the track 5 channels which were based on the increase in the growth rate of spatial variance. Water vapor primarily comes from the western Pacific Ocean, the Arabian Sea, and the Bay of Bengal in the Indian Ocean, and is partially transported by westerlies.
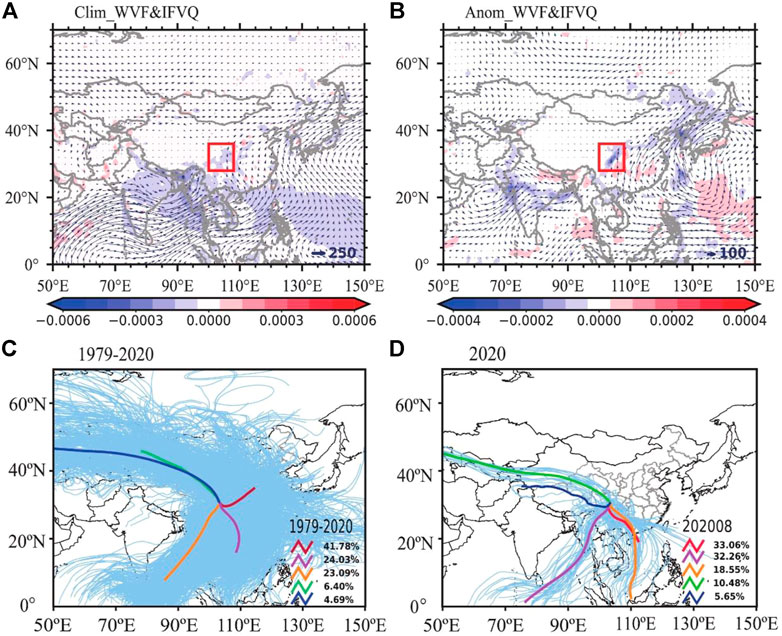
FIGURE 5. (A) August WVT (vectors, Units: kg·m−1 s−1) and its divergence (shading, Units: kg·m−2 s−1) during 1961–2020, (B) WVT (vectors, Units: kg·m−1 s−1) and its divergence (shading, Units: kg·m−2 s−1) in August 2020. The contribution rates of water vapor transport to WC (C) during 1979–2020 and (D) in August 2020.
In August 2020, the water vapor from the western Pacific Ocean was significantly stronger as the strengthened WNPAC provided more moisture from the South China Sea (Figure 5B). Meanwhile, the water vapor formed a narrow convergence zone in WC, which corresponds to the characteristics of heavy precipitation in Figure 3A. The first five water vapor track channels for August 2020 (Figure 5D) demonstrate that the main water vapor transported by the WNPAC was southwesterly. The water vapor transport from the southern part of the WNPAC was more westerly than usual and turned northeast near Hainan Island, continuously conveying water vapor to southern WC and forming a distinct water vapor convergence zone. The above results demonstrate that the strengthened southern water vapor transport contributed to the specific humidity, which was slightly higher than the climatology mean. In addition, the strong convergence zone of water vapor and circulation provided favorable conditions for continuous heavy precipitation.
During the rainfall period in WC, the intensity and position of key influential systems, such as the SAH and WPSH, have a significant impact on the rainfall intensity (Chen et al., 2022). In August 2020, the SAH significantly extended and strengthened eastward (Figure 4A). Thus, the standardized SAH intensity index is discussed first. As shown in Figures 6A,B, the SAH intensity in August reached a peak in 2020. The SAH intensity anomaly from July to August 2020 indicates that the SAH was the strongest in mid-August 2020, corresponding to the occurrence of heavy precipitation (Figure 3C). Moreover, the correlation coefficient between precipitation and the SAH intensity index in August 2020 reached 0.42 (significant at a confidence level of 0.05, Table 1). The results indicate that the anomalous SAH in August corresponds well with extreme precipitation in WC. As shown in Figure 6C, the intensity of the August WPSH exhibited a second peak in 2020. The WPSH intensity from June to August in 2020 was anomalously strong, especially in mid-August (Figure 6D). The correlation coefficient between precipitation and the WPSH intensity index in August 2020 reached 0.32 (significant at a 0.1 confidence level, Table 1). Moreover, the WPSH western ridge point extended westward, and the WPSH ridge line was more northerly than the climatological average (Figures 6E,G). In mid-August 2020, the WPSH anomalously moved westward and northward (Figures 6H). In addition, the intensification and abnormal eastward extension of the SAH influenced the precipitation accompanied with the strengthened and westward extended WPSH.
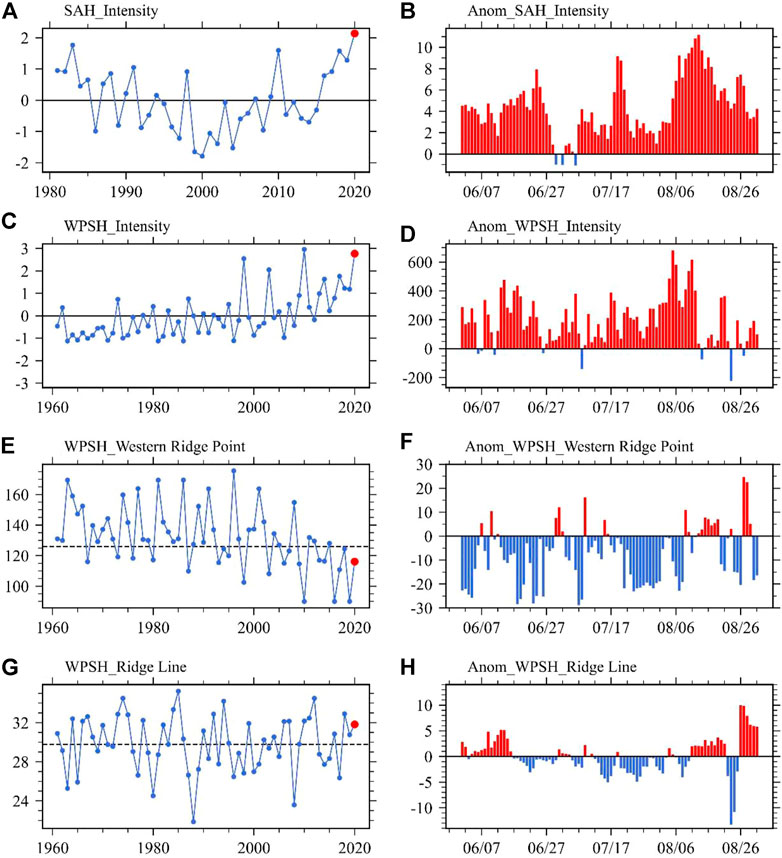
FIGURE 6. The WPSH intensity index, SAH intensity index, WPSH western ridge point index, and ridge line index in August during 1961–2020 (A,C,E,G) and anomalies in June–August 2020 (B,D,F,H) (The dotted lines in (A,C,E,G) represent the climatological average in August during 1961–2020).
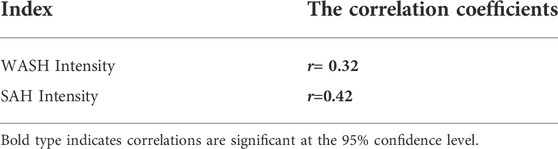
TABLE 1. The correlations between the WPSH intensity index, SAH intensity index, WPSH western ridge point index, and ridge line index with precipitation anomaly in August 2020 over WC.
Therefore, the significant strengthening of the SAH and WPSH provided a stable circulation structure for this heavy precipitation. In the lower troposphere, the strong WPSH transported water vapor from the Pacific to the west, together with water vapor from the South China Sea, and then to WC along the western boundary of the WPSH. Combined with the topography of the Tibetan Plateau, abundant water vapor formed a narrow water vapor convergent belt over the WC.
Figure 7 shows the time-latitude and time-longitude profiles of the precipitation, disturbance kinetic energy, and diabatic heating. The daily distribution of precipitation in WC from July to August 2020 indicated that heavy precipitation occurred frequently and persistently in WC in mid-August (Figures 7A,B). The precipitation in July was significantly higher in the Yangtze River Basin than normal, which is related to the 2020 super Mei-Yu in June and July (Zhao et al., 2021). From July to August, the precipitation moved westward and northward from the Yangtze River Basin to WC. Relevantly, there are two significant disturbance kinetic energy paths: 110–120°E, which corresponded to the extreme Mei-Yu in the Yangtze River in July 2020, and 100–110°E, which was related to the heavy precipitation in WC in August 2020 (Figures 7C,D). Disturbance kinetic energy can strengthen the precipitation by influencing the intense convection (Para et al., 2019). In addition, the energy conversion from synoptic-scale disturbance to low-frequency fluctuation in the middle and lower troposphere has been significantly enhanced, which makes importation contributions to this heavy precipitation (Li 2007). From August 10 to 20, 2020, it can be clearly seen from Figures 7C,D that a large center of kinetic energy disturbance reached WC, which was beneficial for the transport of water vapor and the occurrence of this continuous extreme precipitation. In addition, the characteristics of diabatic heating were used to analyze the possible effects of atmospheric circulation on the continuous heavy precipitation process in WC in mid-August 2020 (Figures 7E,F). The evolution characteristics of diabatic heating differed from July to August, and stronger diabatic heating corresponded to continuous heavy precipitation in the Yangtze River Basin in July 2020 and in WC in mid-August 2020.
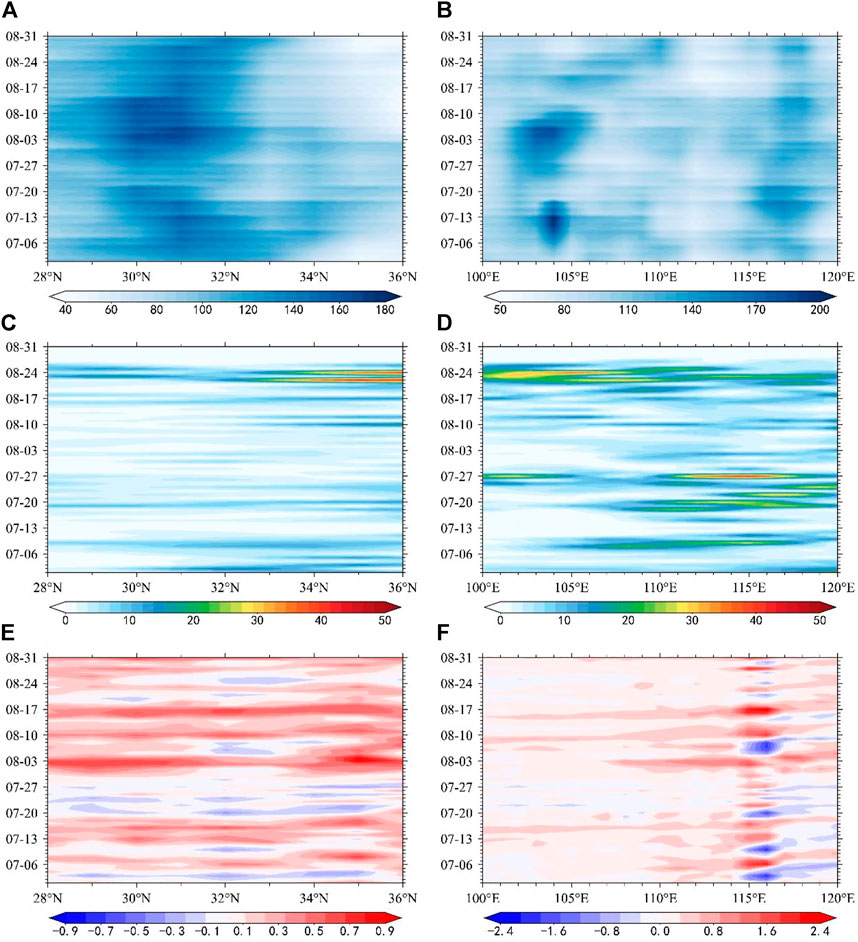
FIGURE 7. Latitude–time and longitude–time evolution of precipitation (A), (B) (Units: mm); the transient disturbance kinetic energy k
Abnormal circulation patterns control the intensity and location of persistent heavy precipitation and thus determine the evolution characteristics of the abnormal heating energy. Abnormal heating energy also has a feedback effect on atmospheric circulation (He and Zhai 2018). Figure 8 shows the WAF propagation during July and August 2020, which varied widely between the 2 months. There was a quasi-zonal “ + - + -”wave train over the Eurasian continent over 30°N–50°N in July 2020 (Figure 8A). The wave flux propagated from west to east along the jet stream and affected the super Mei-Yu over the Yangtze River Basin. In August, quasi-stationary Rossby wave energy dispersed northward at 26°N–28°N and propagated from south to north. In conclusion, the continuous heavy precipitation in WC in mid-August 2020 was influenced by the maintenance of low-frequency atmospheric circulation and the diabatic heating caused by the precipitation. The abnormal atmospheric circulation, such as the abnormal SAH and WPSH, played a key role in the occurrence, maintenance, and extinction of this heavy precipitation. The released latent heat by the heavy precipitation process has positive feedbacks and partially strengthens the intensity and duration of precipitation (Hack et al., 1989; Rao and Srinivasan., 2016).
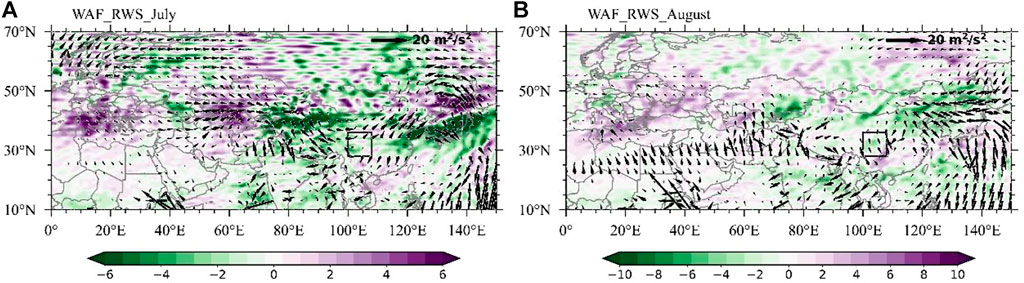
FIGURE 8. The WAF (vectors; unit: m2·s−2) and Rossby wave source (shading; units: 10−10 m2·s−1) at 200 hPa in July (A) and August (B) 2020.
In summary, persistent heavy precipitation events have significant societal impacts. The persistent heavy precipitation event that occurred over WC in August 2020 broke the historical record since monitoring began in 1961. In addition, the widespread and devastating floods over most regions of WC are considered to be within the top 10 worst national natural disasters in China in 2020. In the present work, we aimed to understand extreme rainfall from large-scale circulation, and Figure 9 provides a schematic diagram of this heavy precipitation event.
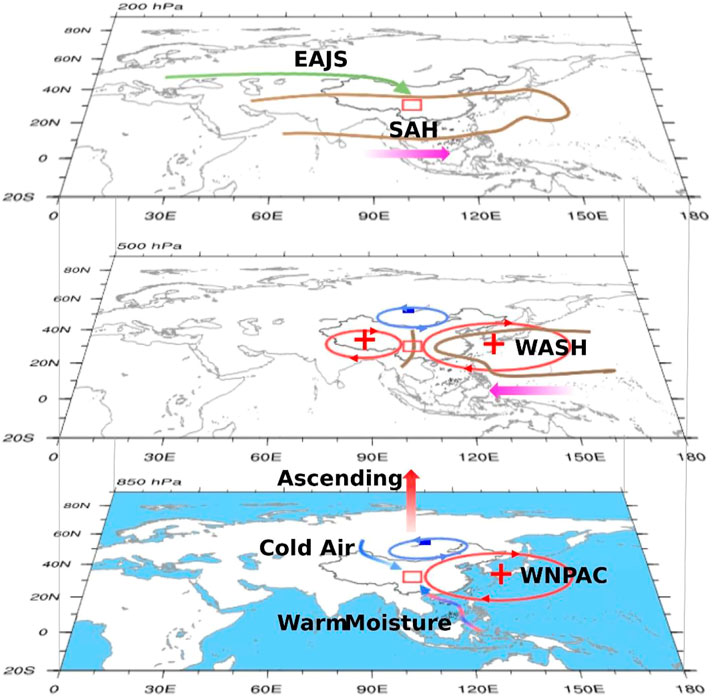
FIGURE 9. Schematic diagram describing what drives the anomalous strong precipitation over WC in August 2020.
The precipitation in WC in August 2020 set the historical record since monitoring began in 1961. The precipitation at 44 stations throughout WC, primarily distributed in Sichuan Province, set a historical record by reaching 34.99 mm. Persistent heavy precipitation occurred in WC, mostly concentrated during the period of August 10–20, 2020. Favorable circulation was sustained in August. At 200 hPa, the subtropical westerly jet was much stronger than normal and southward, and the maximum centers were located near 50°E–100°E and 130°E–150°E. The SAH was eastward and strong, and its intensity was significantly correlated with precipitation in WC. At 500 hPa, the WPSH was westward and strong, which helped abundant water vapor reach the southeastern part of the WC to provide favorable dynamic conditions for precipitation in this region. Chen et al. (2016) emphasized that the Mei-Yu rain band over the Yangtze–Huai River basin through its effect on water vapor transport, which indicates the anomalies precipitation in WC in August 2020 may influenced by the strong and persistent anomalous circulation of super Mei-Yu in 2020. At the same time, WC was positioned between two anomalous anticyclone centers over the Tibetan Plateau and Sea of Japan, with an anomalous cyclone over Mongolia located to the north that created a stable, long trough and formed a low-pressure center over WC. At 850 hPa, there was a low-level jet corresponding to the west-extending subtropical high from the Sea of Japan to WC. The anomalous low-level southerly jet enhanced and guided more water vapor transport to WC.
Studies show that the effect of tropical Indian Ocean SST plays a significant role in SAH and WPSH (Ding and Wang 2008; Huang et al., 2011). The standardized SAH intensity index and WPSH intensity index during the precipitation period ranked first in 1981 and second in 1961, respectively. The stronger SAH enhanced the upward movement over WC and strengthened the convergence of the water vapor. A strong WPSH strengthened the water vapor from the South China Sea and the Western Pacific into WC. Both provided sufficient dynamic and thermodynamic conditions for heavy precipitation. The occurrence and persistence of the super Mei-Yu in June and July 2020 are mainly due to the strengthening and westward expansion of the WPSH, a positive-phase Pacific–Japan (PJ) pattern and a mid-troposphere “two ridge–one trough” pattern over Asia (Qiao et al., 2021). In addition, the development of La Niña sustained the large-scale circulation, which leaded to the continuous development of the super Mei-Yu. The development and maintenance of large-scale circulation during Mei-Yu period played a positive role in the extreme precipitation in August over WC. The diabatic heating, transient energy, and wave activity fluxes generated by ultra-strong Mei-Yu may affect the precipitation of large-scale circulation factors and WC. Here is a possibility of the influence of Mei-Yu on the extreme precipitation in WC. The specific influencing mechanism needs to be further studied. In addition, the SST warming anomalies over the Tropical Indian Ocean enriched and extended the super Mei-Yu in the Yangtze river basin in 2020 (Qiao et al., 2021; Zhou et al., 2021). The warming of the Indian Ocean SST also plays an important role in the extreme precipitation in August 2020 over WC, which needs further study.
This study represents a persistent heavy precipitation event in WC that occurred in August 2020. Several avenues for future work exist to understand these extreme precipitation events. We remain unsure of the exact drivers of 10-day persistent heavy precipitation, such as MCSs and synoptic isotropic ascent (Schumacher and Johnson 2004). The occurrence probability of events with an intensity exceeding that of the event of August 10–20 and whether it will increase with global warming in the future requires further investigation.
The original contributions presented in the study are included in the article/supplementary material, further inquiries can be directed to the corresponding authors.
QM and RZ conceived of the presented idea. QM and FJ developed the theory and performed the computations. XW and YC verified the analytical methods. GF encouraged to investigate and supervised the findings of this work.
This work was supported by the National Natural Science Foundation of China (Grant 41975088 and 42205023).
The station observed dataset is provided by the National Meteorological Information Center (NMIC), China. We sincerely thank reviewers for their insightful comments and useful suggestions.
The authors declare that the research was conducted in the absence of any commercial or financial relationships that could be construed as a potential conflict of interest.
All claims expressed in this article are solely those of the authors and do not necessarily represent those of their affiliated organizations, or those of the publisher, the editors and the reviewers. Any product that may be evaluated in this article, or claim that may be made by its manufacturer, is not guaranteed or endorsed by the publisher.
Alexander, L. V., Zhang, X., Peterson, T. C., Caesar, J., Gleason, B., Tank, A.., et al. (2006). Global observed changes in daily climate extremes of temperature and precipitation. J. Geophys. Res. 111, D05109. doi:10.1029/2005jd006290
Chen, D., Zhou, C., and Deng, M. (2016). Characteristics of water vapor content in southwest China and its association with the South Asian high in summer. J. Appl. Meteorological Sci. 27 (4), 473–479. doi:10.11898/1001-7313.20160410
Chen, H., Liu, L., and Zhu, Y. (2012). Possible linkage between winter extreme low temperature events over China and synoptic-scale transient wave activity. Sci. China Earth Sci. 56 (7), 1266–1280. doi:10.1007/s11430-012-4442-z
Chen, Q., Ye, Y., Zhang, W., and Zhou, T. (2022). Heavy rainfall event in mid-August 2020 in southwestern China: Contribution of anthropogenic forcings and atmospheric circulation. Bull. Am. Meteorological Soc. 103 (3), S111–S117. doi:10.1175/bams-d-21-0233.1
Ding, Y., Liu, Y., and Hu, Z. (2021). The record-breaking meiyu in 2020 and associated atmospheric circulation and tropical SST anomalies. Adv. Atmos. Sci. 38 (12), 1980–1993. doi:10.1007/s00376-021-0361-2
Ding, Y., and Wang, Z. (2008). A study of rainy seasons in China. Meteorol. Atmos. Phys. 100 (1), 121–138. doi:10.1007/s00703-008-0299-2
Eischeid, J. K., Pasteris, P. A., Diaz, H. F., Plantico, M. S., and Lott, N. J. (2000). Creating a serially complete, national daily time series of temperature and precipitation for the Western United States. J. Appl. Meteor. 39 (9), 1580–1591. doi:10.1175/1520-0450(2000)039<1580:cascnd>2.0.co;2
Gao, Y., and Guo, Q. (1958). On the autumn raining area in China. Acta Meteor. Sin. 29 (4), 264–273. (in Chinese).
Hack, J. J., Schubert, W. H., Stevens, D. E., and Kuo, H. C. (1989). Response of the hadley circulation to convective forcing in the ITCZ. J. Atmos. Sci. 46 (19), 2957–2973. doi:10.1175/1520-0469(1989)046<2957:rothct>2.0.co;2
Han, T., He, S., Wang, H., and Hao, X. (2018). Enhanced influence of early-spring tropical Indian Ocean SST on the following early-summer precipitation over Northeast China. Clim. Dyn. 51 (11), 4065–4076. doi:10.1007/s00382-017-3669-y
Han, X., Xue, H., Zhao, C., and Lu, D. (2016). The roles of convective and stratiform precipitation in the observed precipitation trends in Northwest China during 1961–2000. Atmos. Res. 169, 139–146. doi:10.1016/j.atmosres.2015.10.001
He, B., and Zhai, P. (2018). Changes in persistent and non-persistent extreme precipitation in China from 1961 to 2016. Adv. Clim. Change Res. 9 (3), 177–184. doi:10.1016/j.accre.2018.08.002
Huang, G., Qu, X., and Hu, K. (2011). The impact of the tropical Indian Ocean on South Asian High in boreal summer. Adv. Atmos. Sci. 28 (2), 421–432. doi:10.1007/s00376-010-9224-y
Jia, Y., Zhang, B., and Ma, B. (2018). Daily SPEI reveals long-term change in drought characteristics in southwest China. Chin. Geogr. Sci. 28 (4), 680–693. (in Chinese). doi:10.1007/s11769-018-0973-3
Lai, X., Fan, G., Dong, Y., Hua, W., Liu, Y., Yu, Z., et al. (2010). Analysis of summer daily precipitation variation characteristic in China during 19612007. Resour. Environ. Yangtze Basin 19 (11), 1277–1282. (in Chinese).
Li, Y. (2007). Conversion of kinetic energy from synoptic scale disturbance to low-frequency fluctuation over the Yangtze River valley in the summers of 1997 and 1999. Adv. Atmos. Sci. 24 (4), 591–598. doi:10.1007/s00376-007-0591-y
Lu, E., Zeng, Y., Luo, Y., Ding, Y., Zhao, W., Liu, S., et al. (2014). Changes of summer precipitation in China: The dominance of frequency and intensity and linkage with changes in moisture and air temperature. J. Geophys. Res. Atmos. 119 (2212), 575–612. doi:10.1002/2014jd022456
Ma, Q., Zhang, J., Ma, Y., Game, A., Chen, Z., Chang, Y., et al. (2021). How do multiscale interactions affect extreme precipitation in eastern central Asia?. J. Clim. 34 (18), 7475–7491. doi:10.1175/jcli-d-20-0763.1
Nie, Y., and Sun, J. (2022). Causes of interannual variability of summer precipitation intraseasonal oscillation intensity over southwest China. J. Clim. 35 (12), 3705–3723. doi:10.1175/jcli-d-21-0627.1
Para, J. A., Kesarkar, A., Bhate, J., Singh, V., Panchal, A., Munsi, A., et al. (2019). Large-scale dynamics of Western disturbances caused extreme precipitation on 24–27 January 2017 over Jammu and Kashmir, India. Model. Earth Syst. Environ. 6, 99–107. doi:10.1007/s40808-019-00661-4
Qiao, S., Chen, D., Wang, B., Cheung, H. N., Liu, F., Cheng, J., et al. (2021). The longest 2020 Meiyu season over the past 60 years: Subseasonal perspective and its predictions. Geophys. Res. Lett. 48 (9), e2021GL093596. doi:10.1029/2021gl093596
Rao, S., and Srinivasan, J. (2016). The impact of latent heating on the location and strength of the tropical easterly jet. Meteorol. Atmos. Phys. 128, 247–261. doi:10.1007/s00703-015-0407-z
Schumacher, R., and Johnson, R. (2004). Organization and environmental properties of extreme-rain-producing mesoscale convective systems. Mon. Weather Rev. 133 (4), 961–976. doi:10.1175/mwr2899.1
Shang, H., Xu, M., Zhao, F., and Tijjani, S. B. (2019). Spatial and temporal variations in precipitation amount, frequency, intensity, and persistence in China, 1973–2016. J. Hydrometeorol. 20 (11), 2215–2227. doi:10.1175/jhm-d-19-0032.1
Stocker, T. F., Qin, D., Plattner, G. K., Mmb, Tignor, Allen, S. K., Boschung, J., et al. (2014). Climate change 2013: The physical science basis. Contribution of working group I to the fifth assessment report of IPCC the intergovernmental panel on climate change. Cambridge university press: AGU Fall Meeting Abstracts.
Tang, S., Qiao, S., Feng, T., Fu, Z., Zhang, Z., and Feng, G. (2022). Predictability of the record-breaking rainfall over the Yangtze and Huaihe River valley in 2020 summer by the NCEP CFSv2. Atmos. Res. 266, 105956. doi:10.1016/j.atmosres.2021.105956
Trenberth, K. E. (1991). Climate diagnostics from global analyses: Conservation of mass in ECMWF analyses. J. Clim. 4 (4), 707–722. doi:10.1175/1520-0442(1991)004<0707:cdfgac>2.0.co;2
Wang, C., Ma, Z., Qin, N., Zhang, S., and Deng, B. (2016). Multi-scale variation of the summer rainfall over Sichuan-Chongqing Basin in recent 50 years. Plateau Meteorol. 35, 1191–1199. (in Chinese). doi:10.7522/j.issn.1000-0534.2015.00094
Wang, L., Chen, W., Zhou, W., and Huang, G. (2015). Teleconnected influence of tropical Northwest Pacific sea surface temperature on interannual variability of autumn precipitation in Southwest China. Clim. Dyn. 45 (9), 2527–2539. doi:10.1007/s00382-015-2490-8
Wang, Y., Zhou, B., Qin, D., Wu, J., Gao, R., and Song, L. (2017). Changes in mean and extreme temperature and precipitation over the arid region of northwestern China:observation and projection. Adv. Atmos. Sci. 34 (3), 289–305. doi:10.1007/s00376-016-6160-5
Wang, Z., and Zhou, B. (2019). Observed decadal transition in trend of autumn rainfall over central China in the late 1990s. J. Clim. 32 (5), 1395–1409. doi:10.1175/jcli-d-18-0112.1
Wei, T., He, S., Yan, Q., Dong, W., and Wen, X. (2018). Decadal shift in west China autumn precipitation and its association with sea surface temperature. J. Geophys. Res. Atmos. 123 (2), 835–847. doi:10.1002/2017jd027092
Wei, T., Song, W., Dong, W., Ke, Z., Sun, L., and Wen, X. (2018). A skilful prediction scheme for West China autumn precipitation. Theor. Appl. Climatol. 135 (1), 183–192. doi:10.1007/s00704-017-2363-7
Xu, H., Chen, H., and Wang, H. (2021). Interannual variation in summer extreme precipitation over Southwestern China and the possible associated mechanisms. Int. J. Climatol. 41 (6), 3425–3438. doi:10.1002/joc.7027
Yuan, X., and Liu, X. (2013). Onset-withdrawal dates of autumn persistent rains over Western China and associated autumn-to-winter evolution of atmospheric circulation. Acta Meteorolopgica Sin. 71, 913–924. (in Chinese). doi:10.11676/qxxb2013.034
Zhan, W., He, X., Sheffield, J., and Wood, E. F. (2020). Projected seasonal changes in large-scale global precipitation and temperature extremes based on the CMIP5 ensemble. J. Clim. 33 (13), 5651–5671. doi:10.1175/jcli-d-19-0311.1
Zhang, B., Chen, L., He, J., Zhu, C., and Li, W. (2009). Characteristics of atmospheric heat sources over Asia in summer:comparison of results calculated using multiple reanalysis datasets. J. Meteorological Res. 23 (5), 585–597. doi:10.1029/2009JD012351
Zhang, C., Wang, Z., Zhou, B., Li, Y., Tang, H., and Xiang, B. (2019). Trends in autumn rain of West China from 1961 to 2014. Theor. Appl. Climatol. 135 (1), 533–544. doi:10.1007/s00704-017-2361-9
Zhao, J., Zuo, J., Zhang, H., Chen, L., Yang, J., Zhihai, Z., et al. (2021). The extreme precipitation over the yangtze–huaihe river basin in August 2021: Driven by the rapid tropical atlantic warming and the second developing La Niña. Chin. J. Atmos. Sci. 45 (6), 1433–1450. doi:10.21203/rs.3.rs-1364877/v1 (in Chinese).
Zhou, B., and Wang, Z. (2019). Enlightenment from heavy autumn rain of West China in 2017: Synergic role of atmospheric circulation at mid-high latitudes and oceanic background. Theor. Appl. Climatol. 138 (1), 263–274. doi:10.1007/s00704-019-02809-9
Zhou, B., Wu, J., Xu, Y., Han, Z., and Shi, Y. (2019). Projected changes in autumn rainfall over West China: Results from an ensemble of dynamical downscaling simulations. Int. J. Climatol. 39 (12), 4869–4882. doi:10.1002/joc.6115
Zhou, B., Xu, M., Sun, B., Han, T., and Cheng, Z. (2021). Possible role of Southern Hemispheric sea ice in the variability of West China autumn rain. Atmos. Res. 249, 105329. doi:10.1016/j.atmosres.2020.105329
Zhou, J., Zhao, J., and Zhi, R. (2019). Possible causes of the anomalous characteristics of autumn rain in Western China in 2017. Theor. Appl. Climatol. 138 (1), 1109–1123. doi:10.1007/s00704-019-02876-y
Zhou, Z., Xie, S., and Zhang, R. (2021). Historic Yangtze flooding of 2020 tied to extreme Indian Ocean conditions. Proc. Natl. Acad. Sci. U. S. A. 118 (12), e2022255118. doi:10.1073/pnas.2022255118
Keywords: extreme precipitation, characteristics, mechanisms, Western China, South Asian high (SAH)
Citation: Qianrong M, Fang J, Xiaoxue W, Youzhi C, Rong Z and Guoling F (2022) Characteristics and related mechanisms of the persistent extreme precipitation in August 2020 over Western China. Front. Earth Sci. 10:1004612. doi: 10.3389/feart.2022.1004612
Received: 27 July 2022; Accepted: 07 September 2022;
Published: 21 September 2022.
Edited by:
Shangfeng Chen, Institute of Atmospheric Physics (CAS), ChinaCopyright © 2022 Qianrong, Fang, Xiaoxue, Youzhi, Rong and Guoling. This is an open-access article distributed under the terms of the Creative Commons Attribution License (CC BY). The use, distribution or reproduction in other forums is permitted, provided the original author(s) and the copyright owner(s) are credited and that the original publication in this journal is cited, in accordance with accepted academic practice. No use, distribution or reproduction is permitted which does not comply with these terms.
*Correspondence: Ma Qianrong, bWFxaWFucm9uX2dAMTYzLmNvbQ==; Zhi Rong, el9yb25ncGh5QDEyNi5jb20=
Disclaimer: All claims expressed in this article are solely those of the authors and do not necessarily represent those of their affiliated organizations, or those of the publisher, the editors and the reviewers. Any product that may be evaluated in this article or claim that may be made by its manufacturer is not guaranteed or endorsed by the publisher.
Research integrity at Frontiers
Learn more about the work of our research integrity team to safeguard the quality of each article we publish.