
95% of researchers rate our articles as excellent or good
Learn more about the work of our research integrity team to safeguard the quality of each article we publish.
Find out more
ORIGINAL RESEARCH article
Front. Earth Sci. , 16 September 2022
Sec. Sedimentology, Stratigraphy and Diagenesis
Volume 10 - 2022 | https://doi.org/10.3389/feart.2022.1001528
This article is part of the Research Topic The Application of Artificial Intelligence Methods in Petroleum Geology View all 5 articles
 Zhenkai Zhang1,2,3,4
 Na Yang2,3Zenglin Hong1,2,3,4*Jianhua Yang2,3*Biao Du1Duanchang Zhao1Ning Chen1
 Tengfei Zhou5
With the ever-growing availability of massive geo-data, deep learning has been widely applied to geoscientific questions such as sedimentary provenance analysis. However, randomly selected initial weights (and also biases) and possible loss of population diversity in traditional neural network learning remain problematic. To address this issue, in this study, we proposed a new deep neural network model by incorporating genetic algorithm (GA) and simulated annealing algorithm into the BP neural network, i.e., the GA-SA-BP model. We then applied this new model to rare earth element (REE) geochemical data of the Liuling Group of the East Qinling Orogen to investigate its provenance. Our results showed that among other deep learning algorithms, the new model presents the best performance with good measuring metrics (e.g., over 85% of accuracy, over 0.82 of F1-macro-average, F1-micro-average, and Kappa coefficient, and smallest (<0.15) Hamming distance). Here, we interpreted in accordance with the classification results that the southern margin of the North China Craton and the South Qinling Orogen are likely two major sources of the Liuling Group, suggesting a bidirectional deposition route of sediments from the north and south. Therefore, we proposed a foreland basin environment as the likely tectonic setting for the Liuling Group, which is consistent with current geological understanding. Our observations suggested that the GA-SA-BP model (or improved deep learning models) coupled with REE geochemistry is capable of provenance analysis.
With the rapid development of big geodata, many research topics and methods have been pursued to address particular issues associated with quantitative geology (Wu and Liu, 2019). Studies show that geoscientists are able to study and solve related geological problems by deep mining large geological datasets (Lin et al., 2022) Among all big data analysis techniques, machine learning (particularly deep learning) has been widely used in the geoscience community, and interesting predictive models have been built. By adopting machine learning, we have uncovered a new approach for interrogating geological big data (Luo and Zhang, 2019). For instance, big data-based magmatic rock tectonic setting discrimination, source identification of dust, automatic mineral identification, and numerical simulation in petroleum geology have been witnessed (e.g., Jiao et al., 2018; Zhang et al., 2019; Li S. Y. et al., 2019; Wang et al., 2019; Lin X et al., 2020; Lin X W et al., 2020; Yan et al., 2021a; 2021b). Therefore, integrating big geodata with machine learning to improve our understanding of certain geoscientific problems becomes the forefront of a profound revolution in the field of earth sciences (Zhang and Zhou, 2017).
Sedimentary provenance analysis is an important research topic in geology (Weltje and von Eynatten, 2004; Bahlburg et al., 2010; Rodrigues et al., 2010), as it provides links between sedimentary basins and orogenic belts and also an effective entry point for researchers to study basin/mountain interactions (Haughton et al., 1991; Weltje and von Eynatten, 2004). Provenance analysis has proved to be not only an important way to analyze geotectonic backgrounds, geotectonic evolution, paleoenvironment, and paleoclimate restoration (Li et al., 2016; Li S. et al., 2019) but also an important basis for lithofacies paleogeography reconstruction, prototype basin restoration, and sedimentary basin analysis (Xie et al., 2017; Zhou et al., 2022).
Element geochemistry is one of the most frequently used approaches to provenance analysis (Bhatia, 1983; Bhatia and Crook, 1986). In particular, rare earth elements (REEs) whose chemical properties are relatively stable and who are almost unaffected by external factors such as weathering, transportation, sedimentation, or diagenesis are often used to trace provenance (Cox et al., 1995; Garver and Scott, 1995). For provenance analysis, with a continuous accumulation of element geochemical data, geoscientists have been on the way to a paradigm of big data coupled with machine learning (Tang et al., 2012; Wang et al., 2014; Amedjoe et al., 2018; Mohammedyasin and Wudie, 2019; Lin et al., 2020; Zhang et al., 2020; Li et al., 2020). However, randomly selected initial weights (and also biases) and possible loss of population diversity in traditional deep learning are pressing issues needed to be addressed and may lead to hard-to-interpret results.
The Liuling Group from the East Qinling Orogen has been regarded as an important window to reveal the convergence process of the Qinling Orogen in the Early Paleozoic, whose provenance has proved to be somewhat controversial. In this study, we proposed a new deep neural network model by incorporating genetic algorithm (GA) and simulated annealing (SA) algorithm into the BP neural network, i.e., the GA-SA-BP model. We then applied this new model to whole-rock REE geochemical data of the Liuling Group of the East Qinling Orogen to investigate its provenance by classifying the Liuling Group into its surrounding geological units. The aim of this study was therefore two-fold. First, we tried to build a new deep learning model, which will address the issues of random weights and loss of population diversity. Second, we tried to identify the sources of the Liuling Group and tested the new model. Our results suggested that the southern margin of the North China Craton and the South Qinling Orogen are likely two major sources of the Liuling Group, implying a bidirectional deposition route of sediments from the north and south. A foreland basin environment is probably the formation tectonic setting of the Liuling Group. Based on big element geochemical data and machine learning, this study established a new method to distinguish provenance quantitatively and provided an innovative idea and fresh perspective for scholars engaged in sediment source research.
The Qinling orogenic belt, located between the North and South China cratons, is bounded by the Dabie orogenic belt in the east and extends westward for >1,500 km before joining the Qilian–Kunlun Orogenic Belt (Figure 1A). It occupies an important position in the formation and evolution of mainland China (Zhang et al., 2003; Dong et al., 2013). The Qinling Orogenic Belt can be spatially divided into four tectonic units from north to south by taking the Luonan–Luanchuan fault, Shangdan suture zone, and Mianlue suture zone as the main boundaries, i.e., the southern margin of the North China Craton, the North and South Qinling tectonic belts, and the northern margin of the Yangtze craton (Figure 1B).
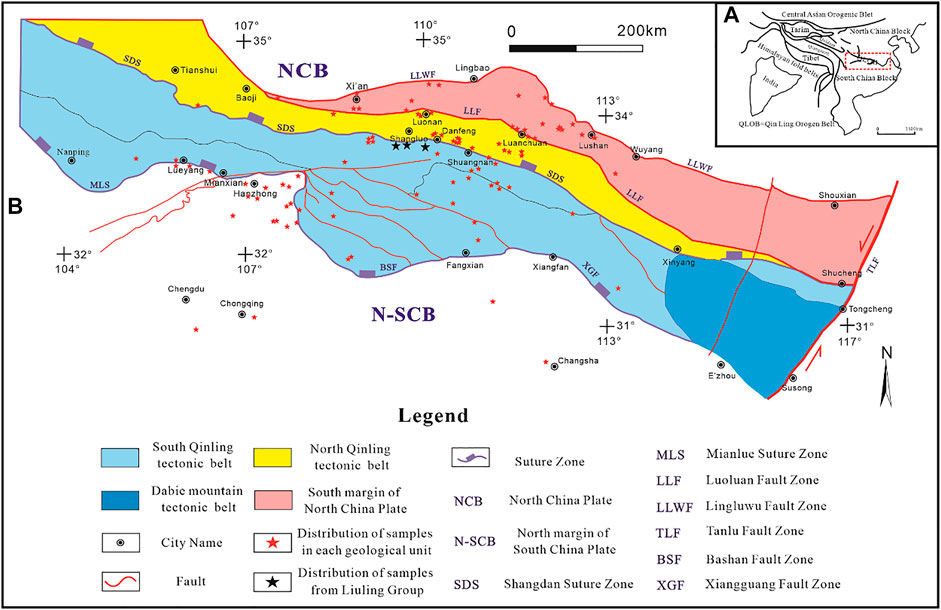
FIGURE 1. Geological map of study area and samples distribution [base map modified from Dong et al.(2011)]. (A) Tectonic framework of the study area. (B) Sketched geological map of the Qingling belt and the distribution of samples.
The Shangdan suture zone is characterized by a large number of ophiolitic mélanges and pre-arc sediments, which were formed between the North China Craton and the Yangtze craton during the closure of the Shangdan Ocean in the Early Paleozoic (Faure et al., 2001; Dong et al., 2011). It represents the most important boundary between North China and Yangtze cratons.
The North and South Qinling tectonic belts originally belong to the North China and Yangtze cratons, respectively. The crystalline basement on the southern margin of the North China Craton is mainly composed of the Proterozoic Taihua Group, while the caprocks above the crystalline basement include mainly the Xiong’er, Guandaokou, Luanchuan, and Taowan groups, which were deposited after the Paleoproterozoic. There is tectonic unconformable contact between the basement and caprocks, with a clear double-layer structure (Zhang et al., 2001).
The North Qinling tectonic belt is located in the north of the Qinling orogenic belt, which is sandwiched in an E–W direction between the Luonan–Luanchuan fault and the Shangdan suture zone. It can be further divided into multiple lenticular blocks of different sizes by several regional faults and is a very complex rock composition zone in the Qinling orogenic belt.
The lithostratigraphic units of the main North Qinling tectonic belt include the Kuanping, Erlangping, Qinling, and Danfeng groups from north to south (Zhang et al., 1995,2001), and granites intruded in the early Neoproterozoic (980–910 Ma), Early Paleozoic (507–400 Ma), and late Mesozoic (250–180 Ma) (Wang et al., 2009; 2013).
Bounded by the Shangdan and Mianlue suture zones, the South Qinling tectonic belt is mainly composed of the pre-arc, hyperplastic complex volcanic rock series of the Wuguan Group, Neoproterozoic Wudang Group, and Yaolinghe Group and Sinian–Silurian continental marginal sedimentary strata and Devonian–Triassic strata.
The northern margin of the Yangtze craton refers to the area at the south of the Mianlue–Bashan–Dabie fault and is characterized by a double basement structure with an early Precambrian crystalline basement of the Yangtze block, and Mesoproterozoic and Neoproterozoic transitional basements. This basement complex is unconformably overlain by Sinian–Lower Paleozoic, Upper Paleozoic–Middle Triassic, and Mesozoic–Cenozoic strata (Zhang et al., 2001).
The Liuling Group refers to a set of Devonian strata distributed on the northern edge of the South Qinling tectonic belt. The main lithologies include sandstone, siltstone, and mudstone, with a small amount of interlayered argillaceous limestone, which has experienced metamorphism from greenschist facies to low amphibolite facies. According to rock assemblage and biostratigraphic characterization, the Liuling Group can be divided (from bottom to top) into the Middle Devonian Niuerchuan, Chigou, and Qingshiya formations and the Upper Devonian Tongyusi Formation (Du, 1986).
The potential source regions (PSRs) of the Liuling Group are the southern margin of the North China Craton (PSR1), the North Qinling tectonic belt (PSR2), the South Qinling tectonic belt (PSR3), and the northern margin of the Yangtze craton (PSR4) (Figure 1). Whole-rock REE geochemical data (i.e., concentrations of La, Ce, Pr, Nd, Sm, Eu, Gd, Tb, Dy, Ho, Er, Tm, Yb, and Lu) were collected from the main pre-Devonian geological bodies in each tectonic unit. The REE data were obtained by collecting and organizing the published literature related to the Liuling Group, and all collected REE data, such as group name, abundances, sample number, lithotype, and reference, are listed in Supplementary Tables S1–S5.
In total, 404, 451, 518, and 648 samples of REE geochemical data were collected from PSR1, 2, 3, and 4, respectively. The aforementioned data were used as the training and validation sets. A total of 107 samples of REE data of the Liuling Group were also collected and used as unknown samples.
Genetic algorithm (GA) can solve the problems of random initial weights and biases in traditional BP neural networks by using iteration of selection, crossover, and mutation (Li et al., 2002). Meanwhile, it can remedy the problems of slow convergence and poor generalization caused by the gradient descent method. However, GA is insufficient in optimization in the later learning process due to the population and may lose its diversity. Therefore, simulated annealing (SA) algorithm (Chen et al., 2004) is introduced into GA in this study. The new BP neural network optimized by GA combined with SA algorithm (GA-SA) can improve the ability of optimization in the later learning process and deal with the problem of convergence to the local optimal solution.
The process of building a BP neural network optimized by GA-SA algorithm (GA-SA-BP algorithm) is as follows: first, to construct chromosomes for GA, weights W and biases b are chosen to be optimized and transformed into the form of chromosomes. The number of genes contained in each chromosome is the total number of weights and biases in the neural network, and each gene value corresponds to the value of weights or biases. A chromosome represents a neural network model, and this study randomly initializes a population with K chromosomes as the initial population. Training samples are imported to K neural network models determined by K chromosomes for learning information. The classification accuracy of test samples is set as fitness function (f) of genetic algorithm, as shown in formula Eq. 1, where Ntrue is the number of correctly classified samples and N is the total number of samples. The higher the classification accuracy of the chromosome is, the higher the value of fitness is.
Then, the initial temperature of SA is set. At the current temperature T(t), K chromosomes are sorted with the values of fitness functions from high to low, and the chromosomes with high fitness values in a certain proportion are selected for the new generation population. The roulette wheel method is used to make selection. Generally, the higher the value of fitness function, the higher the probability of a chromosome to get selected; meanwhile, the lower the value of fitness function, the lower the probability of a chromosome to get selected. By crossover operation that exchanges genes at the same positions, the two parent chromosomes chosen by the roulette wheel will create two new chromosomes. Selection and crossover are repeated until the number of new chromosomes reaches the requirement of the population setting. In order to restore some important genes, the new chromosomes are then mutated by changing the value to random of a certain position at a certain probability.
Then, the reciprocal of fitness function f of genetic algorithm is selected as energy function E of SA algorithm as shown in formula Eq. 2. The chromosome with a higher fitness value has the lower energy.
By comparing the energy of the new chromosome with the energy of the current chromosome, the difference in the energy value △E is obtained from △E= E1-E0, where E1 is the energy value of the new chromosome and E0 is the energy value of the current chromosome. Formula Eq. 3 is used to determine the probability to add the new chromosome to the population:
When △E<0, the new chromosome is accepted to the population with the full probability of 1. When △E≥0, the new chromosome is accepted into the population with the probability of Pre. Meanwhile, the larger the △E is, the smaller the T is, and the smaller the acceptance probability is. That is to say, the smaller the fitness function value of the new chromosome is, the smaller the acceptance probability to the population is.
Under current temperature, this process is executed cyclically until the number of chromosomes in the population reaches the setting value of the population. At this moment, the population is established. Annealing is operated according to formula Eq. 4, where T (t+1) is the next temperature, T(t) is the current temperature, and λ is the annealing rate.
For each temperature obtained from formula Eq. 4, the processes of chromosome construction, selection, and comparison will be repeated. As the temperature decreases during the iteration, the system gradually converges to the population with high fitness function, and the iteration ends at the termination temperature. The optimal chromosome with the highest fitness function in the optimal population is selected as the initial weights and biases for BP neural network. On this basis, training samples are input to this optimal neural network to fulfill the learning process to get the provenance discrimination model.
Combining GA and SA algorithm determines whether chromosomes with different values of fitness add into the population with a certain probability value can retain the diversity of the chromosome population; effectively avoid the premature problem of GA; enhance the searching ability to overcome falling into the local optimal solution; and further promote classification performance of the whole neural network. Figure 2 is the functional block diagram of GA-SA-BP algorithm.
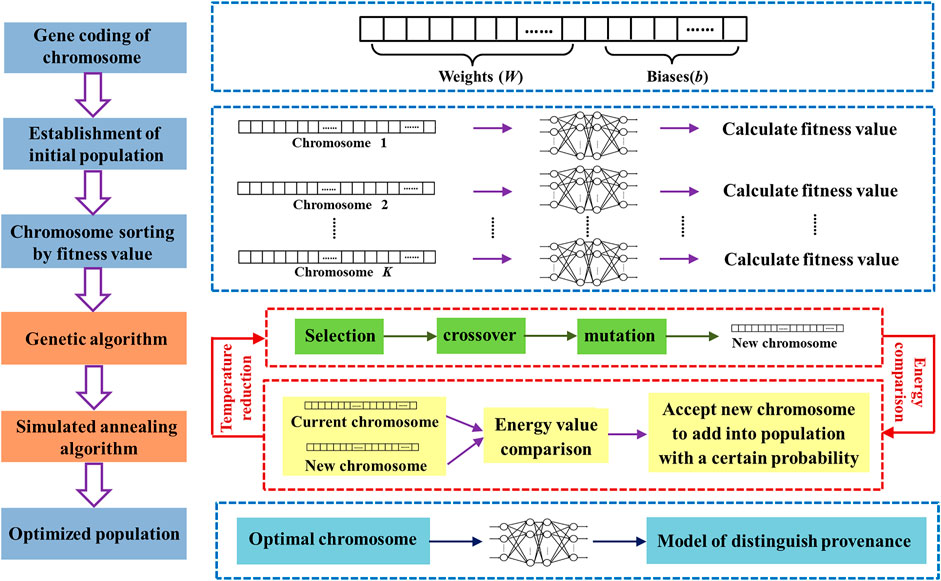
FIGURE 2. Functional block diagram of GA-SA-BP algorithm.
In order to build a provenance distinguish model with high performance, this study conducts experiments on BP neural network algorithm (BP algorithm), BP neural network algorithm optimized by genetic algorithm (GA-BP algorithm), and BP neural network algorithm optimized by genetic algorithm and simulated annealing algorithm (GA-SA-BP algorithm) and assesses the performance and reliability of the three algorithms when applied to provenance discrimination by several evaluation indexes. The BP network structure to be optimized in this study is [14,100,50,4], which owns two hidden layers. The input layer of 14 dimensions corresponds to 14 REE characteristics, and the output layer of four dimensions corresponds to four groups of provenances.
In this study, the learning rate of the BP neural network is set at 0.001, the number of iterations is set at 1,000, and the initial weights and biases are set randomly. For GA-BP algorithm, the population size is set at 20, the selection rate is 0.25, the number of genes of each chromosome is 6,754 (calculated from 14×100+100×50+50×4+100+50+4), the number of genetic operation cycles for selection, crossover, and mutation is 200, the mutation operation in one cycle performs 50 times, and the fitness function utilizes accuracy of test samples. On the basis of GA-BP algorithm, GA-SA-BP algorithm sets the annealing start temperature at 1, the annealing termination temperature at 0.3, and the annealing rate at 0.95 and selects the reciprocal of the accuracy of test samples as an energy function.
Loss in this study is the mean cross entropy of output and actual value of the model. Accuracy is a ratio of the number of correctly classified samples to the total number of samples, which indicates the correct degree for the classification model. The smaller the loss is, the higher the accuracy is, and the better the performance of the classification model is.
The comparison curves of iterative loss of BP, GA-BP, and GA-SA-BP algorithms during 1,000 iteration times in the training process are shown in Figure 3. The overall iterative loss of all three algorithms during iterations reveals a downward trend, which illustrates the feasibility of the three algorithms for provenance discrimination. However, there are distinct differences in convergence speed among the three algorithms. The convergence speed of the BP neural network is lower than that of the other two algorithms after the same number of iterations. Obviously, GA-SA-BP has the highest convergence speed among the three models. Moreover, the BP neural network has a larger of 1.1429, while GA-BP and GA-SA-BP algorithms reach steady convergence loss of smaller values (0.9161 and 0.9046) after about 60 and 40 iterations, respectively. The comparison demonstrates that the introduction of optimized weights and biases helps improve the performance of BP algorithm, and the addition of the SA approach further increases the training speed and decreases the convergence loss of GA-BP algorithm.
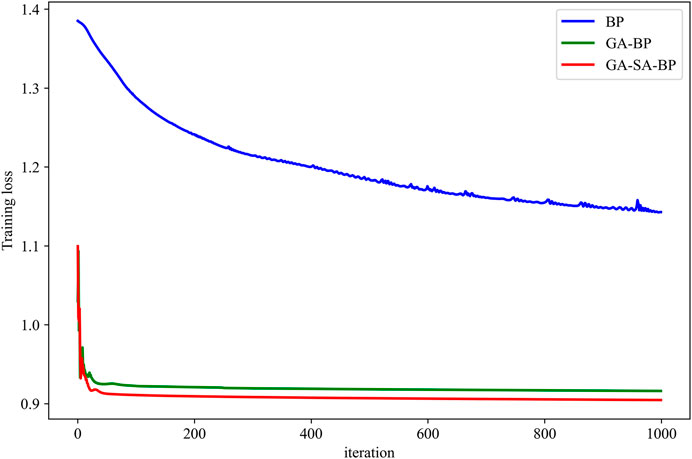
FIGURE 3. Comparison curves of iterative loss.
The BP, GA-BP, and GA-SA-BP algorithms display different training accuracy and testing accuracy after being applied to distinguish provenance, as shown in Table 1.
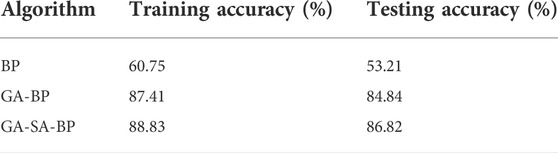
TABLE 1. Training accuracy and testing accuracy of BP, GA-BP, and GA-SA-BP algorithms.
The BP algorithm has the lowest accuracies among the three algorithms for both training and test samples. Therefore, BP algorithm cannot achieve effective provenance discrimination. The results prove that the BP algorithm is affected by the uncertainty of initial values to weights and biases, leading to a lower accuracy in the classification task.
Compared to the BP algorithm, the training and testing accuracies of the provenance discrimination model based on GA-BP algorithm are improved up to 80%. It demonstrates that the GA-BP algorithm is more effective in provenance discrimination, due to the introduction of optimized initial weights and biases by the GA approach. Although the accuracy of the training set is 87%, the accuracy of the test set is less than 85%. It indicates that overfitting phenomenon appears in GA-BP algorithm, and the premature problem of GA also makes neural networks fall into the local optimal solution to a certain extent.
To improve the performance of GA-BP algorithm, SA algorithm is introduced into the GA-BP algorithm. In this way, the GA-SA-BP algorithm is developed. Compared to the GA-BP algorithm, the training accuracy of the provenance discrimination model based on the GA-SA-BP algorithm gets up to 88%, and its testing accuracy reaches to a greater value of 86%. The results manifest that the GA-SA-BP algorithm solves overfitting problems in the GA-BP algorithm to a certain extent.
For the GA-SA-BP algorithm utilized in provenance discrimination, the addition of SA algorithm improves the GA-BP algorithm. The chromosomes with higher fitness values are directly added to the population, and the chromosomes with lower fitness values are not eliminated immediately but will be added to the population with a certain probability. This process increases the diversity of chromosomes in the population. In this way, the optimized weights and thresholds can better characterize the features of samples, improving the generalization ability of the provenance distinguishability model.
In addition to accuracy and loss, the evaluation indexes of the multi-classification model include F1-macro-average, F1-micro-average, Kappa coefficient, and Hamming distance. In order to further assess the performance of BP, GA-BP, and GA-SA-BP algorithms, this study adopts these evaluation indexes to comprehensively evaluate the three algorithms.
F1-macro-average (F1-macro) and F1-micro-average (F1-micro) are confusion matrix-based indexes, which are adopted to evaluate the global classification performance of multiple classifiers. M is the number of categories in the dataset. When calculating the confusion matrix of each class Ci, i = {1,2, M}, samples of other classes are regarded as samples that do not belong to Ci. According to this principle, the confusion matrix of class Ci is built, as shown in Table 2. F1-macro and F1-micro can be calculated, respectively, from formula Eqs. 5, 6. The larger F1-macro and F1-micro values represent the better performance of the classifier. For datasets with balanced samples, there will be a slight difference between the two indexes.
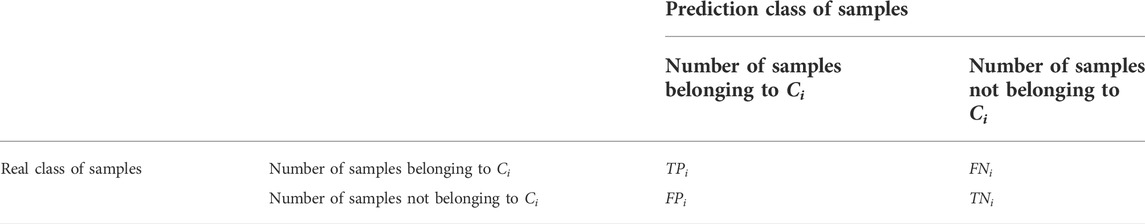
TABLE 2. Confusion matrix of class Ci.
A Kappa coefficient is used to evaluate the consistency of a classification model, and its calculation process is as shown in formula Eq. 7, where Nt is the number of samples with correct classification, N is the total number of samples, and P0 is accuracy of the classification model. M is the number of classes, Qi is the number of real samples of class Ci, and Gi is the number of samples predicted as class Ci by the classification model. A higher Kappa coefficient corresponds to a classification model with higher accuracy and better consistency. The correlation between the Kappa coefficient and consistency level is shown in Table 3.
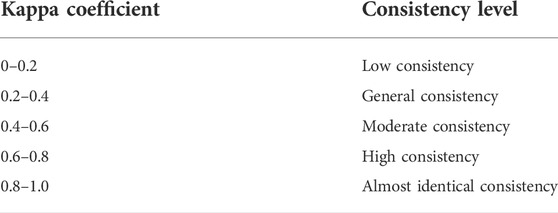
TABLE 3. Kappa coefficient and consistency level.
The Hamming distance is utilized to evaluate the distance between the prediction label and real label with the range of [0, 1], and it is calculated from formula Eq. 8, where N is the total number of samples and D is the dimension of labels. yi is the prediction label of the ith sample and yti is the real label of this sample. Xor means XOR operation for obtaining the number of different bits of two codes. The Hamming distance reflects the proportion of error classification in a model. A larger hamming distance stands for a higher proportion of error classification and a lower accuracy and vice versa.
The evaluation indexes, F1-macro, F1-micro, Kappa coefficient, and Hamming distance, are calculated for the BP, GA-BP, and GA-SA-BP algorithms based on test samples. The values of the evaluation indexes are shown in Figure 4.
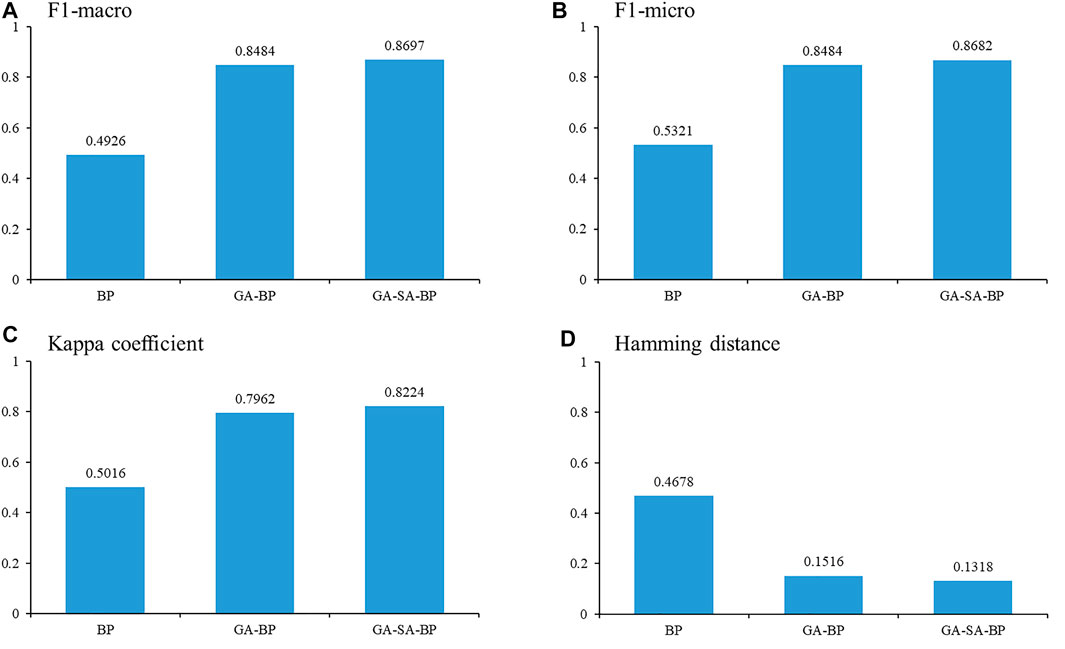
FIGURE 4. Comparison of evaluation indexes: (A) F1-macro, (B) F1-micro, (C) Kappa coefficient, and (D) Hamming distance.
According to the minor differences between F1-macro and F1-micro, respectively, in BP, GA-BP, and GA-SA-BP algorithms, the balance of the sample sets is proved. The BP algorithm has the smallest F1-macro and F1-micro among the three algorithms. Thus, the provenance performance of BP algorithm is worse than that of the other two algorithms. Compared to the BP algorithm, the F1-macro and F1-micro of the GA-BP algorithm are greatly improved and reach up to 0.8484, higher than those of the BP algorithm. It signifies that the introduction of GA into optimizing initial parameters of the BP neural network effectively improves the provenance discrimination performance. F1-macro and F1-micro of the GA-SA-BP algorithm are the highest of the three algorithms, basically up to 0.8697. It proves that SA algorithm merged into genetic algorithm has the advantage of increasing the diversity of chromosomes that can avoid falling into the local optimal solution and further usefully promote the performance of the provenance discrimination model.
The Kappa coefficient of the BP algorithm is 0.5016, referring to the level of general consistency. The Kappa coefficient of the GA-BP algorithm is 0.7962, referring to the level of high consistency, which is two-level higher than that of the BP algorithm. The Kappa coefficient of the GA-SA-BP algorithm is 0.8224, referring to the level of almost identical consistency, which is one-level higher than that of the GA-BP algorithm. The comparison of the Kappa coefficient indicates that the provenance distinguishability model based on the GA-SA-BP algorithm is highly consistent with the actual dataset. In other words, the result of the GA-SA-BP algorithm for provenance discrimination is more reliable.
The Hamming distance of the BP algorithm is far higher than that of the GA-BP algorithm and the GA-SA-BP algorithm, demonstrating that its distance between prediction labels and real labels is the largest and it has the most misclassifications. The Hamming distance of the GA-BP algorithm is lower than that of the BP algorithm, which manifests that the introduction of GA greatly decreases misclassifications of the BP algorithm. The Hamming distance of the GA-SA-BP algorithm approaches 0.1318, meaning that it owns a smaller distance between prediction labels and real labels and less misclassifications. It confirms that the accuracy of the provenance discrimination model based on GA-SA-BP algorithm is higher than that based on the other two algorithms.
By comprehensively analyzing F1-macro, F1-micro, Kappa coefficient, and Hamming distance for the three algorithms, it is verified that the GA-SA-BP algorithm is superior to the other two algorithms in the aspects of accuracy, consistency, and reliability. Thus, the GA-SA-BP algorithm is an efficient algorithm in provenance discrimination. We used the GA-SA-BP algorithm to analyze the samples of the Liuling Group.
There are 107 REE samples of clastic rocks from the Liuling Group. Each sample contains 14 chemical elements, namely, La, Ce, Pr, Nd, Sm, Eu, Gd, Tb, Dy, Ho, Er, Tm, Yb, and Lu. The GA-SA-BP algorithm is adopted to set up a provenance discrimination model to determine the provenance of samples from the Liuling Group. After inputting samples of the Liuling Group to the provenance discrimination model that was established on the basis of GA-SA-BP algorithm, the distinguishability results are acquired, as shown in Table 4. The specific results are as follows: the number of samples distinguished as the southern margin of the North China Craton is 47, accounting for 43.92% of samples; the number of samples distinguished as the North Qinling tectonic belt (PSR2) is 13, accounting for 12.15% of samples; the number of samples distinguished as the South Qinling tectonic belt (PSR3) is 26, accounting for 24.30%% of samples; and the number of samples distinguished as the northern margin of the Yangtze craton (PSR4) is 21, accounting for 19.63% of samples. Therefore, it can be concluded that the most possible provenance of the Liuling Group is mainly PSR1 and PSR3.
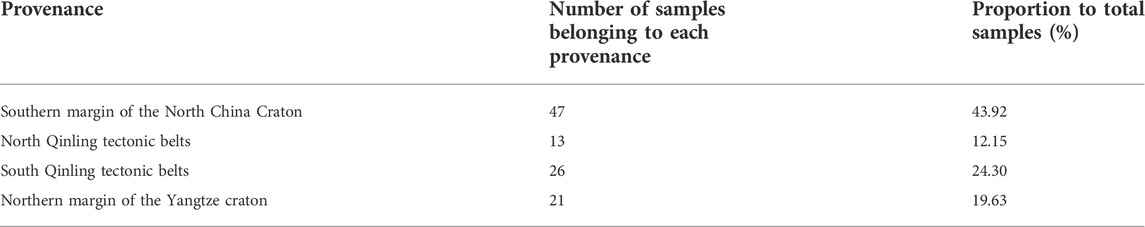
TABLE 4. Provenance discrimination results of the Liuling Group.
The provenance of the Liuling Group in the East Qinling Mountains has remained contentious. He et al. (2005) discussed its tectonic setting, based on the geochemical characteristics of the Liuling Group sandstone and concluded that the clastic rocks belong to passive continental margin basin deposits. By analyzing the geochemical characteristics of the Liuling Group, Yan et al. (2012)concluded that the Liuling Group's provenance involved upper-crust and newly differentiated island arc materials, and that the tectonic setting was a continental island arc. Dong et al. (2013) contended that Liuling Group's provenance was mainly from the North and South Qinling tectonic belts, followed by the northern margin of the Yangtze craton and the southern margin of the North China Craton—and that a marine foreland basin provided its sedimentary background.
By using the detrital zircon U-Pb geochronology, Chen et al. (2014) proposed that the Liuling Group provenance involved the North Qinling tectonic belt and that a forearc basin provided its tectonic environment. In contrast, after studying the geochemistry, heavy minerals, and tourmaline chemical composition of the Liuling Group sandstones, Shi et al. (2016) argued that the Qinling litho-group in the North Qinling tectonic belt was the most likely source area, and that the Liuling Group tectonic setting was a foreland basin, rather than a passive continental margin. Liao et al. (2017) conducted a comprehensive analysis of zircon U-Pb, Hf isotope, and zircon geochemical characteristics and concluded that the North and South Qinling tectonic belts were the main provenance areas and that a post-orogenic extensional basin was the prototype basin for this period.
In another approach, Li et al. (2018) reviewed zircon U-Pb and Hf isotopic characteristics and suggested that the Liuling Group provenance was mainly from the South and North Qinling tectonic belts and from the southern margin of the North China Craton. They found an absence of provenance indication for the northern margin of the Yangtze craton and concluded that the tectonic setting was a foreland basin in the Middle–Late Devonian. Gao et al. (2019) also used Liuling Group zircon U-Pb age characteristics and considered that binary sources were indicated for the provenance, with both the South and North Qinling tectonic belts providing important materials for the Liuling Group, and that a foreland basin tectonic environment provided its tectonic setting.
For this study, the authors collected REE data from the four potential provenance regions and quantitatively identified the provenance of the Liuling Group using machine learning. The results demonstrated that the southern margin of the North China Craton and the South Qinling tectonic belt was the most likely provenance areas, while the North Qinling belt was the least likely contributor (Figure 5).
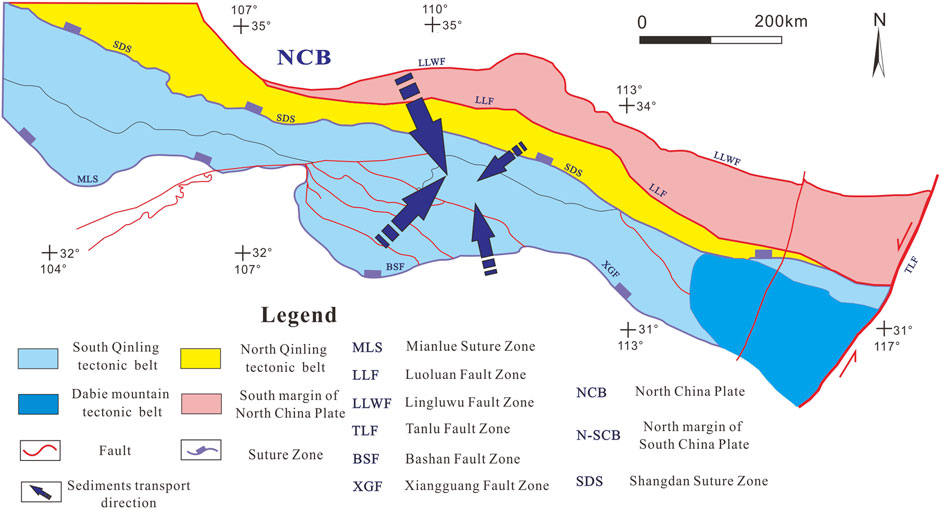
FIGURE 5. Sketch map of the provenances of Liuling Group (base map modified from (Dong et al., 2011)).
It should be noted that among the four data groups, the southern margin of the North China craton had the least amount of REE data but had the highest probability (43.92%), which indicated that the Liuling Group samples showed a stronger affinity to the southern margin of the North China Craton than they showed to the other data groups.
In the early Paleozoic, the South Qinling microplate subducted beneath the North Qinling microplate, in a subduction process that might have lasted until the end of the Devonian (Zhang et al., 2001; Wang et al., 2009; Dong and Santosh, 2016). This suggests that the Liuling Group tectonic setting should be an active continental margin environment related to plate subduction, and that the prototype basin was either a forearc basin or a foreland basin (Gao et al., 2019). Liu et al. (2016) and Dong and Santosh, (2016) suggested that the Shangdan Ocean was closed during the Middle–Late Devonian, and that there was no forearc sedimentary environment in the South Qinling. They also suggested that the provenance area of the forearc basin was relatively unique, being mainly the island arc adjacent to the forearc basin, and that the provenance itself consisted mainly of volcanic material, implying that the provenance was mainly from the North Qinling tectonic belt. Our results showed, however, that the Liuling Group provenance was bidirectional, and so we prefer to consider that a foreland basin provided the sedimentary tectonic setting for the group.
In the early stage of this study, various statistical methods, including principal component analysis (PCA) and Mahalanobis distance discriminant analysis, were applied to the geological data; however, we were unable to achieve quantitative results with them due to their limited ability to process multi-dimensional, mixed geological data. By introducing machine learning, an intelligent model based on the GA-SA-BP algorithm was built; it proved to be highly reliable, providing accurate and quantitative sample discrimination. The authors are confident that using the machine learning technique has opened a new avenue of research into the classification and discrimination of geological data, as well as into the provenance of sediments.
The advantages of this deep learning-based provenance discrimination method are: 1) the method can give a quantitative description of the source area; and 2) the performance of the machine learning model can be described quantitatively. However, while we focus on the advantages of this approach, we also need to be aware of some challenges in its application. For example, 1) REE data collection requires a great deal of preparation and is time-consuming; and 2) the construction and enhancement of deep learning models require knowledge in the field of artificial intelligence and have a certain threshold, such as the need to master the Python programming language, scikit-learn, PyTorch, and other machine learning frameworks.
In this study, an improved BP neural network model (GA-SA-BP), designed to identify sediment provenance, was constructed using machine learning. The resulting quantitative prediction model was trained using REE data from four potential provenances and was then used to discriminate between samples (Liuling Group REE data) using a quantitative classification prediction process. The following conclusions can be drawn from this work:
1) By using measuring metrics of F1-macro-average, F1-micro-average, Kappa coefficient, and Hamming distance, we were able to show that the GA-BP algorithm was superior to the BP algorithm in establishing a sediment source identification model, while the GA-SA-BP algorithm presented the best performance. The measuring metrics suggested that when optimized using the GA-SA algorithm, the provenance identification model was more accurate, more consistent with the dataset, and more reliable, which meant that it was able to produce better classification performance.
2) The Liuling Group discrimination results obtained using the GA-SA-BP model showed that the numbers of samples whose provenances were attributable to the southern margin of the North China Craton, the North Qinling tectonic belt, the South Qinling tectonic belt, and the northern margin of the Yangtze craton were, 47, 13, 26, and 21, respectively, accounting for 43.92, 12.15, 24.30, and 19.63% of the total. We thus concluded that the Liuling Group provenances were mainly the southern margin of the North China Craton and the South Qinling tectonic belt. When reviewing the work of other scholars and taking into account of our conclusion that the Liuling Group enjoyed bidirectional provenance, we concluded that a foreland basin provided the sedimentary tectonic setting for the Liuling Group.
3) By synthesizing big data techniques and machine learning, REE data were processed to distinguish provenance in a quantitative manner. Compared with traditional statistical methods, machine learning worked well at processing multi-dimensional and mixed geological data. This interactive approach has provided a new avenue for scholars to study sediment provenance.
The original contributions presented in the study are included in the article/Supplementary Material; further inquiries can be directed to the first author and the corresponding authors.
All authors listed have made a substantial, direct, and intellectual contribution to the work and approved it for publication.
This study was supported by the Shaanxi Youth Science and Technology Star Project (Grant No. 2021KJXX-87) and Shaanxi Public Welfare Geological Survey Project (Grant Nos. 20180301, 201918, and 202103).
The authors declare that the research was conducted in the absence of any commercial or financial relationships that could be construed as a potential conflict of interest.
The editor YY declared a shared affiliation with the author TZ to the handling editor at the time of review.
All claims expressed in this article are solely those of the authors and do not necessarily represent those of their affiliated organizations, or those of the publisher, the editors, and the reviewers. Any product that may be evaluated in this article, or claim that may be made by its manufacturer, is not guaranteed or endorsed by the publisher.
The Supplementary Material for this article can be found online at: https://www.frontiersin.org/articles/10.3389/feart.2022.1001528/full#supplementary-material
Amedjoe, C. G., Gawu, S. K. Y., Ali, B., Aseidu, D. K., and Nude, P. M. (2018). Geochemical compositions of neoproterozoic to lower palaeozoic (?) shales and siltstones in the volta basin (Ghana): Constraints on provenance and tectonic setting. Sediment. Geol. 368, 114–131. doi:10.1016/j.sedgeo.2018.03.004
Bahlburg, H., Vervoort, J. D., and Dufrane, S. A. (2010). Plate tectonic significance of middle cambrian and ordovician siliciclastic rocks of the bavarian facies, armorican terrane assemblage, Germany — U–Pb and Hf isotope evidence from detrital zircons armorican terrane assemblage Germany - u-pb and hf isotope evidence from detrital zircons. Gondwana Res. 17, 223–235. doi:10.1016/j.gr.2009.11.007
Bhatia, M. R., and Crook, K. A. W. (1986). Trace element characteristics of graywackes and tectonic setting discrimination of sedimentary basins. Contr. Mineral. Pet. 92 (2), 181–193. doi:10.1007/BF00375292
Bhatia, M. R. (1983). Plate tectonics and geochemical composition of sandstones. J. Geol. 91 (6), 611–627. doi:10.1086/628815
Chen, H. G., Wu, J. S., Wang, J. L., and Chen, B. (2004). Mechanism study of simulated annealing algorithm. J. Tongji Univ. Nat. Sci. 32 (6), 802–805. (in Chinese with English abstract).
Chen, L. Y., Luo, Y. L., Liu, X. C., Qu, W., and Hu, J. (2014). La-icp-ms u-pb geochronology of detrital zircons from the liuling group in the south qinling tectonic belt and its tectonic significance. Geol. Bull. China 33 (9), 1363–1378. (in Chinese with English abstract). doi:10.3969/j.issn.1671-2552.2014.09.011
Cox, R., Lower, D. R., and Cullers, R. L. (1995). The influence of sediment recycling and basement composition on evolution of mudrock chemistry in the southwestern United States. Geochim. Cosmochim. Acta 59, 2919–2940. doi:10.1016/0016-7037(95)00185-9
Dong, Y. P., Liu, X. M., Neubauer, F., Zhang, G. W., Tao, N., Zhang, Y. G., et al. (2013). Timing of paleozoic amalgamation between the North China and South China blocks: Evidence from detrital zircon u–pb ages. Tectonophysics 586, 173–191. doi:10.1016/j.tecto.2012.11.018
Dong, Y. P., and Santosh, M. (2016). Tectonic architecture and multiple orogeny of the qinling orogenic belt, central China. Gondwana Res. 29 (1), 1–40. doi:10.1016/j.gr.2015.06.009
Dong, Y. P., Zhang, G. W., Neubauer, F., Liu, X. M., Genser, J., and Hauzenberger, C. (2011). Tectonic evolution of the qinling orogen, China: Review and synthesis. J. Asian Earth Sci. 41, 213–237. doi:10.1016/j.jseaes.2011.03.002
Du, D. H. (1986). Study on devonian in qinba area, shaanxi province. Xi'an: Xi'an Jiaotong University Press, 1–187. (in Chinese).
Faure, M., Lin, W., and Le Breton, N. (2001). Where is the north China–south China block boundary in eastern China. Geology 29, 119–122. doi:10.1130/0091-7613(2001)029<0119:WITNCS>2.0.CO;2
Gao, F., Pei, X. Z., Li, R. B., Li, Z. C., Pei, L., Chen, Y. Q., et al. (2019). Detrital zircon u-pb ages and geological significance of low-metamorphosed liuling sedimentary assemblage in the shangdan area, eastern qinling orogenic belt. Earth Sci. 44 (7), 2519–2531. (in Chinese with English abstract). doi:10.3799/dqkx.2018.164
Garver, J. L., and Scott, T. J. (1995). Trace elements in shale as indicators of crustal provenance and terrane accretion in the southern canadian cordillera. GSA Bull. 107 (4), 440–453. doi:10.1130/0016-7606(1995)107<0440:TEISAI>2.3.CO;2
Haughton, P. D. W., Todd, S. P., and Morton, A. C. (1991). Sedimentary provenance studies. Geol. Soc. Lond. Spec. Publ. 57 (1), 1–11. doi:10.1144/GSL.SP.1991.057.01.01
He, Z. J., Niu, B. G., and Ren, J. S. (2005). Tectonic discriminations of sandstones geochemistry from the middle-late devonian liuling group in shanyang area, southern shaanxi. Chin. J. Geol. 40 (04), 146–159. (in Chinese with English abstract).
Jiao, S. T., Zhou, Y. Z., Zhang, Q., Jin, W. J., Liu, Y. P., and Wang, J. (2018). Study on intelligent discrimination of tectonic settings based on global gabbro from georoc. Acta Pet. Sin. 34 (11), 3189–3194. (in Chinese with English abstract).
Li, M. C., Liu, C. Z., Zhang, Y., and Zhu, Y. Q. (2020). A deep learning and intelligent recognition method of image data for rock mineral and its implementation. Geotect. Metallogenia 44 (2), 203–211. (In Chinese with English abstract). doi:10.16539/j.ddgzyckx.2020.02.004
Li, M. Q., Kou, J. S., and Lin, D. (2002). Basic theory and application of genetic algorithm. Beijing: Science Press, 1–425. (in Chinese).
Li, S., Chen, J. P., Xiang, J., Zhang, Z. P., and Zhang, Y. (2019b). Two-dimensional prospecting prediction based on alexnet network: A case study of sedimentary mn deposits in songtao-huayuan area. Geol. Bull. China 38 (12), 2022–2032. (in Chinese with English abstract).
Li, S. Y., Wei, X., Xie, W., Cheng, C., and Li, M. (2019a). From source to sink: Coupling relation between the dabie Shan orogen provenance and mesozoic sediments of the South-margin of hefei basin, based on the evidence of detrital zircon ages. J. Palaeogeogr. 21 (01), 82–106. (in Chinese with English abstract). doi:10.7605/gdlxb.2019.01.005
Li, Z. H., Wang, Y. J., He, Y. H., Zhu, X., and Long, X. P. (2018). Detrital zircon u⁃pb geochronology and hf isotopic compositions of devonian sandstone in the southern qinling belt: Constrain on the material sources and tectonic setting. Chin. J. Geol. 53 (3), 1075–1099. (in Chinese with English abstract). doi:10.12017/dzkx.2018.059
Li, Z., Ni, L. M., and Xu, J. Q. (2016). The upper proterozoic-paleozoic records of sedimentary sequences and detrital zircon geochronology in Korean peninsula and North China: Implications for tectonic attributes and division. Acta Pet. Sin. 32 (10), 3139–3154. (in Chinese with English abstract).
Liao, X. Y., Wang, Y. W., Liu, L., Wang, C., and Santosh, M. (2017). Detrital zircon u-pb and hf isotopic data from the liuling group in the South qinling belt: Provenance and tectonic implications. J. Asian Earth Sci. 134, 244–261. doi:10.1016/j.jseaes.2016.11.020
Lin, X., Chang, H., Wang, K., Zhang, G., and Meng, G. (2020). Machine learning for source identification of dust on the Chinese loess plateau. Geophys. Res. Lett. 47 (21), e2020GL088950. doi:10.1029/2020GL088950
Lin, X., Cicchella, D., Hong, J., and Meng, G. (2022). A test of the hypothesis that syn-collisional felsic magmatism contributes to continental crustal growth via deep learning modeling and principal component analysis of big geochemical datasets. JGR. Solid Earth 127 (2), e2021JB023002. doi:10.1029/2021JB023002
Lin, X. W., Zhang, Z. K., Liu, X. D., Chen, N., Wu, T., Zhang, Y. F., et al. (2020). Geochemical characteristics of late triassic sandstones in the Western part of bayan har basin, northern Tibetan plateau, Western China: Constraints on provenance, source weathering, tectonic setting, and palaeoenvironment. Geol. J. 55, 5275–5293. doi:10.1002/gj.3743
Liu, L., Liao, X. Y., Wang, Y. W., Wang, C., Santosh, M., Yang, M., et al. (2016). Early Paleozoic tectonic evolution of the North Qinling Orogenic Belt in Central China: Insights on continental deep subduction and multiphase exhumation insights on continental deep subduction and multiphase exhumation. Earth. Sci. Rev. 159, 58–81. doi:10.1016/j.earscirev.2016.05.005
Luo, J. M., and Zhang, Q. (2019). Big data pioneers new ways of geoscience research: Identifying relevant relationships to enhance research feasibility. Earth Sci. Front. 26 (4), 6–12. (in Chinese with English abstract). doi:10.13745/j.esf.sf.2019.28
Mohammedyasin, M. S., and Wudie, G. (2019). Provenance of the cretaceous debre libanos sandstone in the blue nile basin, Ethiopia: Evidence from petrography and geochemistry. Sediment. Geol. 379, 46–59. doi:10.1016/j.sedgeo.2018.10.008
Rodrigues, J. B., Pimentel, M. M., Dardenne, M., and Armstrong, R. (2010). Age, provenance and tectonic setting of the canastra and ibiá groups (brasília belt, Brazil): Implications for the age of a neoproterozoic glacial event in central Brazil. J. South Am. Earth Sci. 29 (2), 512–521. doi:10.1016/j.jsames.2009.08.008
Shi, G. Z., Wang, H., Huang, C. Y., Yang, S. Y., and Song, G. Z. (2016). Provenance and tectonic setting of middle-upper devonian sandstones in the qinling orogen (shanyang area): New insights from geochemistry, heavy minerals and tourmaline chemistry. Tectonophysics 688, 11–25. doi:10.1016/j.tecto.2016.09.023
Tang, Y., Sang, L., Yuan, Y., Zhang, Y., and Yang, Y. (2012). Geochemistry of late triassic pelitic rocks in the ne part of songpan-ganzi basin, Western China: Implications for source weathering, provenance and tectonic setting. Geosci. Front. 3 (5), 647–660. doi:10.1016/j.gsf.2012.01.006
Wang, K. Y., Zhou, Y. Z., Wang, J., Zhang, A., Yu, X. T., Jiao, S. T., et al. (2019). Recommendation system algorithm and its application in ore deposits forcast at wendi district of the southern qinzhou-hangzhou metallogenic belt, south China. Earth Sci. Front. 26 (4), 131–137. (in Chinese with English abstract).
Wang, L. C., Liu, C. L., Gao, X., and Zhang, H. (2014). Provenance and paleogeography of the late cretaceous mengyejing formation, simao basin, southeastern Tibetan plateau: Whole-rock geochemistry, u–pb geochronology, and hf isotopic constraints. Sediment. Geol. 304, 44–58. doi:10.1016/j.sedgeo.2014.02.003
Wang, T., Wang, X. X., Tian, W., Zhang, C., Li, W., and Li, S. (2009). North qinling paleozoic granite associations and their variation in space and time: implications for orogenic processes in the orogens of central China. Sci. China Ser. D-Earth. Sci. 52, 1359–1384. doi:10.1007/s11430-009-0129-5
Wang, X. X., Wang, T., and Zhang, C. L. (2013). Neoproterozoic, paleozoic, and mesozoic granitoid magmatism in the qinling orogen, China: Constraints on orogenic process. J. Asian Earth Sci. 72, 129–151. doi:10.1016/j.jseaes.2012.11.037
Weltje, G. J., and von Eynatten, H. (2004). Quantitative provenance analysis of sediments: Review and outlook. Sediment. Geol. 171 (1-4), 1–11. doi:10.1016/j.sedgeo.2004.05.007
Wu, C. L., and Liu, G. (2019). Big data and future development of geological science. Geol. Bull. China 38 (07), 1081–1088. (in Chinese with English abstract). doi:10.1016/j.sedgeo.2004.05.007
Xie, X. N., Lin, C. S., Li, Z., Ren, J. Y., Jiang, T., Jiang, Z. X., et al. (2017). Research reviews and prospects of sedimentary basin geodynamics in China. Acta Sedimentol. Sin. 35 (05), 877–887. (in Chinese with English abstract). doi:10.14027/j.cnki.cjxb.2017.05.002
Yan, Y. M., Zhang, L. Q., Luo, X. R., Liu, K. Y., Zhang, L. K., and Jia, T. (2021a). New method to predict porosity loss during sandstone compaction based on packing texture. Mar. Petroleum Geol. 133 (2), 105228. doi:10.1016/j.marpetgeo.2021.105228
Yan, Y. M., Zhang, L. Q., Luo, X. R., Zhang, L. K., and Li, J. J. (2021b). Process of porosity loss and predicted porosity loss in high effective stress sandstones with grain crushing and packing texture transformation. J. Petroleum Sci. Eng. 207, 109092. doi:10.1016/j.petrol.2021.109092
Yan, Z., Wang, Z. Q., Yan, Q. R., Wang, T., and Guo, X. Q. (2012). Geochemical constraints on the provenance and depositional setting of the devonian liuling group, east qinling mountains, central china: Implications for the tectonic evolution of the qinling orogenic belt. J. Sediment. Res. 82 (1), 9–20. doi:10.2110/jsr.2012.4
Zhang, B. Y., Sun, J. K., Luo, X., Jin, W. J., Wang, L., Du, X. L., et al. (2019). Data analysis of major and trace element of gabbro clinopyroxene from different tectonic setting. Earth Sci. Front. 26 (4), 33–44. (in Chinese with English abstract).
Zhang, G. W., Dong, Y. P., Lai, S. C., Guo, A. L., Meng, Q. R., Liu, S. F., et al. (2003). Mian-lue tectonic belt and mian-lue suture zone in the southern margin of qinling dabie orogenic belt. Sci. China (Series D). 33 (12), 1121–1135. (in Chinese with English abstract).
Zhang, G. W., Zhang, B. R., and Yuan, X. C. (2001). Qinling orogenic belt and continental dynamics. Beijing: Science Press, 1–192. (in Chinese).
Zhang, G. W., Zhang, Z. Q., and Dong, Y. P. (1995). Structural properties and tectonic significance of main tectono-lithostratigraphic units in qinling orogenic belt. Acta Petrol. Sin. 11, 101–114. (in Chinese with English abstract). doi:10.1155/2012/850282
Zhang, Q., and Zhou, Y. Z. (2017). Reflections on the scientific research method in the era of big data. Bull. Mineralogy, Petrology Geochem. 36 (6), 881–885. (in Chinese with English abstract). doi:10.3969/j.issn.1007-2802.2017.06.001
Zhang, Z. K., Zhou, Y. Q., Zhou, T. F., Yu, S. S., He, Y. F., and Gao, F. (2020). Geochemistry of siltstones of the early cretaceous laiyang group in taolin area, shandong province, eastern China: Implications for provenance, source weathering, palaeo‐environment, and tectonic setting. Geol. J. 55 (1), 133–146. doi:10.1002/gj.3400
Keywords: big geodata, deep learning, rare earth elements, provenance analysis, Liuling Group
Citation: Zhang Z, Yang N, Hong Z, Yang J, Du B, Zhao D, Chen N and Zhou T (2022) Quantitative provenance analysis through deep learning of rare earth element geochemistry: A case from the Liuling Group of the East Qinling Orogen, Central China. Front. Earth Sci. 10:1001528. doi: 10.3389/feart.2022.1001528
Received: 23 July 2022; Accepted: 15 August 2022;
Published: 16 September 2022.
Edited by:
Yiming Yan, China University of Petroleum, ChinaCopyright © 2022 Zhang, Yang, Hong, Yang, Du, Zhao, Chen and Zhou. This is an open-access article distributed under the terms of the Creative Commons Attribution License (CC BY). The use, distribution or reproduction in other forums is permitted, provided the original author(s) and the copyright owner(s) are credited and that the original publication in this journal is cited, in accordance with accepted academic practice. No use, distribution or reproduction is permitted which does not comply with these terms.
*Correspondence: Zenglin Hong, aG9uZ3plbmdsaW4xOTYzQDE2My5jb20=; Jianhua Yang, eWFuZ2ppYW5odWFAbndwdS5lZHUuY24=
Disclaimer: All claims expressed in this article are solely those of the authors and do not necessarily represent those of their affiliated organizations, or those of the publisher, the editors and the reviewers. Any product that may be evaluated in this article or claim that may be made by its manufacturer is not guaranteed or endorsed by the publisher.
Research integrity at Frontiers
Learn more about the work of our research integrity team to safeguard the quality of each article we publish.