 Qijun Huang
 Xuyang Ge
 Mingyu Bi
94% of researchers rate our articles as excellent or good
Learn more about the work of our research integrity team to safeguard the quality of each article we publish.
Find out more
ORIGINAL RESEARCH article
Front. Earth Sci., 10 February 2022
Sec. Atmospheric Science
Volume 9 - 2021 | https://doi.org/10.3389/feart.2021.832670
This article is part of the Research TopicLandfalling Tropical Cyclones: Physical Processes, Forecasting and ImpactsView all 26 articles
In this study, super typhoon Lekima (2019) with an atypical rapid intensification (RI) episode is investigated by conducting a pair of experiments. In the control experiment, the model reproduces reasonably well the evolution characteristics of convective activity and intensity changes. That is, active downshear-left convection moved counterclockwise to the upshear flank. In the sensitivity experiment without the cloud-radiation feedback (CRF), the simulation fails to capture the observed upshear deep convection and the RI process. Our analyses suggest that the cloud–radiation interaction acts as positive feedback between the tilting-induced convective asymmetry (TCA) and outflow channel. On the one hand, the radiative process will induce upper (lower) cooling (warming) above (within) the cloud anvil of the outflow layer. This thermodynamical pattern locally destabilizes the upper troposphere and is conducive to enhance the deep convection. On the other hand, the enhanced deep convection provides the energy source to promote the upper divergent flows. The stronger divergent flow acts efficiently to block the vertical wind shear (VWS) and leads to a stronger outflow channel. This CRF assists in the development of a thicker and more radially extensive outflow than that CRF-off simulation. This study further confirms the outflow blocking effect, which gains insights on the evolution of upshear-left asymmetric convection and its role in the atypical RI event.
The intensity prediction of tropical cyclone (TC) remains a big challenge for the operational centers (DeMaria et al., 2014), particularly during the rapid intensification (RI) with winds increased by at least 30 knots in a 24-h period. TC intensity change is affected by multiple-scale processes, including internal dynamics and external forcing. Among the external forcing, the environmental vertical wind shear (VWS) has been realized as one of the important factors in modulating TC intensification (Zeng et al., 2007; Zeng et al., 2008; Gu et al., 2015; Wang et al., 2015; Chen et al., 2017). In response to the VWS, the storm will exhibit significant structure change. For instance, the VWS can tilt the TC vortex, creating pronounced asymmetries in TC structure and rainfall pattern (Reasor et al., 2009; Molinari and Vollaro, 2010; Nguyen and Molinari,2012). Specifically, the deep convection is mainly located at the downshear-left (DSL) quadrant, whereas it is greatly suppressed at the upshear (US) quadrant under the VWS. Several paradigms are proposed to interpret the possible processes leading to such a wavenumber one asymmetry (Wong and Chan, 2004; Zhang and Kieu, 2006). Due to the superposition of the environmental flow and TC circulation, an asymmetric secondary circulation will be induced by an enhanced ascending (descending) at the downshear (US) flank (Wong and Chan, 2004), agreeing with the observed typical wavenumber-1 rainfall asymmetry (Rogers et al., 2003; Braun et al., 2006). By using the potential vorticity dynamics framework, Zhang and Kieu (2006) identified the so-called shear-forced secondary circulation (SFC), which acts to resist the influence of the environmental VWS. In short, for a sheared storm, the secondary circulation has a deep layer of low-level inflow on the downshear side (Reasor et al., 2013; DeHart et al., 2014).
Nevertheless, recent observational and numerical studies (Zhang and Tao, 2013; Tao and Jiang, 2015; Rogers et al., 2016; Munsell et al., 2017; Wadler et al., 2018; Ryglicki et al., 2019; Li et al., 2020; Huang et al., 2021) revealed that, under some circumstances, deep convection occurs mainly on the US side. For RI storms, Tao and Jiang (2015) observed that a cyclonic rotation of frequency peaks from shallow (downshear right; DSR) to moderately or/and very deep precipitation (upshear left; USL) and suggested that this feature is a potential indicator of a rapidly strengthening vortex. By conducting ensemble simulations of Hurricane Edouard, Leighton et al. (2018) illustrated that intensifying TC members have more actively convective bursts (CBs) on the US side, while the CBs with members that do not intensify remain on the downshear side. This result is supported by the analysis of aircraft observations (Wadler et al., 2018). This feature is different from the typical pattern with DSL deep convection. As such, the group of TCs with deep convection at the US flank is called atypical class (Ryglicki et al., 2019).
For a rapid development TC under ambient VWS, it must experience a quicker vertical alignment. Numerous studies have suggested a variety of mechanisms for the tilt realignment, including the evolution of vortex Rossby waves in the inner core (Smith and Montgomery, 2015), the SFC (Zhang and Kieu, 2006), vortex re-formation (Molinari et al., 2006), and an outflow in opposing and deflecting the environmental flow (e.g., Elsberry and Jeffries, 1996; Dai et al., 2019; Ryglicki et al., 2019; Dai et al., 2021). As an important branch of a TC, the upper-level outflow layer pattern potentially influences the storm’s intensity and structure evolution (Merill, 1988). Elsberry and Jeffries (1996) suggested that the shallow outflow layer of TC could deflect the upper-level environmental flow. For this atypical class of TCs that underwent RI, the vertical realignment is closely associated with the tilt-modulated convective asymmetries (TCA) (Ryglicki et al., 2019). Once the TCA moves toward the US flank, it will greatly enhance the outflow layer and thus reduce the VWS. These results indicate the possible important role of the convective asymmetries in minimizing the TC tilting.
Previous studies suggested that TC intensification is strongly related to their upper-level clouds and stratiform precipitation (Tao et al., 2017; Fischer et al., 2018; Zhang and Xu, 2021). Recent theoretical and modeling studies have suggested that the crucial role of cloud-radiation feedback (CRF) in TC genesis and development (Bu et al., 2014; Fovell et al., 2016; Wing et al., 2016; Ruppert et al., 2020; Smith et al., 2020; Yang and Tan, 2020; Yang et al., 2021). Ruppert et al. (2020) suggested that the intensification of the secondary circulation forced by the radiative warming anomaly might transport more moisture and low-level angular momentum into the disturbance region, which directly promotes TC development. Fovell et al. (2016) pointed out that the CRF processes may affect TC inner-core diabatic heating asymmetries, outer-core convective activity, and the characteristics of the anvil cloud. Due to the absorption and emission of longwave radiation in the cloud anvil, this encourages more extensive convective activity and thus helps a radial expansion of the TC wind field. Covered by a large area of cloud anvils, the outflow channel is believed to exert a significant CRF. In reality, the TC upper-level divergent flow is largely driven by the deep convection; it stimulates us to investigate the possible role of the TCA in the atypical RI process. Hence, several scientific issues will be addressed here: 1) What are the possible roles of US deep convection in modulating the TC outflow layer in the RI process? 2) What are the possible roles of the CRF in modulating TC outflow and asymmetric convection? To fulfill this goal, super typhoon Lekima (2019) is selected to represent an atypical RI case (Huang et al., 2021). The paper is organized as follows: in the Experimental Designs section, we briefly describe the experimental design and model setup. The results are presented in the Simulation Results section, and the conclusion and discussions are given in the Conclusion and Discussion section.
In this study, the Advanced Research Weather Research and Forecasting model (WRF-AWR; version 3.9.1) is used. The model domains are two-way interactive and four-nested domains with the horizontal grid spacings of 27, 9, 3, and 1 km, respectively. There are 45 uneven σ levels in the vertical using terrain-following coordinates extending from the surface to the model top at 10 hPa. The vortex-following technique is used in the third and innermost moving-nested domains so that the TC vortex is always located near the center of the domain. The other model physics included the following: 1) the Lin microphysics scheme (Lin et al., 1983), including six classes of hydrometeors about water vapor, cloud water, rain, cloud ice, snow, and graupel; 2) the Dudhia scheme (Dudhia, 1989) for shortwave radiation calculations; 3) the rapid radiative transfer model (RRTM; Mlawer et al., 1997) for longwave radiation calculations; and 4) the YSU turbulent mixing scheme for boundary layer parameterization. The Kain–Fritsch convective scheme (Kain and Fritsch, 1993) is used for the outermost domain only.
The control experiment (CTL) is the same as that of Huang et al. (2021) for typhoon Lekima (2019), in which the evolution of TCA at the US quadrant is investigated. The simulation initial time is at 0000 UTC 6 August. Our previous work simulated well the observed atypical RI process. That is, under moderate upper-level easterly VWS, the TCA is transported from the initially downshear quadrant to the US quadrant. This process enhances upward motions at the US flank and creates upper-level divergent flow. In this study, in order to gain insight on the possible roles of CRF in modulating the outflow, a sensitivity experiment (noR) is designed by turning off the cloud–radiation interaction feedback. The CRF functions as positive feedback, assisting in the development of a thicker and more radially extensive anvil. The details of the model strategy of the RRTMG scheme without CRF follow the previous studies (Bu et al., 2014; Ruppert et al., 2020). The CRF is the interaction of hydrometeors with radiation. The CRF-off removes the diurnal cycle in the radiative forcing and the period of the anvil development. In WRF, the CRF in the RRTMG scheme is controlled by the physics parameter “icloud” in the name list. The other model settings are the same as that of CTL. Consistent with CTL, noR was initialized at 0000 UTC 6 August, and the model was integrated for 48 h.
Lekima (2019) was formed as a tropical depression on 0600 UTC 04 August, 2019, and strengthened into a typhoon in the following 2 days. At the initial time (i.e., 0000 UTC 6 August), the central minimum sea level pressure (CMSLP) was 985 hPa. Thereafter, an RI period was evident from 0000 UTC 6 August to 0000 UTC 8 August. Figure 1 gives the simulated and observed TC intensities represented by the CMSLP and the maximum wind speed. The CTL simulation captures well the RI. Specifically, during the 48-h integration period, the CMSLP dropped by about 65 hPa to be 920 hPa and the maximum wind speed increased by about 60 kts to be 112 kts, which satisfy the criteria for RI for western North Pacific TCs (Wang and Zhou, 2008). In contrast, the entity in noR intensified slowly. Specifically, the CMSLP is about 952 hPa and the maximum wind speed is about 95 kts, which are much weaker than those in CTL at the end of integration.
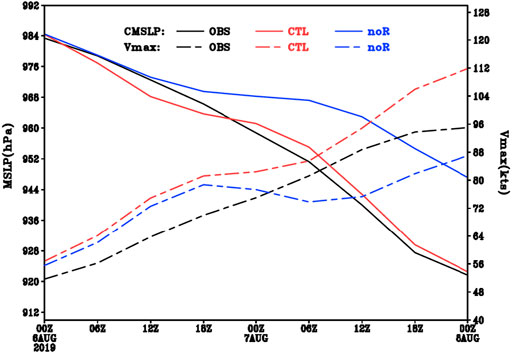
FIGURE 1. Observed and simulated intensities of Lekima from 00 UTC 06 to 00 UTC 08 August 2019. The solid lines indicate the CMSLP (units: hPa), and the dotted lines are the maximum wind speed (units: kts).
The VWS in this case is the northeasterly wind, determined by the difference between 2- and 16-km level wind fields. In general, a tilted vortex induces an asymmetric wavenumber one structure of convection under the VWS. To verify the simulated tilt-induced convective activity, Figure 2 presents the simulated radar reflectivity at 5-km height in CTL (left panels) and the satellite-observed infrared brightness temperatures (right panels) during the RI period. In both CTL and observation, there exists a wavenumber one asymmetric convection distribution. Initially, the maximum radar reflectivity was located in the DSL quadrant and started to move counterclockwise to the US side shortly after a 12-h integration (Figures 2A–C). Initially, the strong convective cloud band, represented by the coldest temperature, occurs to the southwest section of the TC center. With time, the strongest convection is expanded to the US side, and the eyewall cloud becomes more symmetric. During the period of interest, the inner cloud band within 200 km from the TC center extends southeastward (US side). Overall, the simulated cloud asymmetry in CTL agrees fairly well with the satellite-observed infrared brightness temperatures (Figures 2D–F). Given the reasonably good performance of CTL, we use these simulated results as the proxy of the real atmosphere.
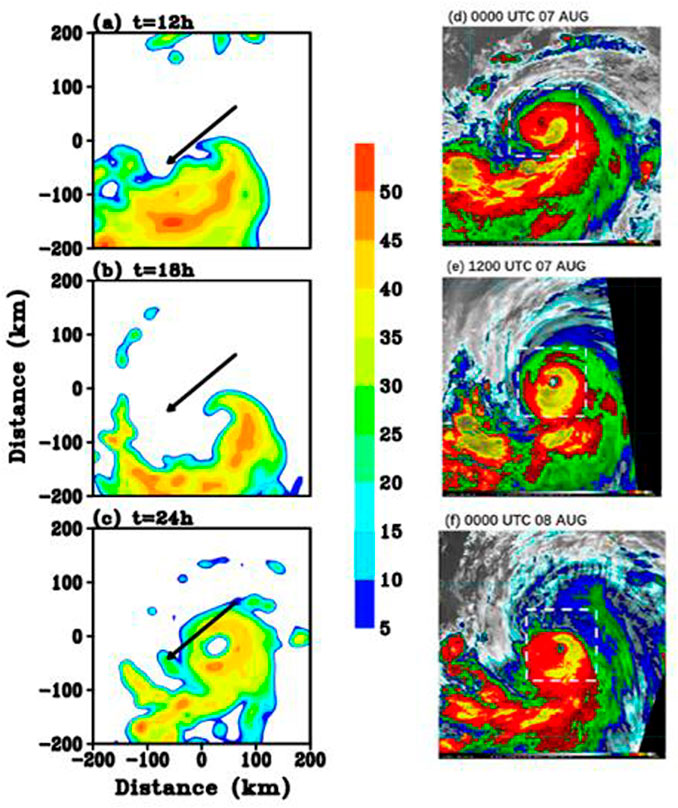
FIGURE 2. Left panels: snapshot at 12, 18, and 24 h of the radar reflectivity at 5-km height (shaded; units: dBZ) and the VWS between 15 and 2 km (black vectors; units: m s−1) at 17 km starting on 0000 UTC 6 August. Right panels: the time evolution of the satellite-observed infrared brightness temperatures from 0000 UTC 7 August to 0000 UTC 8 August on the NOAA website. The white dashed box in the right panels is the 200 × 200 km area centered by the TC, covering the same area as in the left panels.
Figures 3, 4 compare the two snapshots of the distribution of the vertical velocity at different layers (i.e., z = 1.5 km, z = 5 km, and z = 15 km) in CTL and noR, respectively. In CTL (Figure 3A), a strong convective activity with vertical velocity greater than 2 m s−1 is initially located at the southwest quadrant at 06 UTC 6 August. During the time of interest, the CBs move counterclockwise to the US side at 00 UTC 7 August (Figure 4B), which is consistent with the atypical RI event reported in previous studies (Ryglicki et al., 2018a; Ryglicki et al., 2018b; Wadler et al., 2018; Li et al., 2020). The strong upward motion in the USL is mainly located at the upper level, which indicated that the cyclonic rotation developed to the deep convection during the RI period. Figure 4 shows the vertical velocity in noR at three layers. Both experiments show similar patterns at the early stage, 6 h into the integration. That is, the convections were mainly located at the southwest flank of the storm (Figures 3A, 4A). It is likely that the model takes times to achieve CRF of comparable spatial extent and magnitude. With time, there are distinct differences in terms of the magnitude of the convection in two simulations. During the time of interest, the upward motion around RMW in noR is weaker than that in the CTL. The intensity of deep convection slightly weakened and did not show cyclonically inward propagation (Figure 4B).
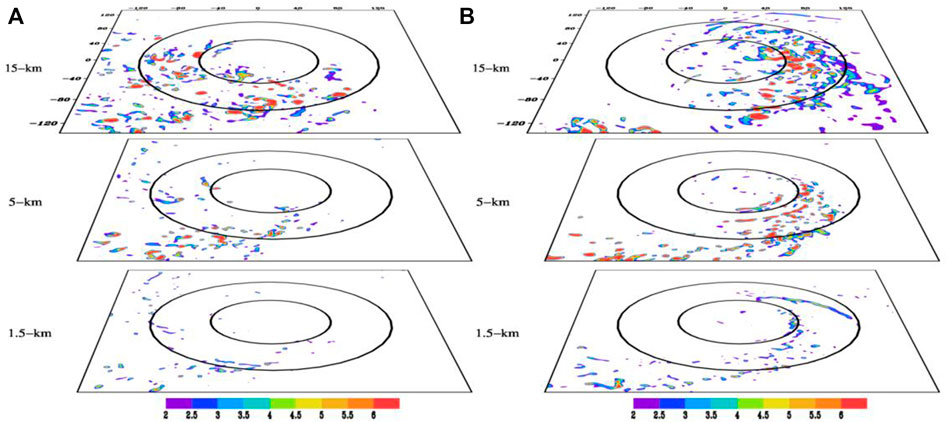
FIGURE 3. The two snapshots of the composed layers of vertical velocity field (units: m s−1) at the height of 1.5, 5, and 15 km in CTL on 06 UTC 06 and 00 UTC 07 August, respectively. Black circles are radii at every 50 km.
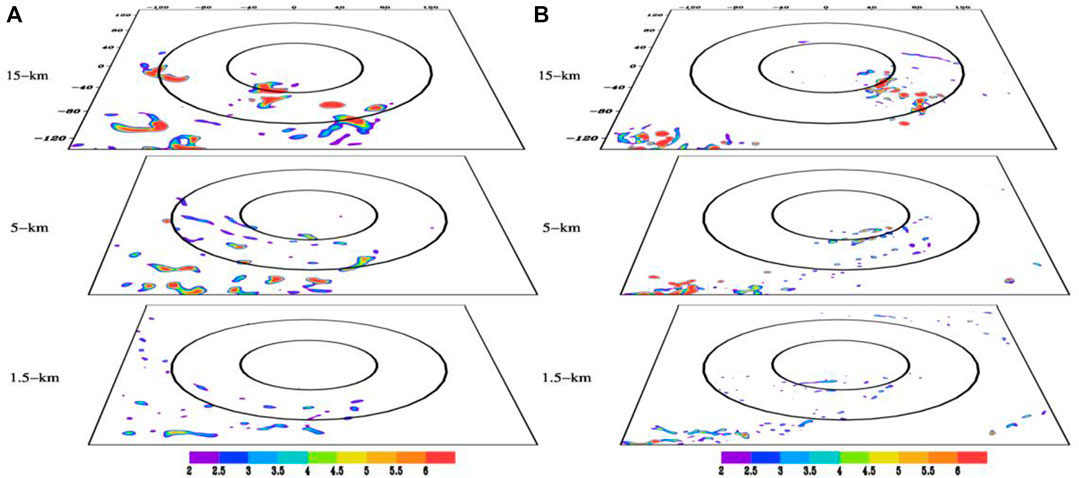
FIGURE 4. As in Figure 3, but in noR.
To further demonstrate such differences, the contoured frequency by altitude diagrams (CFADs; Yuter and Houze, 1995) of vertical velocity for different quadrants within the 180-km radii is compared. The CFADs clearly illustrate the frequency distribution of vertical velocity of indicated values at different altitudes. In CTL, at 06 UTC 6 August, updrafts stronger than 2 m s−1 occur more frequently at the upper level in the DSL and DSR quadrants (Figures 5A,D). Initially, the strongest convection is located around the DSL, indicating a convection initialization therein. In the US quadrants, there are no significant asymmetries, reflecting both weak ascending and descending motions. At 00 UTC 7 August, the modal distribution tilts toward stronger vertical velocity with height, implying that the strong upward motion is mainly located at the upper level. Notice that there are more substantial structural changes in the US side than in the downshear side (Figures 5E–H). Namely, the USL quadrant has more intense upper-level updrafts than the USR quadrant (Figures 5F,G).
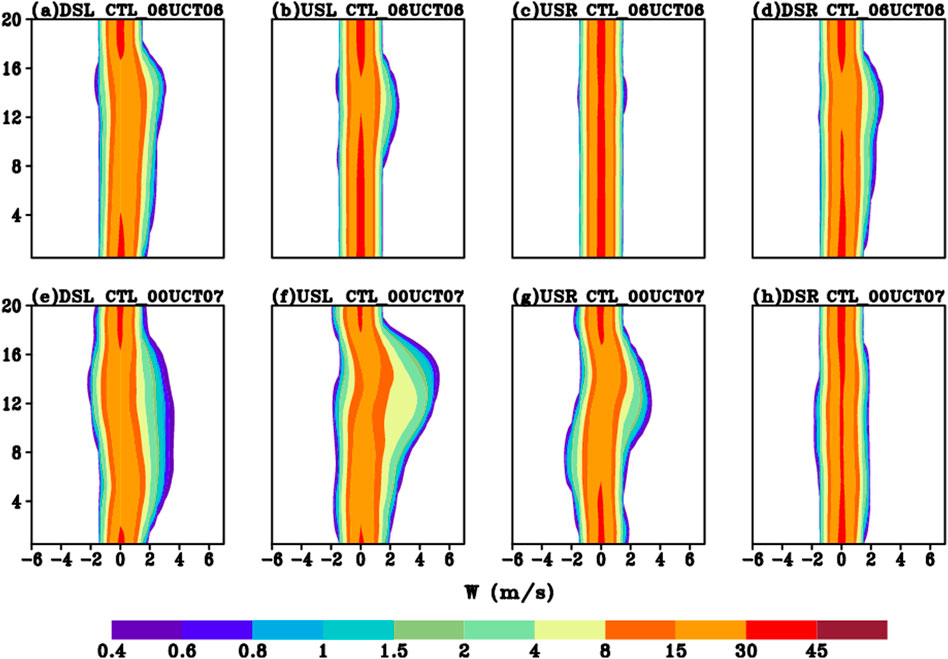
FIGURE 5. Snapshots of 06 UTC 06 and 00 UTC 07 August of the contoured frequency by altitude diagrams (CFADs) of vertical velocity separated according to shear quadrant (units: %). With the shear vector pointing left, the quadrants are (A, E) DSL, (B, F) USL, (C, G) USR, (D, H) DSR in CTL.
Figure 6 displays the snapshots of CFAD of vertical velocity in noR. At the early stage, the vertical velocity is weaker in the US quadrants. Meanwhile, the strong updrafts are primarily located at the upper level in the DSL, which is similar to CTL. At 00 UTC 7 August, the portion of stronger vertical motion increases in both DSL and USL, but the stronger vertical velocity for the updrafts is mainly in the DSL. In USL, the peak occurs around the height of 15 km (Figure 6F), indicating an enhanced deep convection as well. Nevertheless, the value of this peak is smaller than that in CTL (Figure 5F). To clearly illustrate the differences, Figure 7 presents the differences in CFADs of vertical velocity at four quadrants between CTL and noR. In this study, the values are obtained by CTL minus noR. Compared between CTL and noR, at 06 UTC 6 August, the vertical velocity for the updrafts was stronger in the former, except those larger than 3 m s−1 at the height between 8 and 16 km in DSL (Figure 7A). The ascending motion in DSR and USL is stronger in CTL than in noR (Figures 7B,D). The difference is more evident in the downshear quadrants. At 00 UTC 7 August, the most striking differences appear in the DSL and USL quadrants. As shown in Figure 7E, the value of the portion of weak ascending motion (i.e., w <2 m s−1) is negative, indicating a weakening deep convection. Meanwhile, the difference of the strong updrafts (i.e., w >2 m s−1) is insignificant in DSL. However, the value of such convection becomes positive in USL, especially above the height of 8 km, suggesting an enhanced upper-level deep convection therein. Recall that in CTL, the active activity initially appears in DSL and then moves cyclonically toward USL. Accompanied by this transition, the upper-level upward motion becomes pronounced. Provided that a higher frequency of upper-level convection in USL as the storm development, the TC intensity in CTL is much stronger than that in noR, which agrees with Wadler et al. (2018). This result also agrees with Tao and Jiang (2015), who found that the intensifying TC has a large portion of CBs in the USL compared with the steady one.
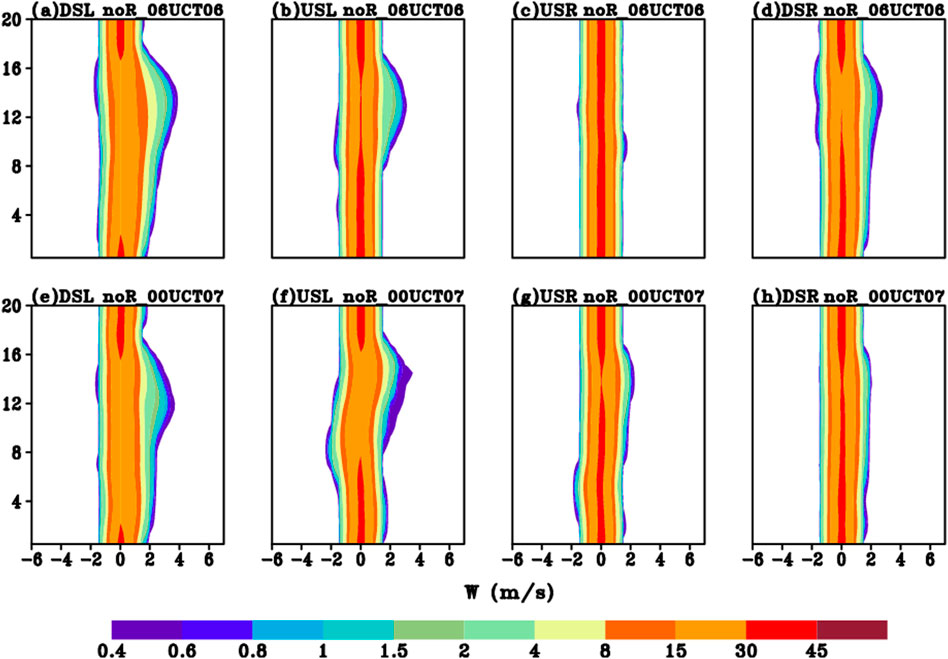
FIGURE 6. As in Figure 5, but in noR.
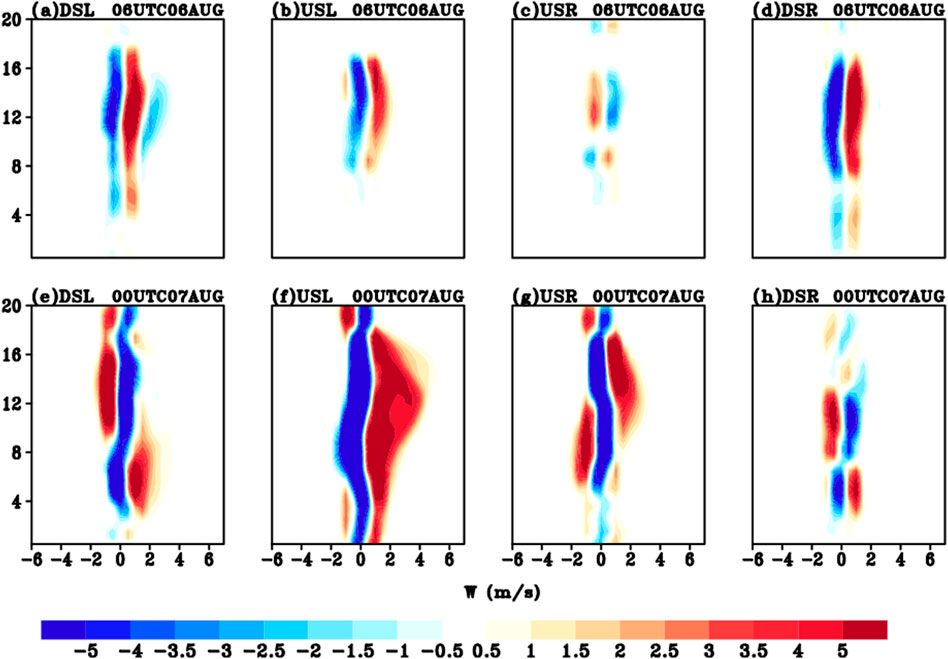
FIGURE 7. The differences of CFADs of vertical velocity (units: %) for each shear quadrant between CTL and noR at 06 UTC 6 and 00 UTC 7 August.
To summarize, the results demonstrate that, in CTL, the asymmetric convection induced by VWS is transported from the initially downshear quadrant to the US quadrant, which is different from the general feature of the downshear convection under VWS. However, the active convection in noR is weaker than that in CTL and mainly remained in DSL. In the next section, we will investigate the possible roles of different TCA in affecting the TC outflow layer.
TC outflow is the dominant upper component of the TC secondary circulation. Generally, it has low inertial stability and thus expands radially thousands of kilometers and can interact with the environmental flow. The pattern of the outflow channel largely depends on the relative location of the TC and its environmental flow. Ryglicki et al. (2019) found that the divergent outflow forced by deep convection localized by the tilt of the vortex serves to divert the background environmental flow around the TC, thus reducing the ambient VWS. Given the different convective activities between CTL and noR, it is inspiring to examine the upper outflow circulations.
To isolate the divergent flow induced by the diabatic heating, a PV-ω equation (Wang and Zhang, 2003) is applied. This dynamical framework is based on an equation system in three-dimensional pseudo-height coordinates, which considers the diabatic heating, the friction, and the dynamic forcing factors.
where
Figure 8 presents the simulated upper-level circulation at the height of 15 km and the diabatic heating in CTL. The simulated storm in CTL with CRF active has a large amount of convection and diabatic heating outside the radius of maximum wind (about 60 km). There is a prevailing easterly flow, indicating an upper easterly VWS (Huang et al., 2021). Due to the model spin-up, it will take some time initially to trigger convection. As such, a weak divergent flow is forced by the weak diabatic heating in the beginning. Over time, the enhanced deep convection moves toward the US flank, and a pronounced divergent flow is evident. For instance, at 18 UTC 06 August, the strongest divergent winds are focused on the US flank, which meets with the environmental flow to generate a boundary referred to as the “outflow front” that exists about 200 km radially outward US of the storm center (Ryglicki et al., 2019). This front typically exists between 200 and 300 km radially outward US of the low-level center. Accordingly, the upper divergent flow is the dominated source of the blocking, whereas the rotational winds are largely deformed (not shown).
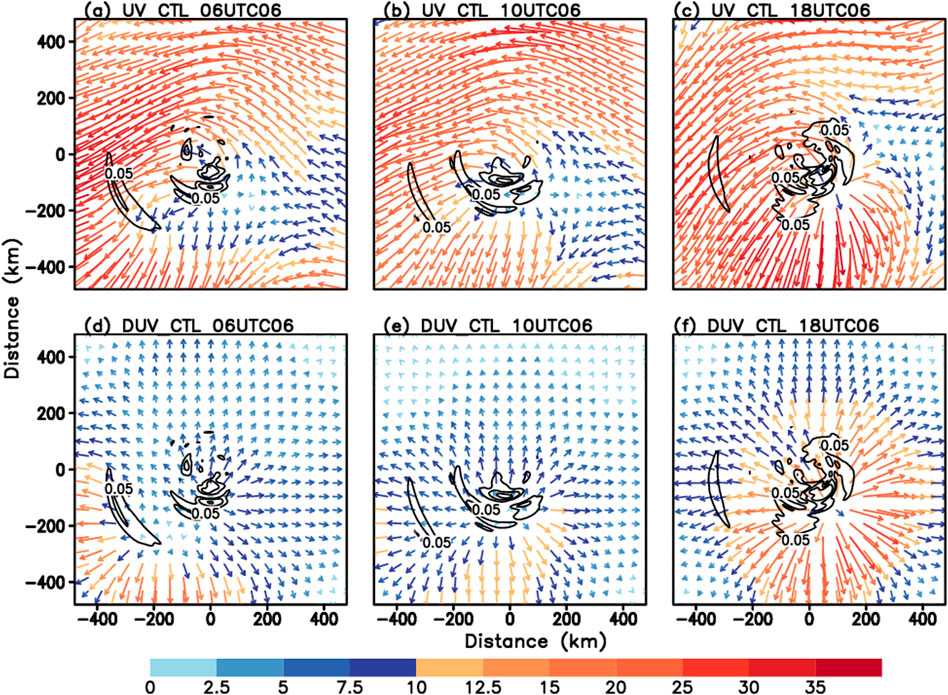
FIGURE 8. Upper panels: the time evolution of the wind circulation (vector, units: m s−1) and the diabatic heating (black contour, units: K/h) at 15-km height in CTL. Lower panels: the time evolution of the divergent wind (vector, units: m s−1) and the diabatic heating (black contour, units: K/h) at 15-km height in CTL.
In noR (Figure 9), the early upper-level circulation is similar to that in CTL. Compared with that in CTL, the induced divergent flow is much weaker and occupies a relatively smaller area. It is likely due to the different magnitude of diabatic heating source that correlated with the convection. The smaller active convections and diabatic heating with CRF turned off compared to those with CTL. The comparison clearly demonstrates that the upper-level divergent flow is naturally driven by the diabatic heating. To emphasize the importance of deep convection, we further subdivide the diabatic heating source into upper- and lower-level components. Specifically, the heating rate above (below) the height of 8 km is taken as the upper (lower)-level part. By applying these two separated forcings, the PV-ω method shows that the divergent outflow is primarily induced by the upper-level diabatic heating, whereas the lower-level diabatic heating plays a neglectable role (not shown). This result further suggests that the divergent wind in the outflow layer is mainly determined by the upper-level deep convection particularly in the USL quadrant in this case.
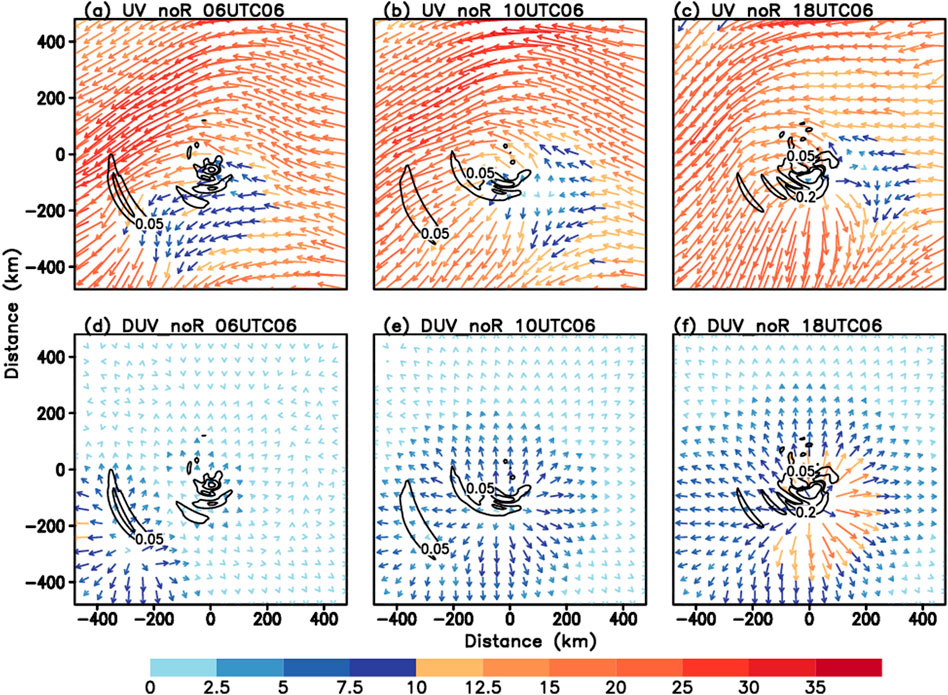
FIGURE 9. As in Figure 8, but in noR.
The PV-ω method clearly shows that the strengthening outflow forced by the diabatic heating plays an important role in blocking the environmental flow, reducing the upper-level environmental flow and thus the magnitude of VWS. To demonstrate this possibility, Figure 10 presents the time evolution of the vertical profiles of the steering flows in CTL and noR, respectively. Initially, the vertical profiles of the steering flows are nearly identical in both experiments. The environmental winds are southwesterly (northeasterly) below (above) about 8 km, indicating a moderate upper easterly shear. Compared with the large wind at the upper levels, the wind is relatively small at the lower levels, indicating an upper-level VWS. The difference is mainly located at the upper level during the time of interest. The easterly wind at the upper level decreases more largely with time in CTL than in noR resulting from the strong divergent wind at the outflow layer in the former. The initial VWS is a strong shear with the magnitude in 15 m s−1 (Figure 10B). Thereafter, albeit with some oscillations, the magnitude of VWS generally decreases with time, which is in the range of moderate-to-strong shear (Molinari et al., 2004; Molinari et al., 2006; Ryglicki et al., 2019). More specifically, in CTL, the magnitude of VWS reached the minimum value (i.e., 7 m s−1) about 12 UTC 06 August, which is smaller than its counterpart. That is, in noR, the VWS reduced much more slowly and the minimum value is about 10 m s−1. A closer examination shows that the reduction of VWS is mainly ascribed to the weakening of environmental easterly at the upper level. The weakening of the easterly wind at the upper level is closely determined by the blocking effect of divergent flow. In short, a strong divergent flow exerts a greater blocking effect to resist the VWS and is favorable for TC intensification.
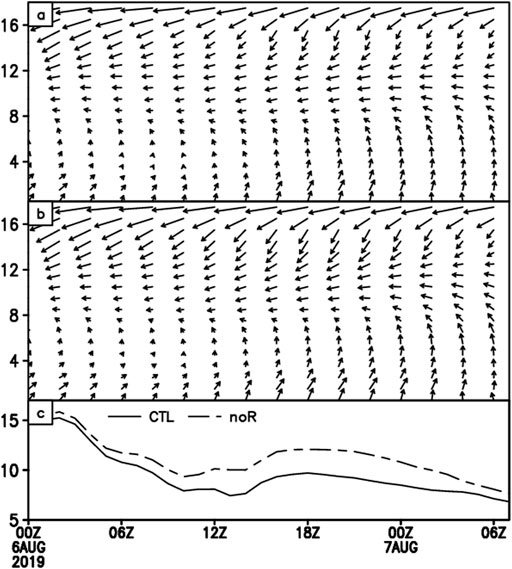
FIGURE 10. The time evolution of the vertical profiles of the steering flows (units: m s−1) in (A) CTL, (B) noR, and (C) the total wind speed for the vertical wind shear (16–2 km height; units: m s−1) from 6 to 7 August.
The results above show marked differences in the evolution of deep convection between CTL and noR, especially in the USL region. Since the only difference is that the CRF is excluded in noR, it may help explain why the CRF-active storms possessed stronger convection maintained at the upper level. To this end, we will focus on its possible mechanisms in this section.
Previous studies (Bu et al., 2014; Fovell et al., 2016) pointed out that, in response to CRF that can influence the TC structure, TC is characterized by enhanced upper-tropospheric outflow. It is hypothesized that the TC outflow channel transports the hydrometeors outward, leading to a progressively wider cloud anvil, at least in the upper troposphere (Huang et al., 2021). The wider cloud anvil will have a greater potential to interact with the radiative processes. To demonstrate the radiative effect on the outflow of TC, the Sawyer–Eliassen (SE) diagnosis is used to derive the transverse circulation forced by the radiation. The SE equation in the radius-pseudo-height coordinates (Hendricks et al., 2004) can be written as:
where z is the pseudo height, r is the radius, and
Figure 11 displays the forced transverse stream function and the associated secondary circulation by the temperature tendency due to radiation averaged from 07 UTC 6 to 18 UTC 6 August. Not surprisingly, there is a salient difference of the net radiative field in the two experiments. In CTL, the profile represents a dipole with a cooling (warming) tendency above (below) the height of 16 km, where the top of the cloud anvil is located. This is a typical radiative heating structure of stratiform cloud cover (Tao et al., 1996; Yang and Tan, 2020). Huang et al. (2021) found that a large concentration of ice-phased particles is collocated with the cloud anvil of the outflow layer. Meanwhile, they suggested that this thermal pattern leads to a reduction of static stability in a larger area, favoring the development of deep convection. The large cooling (0.3 K/h) at the cloud top is likely due to the longwave (LW) radiative, the warming rate up to 0.3 K/h is situated between the height of 8 and 15 km, and a negative value is farther below. In contrast, there is generally an opposite tendency in noR with a cooling (warming) tendency below (above) the outflow layer. Furthermore, the magnitudes of both cooling and warming rates are weaker than those in CTL. Accordingly, the distinctly different distributions of the net radiative forcing will induce different secondary circulations.
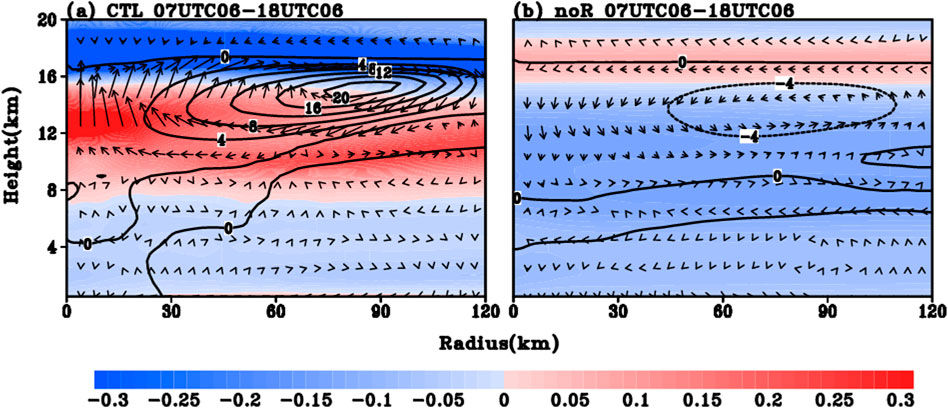
FIGURE 11. The radius-height cross section of the averaged upper-level radiation (shaded; units: K/h), the forced transverse stream function (contour; units: m s−1), and the associated secondary circulation (vector; units: m s−1) from 07 UTC 6 to 18 UTC 6 August in (A) CTL and (B) noR, respectively.
In CTL, a transverse circulation is evident between the height of 8 and 16 km (Figure 11A). In general, a radial inflow occurs at around 12 km, and a radial outflow emanates at a higher altitude (i.e., the height of 16 km). In response to this circulation, the upper radial outflow will enhance the outflow channel. Furthermore, the radial inflow around the height of 12 km helps the development of the vortex and thus favors a deeper vertical structure of storm. Furthermore, an upward motion is induced in the inner core region, bringing more upward water vapor flux and then resulting in more latent heating at upper levels. On the contrary, there is a weaker transverse circulation in noR with a weaker net radiative forcing. Yang and Tan (2020) found that the large concentration of ice-phased particles at high levels is critical to spinning up the midlevel vortex. The radiative interaction with upper-level hydrometers leads to an increase in the vertical diabatic heating gradient and then the intensification of the midlevel vortex. Previous studies (Ruppert and Hohenegger, 2018; Huang et al., 2021) also found that the temperature tendency change due to CRF will modify the static stability, which is possibly the primary driver of the invigoration of deep convection.
In short, the SE balanced dynamic framework illustrates that the CRF will impact the secondary circulation (i.e., outflow layer), which is consistent with Fovell et al. (2016). They also suggested that the upper-level thermal structure forced by the CRF likely has a certain effect on the TC intensification through modulating the outflow channel. Specifically, the CRF effect promotes the development of outflow channels and the TC secondary circulation. This CRF acts as positive feedback, assisting in the development of the outflow channel with a thicker and more radially extended anvil (see Huang et al., 2021 Figure 13). In turn, the wider cloud anvil has a greater potential to interact with the radiative process to modulate the upper thermal structure. Moreover, this impact can be simply understood in terms of the maximum potential intensity (MPI) theory (Emanuel, 1986), in which a lower outflow temperature implies a higher thermal efficiency and thus a stronger TC intensity. The CRF-on CTL experiment shows that the net radiative cooling is generated at the top of the cloud anvil associated with the outflow layer. Next, we will investigate the thermal efficiency in terms of energy budget.
For a steady-state TC, the work done by the TC to spin up and expand the outflow anticyclone may have an impact on intensification rates or affect its ability to achieve MPI. The balance between total heating and dissipation in the inflow and outflow may be written symbolically:
where
where the definition of the absolute angular momentum is
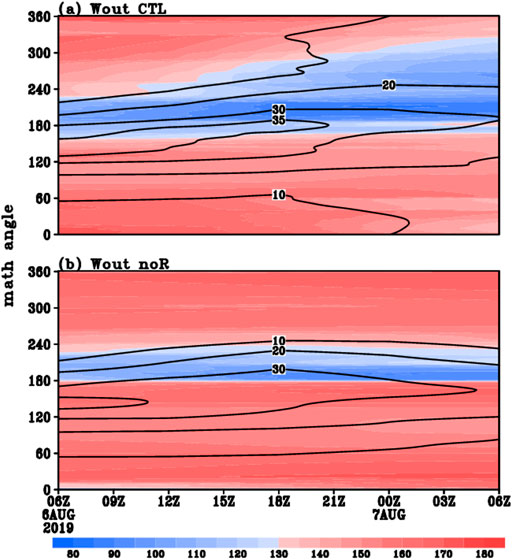
FIGURE 12. The time revolution of the energy sinks to the idealized Carnot cycle at each azimuth in the outflow layer from 06 UTC 6 August to 06 UTC 7 August in (A) CTL and (B) noR. Azimuth angles are math convention, such that the azimuthal angle 0° is defined as north (right of shear), 90° is defined as east (down shear), 180° represents southward (left of shear), and 270° represents westward (up shear).
To further illustrate the evolution characteristics of the energy efficiency, Figure 13 shows the ratio of the work done in the outflow layer to the net heat energy (
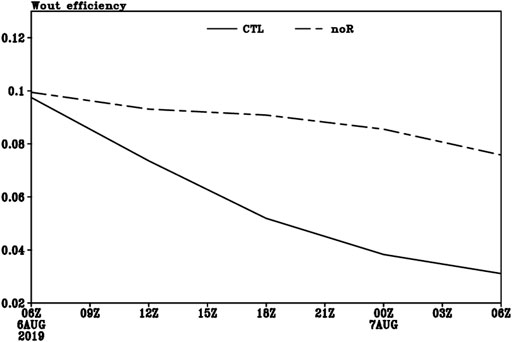
FIGURE 13. The time evolution of the ratio of the work done in the outflow layer to the total net heat energy in CTL and noR.
Super typhoon Lekima (2019) in the western North Pacific went through an atypical RI under an upper-level VWS. During the period of RI, the initially DSL active convection moved counterclockwise to the US flank. In this study, a comprehensive analysis on the possible processes leading to the evolution of tilt-induced convective asymmetry is conducted by using a pair of numerical simulation. In the control experiment, the model reproduces reasonably well the evolution characteristics of convective activity. In the sensitivity experiment, the cloud–radiation interaction is artificially turned off. Accordingly, the model fails to capture the observed USL deep convection. The focus is on the possible role of cloud–radiation interaction forcing on the development of TCA and its relationship with upper outflow jet during the RI period. The main findings are summarized as the follows:
1) Under the VWS, a close relationship exists between the outflow layer and the deep convection in the US side. The enhanced upward motion on the US side favors the establishment of the outflow divergent flow. The strong upper-level divergent flow acts against the environmental flow to reduce the VWS and thus helps in the sequential vertical realignment. This result supports previous studies that emphasized the important role of USL convection in RI.
2) The cloud–radiation interaction acts as positive feedback in the upper-level outflow layer. On the one hand, the radiative process associated with the cloud anvil will induce upper (lower) cooling (warming) above (within) the cloud anvil of the outflow layer. This thermodynamical pattern locally destabilizes the upper troposphere and is conducive to enhance the deep convection. On the other hand, the enhanced deep convection provides the energy source to promote the upper divergent flows. The stronger divergent flow acts efficiently to block the VWS and leads to a wider outflow channel. The larger outflow layer has a great influence due to the CRF.
Our simulations suggest that the cloud–radiation interaction feedback has a potential effect on the evolution of TCA that moves to the US side, which is an important driver for the divergent flow. The enhanced convective activity in the USL quadrant effectively leads to a stronger secondary circulation, a broader outflow layer circulation. With this regard, this CRF assists in the development of a thicker and more radially extensive anvil than that CRF-off simulation. This is consistent with Fovell et al. (2016). In addition to the influence of the cloud–radiation interaction on the outflow layer to accelerate the TC development, our study reveals that CRF has effect on the evolution of asymmetric convection (i.e., magnitude and movement). The results help gain the insights on the prevailing USL convection and its role in the atypical RI event.
Different from the pathway of CRF which accelerates the TC development by accelerating the mid-level vortex (Ruppert et al., 2020; Yang et al., 2021), this study confirms the outflow blocking effect against the VWS. Physically, the CRF impact is closely associated with the distribution of cloud. With this regard, the CRF likely plays varied roles in the different regions or development stages. In the current study, the pronounced CRF effect is closely associated with TCA during the RI onset period. For the latter stage, along with the development of the inner-core convection, the CRF impact will be dominated in the inner region accordingly. Meanwhile, the different cloud types (i.e., convective and stratiform clouds) may induce different radiative impacts. These important issues need further investigation. Moreover, the formation of atypical TCA that moves to the US side is a complicated process, including both internal and external interactions. For instance, the southwesterly monsoon flow in the southeastern flank of TC provides abundant moisture and thus favors prolific convection. Moreover, the superposition monsoon flow and TC circulation is likely a potential factor in affecting TCA by changing the surface heat fluxes. As such, the enhanced surface heat fluxes will help the recovery of equivalent potential temperature from the DSL side, supporting the downstream development of deep convection in the USL side. Therefore, more future works will focus on these topics.
The raw data supporting the conclusions of this article will be made available by the authors, without undue reservation.
QH and XG designed and executed the experiments. XG and MB analyzed the data and wrote the article.
This work was jointly sponsored by the National Natural Science Foundation of China (42088101; 42175003; 41805039) and the Science and Technology Innovation Project of Ningbo (Grant No. 2019B10025).
The authors declare that the research was conducted in the absence of any commercial or financial relationships that could be construed as a potential conflict of interest.
All claims expressed in this article are solely those of the authors and do not necessarily represent those of their affiliated organizations, or those of the publisher, the editors, and the reviewers. Any product that may be evaluated in this article, or claim that may be made by its manufacturer, is not guaranteed or endorsed by the publisher.
The numerical calculations are performed on the supercomputing system in the Supercomputing Center of Nanjing University of Information Science & Technology.
Braun, S. A., Montgomery, M. T., and Pu, Z. (2006). High-resolution Simulation of Hurricane Bonnie (1998). Part I: The Organization of Eyewall Vertical Motion. J. Atmos. Sci. 63, 19–42. doi:10.1175/jas3598.1
Bu, Y. P., Fovell, R. G., and Corbosiero, K. L. (2014). Influence of Cloud-Radiative Forcing on Tropical Cyclone Structure. J. Atmos. Sci. 71, 1644–1662. doi:10.1175/jas-d-13-0265.1
Chen, X., Wang, Y., Zhao, K., and Wu, D. (2017). A Numerical Study on Rapid Intensification of Typhoon Vicente (2012) in the South China Sea. Part I: Verification of Simulation, Storm-Scale Evolution, and Environmental Contribution. Mon. Wea. Rev. 145, 877–898. doi:10.1175/mwr-d-16-0147.1
Dai, Y., Majumdar, S. J., and Nolan, D. S. (2019). The Outflow-Rainband Relationship Induced by Environmental Flow Around Tropical Cyclones. J. Atmos. Sci. 76, 1845–1863. doi:10.1175/jas-d-18-0208.1
Dai, Y., Majumdar, S. J., and Nolan, D. S. (2021). Tropical Cyclone Resistance to Strong Environmental Shear. J. Atmos. Sci. 78 (4), 1275–1293. doi:10.1175/jas-d-20-0231.1
DeHart, J. C., Houze, R. A., and Rogers, R. F. (2014). Quadrant Distribution of Tropical Cyclone Inner-Core Kinematics in Relation to Environmental Shear. J. Atmos. Sci. 71, 2713–2732. doi:10.1175/jas-d-13-0298.1
DeMaria, M., Sampson, C. R., Knaff, J. A., and Musgrave, K. D. (2014). Is Tropical Cyclone Intensity Guidance Improving? Bull. Amer. Meteorol. Soc. 95, 387–398. doi:10.1175/bams-d-12-00240.1
Dudhia, J. (1989). Numerical Study of Convection Observed during the Winter Monsoon Experiment Using a Mesoscale Two-Dimensional Model. J. Atmos. Sci. 46, 3077–3107. doi:10.1175/1520-0469(1989)046<3077:nsocod>2.0.co;2
Elsberry, R. L., and Jeffries, R. A. (1996). Vertical Wind Shear Influences on Tropical Cyclone Formation and Intensification during TCM-92 and TCM-93. Mon. Wea. Rev. 124, 1374–1387. doi:10.1175/1520-0493(1996)124<1374:vwsiot>2.0.co;2
Emanuel, K. A. (1986). An Air-Sea Interaction Theory for Tropical Cyclones. Part I: Steady-State Maintenance. J. Atmos. Sci. 43, 585–605. doi:10.1175/1520-0469(1986)043<0585:aasitf>2.0.co;2
Fischer, M. S., Tang, B. H., Corbosiero, K. L., and Rozoff, C. M. (2018). Normalized Convective Characteristics of Tropical Cyclone Rapid Intensification Events in the North Atlantic and Eastern North Pacific. Mon. Wea. Rev. 146 (4), 1133–1155. doi:10.1175/mwr-d-17-0239.1
Fovell, R. G., Bu, Y. P., Kristen, L. C., Tung, W., Cao, Y., Kuo, H., et al. (2016). Influence of Cloud Microphysics and Radiation on Tropical Cyclone Structure and Motion. Meteorol. Monogr. 56, 11.1–11.27. doi:10.1175/amsmonographs-d-15-0006.1
Gu, J.-F., Tan, Z.-M., and Qiu, X. (2015). Effects of Vertical Wind Shear on Inner-Core Thermodynamics of an Idealized Simulated Tropical Cyclone. J. Atmos. Sci. 72, 511–530. doi:10.1175/jas-d-14-0050.1
Hendricks, E. A., Montgomery, M. T., and Davis, C. A. (2004). The Role of “Vortical” Hot Towers in the Formation of Tropical Cyclone Diana (1984). J. Atmos. Sci. 61, 1209–1232. doi:10.1175/1520-0469(2004)061<1209:trovht>2.0.co;2
Huang, Q., Ge, X., and Peng, M. (2021). Simulation of Rapid Intensification of Super Typhoon Lekima (2019). Part I: Evolution Characteristics of Asymmetric Convection under Upper-Level Vertical Wind Shear. Front. Earth Sci. 9, 739507. doi:10.3389/feart.2021.739507
Kain, J., and Fritsch, J. M. (1993). “Convective Parameterization for Mesoscale Models: The Kain-Fritsch Scheme,” in The Representation of Cumulus Convection in Numerical Models. Editors K. A. Emanuel, and D. J. Raymond (Boston, MA: American Meteorological Society), 24, 246.
Leighton, H., Gopalakrishnan, S., Zhang, J. A., Rogers, R. F., Zhang, Z., and Tallapragada, V. (2018). Azimuthal Distribution of Deep Convection, Environmental Factors, and Tropical Cyclone Rapid Intensification: A Perspective from HWRF Ensemble Forecasts of Hurricane Ddouard (2014). J. Atmos. Sci. 75, 203–227. doi:10.1175/jas-d-17-0171.1
Li, X., Davidson, N. E., Duan, Y., Tory, K. J., Sun, Z., and Cai, Q. (2020). Analysis of an Ensemble of High-Resolution WRF Simulations for the Rapid Intensification of Super Typhoon Rammasun (2014). Adv. Atmos. Sci. 37, 187–210. doi:10.1007/s00376-019-8274-z
Lin, Y.-L., Farley, R. D., and Orville, H. D. (1983). Bulk Parameterization of the Snow Field in a Cloud Model. J. Clim. Appl. Meteorol. 22, 1065–1092. doi:10.1175/1520-0450(1983)022<1065:bpotsf>2.0.co;2
Merrill, R. T. (1988). Characteristics of the Upper-Tropospheric Environmental Flow Around Hurricanes. J. Atmos. Sci. 45, 1665–1677. doi:10.1175/1520-0469(1988)045<1665:cotute>2.0.co;2
Mlawer, E. J., Taubman, S. J., Brown, P. D., Iacono, M. J., and Clough, S. A. (1997). Radiative Transfer for Inhomogeneous Atmospheres: RRTM, a Validated Correlated-K Model for the Longwave. J. Geophys. Res. 102, 16663–16682. doi:10.1029/97jd00237
Molinari, J., and Vollaro, D. (2010). Rapid Intensification of a Sheared Tropical Storm. Mon. Wea. Rev. 138, 3869–3885. doi:10.1175/2010mwr3378.1
Molinari, J., Vollaro, D., and Corbosiero, K. L. (2004). Tropical Cyclone Formation in a Sheared Environment: A Case Study. J. Atmos. Sci. 61, 2493–2509. doi:10.1175/jas3291.1
Molinari, J., Dodge, P., Vollaro, D., Corbosiero, K. L., and Marks, F. (2006). Mesoscale Aspects of the Downshear Reformation of a Tropical Cyclone. J. Atmos. Sci. 63, 341–354. doi:10.1175/jas3591.1
Munsell, E. B., Zhang, F., Sippel, J. A., Braun, S. A., and Weng, Y. (2017). Dynamics and Predictability of the Intensification of Hurricane Edouard (2014). J. Atmos. Sci. 74, 573–595. doi:10.1175/jas-d-16-0018.1
Nguyen, L. T., and Molinari, J. (2012). Rapid Intensification of a Sheared, Fast-Moving hurricane over the Gulf Stream. Mon. Wea. Rev. 140, 3361–3378. doi:10.1175/mwr-d-11-00293.1
Rappin, E. D., Morgan, M. C., and Tripoli, G. J. (2009). The Impact of Outflow Environment on Tropical Cyclone Intensification and Structure. J. Atmos. Sci. 68, 179–194. doi:10.1175/2009JAS2970.1
Reasor, P. D., Eastin, M. D., and Gamache, J. F. (2009). Rapidly Intensifying Hurricane Guillermo (1997). Part I: Low-Wavenumber Structure and Evolution. Mon. Wea. Rev. 137, 603–631. doi:10.1175/2008mwr2487.1
Reasor, P. D., Rogers, R., and Lorsolo, S. (2013). Environmental Flow Impacts on Tropical Cyclone Structure Diagnosed from Airborne Doppler Radar Composites. Mon. Wea. Rev. 141, 2949–2969. doi:10.1175/mwr-d-12-00334.1
Rogers, R., Chen, S., Tenerelli, J., and Willoughby, H. (2003). A Numerical Study of the Impact of Vertical Shear on the Distribution of Rainfall in Hurricane Bonnie (1998). Mon. Wea. Rev. 131, 1577–1599. doi:10.1175//2546.1
Rogers, R. F., Zhang, J. A., Zawislak, J., Jiang, H., Alvey, G. R., Zipser, E. J., et al. (2016). Observations of the Structure and Evolution of hurricane Edouard (2014) during Intensity Change. Part II: Kinematic Structure and the Distribution of Deep Convection. Mon. Wea. Rev. 144, 3355–3376. doi:10.1175/mwr-d-16-0017.1
Ruppert, J. H., and Hohenegger, C. (2018). Diurnal Circulation Adjustment and Organized Deep Convection. J. Clim. 31, 4899–4916. doi:10.1175/jcli-d-17-0693.1
Ruppert, J. H., Wing, A. A., Tang, X., and Duran, E. L. (2020). The Critical Role of Cloud-Infrared Radiation Feedback in Tropical Cyclone Development. Proc. Natl. Acad. Sci. USA 117, 27884–27892. doi:10.1073/pnas.2013584117
Ryglicki, D. R., Cossuth, J. H., Hodyss, D., and Doyle, J. D. (2018a). The Unexpected Rapid Intensification of Tropical Cyclones in Moderate Vertical Wind Shear. Part I: Overview and Observations. Mon. Wea. Rev. 146, 3773–3800. doi:10.1175/mwr-d-18-0020.1
Ryglicki, D. R., Doyle, J. D., Jin, Y., Hodyss, D., and Cossuth, J. H. (2018b). The Unexpected Rapid Intensification of Tropical Cyclones in Moderate Vertical Wind Shear. Part II: Vortex Tilt. Mon. Wea. Rev. 146, 3801–3825. doi:10.1175/mwr-d-18-0021.1
Ryglicki, D. R., Doyle, J. D., Hodyss, D., Cossuth, J. H., Jin, Y., Viner, K. C., et al. (2019). The Unexpected Rapid Intensification of Tropical Cyclones in Moderate Vertical Wind Shear. Part III: Outflow-Environment Interaction. Mon. Wea. Rev. 147, 2919–2940. doi:10.1175/mwr-d-18-0370.1
Smith, R. K., and Montgomery, M. T. (2015). Toward Clarity on Understanding Tropical Cyclone Intensification. J. Atmos. Sci. 72, 3020–3031. doi:10.1175/jas-d-15-0017.1
Smith, W. P., Nicholls, M. E., and Pielke, R. A. (2020). The Role of Radiation in Accelerating Tropical Cyclogenesis in Idealized Simulations. J. Atmos. Sci. 77, 1261–1277. doi:10.1175/jas-d-19-0044.1
Tao, C., and Jiang, H. (2015). Distributions of Shallow to Very Deep Precipitation-Convection in Rapidly Intensifying Tropical Cyclones. J. Clim. 28, 8791–8824. doi:10.1175/jcli-d-14-00448.1
Tao, W.-K., Lang, S., Simpson, J., Sui, C.-H., Ferrier, B., and Chou, M.-D. (1996). Mechanisms of Cloud-Radiation Interaction in the Tropics and Midlatitudes. J. Atmos. Sci. 53, 2624–2651. doi:10.1175/1520-0469(1996)053<2624:mocrii>2.0.co;2
Tao, C., Jiang, H., and Zawislak, J. (2017). The Relative Importance of Stratiform and Convective Rainfall in Rapidly Intensifying Tropical Cyclones. Mon. Wea. Rev. 145, 795–809. doi:10.1175/mwr-d-16-0316.1
Wadler, J. B., Zhang, J. A., Jaimes, B., and Shay, L. K. (2018). Downdrafts and the Evolution of Boundary Layer Thermodynamics in Hurricane Earl (2010) before and during Rapid Intensification. Mon. Wea. Rev. 146, 3534–3565. doi:10.1175/mwr-d-18-0090.1
Wang, X., and Zhang, D.-L. (2003). Potential Vorticity Diagnosis of a Simulated Hurricane. Part I: Formulation and Quasi-Balanced Flow. J. Atmos. Sci. 60, 1593–1607. doi:10.1175/2999.1
Wang, B., and Zhou, X. (2008). Climate Variation and Prediction of Rapid Intensification in Tropical Cyclones in the Western North Pacific. Meteorol. Atmos. Phys. 99, 1–16. doi:10.1007/s00703-006-0238-z
Wang, Y., Rao, Y., Tan, Z.-M., and Schönemann, D. (2015). A Statistical Analysis of the Effects of Vertical Wind Shear on Tropical Cyclone Intensity Change over the Western North Pacific. Mon. Wea. Rev. 143, 3434–3453. doi:10.1175/mwr-d-15-0049.1
Wing, A. A., Camargo, S. J., and Sobel, A. H. (2016). Role of Radiative-Convective Feedbacks in Spontaneous Tropical Cyclogenesis in Idealized Numerical Simulations. J. Atmos. Sci. 73, 2633–2642. doi:10.1175/jas-d-15-0380.1
Wong, M. L. M., and Chan, J. C. L. (2004). Tropical Cyclone Intensity in Vertical Wind Shear. J. Atmos. Sci. 61, 1859–1876. doi:10.1175/1520-0469(2004)061<1859:tciivw>2.0.co;2
Yang, B., and Tan, Z.-M. (2020). Interactive Radiation Accelerates the Intensification of the Midlevel Vortex for Tropical Cyclogenesis. J. Atmos. Sci. 77, 4051–4065. doi:10.1175/jas-d-20-0094.1
Yang, B., Nie, J., and Tan, Z. M. (2021). Radiation Feedback Accelerates the Formation of Typhoon Haiyan (2013): The Critical Role of Mid-level Circulation. Geo. Res. Let. 48, e2021GL094168. doi:10.1029/2021gl094168
Yuter, S. E., and Houze, R. A. (1995). Three-dimensional Kinematic and Microphysical Evolution of Florida Cumulonimbus. Part II: Frequency Distributions of Vertical Velocity, Reflectivity, and Differential Reflectivity. Mon. Wea. Rev. 123, 1941–1963. doi:10.1175/1520-0493(1995)123<1941:tdkame>2.0.co;2
Zeng, Z., Wang, Y., and Wu, C.-C. (2007). Environmental Dynamical Control of Tropical Cyclone Intensity-An Observational Study. Mon. Wea. Rev. 135, 38–59. doi:10.1175/mwr3278.1
Zeng, Z., Chen, L., and Wang, Y. (2008). An Observational Study of Environmental Dynamical Control of Tropical Cyclone Intensity in the Atlantic. Mon. Wea. Rev. 136, 3307–3322. doi:10.1175/2008mwr2388.1
Zhang, D.-L., and Kieu, C. Q. (2006). Potential Vorticity Diagnosis of a Simulated Hurricane. Part II: Quasi-Balanced Contributions to Forced Secondary Circulations. J. Atmos. Sci. 63, 2898–2914. doi:10.1175/jas3790.1
Zhang, F., and Tao, D. (2013). Effects of Vertical Wind Shear on the Predictability of Tropical Cyclones. J. Atmos. Sci. 70, 975–983. doi:10.1175/jas-d-12-0133.1
Keywords: tropical cyclone outflow layer, rapid intensification, asymmetric convection, cloud-radiation force, vertical wind shear
Citation: Huang Q, Ge X and Bi M (2022) Simulation of Rapid Intensification of Super Typhoon Lekima (2019). Part II: The Critical Role of Cloud-Radiation Interaction of Asymmetric Convection. Front. Earth Sci. 9:832670. doi: 10.3389/feart.2021.832670
Received: 10 December 2021; Accepted: 27 December 2021;
Published: 10 February 2022.
Edited by:
Guanghua Chen, Institute of Atmospheric Physics (CAS), ChinaReviewed by:
Nannan Qin, Fudan University, ChinaCopyright © 2022 Huang, Ge and Bi. This is an open-access article distributed under the terms of the Creative Commons Attribution License (CC BY). The use, distribution or reproduction in other forums is permitted, provided the original author(s) and the copyright owner(s) are credited and that the original publication in this journal is cited, in accordance with accepted academic practice. No use, distribution or reproduction is permitted which does not comply with these terms.
*Correspondence: Xuyang Ge, eHV5YW5nQG51aXN0LmVkdS5jbg==
Disclaimer: All claims expressed in this article are solely those of the authors and do not necessarily represent those of their affiliated organizations, or those of the publisher, the editors and the reviewers. Any product that may be evaluated in this article or claim that may be made by its manufacturer is not guaranteed or endorsed by the publisher.
Research integrity at Frontiers
Learn more about the work of our research integrity team to safeguard the quality of each article we publish.