 Ziran Jiang1
 Qiaomu Qi
- 1State Key Laboratory of Oil and Gas Reservoir Geology and Exploitation, Chengdu University of Technology, Chengdu, China
- 2College of Geophysics, Chengdu University of Technology, Chengdu, China
We propose a simple rock physics model for the characterization of elastic properties of shale. The model combines a dual-porosity concept and the effective medium theory for constructing the anisotropic elastic tensor of the multimineral organic-rich shale. Based on the model, we address how to estimate two key shale gas evaluation parameters, i.e., crack density and gas saturation from well-log and seismic data. Application to Wufeng-Longmaxi Shale shows that the estimated crack porosity decreases with increasing burial depth and decreasing clay content. The analysis indicates that the microcracks are mainly developed among clay minerals, which is consistent with the results from mercury injection and SEM imaging experiments. More importantly, we show that the velocity of the Wufeng-Longmaxi Shale is primarily controlled by the crack porosity instead of the total porosity. Both P- and S-wave velocities decrease linearly as the volume of microcrack increases. The fluid substitution analysis shows that the Poisson’s ratio and P-impedance of the shale are sensitive to the change of pore-fluid saturation. Based on the above sensitivity analyses, we customize a rock physics template for quantifying crack density, and gas saturation from the shale elastic properties. The interpretation results show that there is an overall good agreement between the measured and predicted petrophysical properties from well-log and seismic data.
1 Introduction
Quantitative seismic interpretation is the core of shale gas reservoir identification and evaluation. During the exploration stage, seismic data are employed to determine buried depth, thickness, and structural shape of the shale reservoir (Rich and Ammerman, 2010; Bachrach et al., 2014; Jiang et al., 2019). This is followed by applying the inversion technique for mapping the distribution of organic matter content, porosity and this leads to the determination of the favorable area with economical gas potential (Chopra et al., 2012). In the development stage, the seismic technology is used to determine the mechanical and anisotropy characteristics of the reservoir, so as to provide the basis for the deployment of horizontal wells, and well bore design and fracturing stimulation (Goodway et al., 2010; Sena et al., 2011). Understanding the relationship between the elastic and petrophysical properties of shale is fundamental to the geophysical research of shale gas exploration and development. Shale gas reservoir has complex lithologic, pore and structural characteristics. Among them, the compactness caused by low porosity and low permeability is a more obvious feature of shale gas reservoir (Passey et al., 2010). Former empirical formulas and theoretical rock physics models developed for conventional clastic and carbonate formations may not be applicable for shale gas reservoirs.
A lot of work have been done around the experimental and theoretical investigations of shale elastic properties. Vernik and Nur (1992); Vernik and Liu (1997) measured the elastic anisotropy of Bakken Shale under dry conditions. They analyzed the effects of organic matter content and maturity on rock velocity and anisotropy. They pointed out that the kerogen has a dramatic effect on seismic velocity and the anisotropy of shale is largely controlled by the preferred direction of minerals and micro-fractures. Sondergeld et al. (2000); Sondergeld and Rai (2011) conducted experimental study on the acoustic properties of Kimmeridge Shale and found that the anisotropy of shale increases with increasing organic matter content. The increase of organic matter content will lead to the decrease of density, resulting in the effect opposite to compaction. They also showed that the assumption of weak anisotropy (Thomsen, 1986) cannot be used in the seismic modeling of shale. Domnesteanu et al. (2002); Deng et al. (2009) studied the velocity and attenuation of shale under different saturation and pressure conditions using ultrasonic transmission technique. The experimental results suggest that there is a strong link between the pressure-dependent anisotropy of velocity/attenuation and the pore geometry, connectivity and the response of pore fluid to the propagation direction of the seismic waves. Hornby et al. (1994) combined the self-consistent approximation (SCA) and the differential effective medium (DEM) theories to characterize the seismic elastic properties of Kimmeridge Shale. In the model, clay is treated as the supporting matrix that forms the continuous skeleton of the rock, other minerals such as quartz, feldspar, and pyrite are regarded as isolated inclusions dispersedly distributed in clay. Carcione et al. (2011) used Backus average to evaluate the effect of clay particle orientation on the elastic properties and anisotropy of shale. Guo et al. (2013) developed a seismic petrophysical model of organic-rich shale and investigated the effects of pore shape and mineral composition on the elastic properties of shale.
Organic-rich shale exhibits relatively higher resistivity, higher sonic transit-time and lower density than nonorganic rich sediments (Passey et al., 2010). Tight shale hydrocarbon reservoirs are characterized by total porosity in the range of 3–7% and matrix permeability in the range of micro-to nano-Darcy. The seismic elastic properties of shale are controlled by its own structural characteristics. The key to analyze its seismic elastic properties and influencing factors is to accurately describe the structural characteristics of shale at microscale including the spatial distribution of main constituent minerals, organic matter, and pore structure (Vasin et al., 2013; Luan et al., 2016). Due to the differences in sedimentary history and depositional environment (i.e., stress field change, mineral composition, etc.) of different reservoir rocks, the petrophysical experimental results for specific reservoirs are also regional, and can not be extrapolated arbitrarily (Zhao et al., 2020; Deng et al., 2021). Therefore, it is important to establish site-specific rock physics model to characterize the local elastic properties of shale.
Natural cracks in shale provide necessary fluid conduits for shale gas migration and can greatly enhance the seepage capacity (Guo et al., 2014; Wu et al., 2020). The degree of microcracks contributes to the total porosity which affects the storage capacity of shale reservoir. The evaluation of microcrack volume is of great importance for the exploration and development of shale gas. On the other hand, shale gas saturation is important for predicting reservoir performance in terms of production (Lucier et al., 2011; Qi et al., 2017). Accurate estimation of gas saturation remains as one of the most difficult tasks associated with shale reservoir characterization (Rezaee, 2015; Qi et al., 2021). In order to predict the rock and fluid parameters of gas shale by geophysical methods, it is necessary to establish the relationship between elastic properties and petrophysical parameters. In this work, we address an important issue of estimating two key shale gas evaluation parameters, i.e., crack density and gas saturation from well-log and seismic data. The paper is organized as follows: first, we introduce a simple but effective rock physics modeling scheme for organic-rich shale. Then, we demonstrate how this model can be applied to the inversion of pore structures, fluid substitution, and reservoir characterization with rock physics template. This is followed by the discussion on the novelty and applicability of the model. Finally, we elaborate the main conclusions and set the basis for future works.
2 Methodology
In this work, we propose a simple anisotropic dual-porosity effective medium model (ADPM) for calculating the elastic property of the organic rich shales. The microstructure of the organic-rich shale can be extremely complex (Vanorio et al., 2008; Uvarova et al., 2014; Qi et al., 2021). The pores of different shapes, such as intergranular pores and microcracks, can develop between or on the edges of the rock matrix minerals such as quartz, and clay. Intraparticle pores of nanoscale can also develop among the organic matter. Despite the complex nature of the shale microstructure, we assume that at any specific logged depth location, the shale porosity system (ϕtotal) can be simplified and divided into two spaces: the stiff-pore space (stiff-porosity) and the microcrack space (crack-porosity), i.e.,
Stiff porosity (ϕstiff) and crack porosity (ϕcrack) are defined here as the volumetric fraction of spheres with larger aspect ratio and oblate spheroid inclusions with very small aspect ratio, respectively. The key to our assumption is that we do not consider how the different pore structures fit into the rock frame since their distributions can be arbitrary and are unknown. Later we show that this assumption greatly simplifies the modeling (inversion) procedure and yields results that are consistent with laboratory and field measurements. With the above dual-porosity model, we propose the following rock physics workflow for modeling shale elastic properties.
First, since different components in the organic-rich shale possess very different stiffness, an accurate mineralogy analysis is crucial for constructing the right rock matrix to start with. First of all, we can obtain the volume fraction of the mineral content in shale from the spectral gamma-ray (well-log) or the X-ray diffraction analysis (core sample). When the exact mineralogy of shale cannot be assessed, simple gamma-ray log can be used to provide an estimate for the volumes of silt and clay in the formation. The mineralogy of the organic-rich shale can be broadly divided into the brittle minerals, clay and kerogen components. The brittle minerals include quartz, carbonate and pyrite whereas the kerogen is the typical soft material. When the volume fractions of each component are determined, we can apply the Voigt-Reuss-Hill average (Mavko et al., 2009) to compute the isotropic effective moduli of the brittle mineral aggregate. Because the shale anisotropy is mainly caused by the lamination of clay and kerogen, we use a three-phase Backus average (Backus, 1962; Vernik and Nur, 1992) to mix the brittle minerals, clay and kerogen. This procedure yields the anisotropic effective moduli of multimineral solid matrix.
The organic-rich shale is typically of low porosity and low permeability with poor pore connectivity. These shales may contain randomly distributed microcracks with crack size below well-log resolution. Theoretical estimates of the effective moduli of the cracked porous shale not only depend on the volume fraction of the inclusions (i.e., cracks and pores) but also the geometric details of shapes and spatial distributions of these inclusions. Several effective medium theories can be used to estimate the effective moduli of the shale. In this work, we use the anisotropic self-consistent approximation (SCA) theory to compute the stiffness tensor of the shale frame. The choice of the SCA model is due to the following consideration. Since the inclusion adding process in the SCA theory is a symmetrical process, it does not identify a specific phase as the host material. This is different for the differential effective medium (DEM) theory. Due to the difference in depositional and diagenetic processes, shale can transits from clay-supporting matrix to quartz-supporting matrix as the burial depth changes (Zhao et al., 2020; Deng et al., 2021). The reservoir section usually contains shales of more than one type. Therefore, we consider the SCA model is more flexible and can adapt to more complex lithologic enviroment. By incorporating the dual-porosity concept into the SCA modeling scheme, the effective stiffness tensor of the shale can be written as
where,
and i represents the matrix (m) or the pore spaces (stiff, crack), I is the identity tensor. Ci is the stiffness tensor matrix of the i-th phase. Gi is a fourth-rank tensor calculated from the response of an unbounded matrix of the effective medium Eshelby (1957); Mura (1982).
Brown and Korringa (1975) extended the Gassmann’s equations and established the model suitable for fluid replacement in anisotropic media such as shale. On the basis of dry shale model, we apply the Brown-Korringa’s (BK) equation to compute the stiffness tensor of the saturated shale. In the BK model, the compliance of the saturated shale is given by
where
The fluid compliance depends on the bulk moduli of brine Kw and gas Kg, the gas saturation Sg and an empirical exponent e. The empirical exponent e varies from 1 for patchy saturation to 3.4 for uniform saturation. They provide the upper and lower bounds for the effective bulk modulus of the mixed fluids, respectively. We can substitute the equivalent compliance of brine-gas mixture (5) into the BK model (4) to replace the empty pores with fluids.
Based on the above anisotropic dual-porosity model, the equivalent elastic tensor of fluid saturated rock can be converted to velocities according to the relationship provided by Thomsen (1986). For a vertical well, the acoustic logging tool records the P- and S-waves traveling perpendicular to the bedding plane, that is parallel to the axis of symmetry of the transversely isotropic shale formations. The expressions for these velocities are
where C33 and C44 are the stiffnesses in Voigt notation. ρ is the effective density of the shale, which can be calculated by the volume average of the grain and fluid densities
To test the effectiveness and applicability of the APDM model, in the following sections, we apply the rock physics model to a suite of analyses including pore type inversion, shear-log prediction, fluid substitution, and seismic reservoir characterization.
3 Rock Physics Analysis
3.1 Geological Background
We conduct rock physics analysis on the organic-rich shale in the Wufeng-Longmaxi Formation. The Wufeng-Longmaxi Shale are widespread units, and their geologic characteristics are similar to five of the leading shale gas producing basins in North America (Pollastro, 2007; Guo and Liu, 2018; Xu et al., 2019). Therefore, establishing a quantitative characterization model for the Wufeng-Longmaxi Shale would have global impacts. Well-Y1 is a shale gas exploration well located in a shale gas field in Southern Sichuan Basin, China. The section in Figure 1 is composed of the lower Silurian Longmaxi formation and the upper Ordovician Wufeng formation. The organic-rich shale at the lower part, which shows high gamma and low density, and is the main target layer. The thickness of organic-rich shale in well-Y1 is 67 m, the total organic carbon content (TOC) is 1.8–4.8 wt%, and the thermal maturity is 2.5–3.0. All geological evaluation parameters show that Wufeng-Longmaxi Formation in the work area has superior conditions for shale gas accumulations.
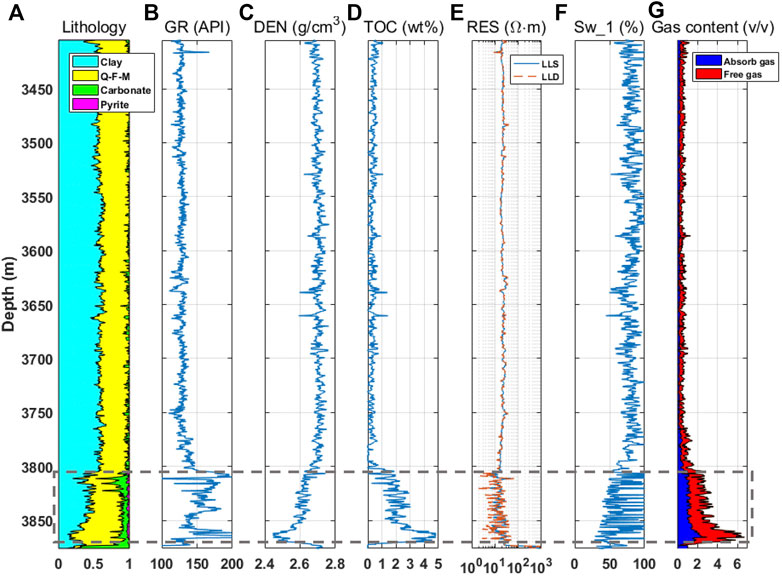
FIGURE 1. The logging data of Well-Y1 from a shale gas field in Southern Sichuan Basin: (A) mineral components; (B) gamma-ray; (C) density; (D) total organic content (TOC); (E) shallow (LLS) and deep (LLD) resistivities; (F) water saturation evaluated based on resistivity; (G) absorb and free gas contents.
As shown in Figure 2, measurements of density, gamma ray, shallow- and deep-resistivities, compressional, and shear velocities are available. The porosity can be calculated based on the density log. In these reservoirs, the total porosity varies from 2 to 10% with an average value of 5%. Figure 2A shows that the average values of clay, quartz, and carbonate are 38, 48, and 11%, respectively. Pyrite is also present, ranging from trace amounts to as much as 7%. The quartz is present in the form of silt and siliceous cement. TOC is estimated from resistivity and sonic logs using the method of Passey et al. (1990). The Wufeng-Longmaxi shale reservoir is a typical low-resistivity reservoir as indicated by Figure 1E. Conventional resistivity method, such as Archie’s equation (Han T.-C. et al., 2021), will lead to overestimation on the water saturation as shown in Figure 1F. To overcome this problem, water saturation is estimated using the neutron-density porosity difference method (Qi et al., 2021). Figure 2D shows that the corrected water saturation value varies from 18 to 100% in the reservior section. In the rock physics modeling, the bulk moduli and densities of the brine and gas of in-situ pressure and temperature are estimated using the equations of Batzle and Wang (1992). The elastic moduli and densities for the minerals and pore-fluids are presented in Table 1.
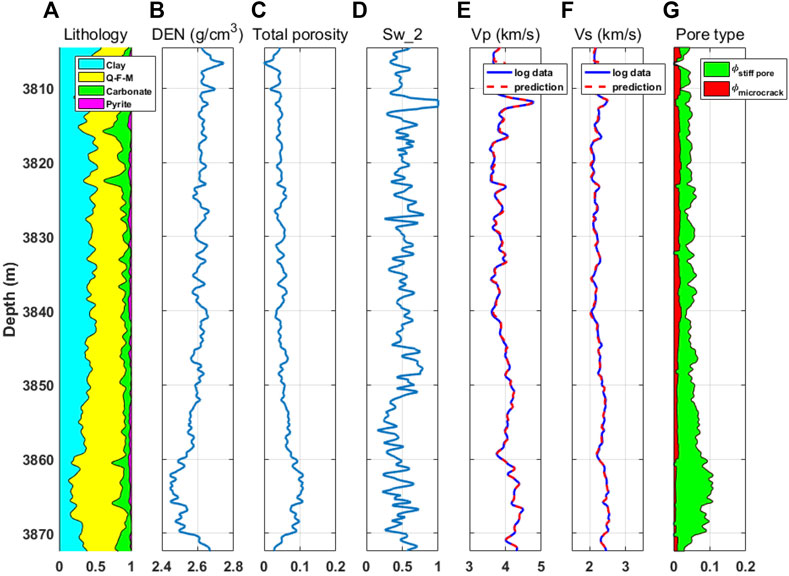
FIGURE 2. The logging data of the target section in Well-Y1 (this corresponds to the bottom part of the logging data in Figure 1): (A) mineral components; (B) density; (C) total porosity; (D) water saturation evaluated based on neutron-density method; (E) measured and predicted P-wave velocities; (F) measured and predicted S-wave velocities; (G) porosities of microracks and stiff pores.
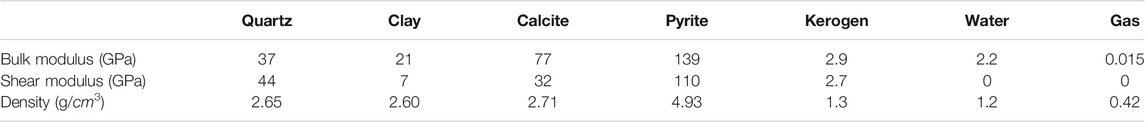
TABLE 1. The bulk, shear moduli and density of the primary minerals and fluids in shale.
3.2 Inversion of Different Pore Volume Fractions
The rock physics model provides a nonlinear relation between P- and S-wave velocities and the volume fractions of soft and stiff pores. Using this relation, we can forward calculate the P- and S-wave velocities of rocks based on rock and fluid properties including mineral moduli, porosity, and fluid saturation and pore aspect ratio. Alternatively, we can determine the stiff and soft porosities by matching well-log velocity data with theoretically predicted velocities. Here, we assume that the stiff pores and microcracks are spheroidal inclusions with aspect ratios of 1 and 0.01, respectively. Thus, we keep the pore aspect ratio as constant at all depths in the inversion procedure. The choice of aspect ratio 1 for stiff pore is based on the fact that sphere is the stiffest among all pore shapes. For cracks of small aspect ratio, the key parameter is the crack density ϵ = 3ϕcrack/4παcrack (O’Connell and Budiansky, 1974), which is proportional to the crack porosity divided by the aspect ratio. The choice of exact crack aspect ratio value is of secondary importance. We also assume that all cracks have identical shapes, i.e., aspect ratios. In this case, the effect of crack porosity on elastic moduli is equivalent to the crack density (Vernik, 2016). To determine the volume fractions of cracks and stiff pores from sonic-log data, we propose the following objective function
where Vobs and Vmodel are the measured and modelled velocities, respectively. Wp, Ws are the weights, for case that the shear-log is not available, Wp = 1, Ws = 0 and when both compressional- and shear-logs are available, Wp = 0.5, Ws = 0.5. By minimizing the objective function (9), ϕcrack and ϕstiff are jointly inverted from two velocities Vp and Vs. A grid search method can be applied to find the two porosities required to accomplish the velocity match at each well-logging depth. Other formation properties such as mineral component, total porosity and fluid saturation are provided by the well-log data.
The estimated crack and stiff porosities are plotted in Figure 2G. We see that the microcracks are well developed in the upper and middle parts of the Wufeng-Longmaxi Shale. As the burial depth increases, the amount of microcracks diminishes and the pore-space is dominated by stiff pores. The average porosities of the crack and stiff pores in the reservoir section are 0.012 and 0.043, respectively. The volume fraction of the stiff pores is 3.6 times of the microcrack overall. Figures 2E,F shows the modeled P- and S-wave velocities based on the inverted crack and stiff porosities. There is a satisfactory match between the measured and the modeled velocity. The root-mean-square error (RMSE) for the predicted P- and S-wave velocities are 34.9 m/s and 23.4 m/s, respectively. The correlation coefficients between the measured and predicted velocities are 0.992 3 for P-wave and 0.991 6 for S-wave. The consistent prediction of the two velocity logs shows that the rock physics model is effective for characterizing the elastic behavior of the shale. To further analyze the relationship between the elastic properties of shale and its pore structure, we plot the velocities as functions of different porosities. Figure 3A shows that there is a weak dependence of the velocities on the total porosity of the shale. The P-wave velocity increases slowly with increasing total porosity, which is counter-intuitive. The total porosity shows limited influence on the velocities. Figure 3B shows the relationship between the velocities and the crack porosity. Interestingly, both P- and S-wave velocities exhibit overall linear correlations with the crack porosity. A linear least-square fit provides the following relations
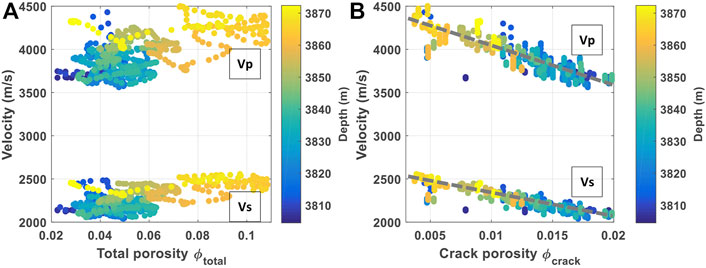
FIGURE 3. Relationship between the sonic-log velocities and different porosities: (A) velocity versus total porosity; (B) velocity versus crack porosity.
The velocities decrease as the volume of microcracks in shale increases. The clear dependence of the velocity on crack porosity shows that the presence of small-aspect-ratio cracks is a key parameter in controlling the elastic property of the Wufeng-Longmaxi Shale.
Figure 4 shows that the development of the microcracks in the Wufeng-Longmaxi Shale generally decreases as burial depth increases. The data points are color-coded by the clay content, as can be seen the crack porosity tends to increase with increasing volume of clay in shale. This observation is consistent with the laboratory results of Sun et al. (2019) who conducted mercury injection experiments to quantify the volume of microcracks in the Longmaxi shale samples. They found that the majority of the microcracks were formed inside the clay particles, followed by those developed in organic matter and brittle minerals (see more details in the discussion section). The SEM images in Figure 5 reveal the microstructure of the Wufeng-Longmaxi organic-rich shale. In Figures 5A,B, the pores between clay platelets or around the edge of rigid particles are shown as elongated, compliant shape. Whereas the intergranular pores, which have a rigid triangular structure, are mainly developed between the quartz minerals as shown in Figures 5C,D. Our observation that the microcracks are more likely to develop in the clay is consistent with both the mercury injection statistics and the actual microstructure revealed by the SEM images of the Wufeng-Longmaxi Shale. Once we determine the crack and stiff porosities of the shale formation, a detailed fluid substitution analysis can be carried out at each logged depth. This is discussed in the next section.
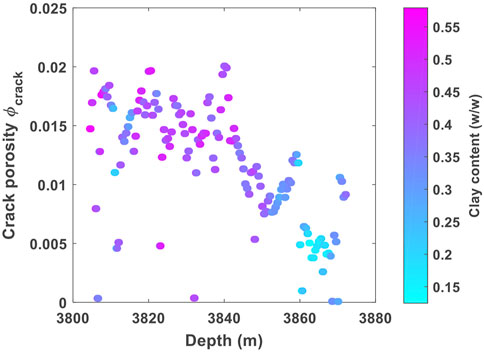
FIGURE 4. Cross-plot between the crack porosity and burial depth. The data points are color-coded by clay content.
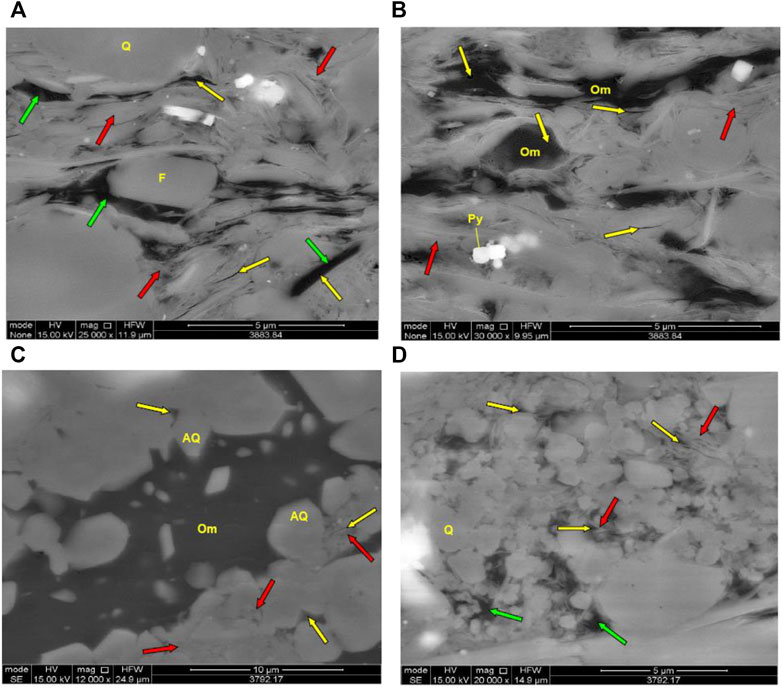
FIGURE 5. The SEM images showing the microstructure of the Wufeng-Longmaxi Shale: (A,B) shows that the pores between clay platelets or around the edge of rigid particles are of elongated, compliant shape; (C,D) shows that the intergranular pores, which have a rigid triangular structure, are mainly developed between the quartz minerals.
3.3 Fluid Substitution Analysis
Fluid substitution is important for examining the sensitivity of the elastic properties to the change of amount of fluids in the pore-space. It directly helps seismic interpreter to determine area with favorable gas potential from cross-plot of seismic attributes. With the calibrated crack and stiff porosity logs, we can conduct fluid substitution for the entire reservoir section based on the dual-porosity model. By assigning different levels of gas saturation Sg to Eq. 5 and substituting the effective fluid compressibility into Brown-Korringa’s equation, we can evaluate the elastic properties of the partially saturated shale. It has been confirmed by studies that due to low permeability and poor pore connectivity, patchy saturation instead of uniform saturation is likely to take place in tight reservoir rocks (Si et al., 2016; Li et al., 2020). We pick the exponent e = 1 in Brie’s model based on an empirical fit to the data. This corresponds to the upper bound for the velocity-saturation relation in shale.
The water saturation log in Figure 2D indicates that the gas saturation in the shale formation varies from 0 to 72% with an average value of 37%. As shown in Figure 6A, the corresponding Poisson’s ratio varies from 0.25 to 0.36 and the P-impedance varies from 0.95e4-1.2e4 g ⋅m/cm3 ⋅s. The red squares in Figure 6 represent the shale formation with full water saturation. The blue circles in Figures 6A–D denote the original well-log data and the formation with gas saturation of 30, 70 and 90%, respectively. For low formation gas saturation, the gas shale shows similar characteristics with the water shale and it is difficult to distinguish them on a Poisson’s ratio versus P-impendance cross-plot. When the gas saturation increases to 70%, both the Poisson’s ratio, and P-impedance decrease dramatically. For 90% gas saturation, the Poisson’s ratio becomes less than 0.25 and the P-impedance reduces by 9%. Overall, with favorable gas saturation larger than 70%, there exists a clear separation between the original, and substituted results on the cross-plot. This indicates that the Wufeng-Longmaxi shale is relatively sensitive to the change of pore fluid saturation. The results suggest that the cross-plot between Poisson’s ratio and P-impedance can be useful and applied to seismic inversion results for gas zone identification in the work area.
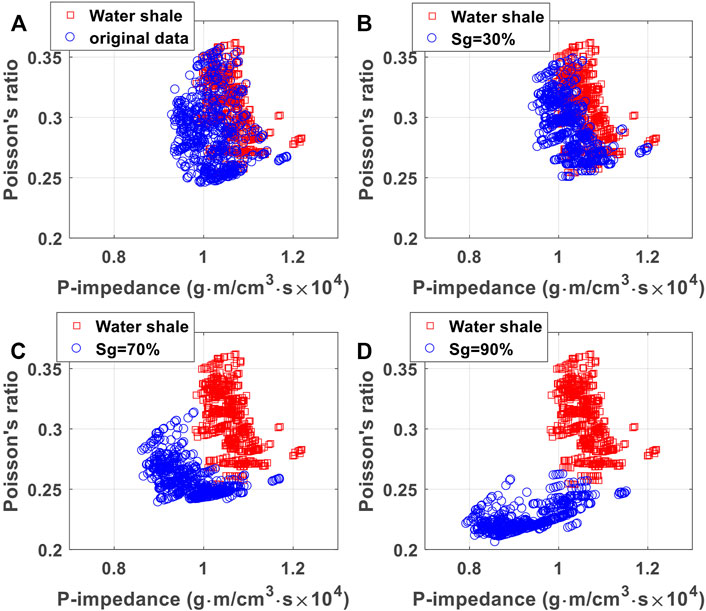
FIGURE 6. Fluid substitution results of the Wufeng-Longmaxi Formation in well-Y1. The red squares represent the formation with 100% water saturation. The blue circles represent the original well-log data in (A) and formations with gas saturations of 30, 70, and 90% in (B–D), respectively.
3.4 Seismic Characterization With Rock Physics Template
Rock physics template (RPT) is an essential tool for mapping the effect of fluids, porosity, and lithology on elastic properties such as P-, S-impedances and Vp/Vs (Avseth et al., 2010; Zhou et al., 2021). Because impedance and Vp/Vs are properties that can be obtained from seismic inversion, RPT allows quantitative interpretation and classification not only of well-logs, but also of seismic data. The main goal is to use the RPT for quantifying two primary properties, i.e., crack density and gas saturation from the well-log and seismic data in the work area. In the last two sections, we have shown that the velocities of the Wufeng-Longmaxi Shale strongly linked to the crack porosity while the Poisson’s ratio is sensitive to the fluid saturation. The P-impedance and Vp/Vs can be viewed as proxies for P-wave velocity and Poisson’s ratio, respectively. Therefore, we design the RPT so that it outputs a cross-plot between the P-impedance and Vp/Vs for quantitative interpretation. To construct the RPT, we set the crack density and gas saturation as variables in the model and fix other depth-dependent properties to reference values. For example, model parameters such as effective mineral moduli, porosity and fluid properties are defined using the average values in the reservoir section. Thus, for each crack density and gas saturation, the template predicts a pair of P-impedance and Vp/Vs.
Figure 7 shows the RPT with the data points color-coded by the well-log crack density. The RPT predicts that at high gas saturation, the Vp/Vs decreases with increasing crack density. When the gas saturation is below 60%, the Vp/Vs increases as crack density increases. The P-impedance decreases with increasing crack density at all saturations. There is a good agreement between the data and the predictions by the RPT. The crack density of the shale formation can be accurately predicted from the RPT analysis. Figure 8 presents the same RPT with the data points color-coded by the well-log saturation. Again, there is an overall excellent match between the log and predicted saturation values. The interpretation of the well-log data shows the effectiveness and accuracy of the constructed RPT. Next, we apply the RPT to the seismic data and obtain the spatial distribution of the crack density and gas saturation.
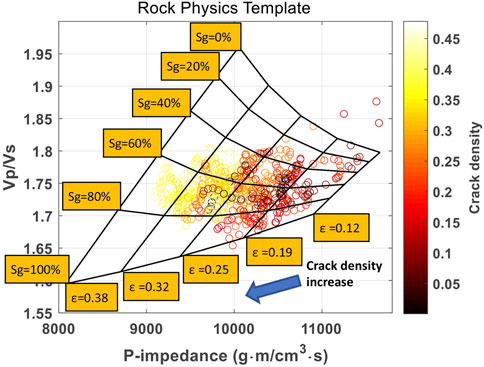
FIGURE 7. Rock physics template analysis for the interpretation of crack density and gas saturation from cross-plot between the Vp/Vs and P-impedance. The data points are from Well-1 and color-coded by crack density log. The arrow shows the direction of increasing crack density.
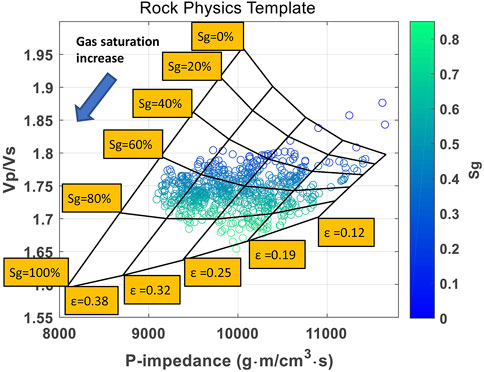
FIGURE 8. Rock physics template analysis for the interpretation of crack density and gas saturation from cross-plot between the Vp/Vs and P-impedance. The data points are from Well-1 and color-coded by gas saturation log. The arrow shows the direction of increasing gas saturation.
To obtain the seismic attributes required for RPT analysis, we perform the pre-stack seismic inversion. In the inversion process, the differences between the seismic amplitudes from different reflection angles are used to obtain the corresponding variation in the shale elastic properties. The pre-stack inversion is based on the Fatti’s reflectivity equation in terms of acoustic and shear impedances (Fatti et al., 1994). The inversion results are shown in Figure 9. The top and bottom of the shale reservoir are denoted by the horizons T1 and T2, respectively. The high-quality shale at the bottom of Longmaxi formation in the work area are characterized by low impedance (blue color stripes). We can compute the Vp/Vs by taking the ratio of P- and S-impedance volumes. Similar to the log data analysis, by projecting the seismically-derived Vp/Vs, and P-impedance onto the RPT, we can predict the corresponding crack density and gas saturation. Figure 10 shows the interpreted sections. The zones of interest can be clearly identified from the interpreted sections. The main target at the lower part of the Wufeng-Longmaxi Formation shows high gas saturation and considerable microcrack concentration. The maps indicate that the lateral distribution of high-quality shale is stable and distributed throughout the region. Such depositional pattern is consistent with the geological studies of this area (Chao et al., 2012; Liu et al., 2013). The difference in the lateral change between crack density and gas saturation can be explained by the fact that the rock and fluid property variations contribute to the change in P- and S-impedances differently (Avseth et al., 2010; Vernik, 2016). The study shows that the RPT based on dual-porosity model is an efficient tool for quantitative interpretation of the well-log and seismic data of the Wufeng-Longmaxi Shale reservoir.
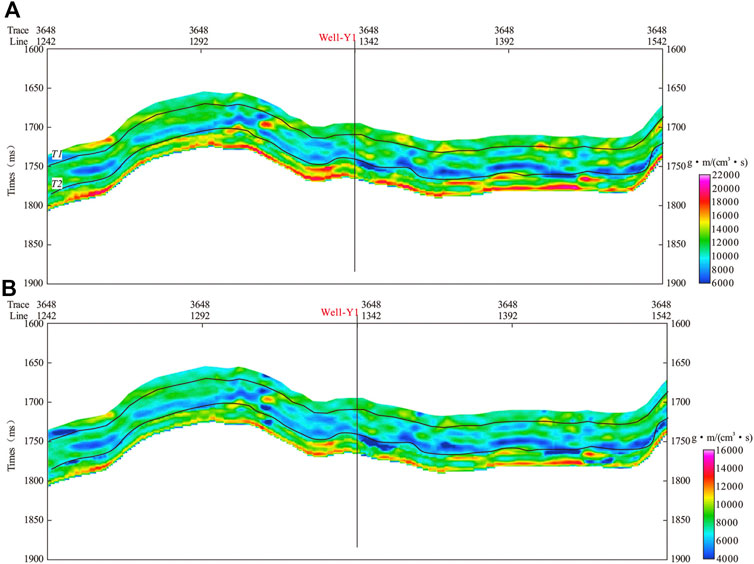
FIGURE 9. Seismic inversion results of the shale gas field: (A) acoustic impedance and (B) shear impedance. The location of Well-Y1 is indicated by the black line.
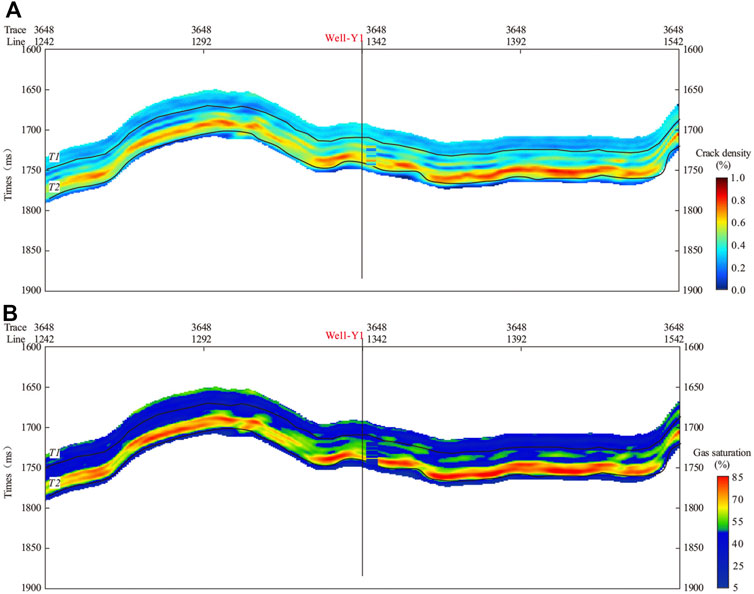
FIGURE 10. By projecting the inversion results in Figure 9 onto the rock physics template in Figures 7, 8, we obtain the interpreted sections of (A) crack density, and (B) gas saturation.
4 Discussion
Based on the dual-porosity model, we proposed an inversion scheme for estimating the volume fractions of different pore structures. Our analysis shows that the majority of the microcracks are formed within the clay minerals, which is consistent with the observation from the SEM images (see Figure 5). Sun et al. (2019) carried out a thorough analysis on the correlation between the volume of microcrack and the mineral components in the Longmaxi shale samples based on the electron microscopy and high-pressure mercury injection experiments. The results show that the contribution of clay minerals to the volume of microcracks is the largest, accounting for 70%, followed by the organic matter, and accounting for 24%. The brittle minerals (including quartz, feldspar, and dolomite) contribute to the least volumes of microcracks, accounting for 6%. The experiment also shows that there exists a positive correlation between the volumes of microcrack and clay. This agrees with the sonic-log inversion results based on the dual-porosity model.
The clay minerals reduce the brittleness of shale to a certain extent, this is not in favor of forming the microcracks by mechanical deformation due to tectonic stress (Han et al., 2021b). However, the microcracks can form in terms of small openings between the crystal layers of different clay minerals as revealed from the SEM images (Deng et al., 2021). On the other hand, clays are composed of fine sheet-like particles, they tend to form pores with much smaller aspect ratios than those associated with quartz grains. These pores are very compliant, most of which can be closed by the lithostatic stress at larger burial depth. However, overpressure is a common phenomenon in the shale gas reservoirs of Upper Ordovician Wufeng Formation and Lower Silurian Longmaxi Formation in the southern Sichuan Basin (Gao et al., 2019; Han et al., 2021a). Hydrocarbon generates from organic matter during thermal evolution, which is the main cause for abnormal high pressure in the region. The overpressure reduces the effective stress on reservoir and therefore, the majority of the microcracks still remain open for the Wufeng-Longmaxi Shale. This corroborates with our observation of considerable microcrack growth in well-Y1.
Xu and White (1995) published a velocity model for clay-sand mixtures, which is developed in terms of the Kuster-Toksöz effective medium theory and Gassmann model. In their model, the total pore-space is assumed to consist of pores associated with sand grains, and clays, respectively. The model also assumes that the pores of small aspect ratio are strictly developed in the clays whereas the pores of large aspect ratio only exist among the sand grains. Therefore, for its application one must first determine the volume of sand grain and clay content. In presence of more complex mineral components and microstructures, such as in organic-rich shales, and the classic Wu-White’s model may no longer be applicable. Unlike the Xu-White’s model, the dual-porosity model proposed in this work does not differentiate how the pore structures fit into the rock frame. Instead, we consider that the microcrack and stiff pores can develop in all mineral components. This assumption greatly simplifies the modeling and inversion procedures. The results as discussed earlier confirms the effectiveness of the dual-porosity model. The pore-volume inversion workflow can serve as fast evaluation tool for assessing the microcrack development in shale reservoir. In this work, the model is applied to the Wufeng-Longmaxi Shale Formation which is of uniform lithology. More future work is needed to examine the applicability of the model for reservoirs with complex lithologies.
5 Conclusion
In this work, we propose a simple dual-porosity model for the characterization of elastic properties of shale. The model assumes that the pore-space of shale can be divided into two parts including the pore-spaces of microcracks and stiff pores, respectively. The crack and stiff pore are defined as spheroid inclusion with contrasting aspect ratios. The dual-porosity concept is incorporated into the anisotropic self-consistent approximation theory for obtaining the effective elastic tensor of the multimineral organic-rich shale. We use the model to analyze the elastic behavior of the Wufeng-Longmaxi Shale in Sichuan Basin, China. We address the important issue of estimating two key shale gas evaluation parameters, i.e., crack density and gas saturation from well-log and seismic data. The main conclusions can be summarized as follows:
1) The log data analysis shows that the estimated crack porosity in Wufeng-Longmaxi Shale exhibits a decreasing trend with increasing burial depths and decreasing clay content. The microcracks are mainly developed between clay minerals, which is consistent with the experimental results and observation from SEM images.
2) The velocities of the Wufeng-Longmaxi Formation is primarily controlled by the crack porosity instead of the total porosity. Both the P- and S-wave velocities show linear decreasing trends with increasing crack porosity in shale.
3) The fluid substitution analysis indicates that the gas shale is sensitive to the change of pore-fluid saturation. We can separate the gas shale from the water shale on a cross-plot between the Poisson’s ratio and P-impedance.
4) The rock physics template predicts that at low gas saturation, Vp/Vs increases with increasing crack density whereas at high gas saturation, Vp/Vs decreases with increasing crack density. The well-log crack density and gas saturation can be accurately predicted from the RPT analysis. The interpreted seismic sections show that the high-quality shale at the bottom of Wufeng-Longmaxi Formation is stable and distributed throughout the region.
Data Availability Statement
The original contributions presented in the study are included in the article/Supplementary Material, further inquiries can be directed to the corresponding author.
Author Contributions
All authors listed have made a substantial, direct, and intellectual contribution to the work and approved it for submission.
Funding
This work is funded by Sichuan International Science and Technology Innovation Cooperation Program (Grant No: 2021YFH0050) and the National Natural Science Foundation of China (Grant No: 41904113).
Conflict of Interest
The authors declare that the research was conducted in the absence of any commercial or financial relationships that could be construed as a potential conflict of interest.
Publisher’s Note
All claims expressed in this article are solely those of the authors and do not necessarily represent those of their affiliated organizations, or those of the publisher, the editors and the reviewers. Any product that may be evaluated in this article, or claim that may be made by its manufacturer, is not guaranteed or endorsed by the publisher.
Acknowledgments
The authors would like to thank Jixin Deng for providing the SEM image of Wufeng-Longmaxi Shale.
References
Avseth, P., Mukerji, T., and Mavko, G. (2010). Quantitative Seismic Interpretation: Applying Rock Physics Tools to Reduce Interpretation Risk. New York: Cambridge University Press.
Bachrach, R., Sayers, C. M., Dasgupta, S., Silva, J., and Volterrani, S. (2014). “Recent Advances in the Characterization of Unconventional Reservoirs with Wide-Azimuth Seismic Data,” in SEG Technical Program Expanded Abstracts 2014 (Society of Exploration Geophysicists). doi:10.1190/segam2014-0379.1
Backus, G. E. (1962). Long-wave Elastic Anisotropy Produced by Horizontal Layering. J. Geophys. Res. 67, 4427–4440. doi:10.1029/jz067i011p04427
Batzle, M., and Wang, Z. (1992). Seismic Properties of Pore Fluids. Geophysics 57, 1396–1408. doi:10.1190/1.1443207
Brie, A., Pampuri, F., Marsala, A., and Meazza, O. (1995). “Shear Sonic Interpretation in Gas-Bearing Sands,” in SPE Annual Technical Conference and Exhibition. Dallas: SPE. doi:10.2118/30595-ms
Brown, R. J. S., and Korringa, J. (1975). On the Dependence of the Elastic Properties of a Porous Rock on the Compressibility of the Pore Fluid. Geophysics 40, 608–616. doi:10.1190/1.1440551
Carcione, J. M., Helle, H. B., and Avseth, P. (2011). Source-rock Seismic-Velocity Models: Gassmann versus Backus. Geophysics 76, N37–N45. doi:10.1190/geo2010-0258.1
Chao, L., Zaixing, J., Yiting, Y., and Xiaojie, W. (2012). Characteristics of Shale Lithofacies and Reservoir Space of the Wufeng-Longmaxi Formation, Sichuan Basin. Pet. Exploration Development 39, 691–698.
Chopra, S., Sharma, R. K., Keay, J., and Marfurt, K. J. (2012). Shale Gas Reservoir Characterization Workflows. SEG Technical Program Expanded Abstracts 2012 (Society of Exploration Geophysicists), 1–5. doi:10.1190/segam2012-1344.1
Deng, J., Wang, C., Zhao, Q., Guo, W., Tang, G., and Zhao, J. (2021). Depositional and Diagenetic Controls on Macroscopic Acoustic and Geomechanical Behaviors in Wufeng-Longmaxi Formation Shale. Front. Earth Sci. 9, 126. doi:10.3389/feart.2021.617831
Deng, J., Wang, S., and Han, D.-H. (2009). The Velocity and Attenuation Anisotropy of Shale at Ultrasonic Frequency. J. Geophys. Eng. 6, 269–278. doi:10.1088/1742-2132/6/3/006
Domnesteanu, P., McCann, C., and Sothcott, J. (2002). Velocity Anisotropy and Attenuation of Shale in Under- and Overpressured Conditions. Geophys. Prospecting 50, 487–503. doi:10.1046/j.1365-2478.2002.00329.x
Eshelby, J. D. (1957). The Determination of the Elastic Field of an Ellipsoidal Inclusion, and Related Problems. Proc. R. Soc. Lond. Ser. A. Math. Phys. Sci. 241, 376–396. doi:10.1098/rspa.1957.0133
Fatti, J. L., Smith, G. C., Vail, P. J., Strauss, P. J., and Levitt, P. R. (1994). Detection of Gas in sandstone Reservoirs Using AVO Analysis: A 3-D Seismic Case History Using the Geostack Technique. Geophysics 59, 1362–1376. doi:10.1190/1.1443695
Gao, J., Zhang, J.-k., He, S., Zhao, J.-x., He, Z.-l., Wo, Y.-j., et al. (2019). Overpressure Generation and Evolution in Lower Paleozoic Gas Shales of the Jiaoshiba Region, China: Implications for Shale Gas Accumulation. Mar. Pet. Geology. 102, 844–859. doi:10.1016/j.marpetgeo.2019.01.032
Goodway, B., Perez, M., Varsek, J., and Abaco, C. (2010). Seismic Petrophysics and Isotropic-Anisotropic Avo Methods for Unconventional Gas Exploration. The Leading Edge 29, 1500–1508. doi:10.1190/1.3525367
Guo, X., Li, Y., Liu, R., and Wang, Q. (2014). Characteristics and Controlling Factors of Micropore Structures of the Longmaxi Shale in the Jiaoshiba Area, Sichuan Basin. Nat. Gas Industry B 1, 165–171. doi:10.1016/j.ngib.2014.11.007
Guo, Z., and Liu, X. (2018). Seismic rock physics characterization of anisotropic shale—a Longmaxi Shale case study. J. Geophys. Eng. 15, 512–526.
Guo, Z., Li, X.-Y., Liu, C., Feng, X., and Shen, Y. (2013). A Shale Rock Physics Model for Analysis of Brittleness index, Mineralogy and Porosity in the Barnett Shale. J. Geophys. Eng. 10, 025006. doi:10.1088/1742-2132/10/2/025006
Han, T., Yan, H., and Fu, L.-Y. (2021c). A Quantitative Interpretation of the Saturation Exponent in Archie's Equations. Pet. Sci. 18, 444–449. doi:10.1007/s12182-021-00547-0
Han, T., Liu, S., Fu, L.-Y., and Yan, H. (2021a). Understanding How Overpressure Affects the Physical Properties of Sandstones. Geophysics 86, 1–33. doi:10.1190/geo2020-0776.1
Han, T., Yu, H., and Fu, L.-Y. (2021b). Correlations between the Static and Anisotropic Dynamic Elastic Properties of Lacustrine Shales under Triaxial Stress: Examples from the Ordos Basin, China. Geophysics 86, 1–53. doi:10.1190/geo2020-0761.1
Hornby, B. E., Schwartz, L. M., and Hudson, J. A. (1994). Anisotropic Effective‐medium Modeling of the Elastic Properties of Shales. Geophysics 59, 1570–1583. doi:10.1190/1.1443546
Jiang, Z., Sun, Y., Liu, S., and Lin, K. (2019). Quantitative Identification of Pseudofaults Underlying Igneous Rocks through Wave-Equation-Based Velocity Modeling: A Case Study of the Shuntuoguole Uplift, Tarim Basin, China. Interpretation 7, T499–T512. doi:10.1190/int-2018-0107.1
Li, H., Wang, D., Gao, J., Zhang, M., Wang, Y., Zhao, L., et al. (2020). Role of Saturation on Elastic Dispersion and Attenuation of Tight Rocks: An Experimental Study. J. Geophys. Res. Solid Earth 125, e2019JB018513. doi:10.1029/2019jb018513
Liu, S., Ma, W., Jansa, L., Huang, W., Zeng, X., and Zhang, C. (2013). Characteristics of the Shale Gas Reservoir Rocks in the Lower Silurian Longmaxi Formation, East Sichuan Basin, China. Energy Exploration & Exploitation 31, 187–219. doi:10.1260/0144-5987.31.2.187
Luan, X., Di, B., Wei, J., Zhao, J., and Li, X. (2016). Creation of Synthetic Samples for Physical Modelling of Natural Shale. Geophys. Prospecting 64, 898–914. doi:10.1111/1365-2478.12382
Lucier, A. M., Hofmann, R., and Bryndzia, L. T. (2011). Evaluation of Variable Gas Saturation on Acoustic Log Data from the Haynesville Shale Gas Play, NW Louisiana, USA. The Leading Edge 30, 300–311. doi:10.1190/1.3567261
Mavko, G., Mukerji, T., and Dvorkin, J. (2009). The Rock Physics Handbook: Tools for Seismic Analysis of Porous Media. New York: Cambridge University Press.
O’Connell, R. J., and Budiansky, B. (1974). Seismic Velocities in Dry and Saturated Cracked Solids. J. Geophys. Res. 79, 5412–5426. doi:10.1029/JB079i035p05412
Passey, Q., Creaney, S., Kulla, J., Moretti, F., and Stroud, J. (1990). A Practical Model for Organic Richness from Porosity and Resistivity Logs. AAPG Bull. 74, 1777–1794. doi:10.1306/0c9b25c9-1710-11d7-8645000102c1865d
Passey, Q. R., Bohacs, K., Esch, W. L., Klimentidis, R., and Sinha, S. (2010). “From Oil-Prone Source Rock to Gas-Producing Shale Reservoir–Geologic and Petrophysical Characterization of Unconventional Shale-Gas Reservoirs,” in International Oil and Gas Conference and Exhibition in China. Beijing, China: SPE.
Pollastro, R. M. (2007). Total petroleum system assessment of undiscovered resources in the giant Barnett Shale continuous (unconventional) gas accumulation, Fort Worth Basin, Texas. AAPG Bull. 91, 551–578.
Qi, Q., Fu, L.-Y., Deng, J., and Cao, J. (2021). Attenuation Methods for Quantifying Gas Saturation in Organic-Rich Shale and Tight Gas Formations. Geophysics 86, D65–D75. doi:10.1190/geo2020-0291.1
Qi, Q., Müller, T. M., and Pervukhina, M. (2017). Sonic QP/QS Ratio as Diagnostic Tool for Shale Gas Saturation. Geophysics 82, MR97–MR103. doi:10.1190/geo2016-0499.1
Rich, J. P., and Ammerman, M. (2010). “Unconventional Geophysics for Unconventional Plays,” in SPE Unconventional Resources Conference/Gas Technology Symposium. Pittsburgh: SPE, 1858–1861. doi:10.2118/131779-ms
Sena, A., Castillo, G., Chesser, K., Voisey, S., Estrada, J., Carcuz, J., et al. (2011). Seismic Reservoir Characterization in Resource Shale Plays: Stress Analysis and Sweet Spot Discrimination. The Leading Edge 30, 758–764. doi:10.1190/1.3609090
Si, W., Di, B., Wei, J., and Li, Q. (2016). Experimental Study of Water Saturation Effect on Acoustic Velocity of Sandstones. J. Nat. Gas Sci. Eng. 33, 37–43. doi:10.1016/j.jngse.2016.05.002
Sondergeld, C. H., and Rai, C. S. (2011). Elastic Anisotropy of Shales. The leading edge 30, 324–331. doi:10.1190/1.3567264
Sondergeld, C. H., Rai, C. S., Margesson, R. W., and Whidden, K. J. (2000). “Ultrasonic Measurement of Anisotropy on the Kimmeridge Shale,” in SEG Technical Program Expanded Abstracts 2000 (Tulsa: Society of Exploration Geophysicists), 1858–1861. doi:10.1190/1.1815791
Sun, W., Li, W., Bai, L., and Zhao, H. (2019). Prediction Method of Micro-fracture Development Degree of Shale Reservoir. Sci. Technology Eng. 19, 118–123.
Uvarova, Y., Yurikov, A., Pervukhina, M., Lebedev, M., Shulakova, V., Clennell, B., et al. (2014). Microstructural Characterisation of Organic-Rich Shale before and after Pyrolysis. APPEA J. 54, 249–258. doi:10.1071/aj13025
Vanorio, T., Mukerji, T., and Mavko, G. (2008). Emerging Methodologies to Characterize the Rock Physics Properties of Organic-Rich Shales. The Leading Edge 27, 780–787. doi:10.1190/1.2944163
Vasin, R. N., Wenk, H. R., Kanitpanyacharoen, W., Matthies, S., and Wirth, R. (2013). Elastic Anisotropy Modeling of Kimmeridge Shale. J. Geophys. Res. Solid Earth 118, 3931–3956. doi:10.1002/jgrb.50259
Vernik, L., and Liu, X. (1997). Velocity Anisotropy in Shales: A Petrophysical Study. Geophysics 62, 521–532. doi:10.1190/1.1444162
Vernik, L., and Nur, A. (1992). Ultrasonic Velocity and Anisotropy of Hydrocarbon Source Rocks. Geophysics 57, 727–735. doi:10.1190/1.1443286
Vernik, L. (2016). Seismic Petrophysics in Quantitative Interpretation. Tulsa: Society of Exploration Geophysicists.
Wu, J., Yuan, Y., Niu, S., Wei, X., and Yang, J. (2020). Multiscale Characterization of Pore Structure and Connectivity of Wufeng-Longmaxi Shale in Sichuan Basin, China. Mar. Pet. Geology. 120, 104514. doi:10.1016/j.marpetgeo.2020.104514
Xu, S., and White, R. E. (1995). A New Velocity Model for clay‐sand Mixtures 1. Geophys. prospecting 43, 91–118. doi:10.1111/j.1365-2478.1995.tb00126.x
Xu, Z., Shi, W., Zhai, G., Clay, C., Zhang, X., and Peng, N. (2019). A rock physics model for characterizing the total porosity and velocity of shale: A case study in Fuling area, China. Marine Petrol. Geol. 99, 208–226.
Zhao, L., Wang, Y., Liu, X., Zhang, J., Liu, Y., Qin, X., et al. (2020). Depositional Impact on the Elastic Characteristics of the Organic Shale Reservoir and its Seismic Application: A Case Study of the Longmaxi-Wufeng Shale in the Fuling Gas Field, Sichuan Basin. Geophysics 85, B23–B33. doi:10.1190/geo2019-0326.1
Keywords: rock physics, organic-rich shale, elastic property, microcrack, saturation, reservoir characterization, microstructure
Citation: Jiang Z, Qi Q, Jiang X, Meng J and Wang X-J (2022) An Efficient Rock Physics Scheme for Estimating Crack Density and Fluid Saturation of Shale Gas Reservoir. Front. Earth Sci. 9:829244. doi: 10.3389/feart.2021.829244
Received: 05 December 2021; Accepted: 17 December 2021;
Published: 03 February 2022.
Edited by:
Lidong Dai, Institute of geochemistry (CAS), ChinaReviewed by:
Tongcheng Han, China University of Petroleum, (Huadong) ChinaDawei Fan, Institute of Geochemistry (CAS), China
Copyright © 2022 Jiang, Qi, Jiang, Meng and Wang. This is an open-access article distributed under the terms of the Creative Commons Attribution License (CC BY). The use, distribution or reproduction in other forums is permitted, provided the original author(s) and the copyright owner(s) are credited and that the original publication in this journal is cited, in accordance with accepted academic practice. No use, distribution or reproduction is permitted which does not comply with these terms.
*Correspondence: Qiaomu Qi, cWlhb211X3FpQDE2My5jb20=