 Hongyan Qi1
 Ang Li
- 1Research Institute of Exploration and Development, PetroChina Xinjiang Oilfield Company, Karamay, China
- 2Shenyang Centre of Geological Survey, China Geological Survey, Shenyang, China
The shale oil reservoir in the Lucaogou Formation in the Jimsar Sag, Junggar Basin has a complex lithology, complex pore structure, and strong heterogeneity. Conventional logging reservoir evaluation methods have difficulty accurately evaluating the lithology, physical properties, electrical properties, oil-bearing properties, source rock characteristics, brittleness, and horizontal in-situ stress. Starting from the logging response characteristics of complex lithologies, a multilevel, multi-logging parameter combination shale oil logging evaluation is proposed, and an evaluation model of the “seven properties” of shale oil reservoirs is established. This model is used to interpret the data in the study area and achieves good results, effectively solving the “three types of quality” evaluation problems of shale oil source rock quality, reservoir quality and engineering quality. Based on the comprehensive evaluation of the seven properties of logging, it is proposed that the lithology of the Lucaogou Formation shale oil determines the physical properties, brittleness, source rock properties, rock mechanical properties, contact relationships with the reservoir and physical property controls on the oil-bearing property; the “sweet spot” of shale oil in the Lucaogou Formation is clarified, providing effective support for the development of shale oil in the Jimsar Depression.
Introduction
The success of North American shale oil and gas shows that the shale oil resources in the source rocks in the basin are far greater than the conventional oil resources outside the source. The transformation from outside sources to inside sources is an inevitable choice for the sustainable development of the petroleum industry. In-source shale oil is a major area for future large-scale growth in oil and gas reserves and production (Zhang, 2013; Zhang et al., 2014; Du et al., 2019; Zhang et al., 2019). The “sweet spot” of shale reservoirs provides the material basis for the exploration and development of shale oil. Geophysical logging technology has the advantages of multiple methods, high vertical resolution, a large amount of information, continuity, convenience, and sensitivity; the technology has the ability to determine the petrophysical parameters of the borehole profile and is a powerful method for evaluating shale oil and gas reservoir “sweet spots” (Mehdi et al., 2008; Li et al., 2015; Mu et al., 2015). The core issues of shale oil logging evaluation mainly include three aspects: the first aspect is source rock evaluation, which highlights the calculation of source rock hydrocarbon generation and hydrocarbon expulsion capacity; the second aspect is reservoir evaluation; and the third aspect is engineering quality evaluation, which focuses on determining the orientation of in-situ stress and its evaluation of anisotropy and optimization of favorable fracturing intervals. Through the quantitative calculation of these three aspects and the study of their configuration, the vertical and horizontal distributions of tight oil and gas are evaluated, and the “sweet spot development area” is predicted, providing support for the effective development of shale oil. Generally, reservoir quality evaluation mainly refers to the evaluation of “lithology”, “physical properties”, “electricity and oil-bearing”, and the method is mainly based on traditional “three-combination” logging (Yin et al., 2017). However, due to the complex lithology and strong heterogeneity of shale oil reservoirs, the response and recognition sensitivity of conventional logging curves to lithology are affected by small pores and a complex pore structure. Moreover, the presence of organic matter reduces the sensitivity of conventional curves to porosity, and the response of conventional curves to oiliness is affected by factors such as high irreducible water saturation, organic matter and pyrite, which weaken the linear relationship between the conventional logging response and formation components and pore fluids. Therefore, traditional logging technology is basically unable to effectively identify shale oil reservoirs, and it is even more difficult to quantitatively evaluate the petrophysical parameters of reservoirs. Engineering quality evaluation mainly refers to the evaluation of “brittleness” and “in-situ stress and anisotropy” because parameters such as the brittleness index, in-situ stress orientation, size, and anisotropy are used for shale oil horizontal well bore trajectory optimization and fracturing plan designs. The evaluation of these parameters currently mainly relies on conventional sonic logging and density logging data. Parameters such as the azimuth and anisotropy of in-situ stress must rely on sonic imaging data (Kevin et al., 2021), Generally, the methods of using logging to calculate in-situ stress include imaging logging, formation dip logging, and sonic logging (Yin et al., 2018). Source rock quality evaluation mainly refers to the evaluation of the oil-generating ability of the source rock; the quality evaluation mainly assesses the abundance of organic matter, and the evaluation parameter is the total organic carbon (TOC) content. The methods that are used, such as the Schmoker method and △logR method, are usually based on density logging or resistivity (Schmoker, 1981; Passey et al., 1990; Khoshnoodkia et al., 2011; Craddock, et al., 2013; Yuan et al., 2014). According to the characteristics of Lucaogou Formation shale oil, this paper proposes a multilevel, multi-logging parameter combination shale oil logging evaluation method and establishes an evaluation model of the “seven properties” of shale oil reservoirs.
Overview of the Research Area
The Jimsar Sag is located in the eastern part of the Junggar Basin in northwestern China. It is a secondary structural unit with a half graben-like depression deposited on the middle Carboniferous folded basement. Structurally, except for the eroded stratigraphic pinch-out line on the eastern side, which is the boundary, the other three sides are sealed by faults. The western region is connected to the Beisantai uplift by the western No. 1 and southern No. 1 faults, and the northern region is connected to the Shaqi uplift by the Jimsar fault. The Santai fault is adjacent to the southern region, and the eastern region appears as a gradually rising slope that eventually transitions into the Guxi uplift (Yang et al., 2004; Guo et al., 2019; Gao et al., 2020). The centre of the depression is located near the Xidi fault (Figure 1). The discovered strata in the Jimsar Depression are Mesozoic and Cenozoic strata and include Quaternary (Q), Neogene (N), and Paleogene (E) strata, as well as the Cretaceous Tugulu Group (K1tg); Jurassic Qigu Formation (J3q), Toutunhe Formation (J2t), Xishanyao Formation (J2x), Sangonghe Formation (J1s), and Badaowan Formation (J1b); Triassic Karamay Formation (T2k), Shaofanggou Formation (T1s), and Jiucaiyuan Formation (T1j); upper Permian Wuerhe Formation (P3w), Lucaogou Formation (P2l), and Jingjingzigou Formation (P2j); and Carboniferous (C) strata. From top to bottom are the Jurassic Kalazha Formation (J3k), Triassic Haojiagou Formation (T3hj) and Huangshanjie Formation (T3h), and Permian Quanzijie Formation (P3q) and Hongyanchi Formation (P2h), among which the Permian Lucaogou Formation is the main source rock in the Jimsar Depression. The source rock is mainly composed of fine-grained dolomite, argillite, silt-fine sandstone and frequent interbeds, and the thickness of the source rock in the entire depression is uniform (100–250 m); the thickness of the second member of the Lucaogou Formation is generally greater than 50 m, with an area of nearly 900 km2; the thickness of the first member of the Lucaogou Formation is more than 100 m, and the area is nearly 1,100 km2. The Lucaogou Formation is a set of high-quality source rocks with a large thickness, stable distribution, high organic matter abundance, good parent material type, moderate maturity, and great hydrocarbon generation potential, which lay the foundation for the formation and enrichment of shale oil.
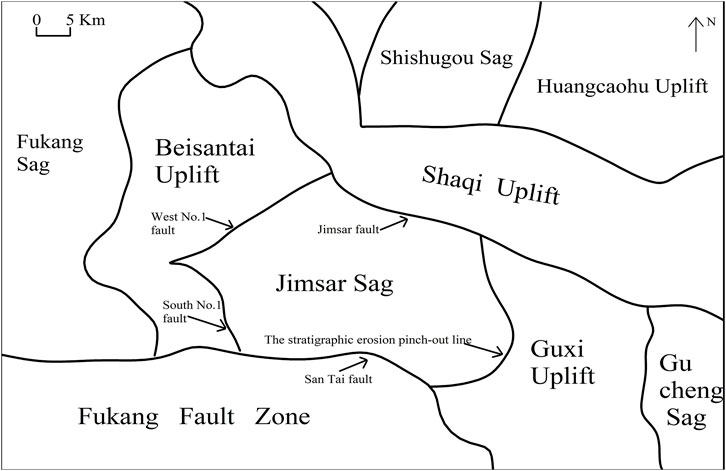
FIGURE 1. Location map of the study area.
Logging Evaluation Method for the Seven Properties of Shale Oil Reservoirs
Petrologic Characteristics and Lithologic Identification Methods of Shale Oil Reservoirs
Petrologic Characteristics of Shale Oil Reservoirs
The Permian Lucaogou Formation in the Jimsar Sag is mainly a set of mixed rocks, including silty fine sand, mud, and carbonates, that were deposited in saline lakes and controlled by mechanical deposition, chemical deposition, and biological deposition. The rock types are mainly laminar lacustrine carbonate rocks (dolomite and limestone), mudstone (silt, very fine, and fine sand) sandstone, and mixed transitional rocks such as silt, mud, dolomite, and calcite. Carbonaceous mudstone, bioclastic limestone, and rocks containing silica, albite, analcime and pyrite, as well as other rock types and thin mineral-rich layers and bands are developed in this formation. An X-ray diffraction analysis of the core of the Lucaogou Formation shows that there are more than 10 kinds of mineral components in the Lucaogou Formation, and the contents of various components vary greatly in the vertical direction (Figure 2). The clay mineral content is generally low, and the rocks typically contain carbonates. The mineral types are mainly dolomite, quartz and plagioclase, and the contents are 20–25%, Which are mainly produced in the form of mud microcrystalline dolomite, dolomite chips, calcite, dolomite cement and metasomatic products. A higher dolomite content can increase the brittleness of the rock, which is conducive to large-scale reservoir stimulation.
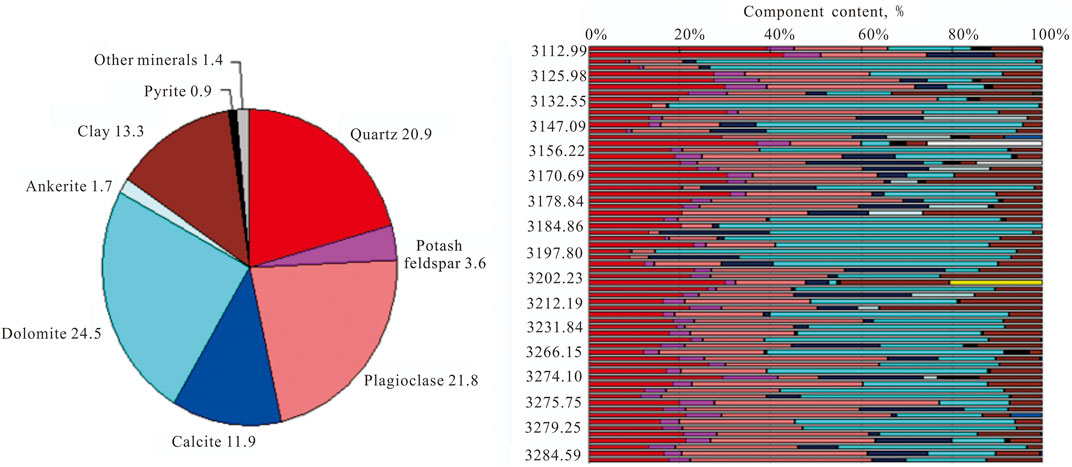
FIGURE 2. X-diffraction characteristic map of whole rock minerals in the Lucaogou Formation.
Multilevel and Multiparameter Lithologic Identification Method
Because the lithology of the Lucaogou Formation reservoir is complex and changeable, the traditional logging correlation analysis has a very low lithologic recognition rate. Through the study and analysis of the vertical changes in the logging curve, a physical property intersection chart and a physical property-electrical chart are built. The layer-by-layer method is used to identify complex lithologies. First, based on an analysis of 845 rock thin sections in the study area, the lithology is classified as mudstone, carbonaceous mudstone, dolomitic mudstone, argillaceous siltstone, siltstone, dolomitic siltstone, sandy dolomite, micritic dolomite, dolomitic limestone, and pyrite-bearing siltstone, for a total of 10 lithologies. Taking nine conventional logging curves as mining fields, computer data mining technology is used through artificial intelligence algorithms to automatically extract sensitive logging parameters that best reflect the petrophysical characteristics; this technology combines multiple parameters, constructs new parameters, and further highlights the differences in different rock types to subdivide lithologic categories and build a lithologic recognition map with a higher recognition rate. In this paper, the Emergent Self-Organizing Map (ESOM) algorithm is used. The ESOM algorithm has self-organization and self-adaptation capabilities. After using large-scale neurons and U matrix visualization processing, it can reveal the emergence phenomenon in the data. Discovering cluster structures and abnormal points is particularly important for solving complex lithology identification problems (Guo et al., 2009). Through data mining, the parameters of the lithologic sensitivity logging curve of the Lucaogou Formation in the Jimsar area, from large to small, are RT > DEN > CNL > AC > GR > RI > SP. The extraction of sensitive parameters from the data mining results is shown in Figure 3.
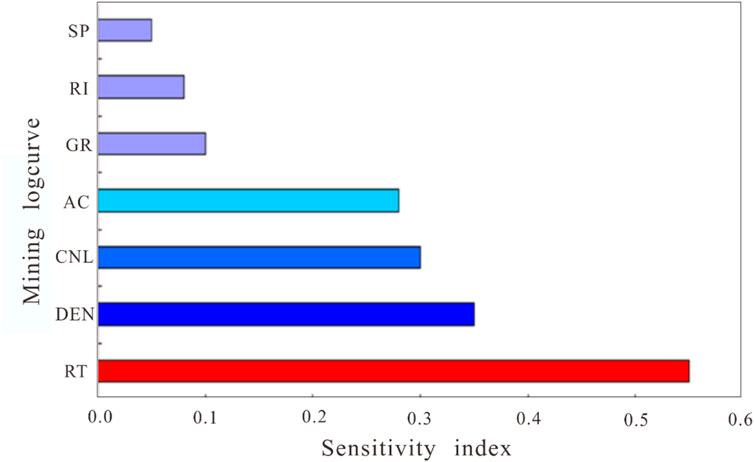
FIGURE 3. Extraction of sensitive parameters from the data mining results.
According to the extraction results of lithology-sensitive parameters, the acoustic neutron combination parameter (AC × CNL) is built, the reservoir density parameter (DEN) is added to highlight the difference in the logging response between mudstone and the reservoir, and the first level of the lithologic identification chart is established (Figure 4). Figure 4 shows that by determining the cut-off value of the acoustic neutron combination factor and the different densities, dolomitic mudstone and carbonaceous mudstone can be distinguished. In Figure 4, the horizontal axis is AC × CNL, and the vertical axis is DEN. The scattered points in different colours represent different lithologies. The lithology identification rules are established. First, if AC × CNL is greater than or equal to 2,710 and DEN is greater than 2.25 g/cm3, the lithology is dolomitic mudstone; if DEN is less than or equal to 2.25 g/cm3, the lithologies are dolomitic mudstone and carbonaceous mudstone. For non-mudstone lithologies, such as argillaceous siltstone, siltstone, dolomitic siltstone, sandy dolomite, micritic dolomite, dolomitic limestone, and pyrite-bearing siltstone, the RT/AC and DEN/CNL chart is established as the second level of the lithologic identification chart (Figure 4) to highlight the differences in various lithologies, electrical properties and physical properties. The higher the resistivity is and the better the physical properties are, the more the RT/AC changes significantly. Under other similar geological conditions, this ratio mainly reflects the lithologic changes. The ratio of density to hydrogen content mainly highlights the changes in porosity. If the rock is tight, DEN is large and CNL is small, which indirectly reflects the change in lithology. On the second-level lithologic identification chart, cut-off values of RT/AC and DEN/CNL are determined to better distinguish the oil-bearing lithologies of the Lucaogou Formation (Figure 5). The identification results are as follows. The RT/AC ratio is less than or equal to 0.08 for pyrite-containing siltstone; when the RT/AC ratio is between 0.08 and 0.21 and the DEN/CNL ratio is greater than 0.11, the lithology is silty mudstone; and if the DEN/CNL ratio is less than or equal to 0.11, the lithology is mudstone. If the RT/AC ratio is between 0.21 and 0.55 and the DEN/CNL ratio is greater than 0.11, micrite dolomite is present; if the DEN/CNL ratio is less than or equal to 0.11, silt-fine sandstone is present. The RT/AC ratio is between 0.55 and 1.3 for dolomitic siltstone; the RT/AC ratio is between 1.3 and 4.3 for sandy clastic dolomite; and the RT/AC ratio is greater than 4.3 for dolomitic limestone. According to the lithologic identification rules of the above two charts, and with computer automatic calculations and identification technology, the five types of oil-bearing lithologies of the Lucaogou Formation reservoir in the Jimsar Sag can be effectively classified (Figure 6), and the lithology classification results are consistent with the core analysis results.
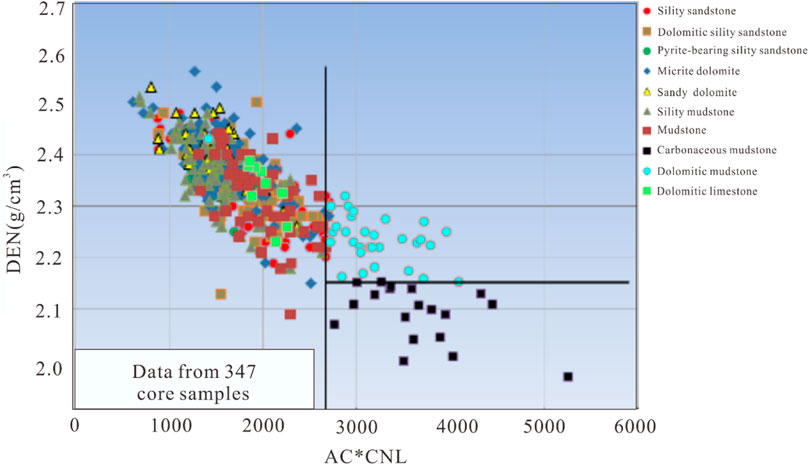
FIGURE 4. Crossplot of AC × CNL and DEN.
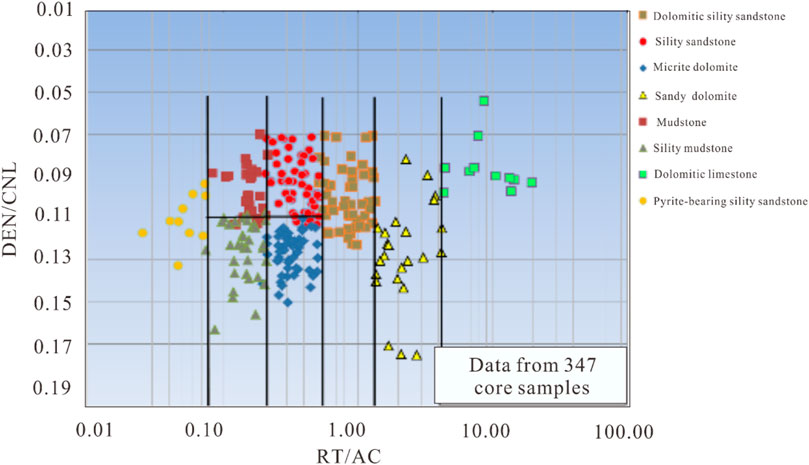
FIGURE 5. Crossplot of RT/AC and DEN/CNL
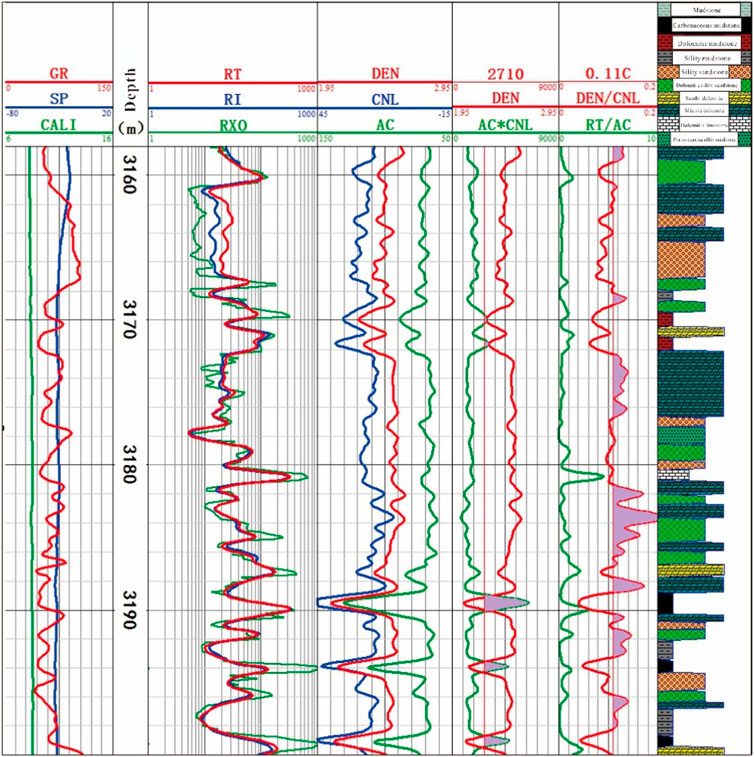
FIGURE 6. Lithology classification of Well J10012.
Physical Properties and Logging Characterization of Shale Oil Reservoirs
Reservoir Physical Characteristics
The physical characteristics of the Lucaogou Formation reservoir in the Jimsar Sag are ultralow porosity and ultralow permeability, with a pore throat system dominated by micron (μm)-sized pores and throats. The pore radii are mainly 100–150 μm, the throat radii are mainly less than 0.1 μm, and the pore throat structure is complex. Micron-level pores are dominated by remaining intergranular pores and intergranular dissolved pores, which are mostly developed in silty sandstone and dolomite siltstone with high sand contents. The pore diameters are 3–50 μm, the average overburden porosity is 10.84%, and the average overburden permeability is 0.014 mD.
Porosity Logging Modelling Method
Because the pores of shale oil reservoirs exist in and around intergranular pores, clay minerals, kerogen, and microcracks, and shale contains a certain amount of organic matter, the organic matter is similar to that of a fluid, but it also occupies minerals. The traditional three-porosity algorithm has difficulty accurately obtaining the porosity. In addition, the porosity obtained from the conventional three-porosity curve is a macroscopic average value, which cannot indicate complex pore changes. It is difficult for conventional logging to explain the physical parameters of shale oil, and nuclear magnetic resonance logging (NMR) is needed to determine the porosity of the reservoir. According to the theory of NMR, except for the clay-bound water porosity, other pores are part of the effective pores. Clay-bound water porosity is the short-relaxed component in the T2 spectrum. Generally, the components with T2 times less than 3 ms are classified as clay-bound water. Table 1 shows that the relaxation times of different clay types cover a large range from 0.3 to 16 ms. The X-ray diffraction results of the minerals in the study area show that the contents of the chlorite/smectite mixed layers, illite/smectite mixed layers and smectite are all 25–35%, the average chlorite content is less than 5%, and almost no kaolinite is present; these contents show that the Lucaogou Formation clay is mainly composed of smectite, as the T2 peak of smectite is in the range of 0.3–1 ms; coupled with the comprehensive effects and influences of other minerals, the effective porosity start time in the Jimsar area is generally less than 3 ms.
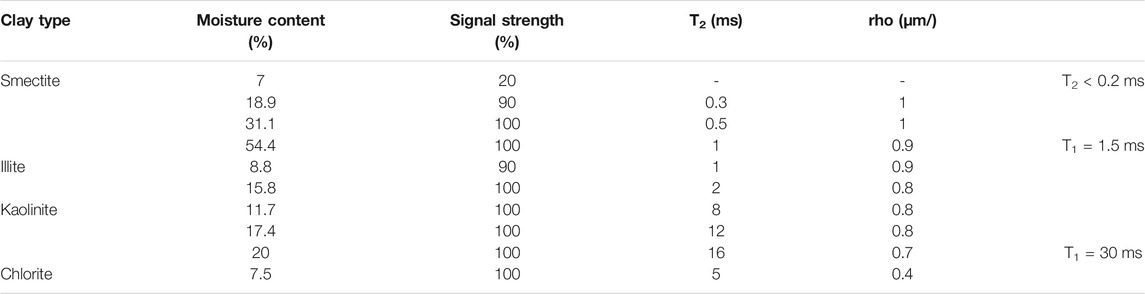
TABLE 1. Relaxation times of different clay types.
In addition to the clay type, the start time needs to consider the T2 time corresponding to the pore diameter. To systematically study the T2 time corresponding to the nanoscale pores, NMR experiments (Figure 7) of core samples were carried out, and the experimental study showed that the NMR porosity was 6.65%, the helium-implanted porosity was 2.93%, and the cumulative porosity of 0.01–1.66 ms was 3.52%. The NMR effective porosity calculated with 1.7 ms as the starting time has the highest correlation with the helium-implanted porosity.
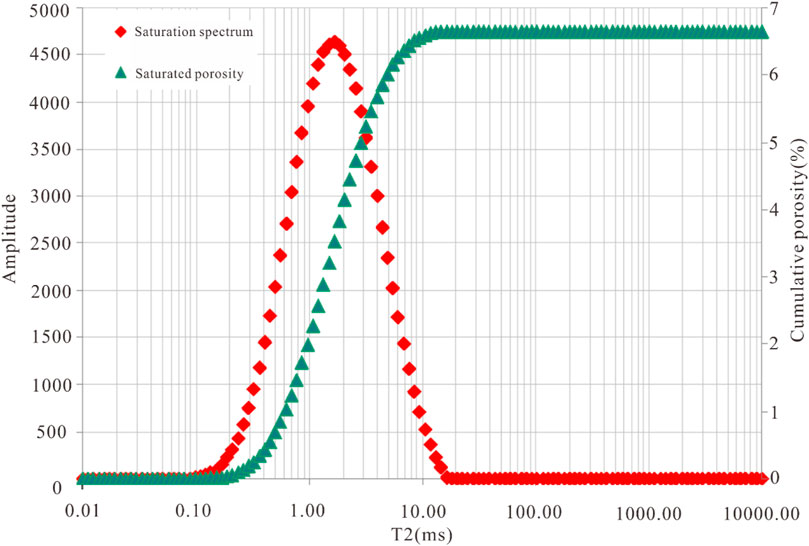
FIGURE 7. NMR experimental results of core samples.
Using the NMR logging data, an accuracy analysis of the NMR porosity calculated at different starting times was carried out, the porosity calculation was set to start from 0.3 ms with different starting times, and the porosity was compared with the core analysis porosity (Figure 8). This study found that the mean square error between the porosity calculated with starting times of 1.6 ms, 1.7 and 1.8 ms and the core analysis porosity of the overlying pressure is small, i.e., 14.99, which is smaller than the error between the porosity calculated at other starting times and the core analysis porosity. At the same time, the actual data were processed with different cut-off values. Figure 9 shows the NMR processing result of the X174 well. The first, second and third tracks in the figure show the comparison between the porosity results calculated from 0.3, 1.7, and 3 ms and the core analysis. Figure 9 shows that the trends of the 0.3 and 3 ms porosities correlate well with the analysed porosity, but the absolute errors of the data are both large. Within 3,146–3,150 m, the porosity starting from 3 ms has a better correlation than that starting from 0.3 ms, but the opposite is true at 3,155–3,161 m. However, the NMR effective porosity and overburden porosity calculated using 1.7 ms as the starting time are in good agreement, and the relative error of the calculation is 3.52%, which can effectively meet the needs of reservoir evaluation. Therefore, 1.7 ms was determined as the clay-bound water cut-off value.
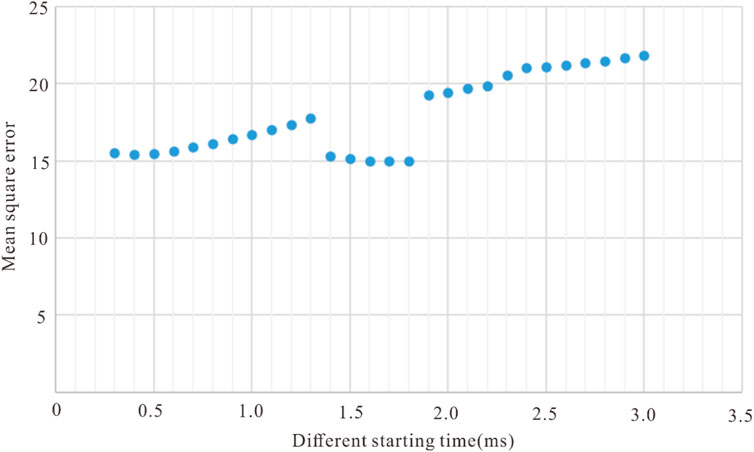
FIGURE 8. Analysis table of the mean square error of different starting time values.
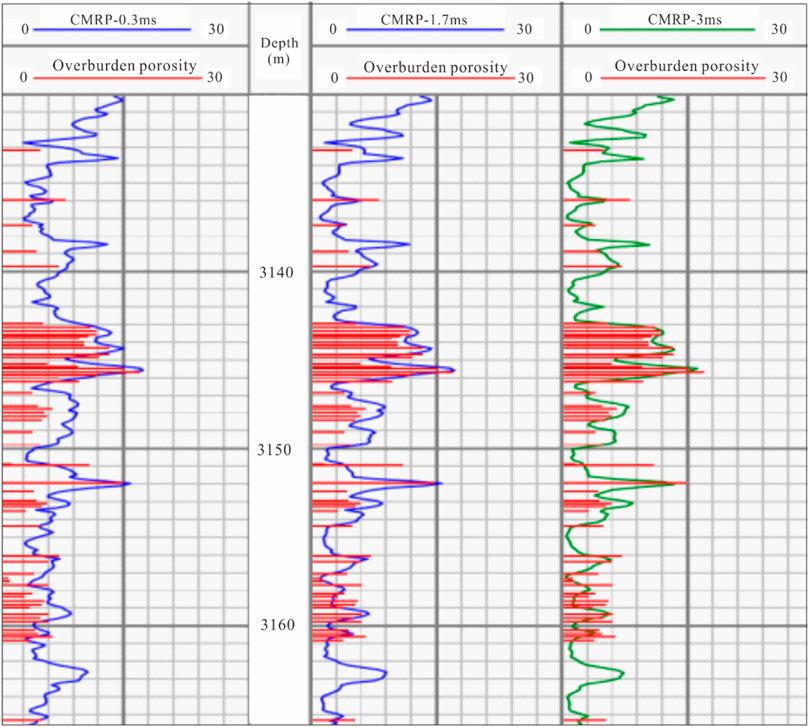
FIGURE 9. NMR processing result of the X174 well.
Characteristics and Logging Characterization of the Source Rock
Characteristics of the Source Rock
The organic carbon contents of different lithologies in the Permian Lucaogou Formation in the Jimsar Sag have a wide distribution range, but all are greater than 3% (Table 2), among which mudstone is the highest, followed by lime mudstone and silty mudstone, and dolomitic mudstone is the lowest. The chloroform bitumen “A” contents in different lithological mudstones are also higher, with an average value of more than 0.25%, and dolomitic mudstone has the lowest content, with an average value greater than 0.27%; the average value of various mudstones is 0.48%. The average value of S1+S2 is also very high, and the average value of the lowest dolomitic mudstone also reaches 12.48 mg/g. The average S1+S2 of all kinds of mudstones is 15.70 mg/g. Different types of mudstones all have high organic matter abundance. According to the source rock organic matter abundance evaluation standards, most of them have reached a better-good hydrocarbon source rock level. The vitrinite reflectance (Ro) of the source rock is 0.78–0.98%, which indicates the low-mature-mature evolution stage.
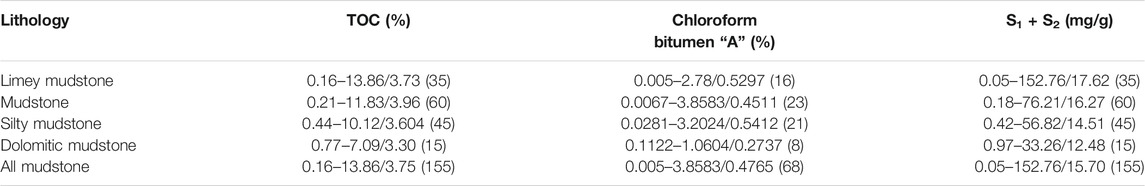
TABLE 2. Statistical table of organic matter abundance in different mudstones.
Logging Characterization of the Source Rock
Research on logging petrology and petrophysical characteristics shows that resistivity, acoustic waves, and neutrons have the best sensitivity to source rocks, followed by density, and gamma has the worst sensitivity. In this research, the acoustic wave and resistivity curve overlap method is used to predict TOC under different maturity conditions. This method sets the resistivity curve scale to the level of 328 us/m (100 us/ft) corresponding to the acoustic wave time difference for every two logarithmic scales. The resistivity curve and the acoustic wave curve are consistent or completely overlap within a certain depth range, which is the baseline of non-source rock formation. After determining the baseline, the separation between the two curves (ΔlogR) is used to identify the organic matter-rich layer. The ΔlogR and TOC values are linearly correlated. Using a large amount of known experimental data and the core calibration log, the TOC calculation model is determined by the superposition of the acoustic wave curve and resistivity curve.
where R is the resistivity value, in Ω.m; Δt is the acoustic wave curve, in us/ft; Rbaseline is the resistivity value of the baseline corresponding to the Δt baseline in the non-source rock; and A and B are coefficients.
Since the Lucaogou Formation contains mostly centimetre-level thin layers, the resolution of conventional resistivity logging is low. The vertical resolution of dual lateral logging is usually greater than 0.4 m. Thin layers with thicknesses of less than 0.5 m are usually unidentifiable. The TOC accuracy calculated by the conventional acoustic wave curve and the deep resistivity is low, the microresistivity scanning imaging logging has high resolution, and thin layers larger than 0.05 m can be identified. Utilizing the characteristics of high-resolution microresistivity scanning imaging logging, dimensionality reduction processing and piecewise logarithmic linear calibration methods are used to synthesize high-resolution resistivity curves (Figure 10). By using this method, the resistivity resolution to identify thin layers increases from 0.4 m to approximately 0.1 m and has good recognition for thin interbedded reservoirs, effectively solving the technical problems of identifying and evaluating thin interbedded layers, and the calculation accuracy of organic carbon content is significantly improved.
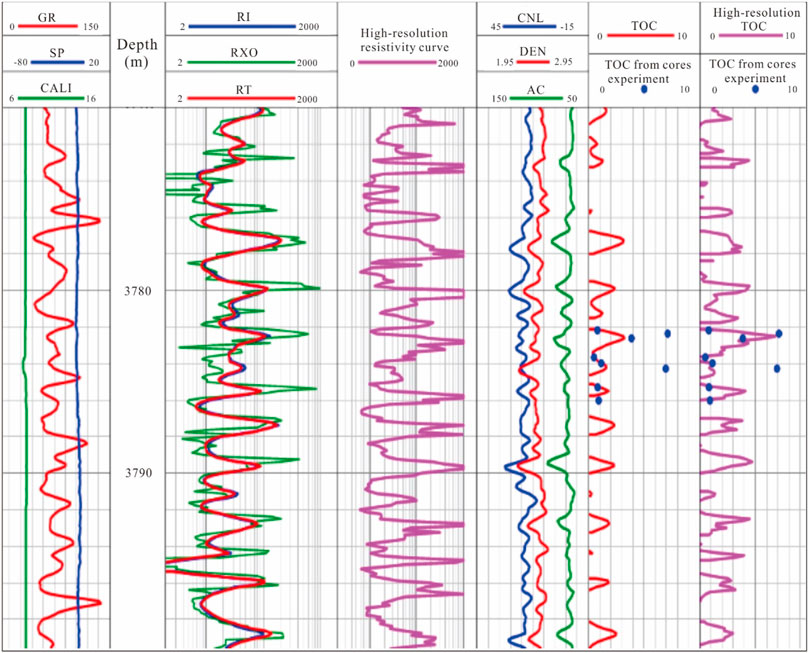
FIGURE 10. Comparison chart of organic carbon calculated using conventional deep lateral resistivity and microresistivity scanning.
Chloroform bitumen “A” is the weight percentage of organic matter that can be dissolved by chloroform in the volume of the rock, which is an important parameter for the evaluation of hydrocarbon generation. In the case of the same organic matter content, the higher the content of chloroform bitumen “A” is, the higher the degree of conversion of organic matter to petroleum. In this paper, shale oil NMR is used to calculate the oil saturation to evaluate the source rock. Chloroform bitumen “A” can be calculated from the saturation and rock density:
where A is chloroform pitch “A”, in %; ФT is the total porosity of the rock, in %; So is the oil saturation of the rock, in %; ρo is the density of crude oil; and ρb is the density of the rock. Figure 11 shows the log calculation results of chloroform asphalt “A” of the Lucaogou Formation in Well J37 in the study area. The 8th track in the figure is the comparison between the calculated chloroform asphalt “A” and that from core analysis. The two curves not only have the same shape change and characteristics but also have almost the same values, which shows that the calculation method of formula (2) chloroform asphalt “A” is reliable and effective.
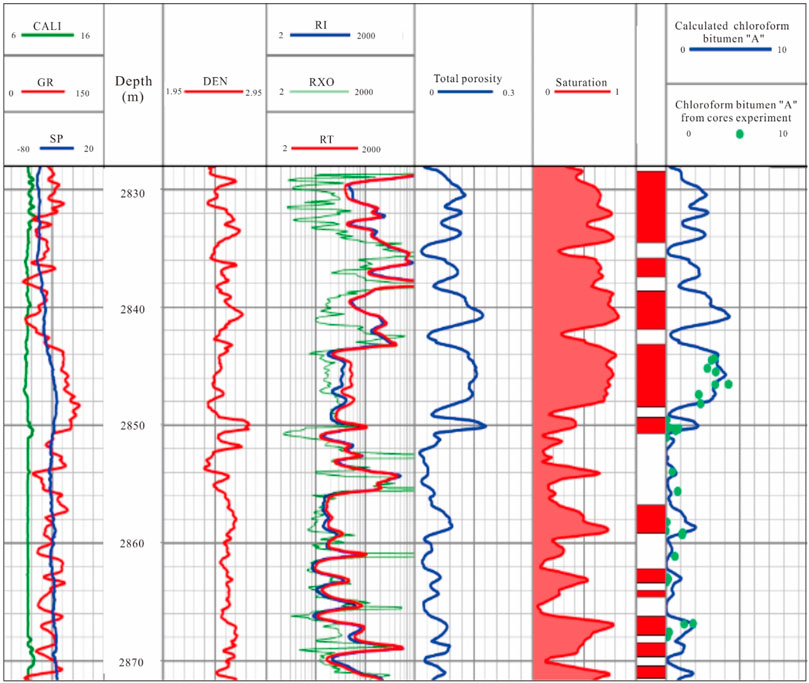
FIGURE 11. chloroform bitumen “A" calculated from Well Ji 37.
Saturation Model Establishment
The calculation of the oil saturation of shale oil is one of the most difficult tasks in shale oil logging evaluation. The main reason is that shale reservoirs have complex pore structures, various occurrence modes, and serious anisotropy. Generally, there are two methods for evaluating saturation by logging. One method uses resistivity curves to calculate oil saturation, and the other uses NMR to calculate oil saturation (Huerlimann, 2003; Guo and Gu, 2005; Wu et al., 2015; Cheng et al., 2016). Since the resistivity curve is easily affected by formation and non-formation factors, the signal-to-noise ratio is low, which reduces the ability to identify convection properties, and it is difficult to meet the accuracy requirements of the saturation calculation. Therefore, an increasing number of scholars are mainly studying the method of calculating oil saturation using NMR to improve the calculation accuracy. Based on the analysis of NMR experimental data and continuous sealing and coring data, this paper establishes a new method to calculate saturation by using the NMR transverse relaxation time spectrum through the determination of the corresponding minimum time threshold of NMR transverse relaxation under the maximum injection pressure of shale oil reservoirs. The main workflow is as follows: first, store the full-diameter sealing cores at a low temperature of 30°C, select a representative core to drill a 1-inch sample with liquid nitrogen, and remove the part with certain contamination at both ends; the 4 cm in the middle of the core is used as an experimental sample to measure the NMR spectrum of the two-phase oil-water in the original state; then, use carbon dioxide to wash the oil to desaturate; wash away the oil and gas in the large pore throat, and then wash away the oil and gas in the smaller pore throat. In the process, we correspondingly measure the NMR spectrum of the core sample until the hydrocarbons in the core sample are basically washed away, and the remaining water spectrum that contains basically no hydrocarbons. By analyzing the characteristics of the remaining water spectrum, the water volume is determined, the oil saturation is obtained, the T2 threshold is obtained (Figure 12), the iterative method is used to determine the threshold of transverse relaxation time T2 for saturation calculation, and the mean square error is iteratively calculated according to the following formula.
where AT2(j) is the mean square error of the T2 threshold of the jth iteration; n is the number of experimental oil saturation data points; SOi is the saturation measurement data of the ith sample point; and SSOji is the ith calculation saturation of the jth iteration T2 value.
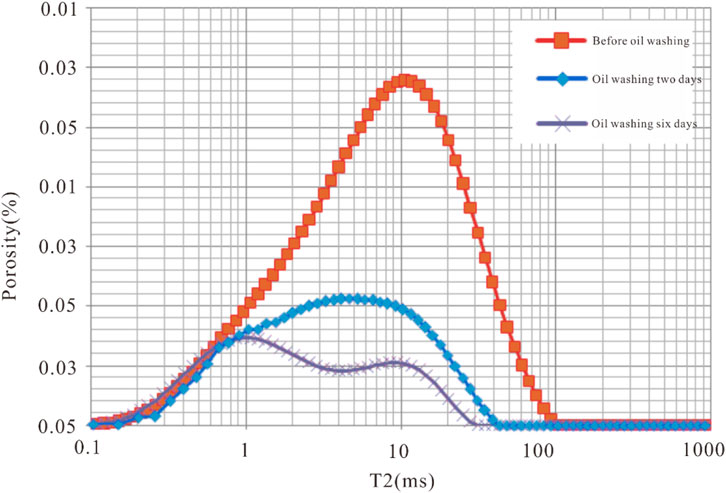
FIGURE 12. NMR spectrum variation during oil washing.
The T2 value with the smallest calculated mean square error is determined as the T2 saturation calculation threshold, AT2. Figure 13 shows the mean square error calculated by using different AT2 values in the sealed coring section of Well Ji176, and the corresponding AT2 when the mean square error is the smallest is 6 ms, which is completely consistent with the core experiment results. The determined AT2 and continuous T2 spectra obtained by NMR is applied to calculate the saturation of each survey point according to the following formula:
where So is the oil saturation, in decimal values;
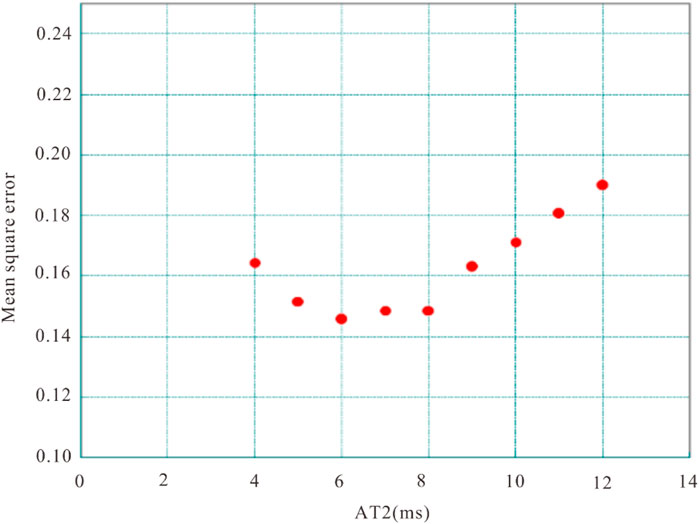
FIGURE 13. Mean square error calculated by different AT2 values in Well Ji176.
Figure 14 shows an example of calculated saturation using the determined AT2 and the continuous T2 spectra obtained by NMR logging in Well J176. Compared with the sealing core saturation experimental data, the average relative error of the calculated saturation is 2.74%, and the calculation accuracy is high, which can meet the accuracy requirements of the reserve calculation.
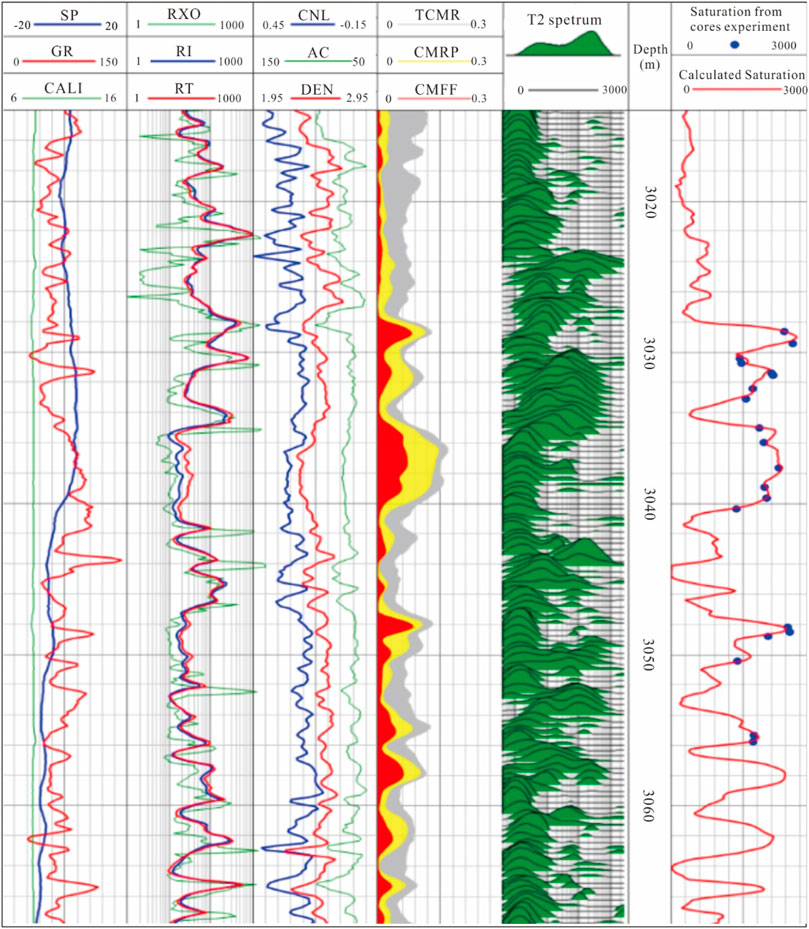
FIGURE 14. Saturation processing map of J176.
Classification of Shale Oil Brittleness and the Logging Characterization Method
Generally, it is difficult to produce oil and gas under natural conditions in shale oil reservoirs, and large-scale fracturing is required. In fracturing design, rock brittleness is one of the important factors that is considered. Therefore, the evaluation of reservoir rock mechanics and brittleness appears especially important. To understand the rock mechanics characteristics of the shale oil reservoir of the Lucaogou Formation in Jimsar, this paper uses the rock mechanics triaxial test system to carry out the study of the mechanical classification characteristics under different loading conditions and establishes the conversion of dynamic and static rock moduli. A new rock brittleness logging calculation method is proposed, which effectively improves the calculation accuracy of the brittleness index.
Classification of Shale Oil Brittleness
The brittleness of a rock is mainly related to the type of rock. Tight sandstone and limestone are typical brittle rocks that are linear on the stress-strain 1 curve and fracture before large nonlinear deformation. The fracture form is brittle fracture, and mudstone and high-porosity sandstone are typical plastic rocks, which are considered to be poorly brittle in petroleum engineering. It is concave on the stress-strain 1 curve. There is no obvious stage of deformation, that is, theoretically infinite yield, and the fracture form is plastic fracture, while sandstone with a medium-coarse-grained structure is considered to be moderately brittle, which is S-shaped on the stress-strain 1 curve and mainly reflects the mechanical characteristics of microcracks under compression (Li et al., 2012; Diao, 2013; Wang et al., 2017; Tao et al., 2020). In this study, 85 representative cores were selected to study the stress-strain 1 curve, strain 2-strain 1 curve and rock fracture morphology of the core loading process. The three main types of core rock include sand arenaceous dolomite and dolomitic siltstone, silt-fine sandstone and micritic dolomite, and mudstone and carbonaceous mudstone. Through triaxial stress experiments, the brittleness of the rocks in the study area is divided into three types, namely, good brittleness, medium brittleness, and poor brittleness, and the rock mechanics characteristics of the three types of rocks are summarized. The rock mechanics characteristics of the core with better brittleness (sandstone/dolomite and dolomite/siltstone) are linear on the stress-strain 1 curve, the slope of the curve is steep, the rock is broken before reaching the maximum compressive strength, and the rock is strained when it breaks into smaller pieces, generally less than 0.8% strain. The strain 2-strain 1 curve shows that the slope of the curve changes little before the breaking point, and the curve has a sudden change at the breaking point; the rock fracture shape is broken (Figure 15); the rock Young’s modulus is ≥15,000 MPa, and Poisson’s ratio is ≤0.2. The rock mechanics characteristics of medium brittle cores (silt-fine sandstone and micritic dolomite) show medium elasticity on the stress-strain 1 curve, which is S-shaped. When the compressive strength reaches 50%, the curve shows certain elasticity and is a straight line. The rock has plastic deformation before the maximum compressive strength, and the rock breaks at the maximum compressive strength. When the rock fractures, strain 1 is greater than 0.8% and less than 1.5%. On the strain 2-strain 1 curve, a sudden change occurs in the breaking point curve, but the change is slow. The rock fracture forms are shear failure and minor fracture (Figure 15); the parameters are as follows: 10,000 ≤ rock Young’s modulus <15,000 MPa, 0.2 < Poisson’s ratio ≤ 0.23. The rock mechanics characteristics of poor brittle cores (mudstone and carbonaceous mudstone) show poor elasticity (or plasticity) on the stress-strain 1 curve, which is concave, and the rock is plasticized until the maximum compressive strength is reached. Deformation and failure occur only when strain 1 is large, or generally greater than 1.5%; on the strain 2-strain 1 curve, the slope of the curve continues to increase before the rupture point, and the curve changes smoothly at the fracture point without abruptness; the fracture shape of the rock is shear failure (Figure 15); the Young’s modulus is <10,000 MPa, and Poisson’s ratio is > 0.23.
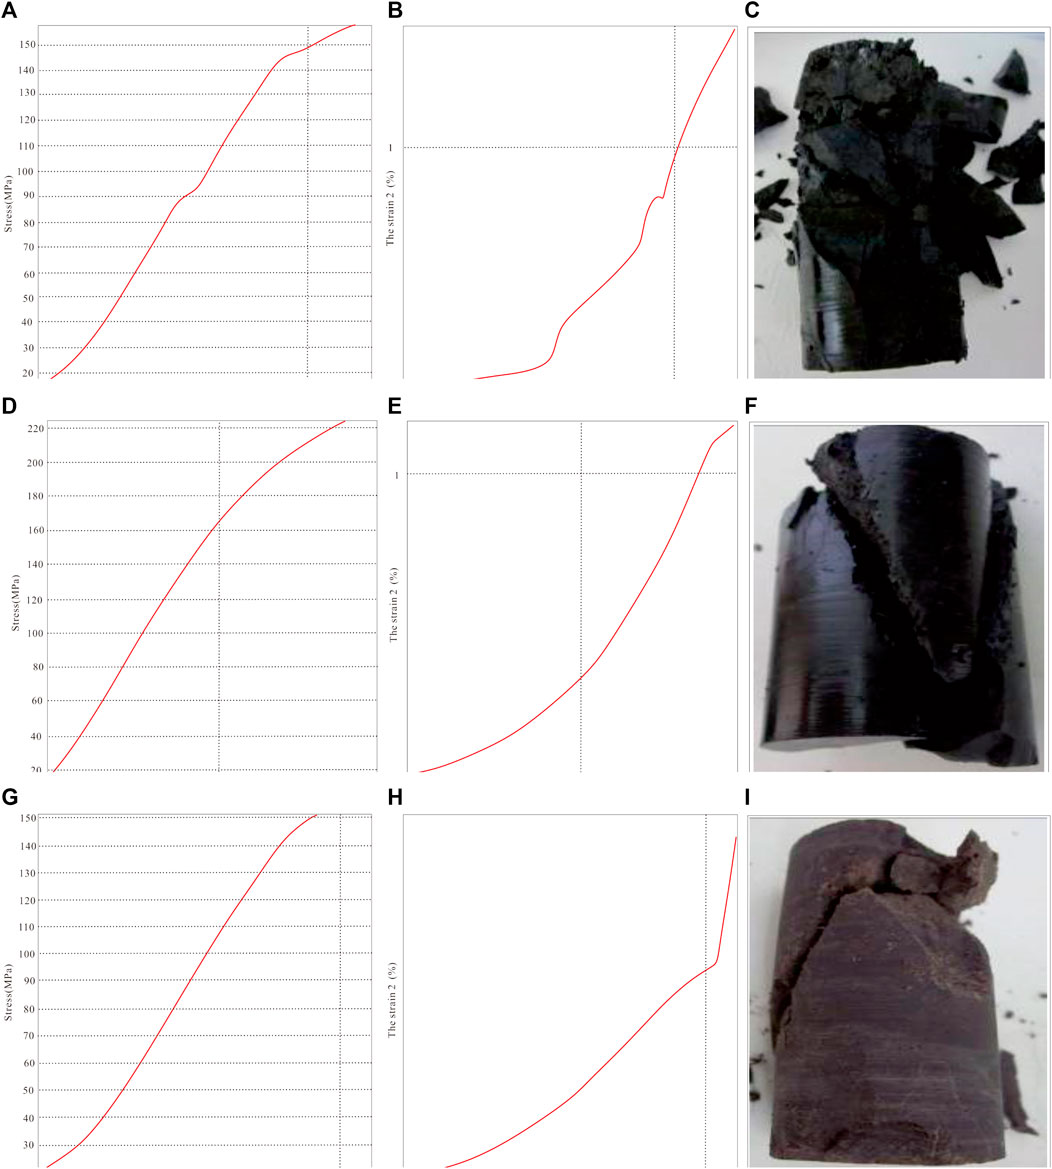
FIGURE 15. Rock mechanics characteristic curve and fracture pattern of brittle cores. Rock mechanics characteristic curve and fracture pattern of moderately brittle. Rock mechanics characteristic curve and fracture pattern of poor brittle cores.
Brittleness Logging Characterization Method
Generally, the larger the Young’s modulus of the rock and the smaller the Poisson’s ratio are, the better the brittleness of the rock. This is the basis for evaluating the brittleness of rock with rock mechanical parameters. The establishment of a brittleness characterization method not only considers the accuracy and reliability of the characterization but also the factors of dynamic and static conversion. Generally, the static Young’s modulus ratio and Poisson’s ratio of the rock are used to characterize the brittleness index. If the dynamic Young’s modulus and the dynamic Poisson’s modulus can be used to better characterize the static Young’s modulus and the static Poisson’s ratio, the brittleness of the reservoir can be better characterized. However, the experimental analysis shows that the relationship between dynamic parameters and static parameters is poor, and it is difficult to directly establish a correlation. To establish the dynamic and static brittleness index conversion model, 21 representative cores were selected to measure the dynamic and static parameters, porosity and clay content. The triaxial compression experiment simulates the effective stress of the overlying layer at the average depth of the formation as 35 MPa, and the established dynamic and static brittleness index conversion model is:
where BI35 is the static brittleness index of the rock under a 35 MPa confining pressure, in GPa; Bid is the dynamic brittleness index of the rock obtained from the density and the time difference between the vertical and horizontal waves, in GPa; por is the porosity, in %; vcl is the clay content;
The correlation coefficient is 0.81, and the dynamic-static conversion model has a better processing effect, with an absolute error of 0.097 and a relative error of 3%. To establish a stress environment correction method for the brittleness index, four representative sets of cores were selected to carry out the static parameters and clay content measurement experiments. The experimental results show that the brittleness index gradually increases with increasing experimental confining pressure (Figure 16). The relationship can be described by the following formula:
where
where γ is the depth correction of the brittleness index and Vcl is the clay content, in %. The calculation formula of the brittleness index for any vertical depth can be obtained from the following formula:
where BIsc is the static brittleness index after depth correction, in GPa; BI35 is the brittleness index under a 35 MPa confining pressure, in GPa; γ is the effective stress correction index of the brittleness index; lcp is the pressure gradient caused by the overlying lithology of the calculation point, in MPa/100 m; cp is the pressure coefficient of the formation, in MPa/100 m; and h is the vertical depth of the measuring point, in m. In this formula, (lcp-cp) h is the effective stress, which is equivalent to the confining pressure in the experiment. The calculation formula of the static brittleness index can be obtained:
where BIsc is the static brittleness index after depth correction, in GPa; lcp is the pressure gradient caused by the overlying lithology of the calculation point, in MPa/100 m; cp is the pressure coefficient of the formation; σdye is the dynamic Poisson’s ratio; Edye is the dynamic Young’s modulus, in GPa; and h is the vertical depth of the measuring point, in m.
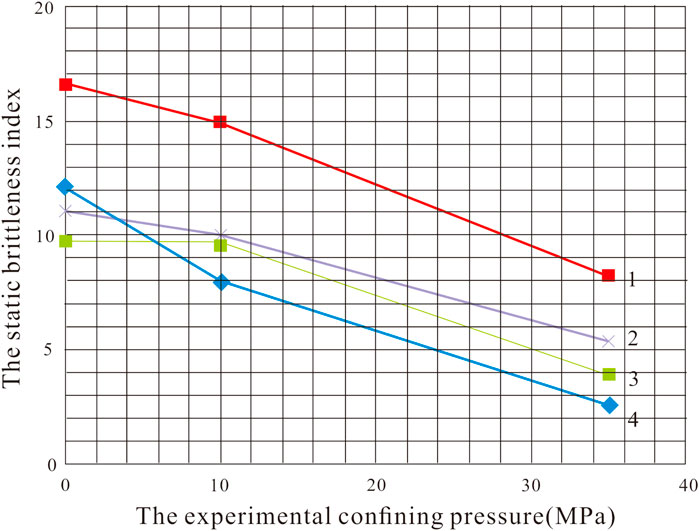
FIGURE 16. Variation in the static brittleness index under different confining pressures.
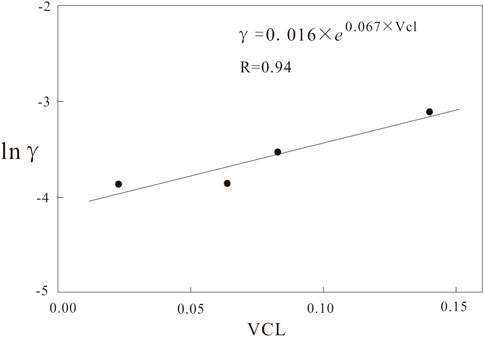
FIGURE 17. Crossplot of the clay content and γ.
Figure 18 shows an example of the evaluation of the brittleness index of Well J174 in the study area. The sixth track in the figure is the evaluation result of the brittleness index. The figure shows that the static brittleness index calculated by this method is in good agreement with the static brittleness index ascertained from the experiment, showing that the method can be used to evaluate the brittleness index of shale oil formations and achieve continuous quantitative evaluation of the brittleness of shale oil and gas reservoirs under different rock structures and stress environments.
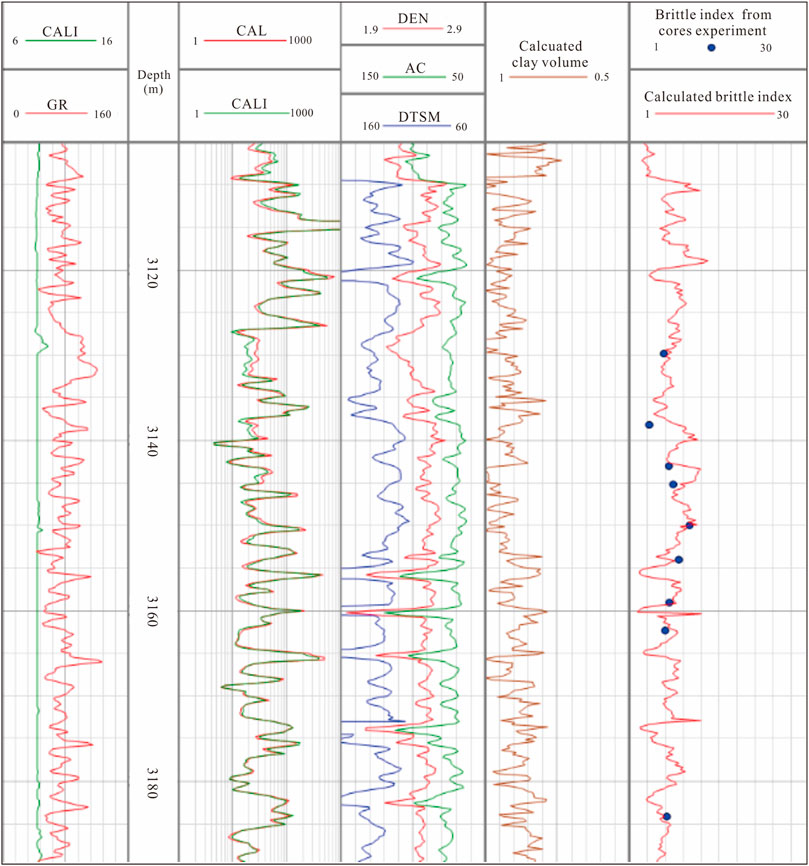
FIGURE 18. Processing results of the brittleness index of Well Ji 174.
Evaluation of In-Situ Stress and Rock Mechanics Parameters
Prediction Technology of the In-Situ Stress Direction
The prediction technology of the in-situ stress direction is relatively mature at present and mainly includes the borehole caving method and the drilling-induced fracture and prediction method based on fast shear waves (Zhao et al., 2005; Lei et al., 2007; Ding et al., 2009; Su et al., 2017). The principles of these methods have been introduced in detail in the relevant literature and are not repeated in this article (Zeng et al., 2010; Zeng et al., 2013; Gong et al., 2019; Gong et al., 2021a; Gong et al., 2021b). In this study, three methods were used to estimate the direction of the in-situ stress. The three methods confirmed the results of one another and improved the accuracy of the predicted principal stress direction. Figure 19 shows the comparison results of the three methods for in-situ stress evaluation. The figure shows that the direction of the maximum horizontal principal stress in this area is judged to be northwest-southeast by drilling-induced fractures. The direction of the minimum principal stress is ascertained as northeast-southwest by the elliptical wellbore caused by borehole caving. The direction of the maximum horizontal principal stress explained by the fast shear wave azimuth is also northwest-southeast. The directions of the maximum horizontal principal stress predicted by the three methods are basically the same.
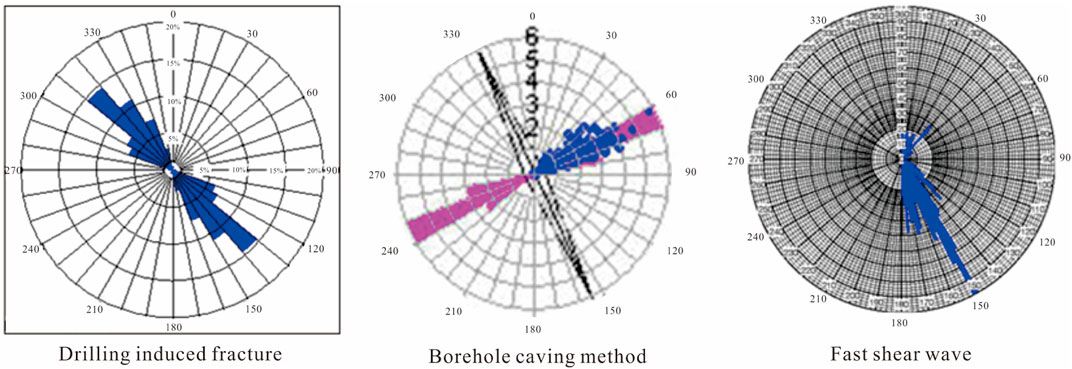
FIGURE 19. Stress direction identification of the Lucaogou Formation in the Jimsar Sag.
In-Situ Stress Prediction Technology
Using the fracturing data and considering the effect of tectonic stress, the preferred calculation method of in-situ stress is used to evaluate the magnitude of in-situ stress, and the formula is as follows:
where γ1 and γ2 are the tectonic stress coefficients of the maximum horizontal principal stress and the minimum horizontal principal stress, respectively.
“Seven Characteristics” of the Lucaogou Formation Shale Oil Reservoir
Through this research, the “seven properties” evaluation map is obtained (Figure 20). The figure shows that two common types of sedimentary rock reservoirs in the Permian Lucaogou Formation shale oil reservoirs in the Jimsar Sag have developed at depths of 3,116–3,120 m and are dominated by dolomitic debris beach facies. The main lithology is sandy debris-rich dolomite, with centimetre-level micrite and microcrystalline dolomite. The sand debris grain sizes are fine sand and silt sand. The dolomitic debris gradually increases with increasing depth, the brittleness index increases, the rupture pressure decreases, and the minimum horizontal principal stress is approximately 56 MPa. The delta front deposit facies is in the 3,127–3,134 m interval, the lithology is feldspar lithic silt-fine sandstone, the lithology gradually becomes finer from top to bottom, and the clay content increases. The clay content obviously controls the physical properties, and the physical properties and brittleness gradually become poor from top to bottom. The fracture pressure and the minimum horizontal principal stress gradually increase. The product of a mixed deposition of internal and external debris is in the interval of 3,143–3,146.5 m, and the main lithology is dolomitic debris silt-fine sandstone. The dolomitic debris content is high in the upper formation, the clay content is low, the physical properties are good, and the fracture pressure is low. Lithology has an obvious controlling effect on the physical properties. The mudstone basically contains no reservoir, and the reservoir lithology is fine-grained clastic rock and carbonate rock. The higher the clay content is, the worse the physical properties of the reservoir. Carbonaceous mudstone source rocks have the best quality, with TOC contents generally reaching more than 10%, followed by sandy and dolomitic mudstones. TOC contents are mainly from 2 to 6%. The reservoir itself also has a certain oil-generating capacity. The average carbonate content is 3.2%, and the silty sandstone content is 0.97%, which are typical characteristics of source-reservoir integration. The lithology has an obvious controlling effect on brittleness. The brittleness of reservoirs is obviously better than that of mudstone and source rock. The brittleness of reservoirs with high dolomite contents is better than that of silty sandstone reservoirs, and the brittleness becomes obviously worse with increasing clay content. The brittleness index of the upper dolomite sandstone is within 50–60, and the brittleness index of the lower dolomite sandstone is approximately 50. The closure stress and fracture pressure of mudstone are higher than those of shale oil reservoirs, and the fracture pressure of mudstone is approximately 4 MPa higher than that of reservoirs. Mudstone has a certain stress resistance to fracturing. The closure stress values of the reservoir section are within 56–58 MPa, and the closure stress is relatively high. A total of 14 oil layers were explained by the comprehensive logging evaluation, and 3 of them (No. 1, 6, 10) were preferably selected for oil fracturing, and an industrial oil flow with a daily output of 5.51 tons/day was obtained (Figure 20).
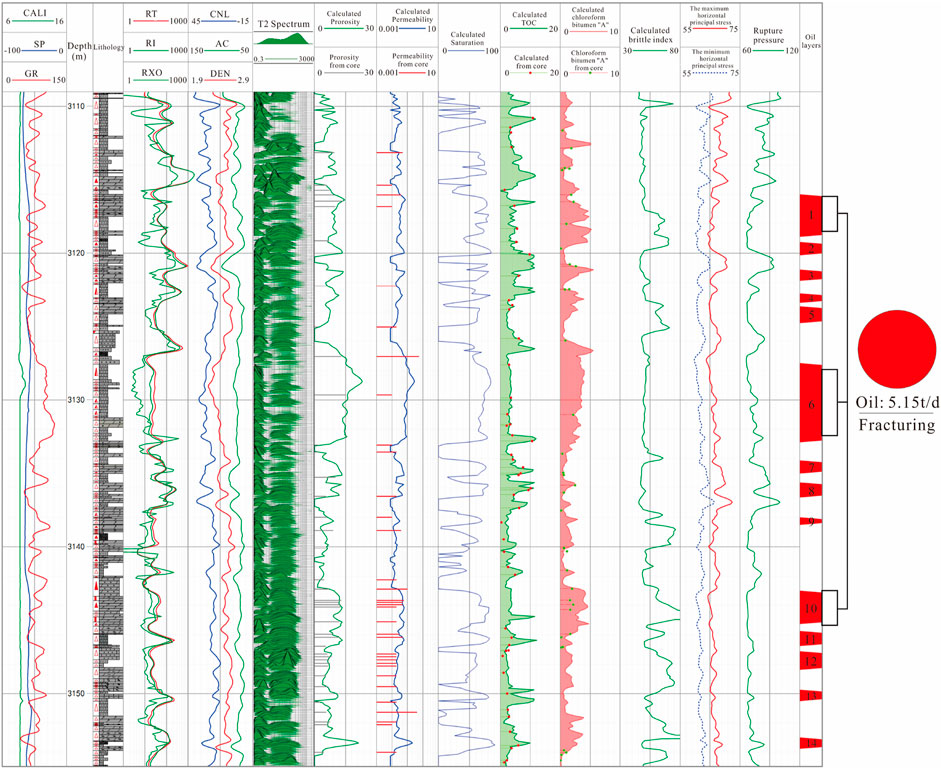
FIGURE 20. “Seven properties” evaluation map of J174.
Conclusion
1) A multilevel and multiparameter lithologic identification method for shale oil in the Lucaogou Formation in the Jimsar Depression was established, which effectively improved the identification accuracy of complex lithologies.
2) A shale oil reservoir physical property modelling method based on NMR technology was built; shale oil reservoir oiliness evaluation methods were studied, and calculation models for oil saturation, organic matter content, TOC and other parameters were established; and a logging characterization method for shale oil brittleness and in-situ stress was established.
3) The evaluation of the “seven properties” shows that in the Lucaogou Formation shale oil reservoir, the physical properties are controlled by lithology and oiliness is controlled by physical properties.
Data Availability Statement
The original contributions presented in the study are included in the article/supplementary material, further inquiries can be directed to the corresponding author.
Author Contributions
The first author HQ is responsible for the idea and writing of this article, and the co-authors JS, XH, AM, and YD are responsible for the experimental part.
Funding
The support of the National Natural Science Foundation of the China Youth Fund Project (41804138) is appreciated.
Conflict of Interest
Author HQ is employed by Research Institute of Exploration and Development, Xinjiang Oilfield Company, Karamay, Xinjiang, China.
The remaining authors declare that the research was conducted in the absence of any commercial or financial relationships that could be construed as a potential conflict of interest.
Publisher’s Note
All claims expressed in this article are solely those of the authors and do not necessarily represent those of their affiliated organizations, or those of the publisher, the editors and the reviewers. Any product that may be evaluated in this article, or claim that may be made by its manufacturer, is not guaranteed or endorsed by the publisher.References
References
Cheng, Z. G., Wu, Y. B., Li, G. L., Lin, W. C., and Xi, H. (2016). Application of NMR Logging to the Evaluation of Tight Oil Reservoirs. Well Logging Technology. 40, 719–725. doi:10.16489/j.issru.1004-1338.2016.06.012
Craddock, P., Herron, S. L., Badry, R., Horkowitz, J. P., and David, A. R. (2013). Hydrocarbon Saturation from Total Organic Carbon Logs Derived from Inelastic and Capture Nuclear Spectroscopy. SPE Annua Technical Conference and Exhibition, 166297.
Diao, H. (2013). Rock Mechanical Properties and Brittleness Evaluation of Shale Reservoir. Acta Petrologica Sinica. 29, 3300–3306.
Ding, W. L., Qi, L. X., Lu, H. T., and Yang, G. Q. (2009). Analysis of the Lower-Middle Ordovician Reservoir Tectonic Stress Field Using FMI Data in the South of Tahe Oilfield. Geoscience-Journal Graduate Sch. 23, 852–859.
Du, J. H., Hu, S. Y., Pang, Z. L., Lin, S. H., Hou, L. H., and Zhu, R. K. (2019). The Types, Potentials, and Prospects of Continental Shale Oil in China. China Pet. Exploration. 24, 560–568. doi:10.3969/j.issn.1672-7703.2019.05.003
Gao, Y., Ye, Y. P., He, J. X., Qian, G. B., Qin, J. H., and Li, Y. Y. (2020). Development Practice of continental Shale Oil in Jimsar Sag in the Junggar Basin. China Pet. Exploration. 25, 133–141. doi:10.3969/j.issn.1672-7703.2020.02.013
Gong, L., Fu, X., Wang, Z., Gao, S., Jabbari, H., Yue, W., et al. (2019). A New Approach for Characterization and Prediction of Natural Fracture Occurrence in Tight Oil Sandstones with Intense Anisotropy. Bulletin. 103, 1383–1400. doi:10.1306/12131818054
Gong, L., Wang, J., Gao, S., FuXiao, X., Liu, B., Miao, F., et al. (2021a). Characterization, Controlling Factors and Evolution of Fracture Effectiveness in Shale Oil Reservoirs. J. Pet. Sci. Eng. 203, 108655–108666. doi:10.1016/j.petrol.2021.108655
Gong, L., Gao, S., Liu, B., Yang, J., Fu, X., Xiao, F., et al. (2021b). Quantitative Prediction of Natural Fractures in Shale Oil Reservoirs. Geofluids. 2021, 1–15. doi:10.1155/2021/5571855
Guo, G. J., and Gu, C. C. (2005). Oil Saturation in Rock Cuttings Measured by Nuclear Magnetic Resonance. Chin. J. Magn. Reson. 22, 67–72.
Guo, H. F., Li, H. Q., Meng, Z. X., and Li, X. Y. (2009). Data Mining Based on Emergent Self-Organizing Map: New Method for Logging Rock Sexual Identification. J. Oil Gas Technology. 31, 67–70.
Guo, X. G., He, W. J., Yang, S., Wang, J. T., Feng, Y. L., Jia, X. Y., et al. (2019). Evaluation and Application of Key Technologies of "Sweet Area" of Shale Oil in Junggar Basin: Case Study of Permian Lucaogou Formation in Jimusar Depression. Nat. Gas Geosci. 30, 1168–1179. doi:10.11764/j.issn.1672-1926.2019.05.020
Huerlimann, M. D. (2003). A New Method of Measuring Saturation and Pore Geometry with Nuclear Magnetic Resonance. Logging and perforation. 2, 9–15.
Kevin, L. M., Mark, D., and Kuang, W. H. (2021). A Case Study of Vertical Hydraulic Fracture Growth, Stress Variations with Depth and Shear Stimulation in the Niobrara Shale and Codell Sand, Denver-Julesburg Basin. Colo. Interpretation. 9, 59–69. doi:10.1190/INT-2020-0246.1
Khoshnoodkia, M., Mohseni, H., Rahmani, O., and Mohammadi, A. (2011). TOC Determination of Gadvan Formation in South Pars Gas Field, Using Artificial Intelligent Systems and Geochemical Data. J. Pet. Sci. Eng. 78, 119–130. doi:10.1016/j.petrol.2011.05.010
Lei, M. S., Wang, Y. H., and Zhao, J. (2007). Analysis on Tectonic Stress Field of Xujiaweizi Rift in Daqing Oilfield with FMI. Geoscience. 21, 14–21.
Li, C. L., Li, C. X., Hou, Y. T., Shi, Y. J., Wang, C. S., Hu, F. L., et al. (2015). Well Logging Evaluation of Triassic Chang 7 Member Tight Reservoirs, Yanchang Formation, Ordos Basin, NW China. Pet. Exploration Development. 42, 608–614. doi:10.1016/s1876-3804(15)30061-6
Li, Q. H., Chen, M., Jin, Y., Hou, B., and Zhang, J. Z. (2012). Rock Mechanical Properties and Brittleness Evaluation of Shale Gas Reservoir. Pet. Drilling Tech. 40, 17–22. doi:10.3969/j.issn.1001-0890.2012.04.004
Mehdi, H., Henri, B., Benoit, D., Ollivier, F., Laurent, M., and Matthieu, S. (2008). Dielectric Dispersion: A New Wireline Petrophysical Measurement. Denver, USA: SPE Annual Technical Conference and Exhibition.
Mu, Y. L., Chen, J., Zhang, L. H., and Jin, K. N. (2015). Well Logging Evaluation and Study of Tight Oil Reservoirs-Taking Lucaogou Formation in Jimsar Sag as an Example. J. Yangtze Univ. (Natural Sci. Edition). 12, 21–26.
Passey, Q. R., Creaney, S., Kulla, J. B., Moretti, F. J., and Stroud, J. D. (1990). A Practical Model for Organic Richness from Porosity and Resistivity Logs. AAPG Bull. 74, 1777–1794. doi:10.1306/0c9b25c9-1710-11d7-8645000102c1865d
Schmoker, J. W. (1981). Determination of Organic-Matter Content of Appalachian Devonian Shales from Gamma-ray Logs. AAPG Bull. 65, 1285–1298. doi:10.1306/03b5949a-16d1-11d7-8645000102c1865d
Su, X. C., Hu, Z. D., Zhu, J. T., Liu, A. C., and Zhang, N. (2017). Application of Dipole Acoustic Logging in Ground Stress Evaluation. Inner Mongulia Petrochemical Industry. 43, 1–3.
Tao, Z. W., Li, Q., Xu, L. Q., and Xu, S. F. (2020). Evaluation on the Fracability of Deep Shale in Wufeng-Longmaxi Formation,Yongchuan Block, Sichuan Basin. Nat. Gas Technology Economy. 14, 7–12+27. doi:10.3969/j.issn.2095-1132.2020.05.002
Wang, H. J., Liu, D. A., Huang, Z. Q., Yuan, G. X., Lu, X. C., Niu, J. R., et al. (2017). Mechanical Properties and Brittleness Evaluation of Layered Shale Rock. J. Eng. Geology. 25, 1414–1423. doi:10.13544/j.cnki.jeg.2017.06.003
Wu, J. M., Ge, X., Li, D. C., and Jiang, L. (2015). Saturation Evaluation Technology of Tight Clastic Reservoir by Nuclear Magnetic Resonance Logging. World Well Logging Technology. 2, 19–22.
Yang, H. B., Chen, L., and Kong, Y. H. (2004). A Novel Classification of Structural Units in Junggar Basin. Xinjiang Pet. Geology. 25, 686–688.
Yin, C. F., Ke, S. Z., Jiang, M., Kang, Z. M., Wang, W. D., Sun, X., et al. (2017). Application of New Well Logging Technology in the Evaluation of "seven Properties" of continental Tight Oil: A Case Study on the Gaotaizi Oil Layer in the Northern Songliao Basin. Pet. Sci. Bull. 2, 32–43.
Yin, X. Y., Ma, N., Ma, Z. Q., and Zong, Z. Y. (2018). Review of In-Situ Stress Prediction Technology. Geophys. Prospecting Pet. 57, 488–504. doi:10.396j.i9/ssn.1000-1441.2018.04.001
Yuan, C., Zhou, C. C., Hu, S., Cheng, X. Z., and Dou, Y. (2014). Summary on Well Logging Evaluation Method of Total Organic Carbon Content in Formation. Prog. Geophys. 29, 2831–2837.
Zeng, L., Su, H., Tang, X., Peng, Y., and Gong, L. (2013). Fractured Tight Sandstone Oil and Gas Reservoirs: A New Play Type in the Dongpu Depression, Bohai Bay Basin, China. Bulletin. 97, 363–377. doi:10.1306/09121212057
Zeng, L., Wang, H., Gong, L., and Liu, B. (2010). Impacts of the Tectonic Stress Field on Natural Gas Migration and Accumulation: A Case Study of the Kuqa Depression in the Tarim Basin, China. Mar. Pet. Geology. 27, 1616–1627. doi:10.1016/j.marpetgeo.2010.04.010
Zhang, K. (2013). Shale Gas Revolution: Impact to China's Resources Exploration Strategy. Geology. Resour. 22, 259–263. doi:10.13686/j.cnki.dzyzy.2013.04.001
Zhang, L. Y., Li, J. Y., Li, Z., Zhang, J. G., Zhu, R. F., and Bao, Y. S. (2014). Advancements in Shale Oil/Gas Research in North American and Considerations on Exploration for Lacustrine Shale Oil/Gas in China. Advancements Earth Sci. 29, 700–711. doi:10.11867/j.issn.1001-8166.2014.06.0700
Zhang, X., Liu, J., and Hou, P. F. (2019). A Review on the Formation and Distribution Theories of the Shale Oil in China. Geology. Resour. 28, 165–170.
Keywords: the shale oil, petrologic characteristics, logging characterization, the shale oil brittleness, fracture
Citation: Qi H, Su J, Hu X, Ma A, Dong Y and Li A (2022) Study on Well Logging Technology for the Comprehensive Evaluation of the “Seven Properties” of Shale Oil Reservoirs—An Example of Shale Oil in the Lucaogou Formation in the Jimsar Sag, Junggar Basin. Front. Earth Sci. 9:827380. doi: 10.3389/feart.2021.827380
Received: 01 December 2021; Accepted: 31 December 2021;
Published: 10 February 2022.
Edited by:
Lei Gong, Northeast Petroleum University, ChinaReviewed by:
Weihong Wang, Northeast Petroleum University, ChinaHemin Yuan, China University of Geosciences, China
Copyright © 2022 Qi, Su, Hu, Ma, Dong and Li. This is an open-access article distributed under the terms of the Creative Commons Attribution License (CC BY). The use, distribution or reproduction in other forums is permitted, provided the original author(s) and the copyright owner(s) are credited and that the original publication in this journal is cited, in accordance with accepted academic practice. No use, distribution or reproduction is permitted which does not comply with these terms.
*Correspondence: Ang Li, Mjc1NzEyNzgwQHFxLmNvbQ==