 Jian Li
 Qi Li
Qi Li Lianbo Zeng3
94% of researchers rate our articles as excellent or good
Learn more about the work of our research integrity team to safeguard the quality of each article we publish.
Find out more
ORIGINAL RESEARCH article
Front. Earth Sci. , 18 January 2022
Sec. Structural Geology and Tectonics
Volume 9 - 2021 | https://doi.org/10.3389/feart.2021.826124
This article is part of the Research Topic Advances in the Study of Natural Fractures in Deep and Unconventional Reservoirs View all 29 articles
Fractures can provide valuable information on the tectonic evolution of the Earth’s crust. Our field observation data, rock core data, and thin section observations reveal several horizontal fractures in the Cenozoic mudstone strata in the western Qaidam Basin, Qinghai Province, China. These horizontal fractures have rough surfaces and are filled by gypsum. The fractures are mainly curved; however, some straight fractures are also found. There are many intersections between adjacent curved fractures, which often adjoin to form “T” shape fractures. Fracture apertures are mainly between 1 mm and 1 cm, with a maximum of 3 cm. Both the size and density of fractures decrease as strata denudation thickness decreases and depth of burial increases. Horizontal fractures are only found in a core area of anticlines with severe strata denudation. Accordingly, these fractures are related to vertical extension due to residual stress in the process of rapid uplift and denudation. The horizontal fractures cut earlier vertical tectonic fractures, indicating their formation after tectonic extrusion. Electron spin resonance (ESR) dating of fracture-filling materials revealed that horizontal fractures appeared in two stages. The first stage was approximately 1.8 Ma ago, while the second stage was approximately 0.3 Ma ago. The size and density of the later-stage horizontal fractures are markedly greater than the earlier-stage fractures. Based on the driving stress when fractures are formed, which is obtained from fracture parameters, the denudation rate in the later stage was approximately 2∼3-fold greater than that in the earlier stage. According to the evidence, during the Quaternary, the western Qaidam Basin experienced pulsating tectonic extrusion, producing uplift and denudation and an increase in tectonic activity. Such findings suggest a gradual increase in episodic tectonic activity in the entire Tibetan Plateau region during the Quaternary.
Fractures generally develop in near-surface strata, and can be found in nearly all lithologic and tectonic environments (Sibson, 1977). As discontinuities in the surface of rock, fractures play a key role in rock deformation and can provide important evidence of tectonic deformation processes. Fractures also function as pathways for underground fluid flows (Hindle, 1997; Hao et al., 2000; Zeng and Jin, 2000; Li, 2004). To understand the influence of fractures on these processes, their distribution and development must be clearly understood. Many studies have been carried out on fractures in the Qaidam Basin, including vertical open fractures, tectonic shear fractures, minor faults, bedding plane slip fractures, and horizontal open fractures. The development of these fractures depends on factors, such as tectonic deformation history and lithology (Liu Zhou 1998; Li and Wang, 2001; Zeng et al., 2012a, 2012b). Few studies have been conducted on horizontal fractures or their development characteristics and tectonic significance.
The Tibetan Plateau was formed when the Indo-Australian Plate and the Eurasian Plate collided 50∼60 Ma ago. The rapid subduction of the Indo-Australian Plate beneath the Eurasian Plate resulted in the rapid shortening and uplift of the entire Tibetan Plateau, including the Qaidam Basin (Yin & Harrison, 2000; Johnson, 2002). Many scholars have assessed the deformation history of the Tibetan Plateau and the dynamic mechanisms of plate collisions using geological and geophysical methods. The deformation histories of the Qaidam Basin (on the northern margin of the Tibetan Plateau) and the wider Tibetan Plateau are believed to be closely aligned. Therefore, understanding the evolution and deformation history of the Qaidam Basin will improve our understanding of the deformation and uplift of the entire Tibetan Plateau (Harrison et al., 1992; Fielding 1996; Zhou et al., 2006; Yin et al., 2008a; Zeng et al., 2012a). Seismic data and a balanced cross-section restoration of tectonic evolution have revealed that the Qaidam Basin experienced continuous extrusion in the Cenozoic. Further, in the relatively brief period of the Quaternary, the crustal shortening rate reached 32% or higher (Song and Wang, 1993; Dai & Cao, 2000; Zhou et al., 2006; Yin et al., 2008a; Yin et al., 2008b; Zeng et al., 2012a). Systematic studies on fauna, such as hipparions, flora, glacial remains, ancient karst landforms, and ancient soils have revealed that the average uplift rate of the Tibetan Plateau has been as high as 1 mm/year during the Quaternary (Wang & Coward, 1990). Other scholars have investigated the denudation rate of the Tibetan Plateau since the Late Cenozoic (0.17 Ma) using methods, such as low-temperature thermochronology, sedimentary stratigraphy, and analysis of river terraces. Based on their results, the maximum uplift rate is not higher than 0.72 mm/year (Arnaud et al., 1993; Wan, 1998; Wang et al., 2003; Cowgill, 2010; Cao et al., 2013; Pan et al., 2013; Sobel et al., 2013). Deposition velocity ranging from 19∼181 m/Ma in the Qaidam Basin and the thick layer of Quaternary sediment indicate a gradual increase in tectonic activity since the start of the Quaternary (Yu et al., 2018). Although many studies have been conducted on the uplift of the Tibetan Plateau in the Cenozoic, more research is required on the stages of activity in the Tibetan Plateau during the Quaternary and the differing intensities of tectonic activity during each stage.
Based on outcrop geological surveys and thin section observations, we conducted a detailed study of the features and size of horizontal fractures in Neogene strata in the western Qaidam Basin. Field measurements of horizontal fracture parameters were used to determine when the horizontal fractures were formed and the driving stress during their formation, as well as infer the uplift and denudation processes in the western Qaidam Basin during the Quaternary. Our results provide an important basis for understanding tectonic activity in the Qaidam Basin—and even the entire Tibetan Plateau—during the Quaternary.
The Qaidam Basin is located on the northern edge of the Tibetan Plateau, covering an area of approximately 1.2 × 10⁵ km2 and sits at an average elevation of 3,000–3,500 m, which is markedly lower than the surrounding mountains, with elevations of 4,000∼5,000 m (Dai and Cao, 2000; Zhou et al., 20006; Jin et al., 2004; Zeng et al., 2012a). The Qaidam Basin is surrounded by the Altun Mountains to the northwest, the Qilian Mountains to the northeast, and the Kunlun Mountains to the south, forming an approximate triangle around the basin (Figure 1). Mesozoic and Cenozoic sedimentary strata, which are 3∼16 km thick, have developed in the basin (Wang et al., 2012). These strata gradually decrease in thickness from the centre to the periphery of the basin (Wang et al., 2012). Since the start of the Cenozoic, basin strata mainly include alluvial plains, alluvial fans, fan deltas, fluvial facies, and lacustrine deposits. Further, the corresponding lithology is mainly sandstone, lacustrine marl, and mudstone. Based on data from magnetostratigraphy, microfossils, and isotope stratigraphy, Cenozoic strata can be divided into the following eight groups (from bottom to top): Lulehe Formation, Lower Ganchaigou Formation, Upper Ganchaigou Formation, Lower Youshashan Formation, Upper Youshashan Formation, Shizigou Formation, Qigequan Formation, and Chaerhan Formation (Ye et al., 1993; Zhou et al., 2006). The western part of the Qaidam Basin consists of the following nearly parallel northwest-southeast anticlines (from south to north): Youshashan Anticline, Shizigou Anticline, Ganchaigou Anticline, Youquanzi Anticline, Xianshuiquan Anticline, Nanyishan Anticline, Honggouzi Anticline, Xiaoliangshan Anticline, and Jiandingshan Anticline.
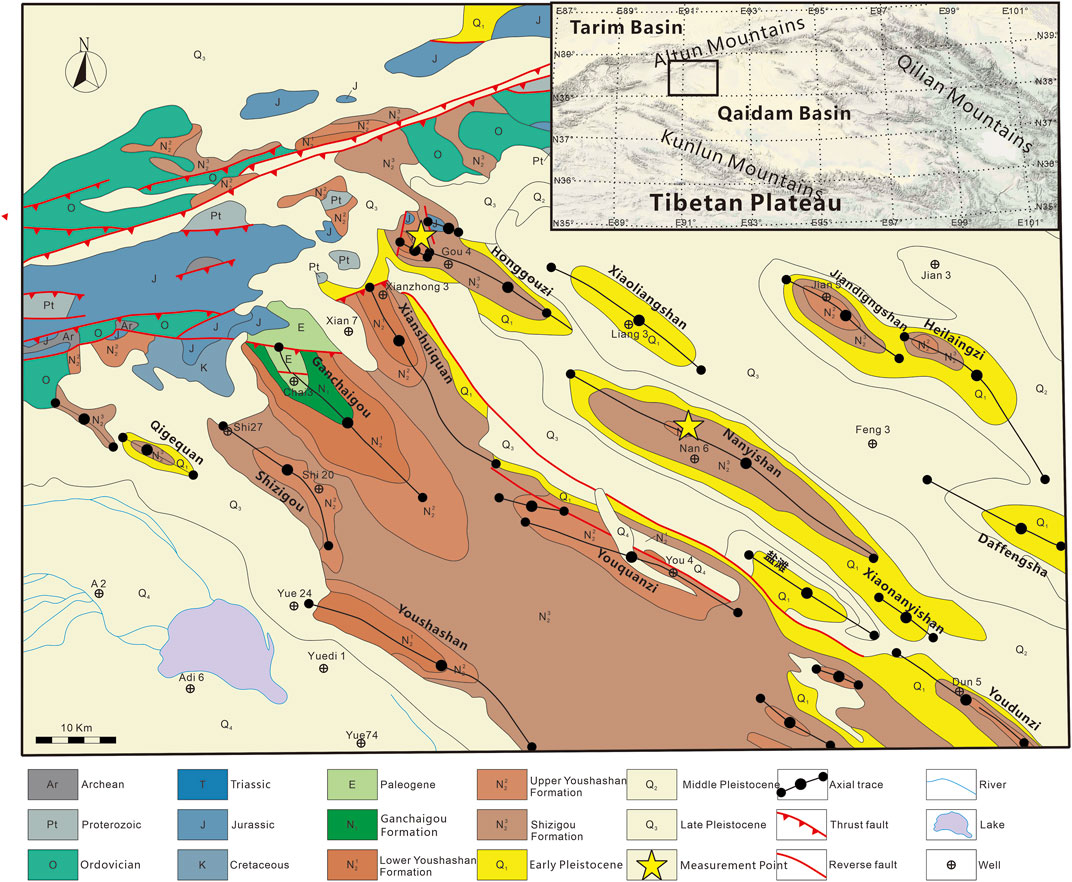
FIGURE 1. Location map and geological map of Qaidam Basin.
Horizontal fractures are open joints that occur approximately horizontally. Most horizontal fractures develop in inclined strata and obliquely intersect strata. Depending on the inclination of the stratum, the angle of intersection is between 5° and 30° (The angle is between the striate part of the horizontal fracture and the bedding.), and the fracture surface is often irregular, being nearly straight in the middle but curved at the ends (Figure 2A). Such curved fractures tend to intersect adjacent fractures, with the end of the fracture bending toward an adjacent fracture and often adjoining it to form a “T” shape. These strong fracture interactions and cutting phenomena are created under stress, where the magnitude of remote differential stress is less than the driving stress (Olson & Pollard, 1989; Olson, 1993; Thomas and Pollard, 1993). A small number of horizontal fractures developed in nearly horizontal strata. These horizontal fractures are basically parallel with the strata or intersect them at a small angle (<5°). Further, the fractures are generally straight. Zeng et al. (2012a) called this type of fracture “parallel open fractures” (Figure 2B). The size and density of horizontal fractures markedly vary in different tectonic settings, various positions in the same tectonic setting, and different depths of burial. Fracture apertures range from less than 1 mm to 10 cm (discussed in detail below). Horizontal fractures are open fractures with a rough and uneven fracture plane, and are filled by gypsum. According to field and microscopic observations, gypsum crystals grow from the surface to the centre of the fracture (Figure 3). The direction of growth of gypsum crystals is perpendicular to the fracture surface, and the two fracture surfaces have no observable relative displacement in the strike direction, indicating that these fractures are expansion fractures formed during the unloading process of rapid uplift and denudation (Bahat, 1999; Zeng et al., 2012a).
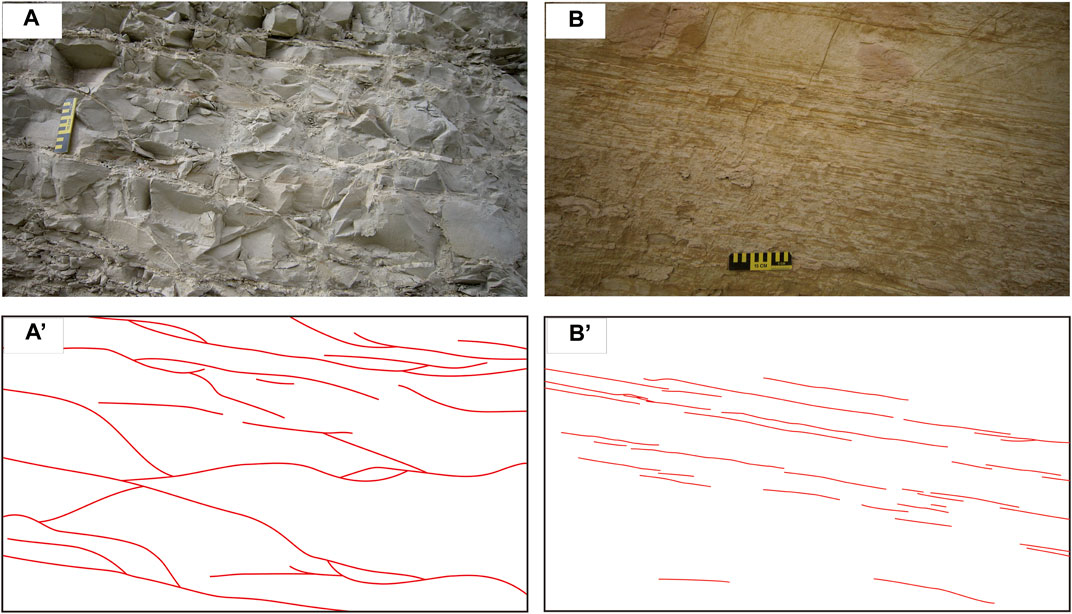
FIGURE 2. Horizontal fractures in the Neogene mudstone strata of the western Qaidam Basin. (A) Curved horizontal fractures obliquely intersecting strata (Xianshuiquan Anticline, Lower Youshashan Formation) (A’) is the sketches of fractures in (A); (B) Horizontal fractures nearly parallel to strata (Xianshuiquan Anticline, Lower Youshashan Formation, (B’) is the sketches of fractures in (B).
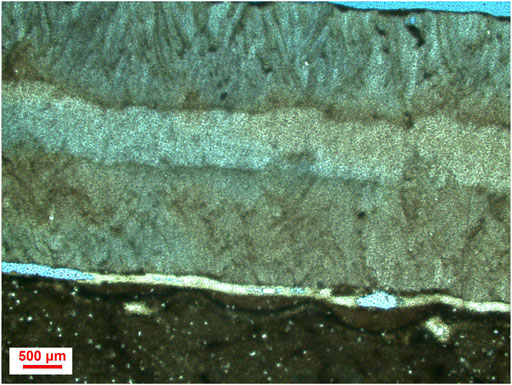
FIGURE 3. Horizontal fractures filled by gypsum in Paleogene strata in the western Qaidam Basin under a microscope (Xianshuiquan Anticline, Lower Youshashan Formation).
In this study, we conducted a detailed investigation of the development of horizontal fractures of outcrops in the western Qaidam Basin, including the Qigequan Anticline, Youshashan Anticline, Shizigou Anticline, Ganchaigou Anticline, Youquanzi Anticline, and Xianshuiquan Anticline, Nanyishan Anticline, Honggouzi Anticline, Xiaoliangshan Anticline, and Jiandingshan Anticline. Our field investigations revealed no horizontal fractures in sandstone strata in the southwest of the study area (Qigequan Anticline, Youshashan Anticline, Shizigou Anticline, and Ganchaigou Anticline). Nonetheless, horizontal fractures were found to have developed in mudstone strata in the northeast of the study area, but only in the core area of the Youquanzi Anticline, Xianshuiquan Anticline, Nanyishan Anticline, and Honggouzi Anticline. The Xiaoliangshan Anticline and Jiandingshan Anticline could not be assessed as there were no observable outcrops. Horizontal fractures were limited to mudstone strata of the Lower Youshashan Formation, the Upper Youshashan Formation, and the Shizigou Formation.
To assess the development of fractures in different tectonic settings and locations, we measured and calculated the apertures and density of outcrop horizontal fractures. Fractures are usually elliptical or spindle-shaped. Accordingly, we used a calliper to measure the greatest width to represent the fracture aperture. Of note, the fracture apertures measured in this study represent only the size in the profile planes of outcrops. Thus, the actual fracture apertures may be markedly larger than the measured apertures. Based on a three-dimensional shape hypothesis, the actual aperture of the fracture can be calculated by mathematical methods (Warburton, 1980); however, this is beyond the scope of this study. Based on our large volume of aperture data, statistical laws can reveal fracture aperture sizes at different statistical locations. Accordingly, we used field measurement results as the basis of our research. To measure fracture density, we used a vertical line segment on the outcrop and divided the total number of horizontal fractures that intersect the line segment by its length to obtain the fracture density at the measurement point.
The sizes of horizontal fractures change notably on planes, as illustrated by larger horizontal fracture apertures in areas with greater denudation of strata. We calculated the horizontal fracture apertures in the four tectonic settings of the Xianshuiquan Anticline, Honggouzi Anticline, Youquanzi Anticline, and Nanyishan Anticline (Figure 4). The horizontal fracture apertures were found to be largely between 0.9 and 4.5 mm in the Xianshuiquan Anticline, with an average aperture of 3.07 mm and a maximum of 32 mm; between 0.6 and 2.1 mm in the Youquanzi Anticline, with an average of 2.2 mm and a maximum of 15 mm; between 0.3 and 1.8 mm in the Honggouzi Anticline, with an average of 1 mm and a maximum of 11 mm; and between 0.1 and 1.5 mm in the Nanyishan Anticline, with an average of 0.8 mm and a maximum of 5 mm. Figure 4 shows the percentages of different fracture aperture sizes. As the high-quality outcrop is not always available, so we only conduct fielded measurements on limited locations. So the total number in different anticline varies. The total numbers of fractures in the Xianshuiquan Anticline, Honggouzi Anticline, Youquanzi Anticline, and Nanyishan Anticline were 804, 223, 212, and 177, respectively. The apertures and numbers of horizontal fractures showed a decreasing trend from the Xianshuiquan Anticline to the Youquanzi Anticline, Honggouzi Anticline, and Nanyishan Anticline. The geological map shows that the age of the exposed strata becomes younger as one moves from the Xianshuiquan Anticline to the Youquanzi Anticline, Honggouzi Anticline, and Nanyishan Anticline, indicating that the thickness of the denuded strata gradually decreases. Therefore, we can identify that the size of horizontal fractures increases with the increase in the denudation of strata.
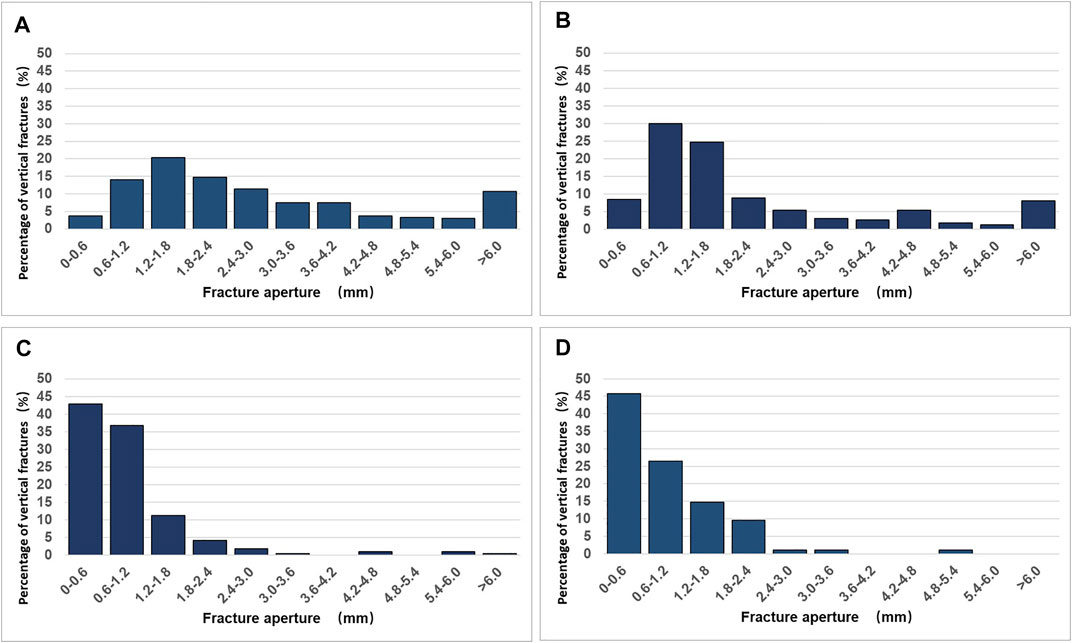
FIGURE 4. Frequency distribution of horizontal fracture openings in the western part of the Qaidam Basin.(A) Xianshuiquan Anticline, with 804 fractures; (B) Youquanzi Anticline, with 223 fractures; (C) Honggouzi Anticline, with 212 fractures; and (D) Nanyishan Anticline, with 177 fractures.
The scale and development degree of horizontal fractures were found to differ vertically. Notably, the average aperture and liner density of fractures decrease as depth of burial increases. Figure 5 shows a section in Youquanzi with excellent outcropping and observation conditions. We compiled statistics on the aperture and density of horizontal fractures at various locations of the cross-section. From measurement point A to point F, the relative depth of burial changes by 13 m, the linear fracture density increases from 11.9/m to 25.2/m, and the average aperture of fractures increases from 0.58 to 2.79 mm. Based on our measurements, we can conclude that the development degree and size of horizontal fractures decrease as depth of burial increases.
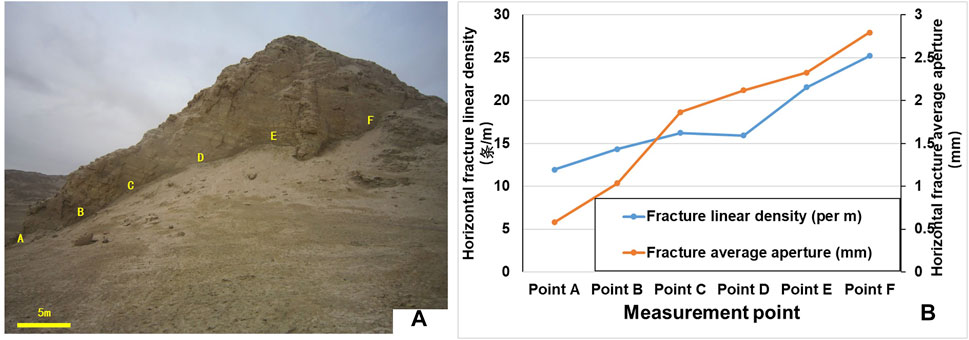
FIGURE 5. Changes in horizontal fractures with the depth of burial. (A) Cross-section of the horizontal fracture measurement points (Youquanzi Anticline, Upper Youshashan Formation); (B) Linear density and average aperture of horizontal fractures at different measurement points.
The mutual cutting and limiting relationships of fractures provide an important basis for determining fracture sequences. According to Zeng et al. (2012a), horizontal open fractures generally cut vertical tectonic fractures and were only developed in Paleogene and Neogene strata, indicating that they were formed in the late Quaternary period. Their proposal is largely consistent with our field observations of outcrops. The horizontal fractures observed herein only developed in the mudstone strata of the Neogene Shizigou Formation, Upper Youshashan Formation, and Lower Youshashan Formation, but not in the Paleogene strata. Horizontal fractures cut earlier vertical tectonic fractures (Figure 6A), indicating their formation after tectonic extrusion. Based on our observations, the horizontal fractures did not all form at the same time, but rather in two stages. The earlier (older) horizontal fractures are filled by transparent gypsum while the later (younger) horizontal fractures are filled with white “horse tooth-shaped” gypsum. According to our field observations, there are three positional relationships between the horizontal fractures formed in the later stage and those formed in the earlier stage (Figure 6B–D): first, the later-stage horizontal fractures filled with white “horse tooth-shaped” gypsum cut the earlier-stage fractures filled with transparent gypsum; second, later-stage horizontal fractures reopened and filled earlier-stage fractures; and third, later-stage horizontal fractures developed parallel to earlier-stage fractures. Cheng et al. (2002) used electron spin resonance (ESR) to accurately date gypsum veins of fractures in the western Qaidam Basin. Their dating results indicated that horizontal gypsum veins formed in two stages. The first formation was 1.83 Ma ago and the second formation was 0.28 Ma ago. This finding is consistent with the two-stage formation of horizontal fractures filled by gypsum observed in our field assessment. Therefore, the horizontal open fractures in the western Qaidam Basin were formed in the Quaternary period. The first-stage horizontal open fractures formed approximately 1.8 Ma ago and were filled by transparent gypsum; the second-stage horizontal open fractures formed approximately 0.3 Ma ago and were filled by white ‘horse tooth-shaped’ gypsum.
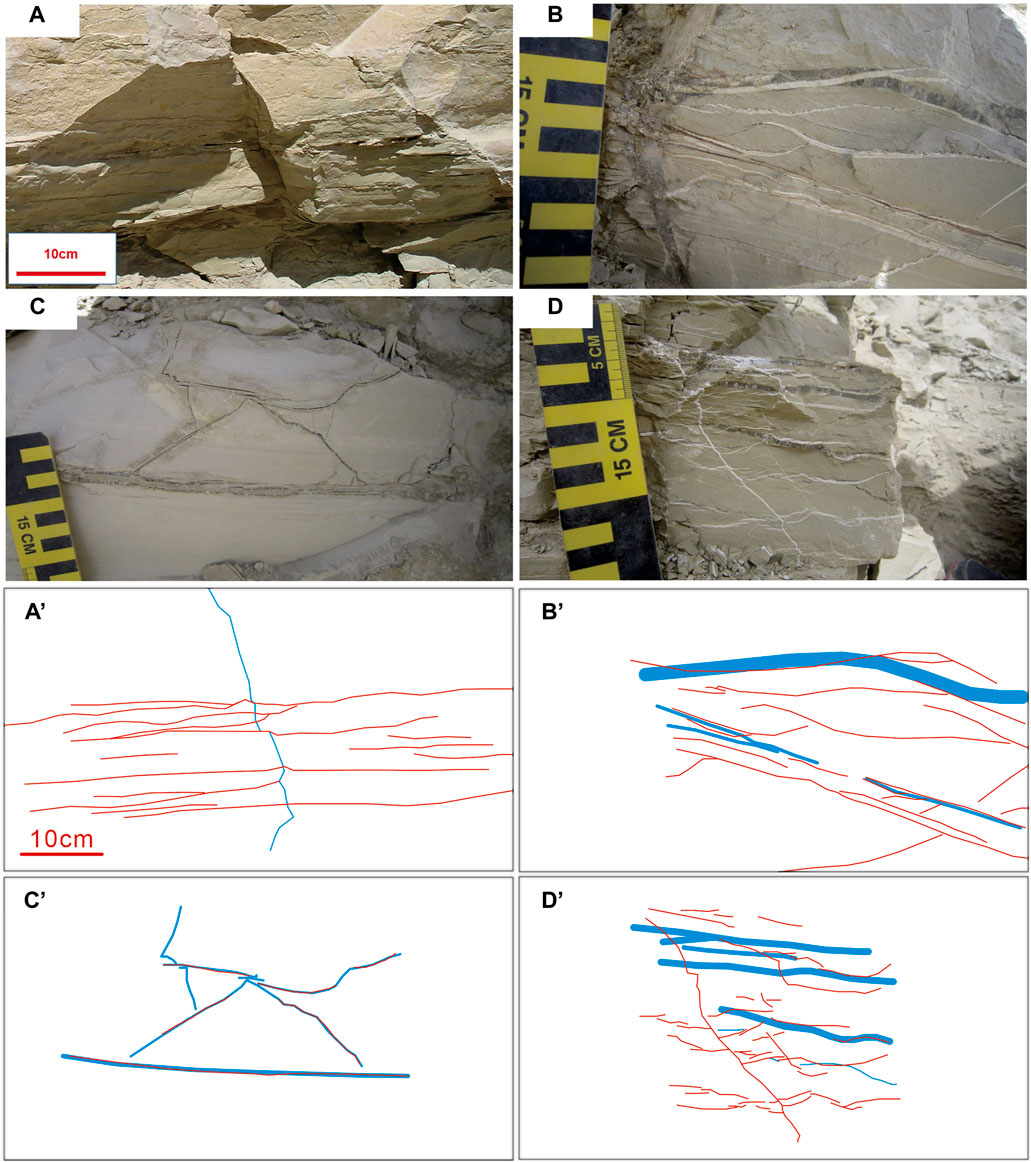
FIGURE 6. The positional relationships of fractures in Neogene mudstone strata in the western Qaidam Basin. (A) Later horizontal fractures cut earlier vertical tectonic fractures, (A’) is the sketches of fractures in (A); (B) Later horizontal fractures cut earlier horizontal fractures, (B’) is the sketches of fractures in (B); (C) Later horizontal fractures reopened earlier horizontal fractures, (C’) is the sketches of fractures in C; (D) Later horizontal fractures developed parallel to earlier horizontal fractures, (D’) is the sketches of fractures in (D).
To study the rock cracking process, the magnitude of the stress that caused the initial fracture must be determined. We introduce a method to calculate the strain caused by a fracture opening as the description followed in the field, we could infer the magnitude of the stress. However, simply multiplying this strain by Young’s modulus does not provide an accurate initial stress for the following reasons. First, the strain measured at the outcrop in the field is only part of the total strain. Second, as fractures evolve, strain changes over time. Therefore, the strain measured in the field is not equal to the strain when the fracture initially propagated. As a result, we propose the following method of calculating the driving stress when the rock initially cracked from field measurements of fracture strain caused by a fracture opening.
We hold that total rock strain consists of two parts: the fracture strain caused by the expansion of the rock volume induced by the fracture expansion, which is calculated as
where subscript f represents the ‘final state’ of the rock (i.e., total strain after fracture propagation stopped). Here, we assume that after fracture propagation stopped, the aperture of the fracture did not change. When the fracture first began to propagate, because the fracture had not yet propagated, the fracture strain was
where subscript i represents the initial state when the fracture began to propagate.
Our aim is to predict the magnitude of
Based on measurable data, the upper and lower limits of the initial strain
Because horizontal fractures are tensile fractures formed under fluid pressure and induced tensile stress in the process of strata denudation and unloading, the total strain when fracture propagation stopped was greater than the total strain when fracture propagation started; this is the first assumption (Eq. 3a). For the second assumption (Eq. 3b), the elastic strain when fracture propagation stopped was less than or equal to the elastic strain when fracture propagation started. Considering the contrary situation that the elastic strain is larger than or equal to that when fracture propagation started. In this situation the stress must exceed the tensile strength (or the fracture intensity factor is larger than fracture toughness), new fractures must form, or existing fractures will continue to propagate; thus, the second assumption is also true. Based on these two assumptions and field observation data, it is possible to determine the upper and lower limits of elastic strain when fracture propagation started.
As fractures propagate, the strength of the rock decreases. The effective modulus of elasticity
where
Substituting Eqs 1, 2, 5 into Eq. 3, the two hypotheses for determining the upper and lower limits of the initial elastic strain are expressed as follows:
The fracture strain and effective modulus of elasticity of the rock in its final state can be calculated from the outcrop field measurement results. Using Eq. 6, we can determine the upper and lower limits of the initial elastic strain when the rock started to crack based on the fracture strain and effective modulus of elasticity at the final state of the rock after fracture propagation stopped.
The effective modulus of elasticity of a fractured two-dimensional medium is given as follows (Walsh, 1965):
where
where A is the area of the two-dimensional medium, N is the total number of fractures, and
In summary, the upper and lower limits of initial stress
To further quantify the magnitude of stress during the formation of horizontal fractures, we selected two well-exposed sections of the Xianshuiquan and Nanyishan anticlines and measured the fracture strain caused by horizontal fractures. To facilitate the calculation, when selecting cross-sections, we avoided those that had horizontal fractures from the two stages. The cross-section in Figure 7A is in the Xianshuiquan Anticline, and the horizontal fractures are filled by white “horse tooth-shaped” gypsum. As a result, we can infer that these fractures were formed in the later stage, 0.3 Ma ago. The cross-section in Figure 7B is in the Nanyishan Anticline, and the horizontal fractures are filled by transparent gypsum; thus, we can infer that they were formed in the earlier stage, approximately 1.8 Ma ago.
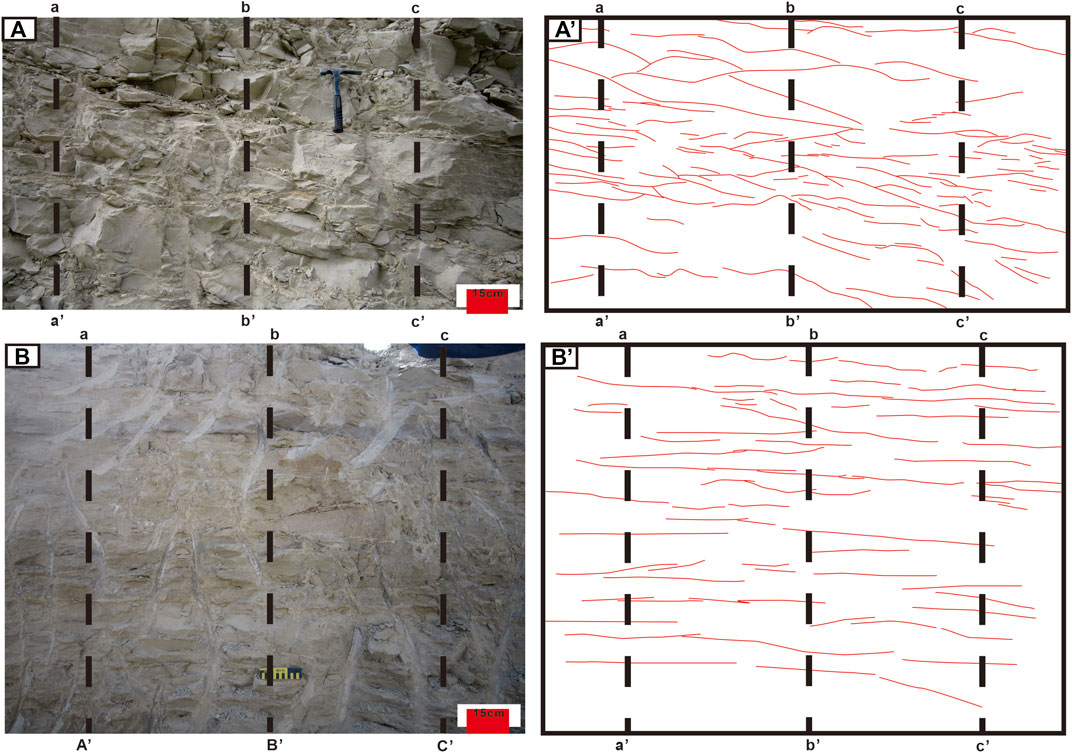
FIGURE 7. Cross-sections of the horizontal fractures used to calculate stress when fractures formed. (A) Horizontal fractures filled by white “horse tooth-shaped” gypsum from the later stage, indicated by a five-pointed star in Figure 1 at the Xianshuiquan Anticline, Lower Youshashan Formation, (A’) is the sketches of fractures in (A); (B) Horizontal fractures filled by transparent gypsum from the earlier stage, indicated by a five-pointed star in Figure 1 at the Nanyishan Anticline, Shizigou Formation, (B’) is the sketches of fractures in (B).
To calculate the fracture strain, we selected a vertical line segment on the cross-section and used a calliper to measure the width (not aperture) of fractures that intersected the line segment. Thereafter, we divided the sum of the widths of all intersecting fractures by the length of the line segment to obtain the fracture strain. Three parallel line segments at each cross-section were selected to measure and calculate fracture strain (Table 1). The average fracture strain of the Xianshuiquan cross-section was 0.0399 while that of the Nanyishan cross-section was 0.0147. The fracture strains calculated for the three-line segments at each cross-section differed only slightly. Thus, measurement errors can be considered negligible. In addition to measurement errors, there are two factors that can introduce errors into the calculation of fracture strain. First, during observation, small fractures, especially micro fractures, which are difficult to observe with the naked eye, will have been missed, which will detract from the fracture strain calculation. As there were fewer unmeasurable fractures relative to measurable fractures, this error is negligible. Second, the width of fractures that are now filled by gypsum was measured, and as gypsum filled the fractures via underground fluid movement, dissolution and metasomatism will have occurred to the fractured mudstone. As a result, the current width of fractures will be greater than their initial width, resulting in an overestimation of the fracture strain (Segall and Pollard, 1983). The error caused by fracture wall dissolution and metasomatism is more significant than the error introduced by omitted fractures. The errors caused by fracture wall dissolution and metasomatism are approximately two orders of magnitude larger than that introduced by omitted fracture; however, there is no effective method available to estimate the error introduced by fracture wall dissolution and metasomatism in the existing data. Therefore, the fracture strain measured and calculated in this study is the upper limit of the actual fracture strain.
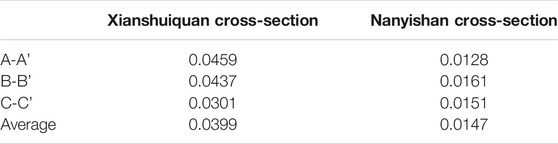
TABLE 1. Fracture strain of fractures in Figure 7.
Table 2 shows the parameters and calculation results based on the magnitude of the stress calculated during the two stages of horizontal fracture formation. The fracture strain and area density of fractures were calculated based on the measurements of horizontal fractures at the cross-sections. The modulus of elasticity E and Poisson’s ratio υ of the two cross-sections of rocks were measured from uniaxial rock mechanics tests. The rock samples for measuring rock mechanical parameters were collected from corresponding sections and processed into core columns 50 mm in length and 25 mm in diameter. The calculation results show that the earlier horizontal fractures in the Nanyishan cross-section have a lower limit of driving stress of 13.5 MPa when fractures started to propagate, and an upper limit of 80.9 MPa. The horizontal fractures from the later stage in the Xianshuiquan cross-section have a lower limit of driving stress of 25.4 MPa when fractures started to propagate, and an upper limit of 80.9 MPa. Evidently, the driving stress during fracture formation in the later stage was approximately 2∼3-fold higher than the driving stress during fraction formation in the earlier stage.
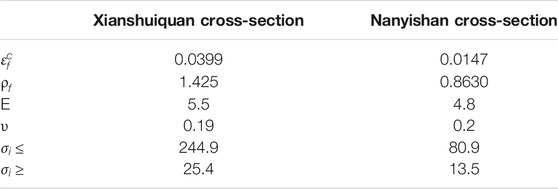
TABLE 2. Driving stress results of horizontal fractures from the two time periods and calculation parameters.
Lajtai (1977) and Zhang et al. (2009) discussed rock mechanics mechanisms of extension fracture formation during unloading. Their studies revealed that due to differing mechanical properties of constituent elements in various parts of the rock, different stress histories (loading), and the rock’s own mechanisms, there are differences in rebound in different parts of the rock mass during unloading, resulting in residual stress, which eventually leads to extension fractures in the rock mass. The first type of rebound is caused by differences in material properties. There are intricately connected particle systems of different material properties in the rock mass. During loading, rocks with strong elasticity only produce elastic deformation, while units with weak elasticity will continue to produce plastic deformation after elastic deformation, resulting in greater rebound during unloading in units with strong elasticity than units with weak elasticity. Thus, the compressive residual stress in units with strong elasticity will generate residual tensile stress of a similar magnitude as units with weak elasticity. As the compressive strength of ordinary rock mass is an order of magnitude higher than the tensile strength (Scholz, 2010), as the unload value increases, the residual stress also increases. Once residual stress reaches the tensile strength of the rock mass, tensile fractures can occur. The second rebound is caused by the different historical stresses of each unit of rock mass. A typical example is that rock matrix detrital particles undergo elastic deformation from compression before cementation occurs, with cementation occurring after compression. During unloading, the expansion of the rock matrix is limited by the cement. At this point, the cement changes to a tensile state and generates a residual tensile stress. When this stress exceeds the tensile strength of the cement, a tensile fractured surface that is nearly perpendicular to the rebound direction (i.e., the unloading direction) and along the grain boundary is produced. Regardless of the mechanical mechanism that forms the residual tensile stress, the magnitude of the residual tensile stress is proportional to the rebound deformation of the unit of elasticity in the rock mass. These two mechanisms assume that the unit with strong elasticity only undergoes elastic deformation; thus, its rebound deformation is directly proportional to the total unload value. Overall, residual tensile stress generated during the unloading process is proportional to the total unload value.
The horizontal fractures developed in Neogene mudstone strata in the western Qaidam Basin are open fractures that generally have large apertures. Fracture surface roughness is uneven, and the usual fracture shape is irregular and curved. These characteristics indicate that they are tensile fractures (i.e., they are formed by driving stress that is perpendicular to the fracture surface). Previous studies revealed no abnormally high pressure in the superficial layers of the western Qaidam Basin; thus, horizontal fractures could not have formed by fluid fracturing. Instead, horizontal fractures could only be formed due to induced residual tensile stress during rapid uplift and denudation. Thus, the development of horizontal fractures is likely due to large-scale uplift and denudation caused by strong extrusion and deformation in the western Qaidam Basin during the Quaternary. To quantitatively analyse the processes of uplift, denudation, and unloading, we assessed the driving stress
where
where
Eq. 13 shows that if the induced residual stress is the same, at the same location, the driving stress will decrease as the depth of burial increases, which will lead to a reduction in the size and development of horizontal fractures. Such proposal is consistent with our field observations of outcrops. In near-surface strata, as the depth of burial is shallow (i.e., the value of h is low), the driving stress
Based on the results of a balanced cross-section restoration of geological sections, Zhou et al. (2006) reported that 32% of the shortening of the Qaidam Basin occurred since the Early Pleistocene. Intense and rapid extrusion in the Quaternary has led to rapid uplift and denudation of the Qaidam Basin. Xiangjiang et al. (2018) studied deposition velocity in the Qaidam Basin and concluded that tectonic activity in the Qaidam Basin increased during the Quaternary.
This study evaluated tectonic activity in the western Qaidam Basin since the Quaternary from the perspective of horizontal fractures. Based on the evidence found, we can infer that tectonic extrusion and deformation in the western Qaidam Basin has not been continuous, but instead occurred in pulses during the Quaternary. Each pulse-like tectonic extrusion caused rapid uplift and denudation, resulting in the first stage of horizontal fractures. Our calculations of driving stress during horizontal fracture formation and ESR dating of fracture-filling gypsum indicate that the western Qaidam Basin experienced two major tectonic extrusion and uplift events during the Quaternary, the first 1.8 Ma ago and the second 0.3 Ma ago. As the driving stress during the second stage (0.3 Ma ago) of horizontal fracture formation was 2∼3-fold greater than during the first stage (1.8 Ma ago), we can speculate that the scales of tectonic extrusion and deformation as well as uplift and denudation were also 2∼3-fold greater in the second stage relative to the first stage. Such speculation suggests that tectonic deformation in the western Qaidam Basin significantly increased during the Quaternary. As tectonic activity in the Qaidam Basin shows good synchroneity with that of the rest of the Tibetan Plateau, the Tibetan Plateau has experienced episodic tectonic activity during the Quaternary, and the intensity of that activity has gradually increased.
1) Many horizontal open fractures have developed in Neogene mudstone strata of the western Qaidam Basin, which are approximately horizontal and parallel with or obliquely intersect the strata. All fractures are filled by gypsum and have rough fracture surfaces and irregular, curved shapes. Further, these fractures generally adjoin and intersect adjacent fractures. Horizontal fractures are tensile fractures formed under residual stress during rapid uplift and denudation.
2) The size and development of horizontal fractures are greater in areas with greater denudation; however, they decrease as the depth of burial increases. The horizontal fractures developed in two stages. The earlier-stage fractures formed 1.8 Ma ago and were filled by transparent gypsum while the later-stage fractures formed 0.3 Ma ago and were filled by white “horse tooth-shaped” gypsum. Our calculations indicate that driving stress during the formation of later-stage horizontal fractures was 2∼3-fold greater than the driving stress during the formation of earlier-stage horizontal fractures.
3) Based on evidence from the horizontal fractures, the western Qaidam Basin experienced two stages of rapid uplift and denudation caused by extrusion and deformation during the Quaternary. The first stage occurred 1.8 Ma ago while the second stage occurred 0.3 Ma ago. The scale of uplift and denudation in the later stage was 2∼3-fold greater than the uplift and denudation in the earlier stage, indicating that tectonic activity in the western Qaidam Basin increased during the Quaternary. Tectonic activity in the Qaidam Basin shows good synchroneity with that of the rest of the Tibetan Plateau. Accordingly, the Tibetan Plateau experienced episodic tectonic activity during the Quaternary, and the intensity of that activity has gradually increased. Qinmin and Coward, 1990.
The original contributions presented in the study are included in the article/Supplementary Material, further inquiries can be directed to the corresponding authors.
The first author JL is responsible for the idea and writing of this article, and the co-authors QL, LZ, ZZ, XD, and XL are responsible for the experimental part.
JL was a doctoral student of China University of Petroleum, Beijing. XD and XL were employed by the company China National Petroleum Corporation.
The remaining authors declare that the research was conducted in the absence of any commercial or financial relationships that could be construed as a potential conflict of interest.
All claims expressed in this article are solely those of the authors and do not necessarily represent those of their affiliated organizations, or those of the publisher, the editors and the reviewers. Any product that may be evaluated in this article, or claim that may be made by its manufacturer, is not guaranteed or endorsed by the publisher.
Arnaud, N. O., Brunel, M., Cantagrel, J. M., and Tapponnier, P. (1993). High Cooling and Denudation Rates at Kongur Shan, Eastern Pamir (Xinjiang, China) Revealed by40Ar/39Ar Alkali Feldspar Thermochronology. Tectonics 12, 1335–1346. doi:10.1029/93tc00767
Bahat, D. (1999). Single-layer Burial Joints vs Single-Layer Uplift Joints in Eocene Chalk from the Beer Sheva Syncline in Israel. J. Struct. Geology. 21, 293–303. doi:10.1016/s0191-8141(98)00118-7
Cao, K., Bernet, M., Wang, G.-C., van der Beek, P., Wang, A., Zhang, K.-X., et al. (2013). Focused Pliocene-Quaternary Exhumation of the Eastern Pamir Domes, Western China. Earth Planet. Sci. Lett. 363, 16–26. doi:10.1016/j.epsl.2012.12.023
Cheng, Z., Gao, J., Zhang, Y., Wang, X., and Field, Q. O. (2002). Eleectron Spin Resonance Dating of the Late Cenozoic Deformation Along the Central Altun Fault. Geol. Rev. S1, 140–145. doi:10.3109/00016925909171129
Cowgill, E. (2010). Cenozoic Right-Slip Faulting along the Eastern Margin of the Pamir Salient, Northwestern China. Geol. Soc. America Bull. 122, 145–161. doi:10.1130/b26520.1
Dai, J., and Cao, D. (2000). Evolution Charagteristics of Cenozoic Stuctural Styli in the Qaidam Basin. Geol. Rev. 46, 455–460. doi:10.1007/s11769-000-0051-4
Fielding, E. J. (1996). Tibet Uplift and Erosion. Tectonophysics 260, 55–84. doi:10.1016/0040-1951(96)00076-5
Hao, F., Li, S., Gong, Z., and Yang, J (2000). Thermal Regime, Interreservoir Compositional Heterogeneities, and Reservoir-Filling History of the Dongfang Gas Field, Yinggehai Basin, South China Sea. Evidence for Episodic Fluid Injections in Overpressured Basins. AAPG Bull. 84, 607–626. doi:10.1306/c9ebce69-1735-11d7-8645000102c1865d
Harrison, T. M., Copeland, P., Kidd, W. S. F., and Yin, A. (1992). Raising Tibet. Science 255, 1663–1670. doi:10.1126/science.255.5052.1663
Hindle, A. D. (1997). Petroleum Migration Pathways and Charge Concentration. A Three-Dimensional Model. AAPG Bull. 81, 1451–1481. doi:10.1306/3b05bb1e-172a-11d7-8645000102c1865d
Jin, Z., Zhang, M., Tang, L., and Li, J. (2004). Evolution of Meso-Cenozoic Qaidam basin and its Control on Oil and Gas. Oil & Gas Geology., 603–608.
Johnson, M. R. W. (2002). Shortening Budgets and the Role of continental Subduction during the India-Asia Collision. Earth-Science Rev. 59, 101–123. doi:10.1016/s0012-8252(02)00071-5
Lajtai, E. Z. (1977). A Mechanistic View of Some Aspects of Jointing in Rocks. Tectonophysics 38, 327–338. doi:10.1016/0040-1951(77)90218-9
Li, Y., and Wang, T. (2001). Middle-deep Fractured Oil Reserboir of Shizigou Area in Qaidam Basin, 28. Beijing, China: Petroleum Exploration and Development, 12–15. doi:10.3321/j.issn:1000-0747.2001.06.004
Liu, R., and Zhou, W. (1998). Evolution on Distribution of Natureal Fracture From Terriary Reservoir, Xianshuiquan Oil Field in Qaidam Basin. J. Mineralogy Pet. 18, 52–56.
Olson, J. E. (1993). Joint Pattern Development: Effects of Subcritical Crack Growth and Mechanical Crack Interaction. J. Geophys. Res. 98, 12251–12265. doi:10.1029/93jb00779
Olson, J., and Pollard, D. D. (1989). Inferring Paleostresses from Natural Fracture Patterns: A New Method. Geol 17, 345–348. doi:10.1130/0091-7613(1989)017<0345:ipfnfp>2.3.co;2
Pan, J., Li, H., and Sun, Z. (2013). Late Quaternary Uplift of the Northwestern Tibetan Plateau: Evidences from River Terraces in the Ashikule areaWest Kunlun Mountain. Acta Petrologica Sinica 29 29, 2199–2210.
Qinmin, W., and Coward, M. P. (1990). The Chaidam Basin (Nw China): Formation and Hydrocarbon Potential. J. Pet. Geol 13, 93–112. doi:10.1111/j.1747-5457.1990.tb00255.x
Scholz, C. H. (2010). A Note on the Scaling Relations for Opening Mode Fractures in Rock. J. Struct. Geology. 32, 1485–1487. doi:10.1016/j.jsg.2010.09.007
Segall, P., and Pollard, D. D. (1983). Joint Formation in Granitic Rock of the Sierra Nevada, 94. McLean, Va: Geological Society of America Bulletin, 563–575. doi:10.1130/0016-7606(1983)94<563:jfigro>2.0.co;2Joint Formation in Granitic Rock of the Sierra NevadaGeol. Soc. America Bull.
Segall, P. (1981). The Development of Joints and Faults in Granitic Rocks . Dissertation/doctor’s Thesis. Stanford, California]: Stanford University.
Sibson, R. H. (1977). Fault Rocks and Fault Mechanisms. J. Geol. Soc. 133 (3), 191–213. doi:10.1144/gsjgs.133.3.0191
Sobel, E. R., Chen, J., Schoenbohm, L. M., Thiede, R., Stockli, D. F., Sudo, M., et al. (2013). Oceanic-style Subduction Controls Late Cenozoic Deformation of the Northern Pamir Orogen. Earth Planet. Sci. Lett. 363, 204–218. doi:10.1016/j.epsl.2012.12.009
Song, T., and Wang, X. (1993). Structural Styles and Stratigraphic Patterns of Syndepositional Faults in a Contractional Setting. Examples from Quaidam Basin, Northwestern China. AAPG Bull. 77, 102–117. doi:10.1306/bdff8b78-1718-11d7-8645000102c1865d
Thomas, A. L., and Pollard, D. D. (1993). The Geometry of Echelon Fractures in Rock: Implications from Laboratory and Numerical Experiments. J. Struct. Geology. 15, 323–334. doi:10.1016/0191-8141(93)90129-x
Wan, J. (1998). Uplift of the Karibasheng and Kunzigan Granite in the West Kunlun Mountains. Geol. Rev. 44, 435–442.
Wang, E., Wan, J., and Liu, J. (2003). Late Cenozoic Geological Evolution of the Foreland basin Bordering the West Kunlun Range in Pulu Area. Constraints on Timing of Uplift of Northern Margin of the Tibetan Plateau. J. Geophys. Res. Solid Earth 108, 88–96. doi:10.1029/2002jb001877
Wang, Y., Zheng, J., Zhang, W., Li, S., Liu, X., Yang, X., et al. (2012). Cenozoic Uplift of the Tibetan Plateau: Evidence from the Tectonic-Sedimentary Evolution of the Western Qaidam Basin. Geosci. Front. 3, 175–187. doi:10.1016/j.gsf.2011.11.005
Warburton, P. M. (1980). A Stereological Interpretation of Joint Trace Data. International Journal of Rock Mechanics and Mining Sciences & Geomechanics Abstracts, 17. Pergamon, 181–190. doi:10.1016/0148-9062(80)91084-0
Yin, A., Dang, Y.-Q., Wang, L.-C., Jiang, W.-M., Zhou, S.-P., Chen, X.-H., et al. (2008a). Cenozoic Tectonic Evolution of Qaidam basin and its Surrounding Regions (Part 1). The Southern Qilian Shan-Nan Shan Thrust belt and Northern Qaidam basin, 120. Geol. Soc. America Bull. McLean, Va: Geological Society of America Bulletin, 813–846. doi:10.1130/b26180.1
Yin, A., Dang, Y.-Q., Zhang, M., Chen, X.-H., and McRivette, M. W. (2008b). Cenozoic Tectonic Evolution of the Qaidam basin and its Surrounding Regions (Part 3). Structural Geology, Sedimentation, and Regional Tectonic Reconstruction, 120. Geol. Soc. America Bull. McLean, Va: Geological Society of America Bulletin, 847–876. doi:10.1130/b26232.1
Yin, A., and Harrison, T. M. (2000). Geologic Evolution of the Himalayan-Tibetan Orogen. Annu. Rev. Earth Planet. Sci. 28, 211–280. doi:10.1146/annurev.earth.28.1.211
Yu, X., Guo, Z., and Zhang, D. (2018). Quaternary Shaking:evidences of Tectonic Intensification from the Qaidam basin and its Influence on Multi-Spherical Interaction. Quat. Sci. 38(1), 39–53. doi:10.11928/j.issn.1001-7410.2018.01.03
Zeng, L., Tang, X., Qi, J., Gong, L., Yu, F., and Wang, T. (2012a). Insight into the Cenozoic Tectonic Evolution of the Qaidam Basin, Northwest China from Fracture Information. Int. J. Earth Sci. (Geol Rundsch) 101, 2183–2191. doi:10.1007/s00531-012-0779-y
Zeng, L., Tang, X., Wang, T., and Gong, L. (2012b). The Influence of Fracture Cements in Tight Paleogene saline Lacustrine Carbonate Reservoirs, Western Qaidam Basin, Northwest China. Bulletin 96, 2003–2017. doi:10.1306/04181211090
Keywords: Qaidam Basin, mudstone, horizontal fracture, tectonic uplift and denudation, diving stress
Citation: Li J, Li Q, Zeng L, Zhu Z, Ding X and Li X (2022) Horizontal Fracture Formation in the Cenozoic Mudstone of the Western Qaidam Basin. Front. Earth Sci. 9:826124. doi: 10.3389/feart.2021.826124
Received: 30 November 2021; Accepted: 13 December 2021;
Published: 18 January 2022.
Edited by:
Lei Gong, Northeast Petroleum University, ChinaReviewed by:
Wenbiao Zhang, SINOPEC Petroleum Exploration and Production Research Institute, ChinaCopyright © 2022 Li, Li, Zeng, Zhu, Ding and Li. This is an open-access article distributed under the terms of the Creative Commons Attribution License (CC BY). The use, distribution or reproduction in other forums is permitted, provided the original author(s) and the copyright owner(s) are credited and that the original publication in this journal is cited, in accordance with accepted academic practice. No use, distribution or reproduction is permitted which does not comply with these terms.
*Correspondence: Jian Li, cGhvZW5peC5saWppYW5AZ21haWwuY29t; Qi Li, bGlxaUBjdWdiLmVkdS5jbg==
Disclaimer: All claims expressed in this article are solely those of the authors and do not necessarily represent those of their affiliated organizations, or those of the publisher, the editors and the reviewers. Any product that may be evaluated in this article or claim that may be made by its manufacturer is not guaranteed or endorsed by the publisher.
Research integrity at Frontiers
Learn more about the work of our research integrity team to safeguard the quality of each article we publish.