- 1College of Civil Engineering, Fuzhou University, Fuzhou, China
- 2Sichuan University-The Hong Kong Polytechnic University Institute for Disaster Management and Reconstruction, Sichuan University, Chengdu, China
- 3College of Civil Engineering, Tongji University, Shanghai, China
In recent years, earthquake rockfalls have occurred frequently all over the world, resulting in heavy casualties and property losses. Unfortunately, research on rockfall dynamics upon earthquake events is still rare due to limited field and experimental data, and restricted to numerical simulations of only two dimensions. In order to primarily reveal the role of earthquakes on rockfall, this study focused on the stability of rock blocks on an inclined slope, and following rockfall dynamics by three-dimensional discontinuous deformation analysis (3-D DDA). First, earthquake input methods were discussed and implemented for the triangulated regular network (TRN) in 3-D DDA. The effectiveness was verified by comparison with analytical solution results of a single block on the inclined slope under seismic loads. Further, by discussing the variations of the boundary chart of failure modes, it indicated that the block was more prone to slide even with a large friction angle, became instability under seismic conditions. Moreover, a regular dodecahedron rock block was released on a stochastic roughness slope with two platforms through parallel realizations. The indices of the movement characteristics of the block, such as runout distance, lateral displacement range, and resting position, were investigated. The results showed that the maximum runout distance was not sensitive to seismic load, but the lateral displacement range was significantly sensitive to seismic load and increased appreciably. Through the 3D-DDA numerical simulations, both rock stability and rockfall behaviors under earthquake conditions could be better understood. Furthermore, it will be helpful to by analyzing trajectories and kinetic energies predict earthquake rockfall disasters and design reasonable protective countermeasures under earthquake scenarios.
1 Introduction
Dangerous rock refers to a rock mass cut into by multiply sets of joints, generally in an unstable state or a state of limited equilibrium under the action of gravity, an earthquake, rainfall, or other external forces (Chen et al., 2003). It is usually located on a high and steep slope or cliff, suddenly loses its stability, and forms a rockfall or even a rock avalanche. After one or more combinations of falling, rebound, jumping, rolling, or sliding, the falling rock masses move rapidly downward, finally coming to rest in relatively flat areas or being stopped by an obstacle. Dangerous rocks are difficult to identify, although the 3S technologies and AI algorithms that have been developed aid substantially (Huang et al., 2017a; Huang et al., 2021a; Huang et al., 2021b) due to the small volume and uncertain occurrences (Dorren, 2003). In addition, Due to the high-altitude and extremely energetic characteristics, rockfalls usually have destructive characteristics (Volkwein et al., 2011), which can pose a serious threat to roads, railways, buildings, and other structures by means of impact and burial (He et al., 2014; Yuan and Pei, 2014; Hou et al., 2010).
Among the external forces triggering instability, earthquake is one of the major causes of rockfall. In recent years, rockfall and collapse disasters caused by earthquakes have occurred frequently all over the world, resulting in heavy casualties and property losses. There were co-seismic and post-seismic disasters in the recent 2008 Ms 8.0 Wenchuan earthquake (Yin et al., 2009; Li and Kong, 2011; Su et al., 2012; Cheng and Su, 2014), 2013 Ms 7.0 Lushan earthquake (Chen et al., 2013a; Pei and Huang, 2013; Cheng and Zheng, 2014; Li et al., 2014), 2014 Ms 6.5 Ludian earthquake, and 2017 Ms 7.0 Jiuzhaigou earthquake (Cheng et al., 2018). The effect of an earthquake on rockfall is manifested as showing large scale, huge quantity, and tremendous destructiveness, occurring even with small slope angles under small magnitudes (Qiu et al., 2009). For example, there were 1884 new potential rockfalls after the Wenchuan earthquake, more than triple those that were revealed before 2008. Rockfalls comprise an even larger proportion of the secondary geo-hazards induced by the Lushan earthquake (Li and Kong, 2014). Meanwhile, statistical data shows that there were 15 typical earthquakes (magnitude greater than 5.0) that occurred in Southwest China (Wang, 2019) within the last 10 years. More than 100 earthquakes with a magnitude greater than 3.0 occurred in Sichuan Province within 2020. Therefore, it is undoubtedly of great theoretical significance and engineering application value to study the failure mechanism of dangerous rock masses and the following rockfall dynamics under earthquakes.
Marzorati et al. (2002) investigated the earthquake-induced collapsed boulders in Umbria and Marche, Italy in 1997, and studied the relationship between the frequency of rockfalls and the environment and seismic parameters by using mathematical statistics. Li et al. (Pei et al., 2011) investigated the extremely long-runout rock avalanches and rockfalls induced by the Wenchuan earthquake, and pointed out that under the action of seismic force, the collapsed rock mass was thrown out at a certain initial speed, which is different from the ones induced by gravity only. The former has high initial speed, large kinetic energy, and a wide influence range of rockfalls. Unfortunately, research on rockfall dynamics upon earthquake events was still rare involved due to the long recurrence period and limited field data on rockfalls during earthquakes.
Laboratory experiments were also rare or missing in the literature. Huang et al. (2019) obtained the rockfall data under earthquake by the shaking table test and proposed a prediction model based on an improved KNN algorithm.
Stability analysis and trajectory modeling using the discrete numerical methods (the distinct element methods, UDEC, PFC, and et al.; Discontinuous deformation analysis, DDA) have the advantage of representing the physical details of dangerous rock masses and following rockfalls, especially under the seismic scenario.
Based on UDEC, Teng et al. (2013) investigated the influence of seismic intensity on the stability of a rock slope with two groups of joints. An actual seismic recording was implemented. Gao (Gao, 2015) used UDEC to reproduce the collapse process of dangerous rock mass under different terrain, geology, and seismic input conditions. The results were summarized to describe the influence of seismic input on the collapse mode and time. Xue (Xue, 2016) used UDEC to establish a simplified model of two-dimensional expressway high rock slope, discussed the failure mechanism of high rock slope under seismic load. The rockfall dynamics after the collapse were recorded and analyzed. In addition, the impact force to the retaining wall was calculated according to the law of conservation of momentum.
Hatzor and Feintuch (Hatzor and Feintuch, 2001) applied different forms of sine wave horizontal acceleration to an inclined slope in 2001 and studied the sliding characteristics of blocks on the slope, and proved that DDA can simulate earthquake rock collapses and rockfalls; in 2004 (Hatzor et al., 2004), a two-dimensional DDA method was proposed to add time-varying acceleration as a physical force to each block. This method can accurately predict the failure mode of key blocks of jointed rock slopes. Kamai and Hatzor (Kamai and Hatzor, 2008) established a two-dimensional slider model, inputting the displacement time history to the bedrock, studied the dynamic characteristics of the bedrock underlying earthquakes, and obtained the numerical results which are in good agreement with the theoretical solution. Zhang (Zhang, 2011) focused on the collapses developed along a highway during the Wenchuan earthquake as a research object, used the 2-D DDA to study the failure mechanism of rockfalls and rock avalanches under strong earthquakes. Huang et al. (Huang et al., 2016) focused on that the friction coefficient should be gradually reduced in the numerical simulation of seismic rockfall. Based on this, an improved two-dimensional DDA method was proposed. Chen and Wei (Chen and Wei, 2017) analyzed the phenomenon of collapse and rockfalls caused by the failure of dangerous rock mass due to earthquake by 2-D DDA, studied the rockfall dynamics and put forward protection suggestions. Huang et al. (Huang et al., 2017b) studied the influence of seismic load on the rockfall dynamics after the collapse of dangerous rock mass using the 2-D DDA method. The results implied that the influence of vertical seismic load on collapsing blocks is even greater than that of horizontal seismic load. Zhou et al. (2021) simulated the rockfall dynamics of an actual potential rockfall site, and evidenced the special thrown out phenomenon under seismic conditions.
The previous investigation of earthquake rockfall was mostly limited to 2-D numerical simulation. The important lateral displacement could not be obtained. In addition, the stochastic random nature of rockfall was also ignored.
Beyabanaki et al. (2009) compared the block displacement solution obtained by the 3-D DDA method with the analytical solution under dynamic load to verify the effectiveness of the three-dimensional DDA method. Chen et al. (2013b) compared the differences in the prediction of rockfall dynamics between 2-D and 3-D DDA simulations and proposed a TRN (triangulated regular network) in 3-D DDA, which could be feasibly used to demonstrate the random roughness of slope surface by disturbing the elevation of each gridpoint. Based on the above, this paper implemented a virtual depth to TRN and conducted acceleration wave on its cells to develop a new rockfall simulator based on 3-D DDA. The algorithms were first validated based on comparison to the theoretical solution of block stability on an inclined slope. The variation of failure mode was also used to demonstrate the influence of seismic loading on the stability of the dangerous rock masses. The role of an earthquake on rockfall dynamics was then discussed especially in terms of runout distance and lateral displacement.
2 Methods
2.1 Fundamental Theory of 3-D DDA
2.1.1 Block Displacements and Deformations
For a 3-D DDA formulation, the linear system has twelve degrees of freedom for each individual block with an arbitrary polyhedral shape:
where (u0, v0, w0) are the rigid body translations of a specific point (x0, y0, z0) of Block i, (rx, ry, rz) are the rigid body rotations of Block i with the center of rotation at (x0, y0, z0), and (ɛx, ɛy, ɛz), and (γyz, γzx, γxy) are the normal and shear strains on Block i, respectively. The displacement of an arbitrary point (x, y, z) in Block i is:
where [Ti (x, y, z)]is the formula for the displacement function of Block i, which is given by:
2.1.2 Equations of Motion
The total potential energy is the summation of all of the potential energy sources from the block stiffness, the initial stress, the point loads, the body loads, the inertia forces, the constraint springs of fixed points or measured displacements, and the contact forces between the blocks.
The equations of motion for a system of n blocks is derived by minimizing the total potential energy:
where Kij and Fi are 12 × 12 stiffness submatrices and 12 × 1 loading vectors, respectively. The submatrices Kii depend on the material properties of Block i, and Kij (i ≠ j) is defined by the contacts between Blocks i and j. For additional details, the interested reader is referred to Shi (Shi, 1988; Shi, 2001).
2.2 Description of Seismic Input
2.2.1 Triangulated Regular Network for the Terrain of a Slope
Kinematic analyses of rockslides only consider the kinematic behavior of the displaced rocks, and the slope merely serves as the boundary for these rocks to interact with. Moreover, the ground motion and deformation that are induced by the rockslide are neglected due to their small values; for example, the velocities induced by a 2.5 × 10⁶ m3 rockslide are on the order of 10−6 m/s (Favreau et al., 2010). Therefore, it is not necessary to generate a slope as blocks. A simpler slope model for the terrain of a slope, such as a triangulated regular network (TRN), can play a similar role as the boundary of the blocky slope.
The terrain of the slope in the raster format is represented mathematically by a set of elevation points in the form of an m × n matrix (where m and n are the rows and columns of the matrix, respectively) of elevations. The faces in 3-D DDA are defined as plane polygons. Therefore, it is necessary to divide each cell into two triangles (Figure 1). For the special contact treatment and the corresponding validations, the interested reader is referred to Wang et al. (2017).
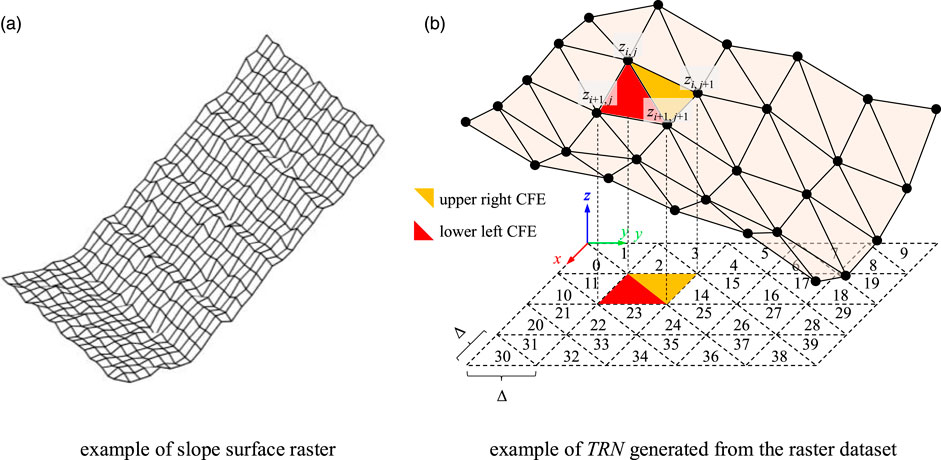
FIGURE 1. Scheme of the sloping topography described by the TRN map. (A) example of slope surface raster, (B) example of TRN generated from the raster dataset.
2.2.2 Basic Assumptions of Seismic Input and DDA Implementation
The DDA can consider seismic loading in three forms: acceleration, velocity, and displacement time histories. Loading of time-dependent acceleration is widely used by many researchers to conduct earthquake analysis (Hatzor and Feintuch, 2001; Sasaki et al., 2004; Favreau et al., 2010; Wu; Ning and Zhao, 2013). In practice, acceleration loading is usually used to the failure rockfall (method 1) or the slope (method 2) as volume forces.
When the rockfall mass travels over the slope, method 1 could generate the wrong displacement (Wu). In 2-D, method 1 is more suitable for the pseudo-static analysis for the stability problem of dangerous rock; method 2 has been validated to be more adaptable for rock avalanche and rockfall problems (Zhang et al., 2013; Zhou et al., 2021).
However, the TRN only performs the rigid boundary without density. It is difficult to generate volume forces by acceleration loadings. Hence, a virtual depth of 1 m was set for each TRN cell. In order to simulate the main features of 3-D rockfall, This paper quotes some basic assumptions proposed by Zhang et al. (2013):
(1) Blocks are treated as 3D polyhedrons;
(2) Rockfall masses could be divided into smaller blocks by pre-existing joints;
(3) Geometry of the slope model is presented by TRN with a virtual depth of 1 m;
(4) Earthquake forces only act on the TRN cells.
(5) Density of TRN cells is assumed as 105 times to avoid the influences of gravity and the impact of falling blocks.
(6) Gravity acceleration acting to TRN is set to zero to make up-down free vibrations.
A TRN slope with virtual depth was then constructed based on the raster data shown in Figure 1A. The real seismic acceleration record (Figure 2A) from MZQP stations during the Wenchuan earthquake was horizontally-vertically loaded to the TRN virtual blocks. Relative displacement time histories are also shown in Figure 2B. The 3-D DDA results are notably consistent with the theoretical integration results.
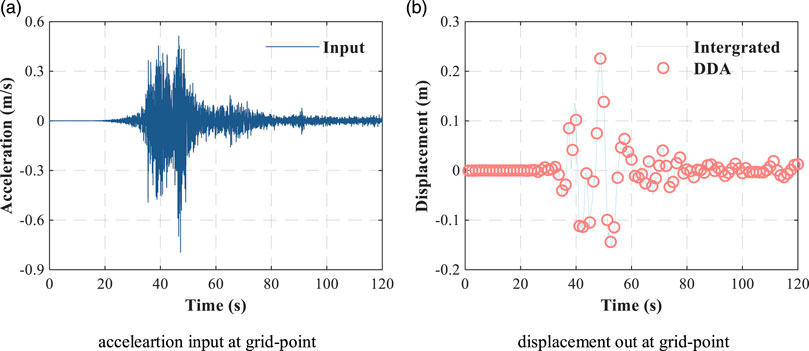
FIGURE 2. Example of the input displacement time history using TRN with virtual depth. (A) acceleration input at grid-point, (B) displacement out at grid-point.
3 Validation by Stability Analysis of Single Block on an Inclined Plane
3.1 State Boundary
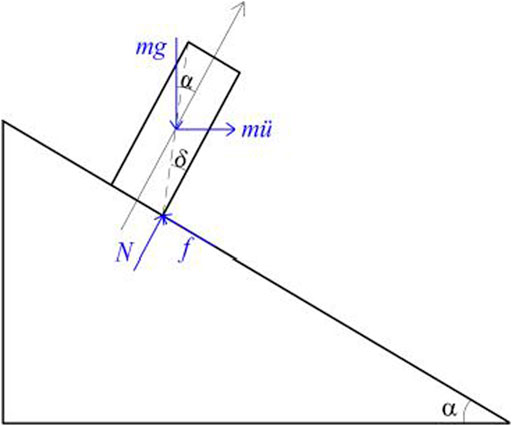
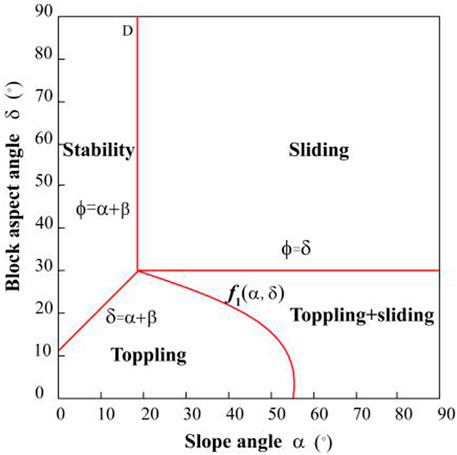
A block on an incline (Figure 3) has four different possible states: ① static stability, ② downslope sliding, ③ toppling, and ④ toppling and sliding simultaneously. Its state is controlled by the geometry of both the block and the inclined plane, and the frictional resistance of the interface between them, the three of which are defined by three angles as follows (Figure 3):
Define the pseudo-static force
① the critical angle between stability and sliding:
② the one between stability and toppling:
③ the one between sliding and sliding + toppling:
④ the one between toppling and sliding + toppling:
if
3.2 Verification of the Boundaries With DDA
To directly compare with the theoretical solution results, method 1 was adopted here to validate the dynamic accuracy of 3-D DDA with TRN.
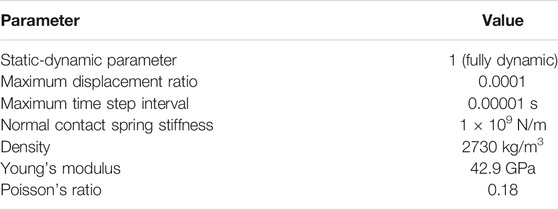
The numerical control parameters used in the DDA verification are provided in Table 1.
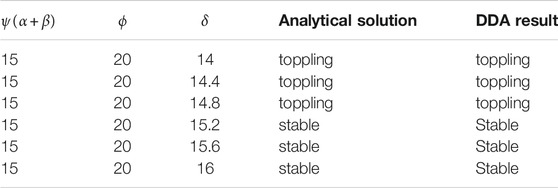
Then 3d-DDA stability analysis of a single block under the same horizontal seismic load was conducted. By taking
3.3 Influence of Seismic Load
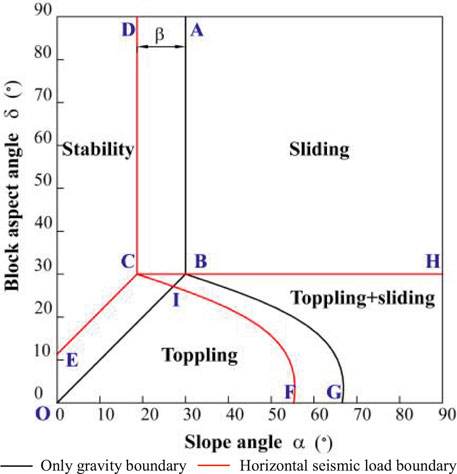
Compared with the condition of only gravity, the total boundary figure remains similar, but there is a translation determined by both the size
In the figure, the black lines BA, BO, BG, and BH are the boundaries with gravity only, and the red lines CD, CE, CF and CH are the boundaries with horizontal pseudo-static force. When the boundary moves a unit to the left, the stable region decreases significantly, and the sliding region increases by the area of ABCD, indicating that the original stable state changed into sliding after adding seismic load, that is, the block was more prone to slide. The toppling region decreases by the area of BGFI, indicating that the original toppling state was transformed into a toppling + sliding state under seismic conditions. The original stable state was transformed into toppling after adding seismic load as shown in the CIOR region. The calculated BGFI area is greater than CIOE, indicating that the proportion of toppling was reduced. The area where sliding and toppling occur simultaneously increases the area of the CBGF part, indicating that the application of horizontal seismic force had a great influence, and the stability was significantly decreased.
Assuming that the seismic acceleration was 0.2 g,
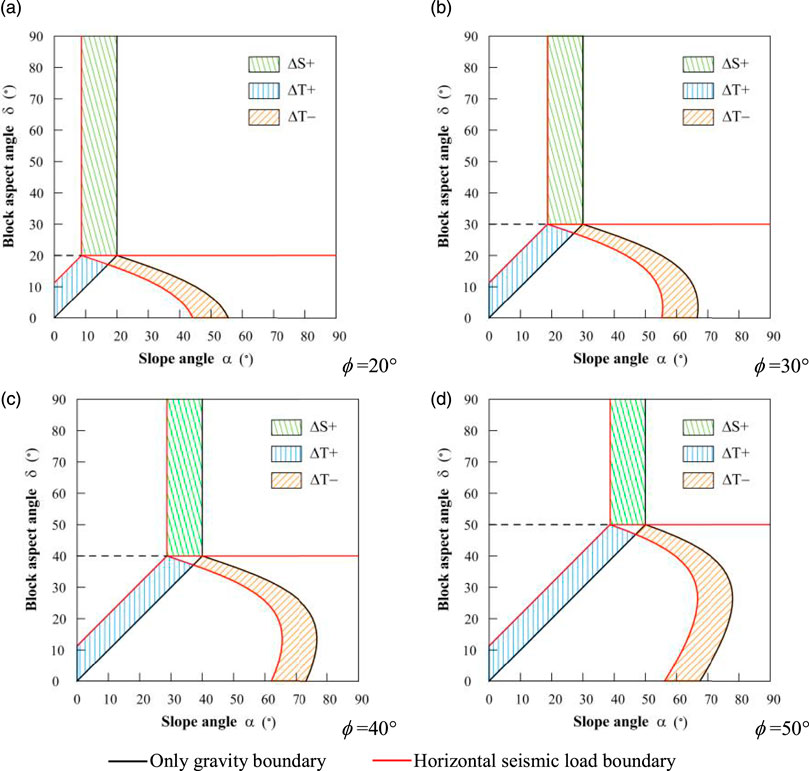
FIGURE 6. Comparison of instability modes of a single block (F = 0.2 mg). (A)
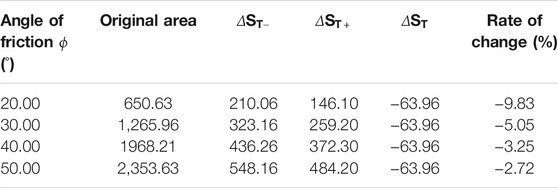
The change of the sliding part is listed in Table 3. It implies the area increased after the seismic load was applied, while the rate shows an increasing trend with the increase of friction angle.
The variation of the toppling area is demonstrated in Table 4. It indicates
The results indicate that under the action of seismic load, the block on the inclined slope was more prone to slide, losing its stability.
4 Investigation of Rockfall Dynamics
4.1 Model Establishment
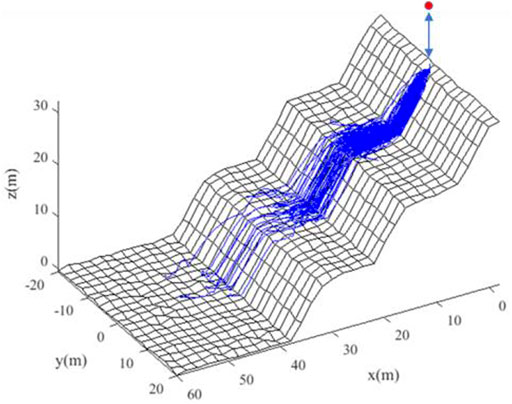
The TRN grid size was 2 m. The height of the slope was 30 m with a slope ratio of 1:1. In order to quickly dissipate the kinetic energy of the falling rock under gravity, two 10 m wide platforms were set at 6–16 m and 22–32 m, respectively. After several trial experiments, the width of the slope was determined as 40 m while the total length of the model was 60 m (Figure 7).
To represent the apparent randomness during the impact-rebound, a stochastic roughness was applied to the slope surface. The roughness parameter R was defined based on the concept proposed by Romkens and Wang (Romkens and Wang, 1986). R was 1/4 to generate significant stochastic rockfall dynamics. The implement can be found in Chen (2018) (Chen, 2018). It was achieved by applying grid-point elevation variations which obeyed normal distributions with expectation μ = 0, standard deviation σ = 200 mm.
The simulations were performed using a regular dodecahedron rock block (volume of 1 m3) initially located 2.5 m (center) above the top of the slope. The numerical procedure began with releasing the rock to the slope, generating an initial velocity. The rock then bounced, rolled over the slope. It ended when the rock finally stopped.
4.2 Parameter Setting
The TRN cell with virtual depth was rigid here with only friction angles. According to the field experiment conducted by the Japan Road Association in 2000, a friction coefficient of 0.11–0.20 was adopted, which is equivalent to an average dynamic friction angle of 10°, and its standard deviation was set at about 0.05.
To achieve energy dissipation during impact, the post-modification proposed by Chen (Chen et al., 2013b) was adopted in this paper. The rebound velocity (Vx, Vy, Vz) (the velocity when contact between rock block and surface TRN ends) was DDA simulated and then modified to be not greater than Rv times of incident velocity
Rv value was assigned due to the surface material of each TRN cell.
Considering that Rv is obviously dependent on both the modulus and incident angle of v in the normal direction, the Rv (scaled) proposed by Tetsuya et al. (2009) was utilized. The Rv (scaled) was 0.95, the standard deviation was 0.05, and K was 12 m/s.
The volume of falling rock was 1 m3. The density was 2.0 × 10³ kg/m3, the Young’s modulus was 1.0 × 10⁴ MPa and the Poisson’s ratio was 0.2.
The values of physical parameters of falling rock and control parameters for DDA simulations are listed in Table 5.
4.3 The Number of Simulations
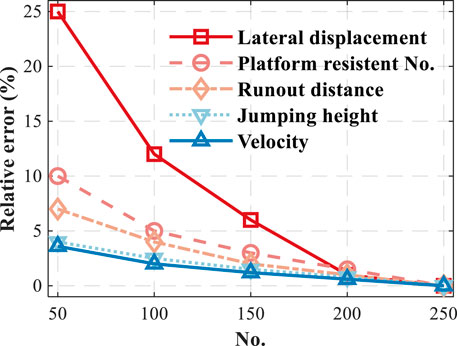
Considering the uncertainty raised by the nature of such a stochastic model, a limited number of observations will amplify the random fluctuations in rockfall dynamics. To avoid this, the model must to be performed with a number of parallel realizations. The procedure under gravity conditions was repeated until the relative error of each observation variable (runout distance, velocity, jumping height, lateral displacement, and platform resistance no.) was less than 1%. As the no. of realization increased, the relative error of lateral displacement decreased greatly, and the one of each other variable also decreased (Figure 8).
The simulations were performed; each block was released 250 times and all realizations were drawn to extract for the distribution of each variable. The modeled maximum value was used to estimate the uncertainty representing the variability in the stochastic results. Although there may still be a potential undersampling, it found that the statistics data (maximum value and distribution) from 250 parallel realizations could present the stochastic rockfall dynamics.
4.4 Earthquake Input
The control parameters of the earthquake are acceleration and frequency using a sine wave. The orthogonal test simulation was carried out by control variables. The duration was 25 s. Condition 1 was the reference group without seismic load. The calculation conditions are shown in Table 6.
4.5 Results and Discussions
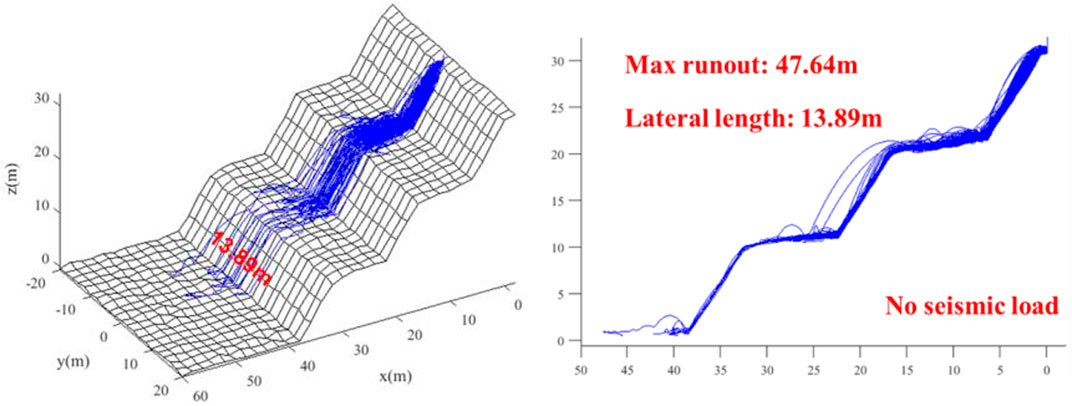
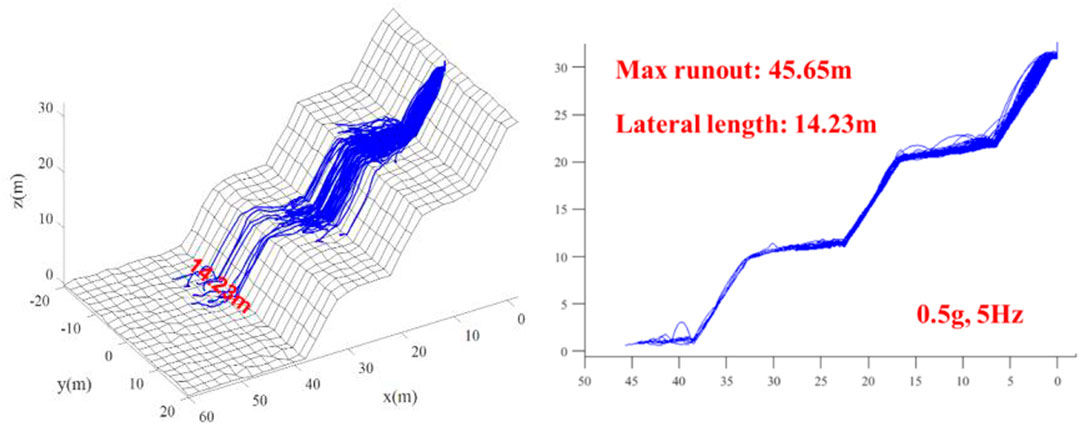
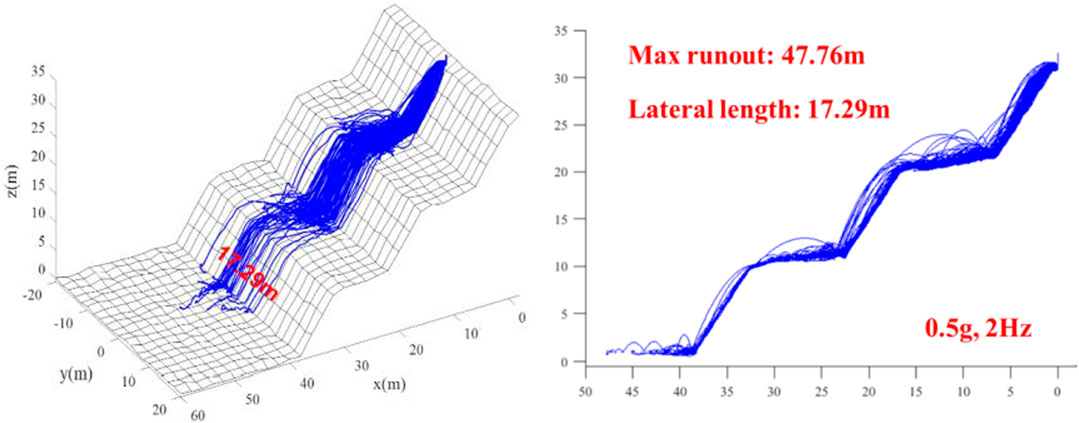
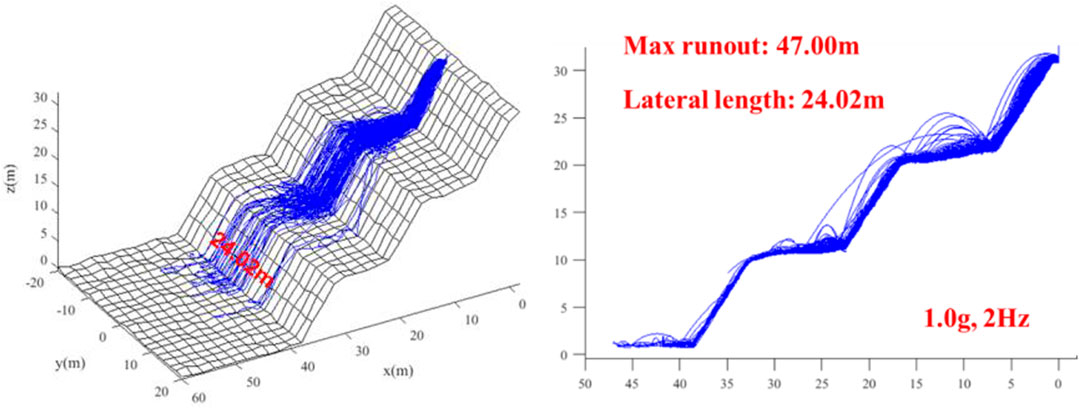
Figure 9 depicts the rockfall trajectories without seismic load (C1). Figures 10–12 demonstrate the rockfall trajectories under different seismic load conditions (C2-C4).
It can be seen from Figure 9 and Figure 12 that by comparing with the case without seismic load, the maximum runout distance was not sensitive to seismic load, but the lateral displacement range increased largely. When the seismic frequency was 2 Hz, as acceleration increased, the maximum runout distance changed little, even showing a decrease by 1.59%; but the lateral displacement range increased significantly, by 38.92%. When acceleration was 0.5 g, with the increase of seismic frequency, the maximum runout distance and lateral displacement range decreased by 4.42 and 17.70%, respectively. The results indicate the strong earthquake not only provided large initial velocities to falling rocks but also increased their kinetic energy during the travelling stage.
5 Conclusion
In this paper, we first reviewed the basic theory of 3-D DDA, including block displacements, deformations, and equations of motion. Then we discussed the TRN in 3-D DDA simulation for stochastic rockfall analysis and proposed a realization of seismic load input in terms of acceleration for it by introducing a virtual depth.
On this basis, the failure mode chart boundary of a single block under seismic load was first analyzed by 3-D DDA and compared to an analytical solution to verify the accuracy. The results from 3-DDA with TRN showed a good agreement with theoretical ones. The influence of seismic loading on the stability of the block was further discussed. It implies that the block was more prone to sliding even if the friction angle was significantly large that it decreased its stability under seismic loading.
Finally, we used the 3-D DDA with scholastic TRN to simulate and analyze the rockfall dynamics under seismic waves. Compared with the case without seismic load, the maximum runout distance was not sensitive to seismic load, but the lateral displacement range was significantly sensitive to seismic load and increased appreciably. 2) Strong earthquakes not only provided a large initial velocity for rockfall but also increased the kinetic energy of rockfall in the traveling stage. Through the 3D-DDA numerical simulations, rockfall phenomena and behaviors could be better understood. It is helpful for the prediction of rockfall disasters and the reasonable design of protective countermeasures.
Data Availability Statement
The raw data supporting the conclusion of this article will be made available by the authors, without undue reservation.
Author Contributions
LZ: Conceptualization, methodology, software, validation, investigation, data curation, visualization, project administration, funding acquisition, writing-review and editing, supervision; YW: Investigation, visualization, writing; ZZ: Software, validation, investigation, visualization, writing-review and editing; KR: Investigation, visualization, writing; QW: Investigation, visualization, writing; WW: Methodology, writing-review and editing, funding acquisition; HZ: Methodology, data curation, writing-review and editing, supervision.
Funding
This study was funded by the National Key R & D Program of China (No. 2017YFC1501001-03), the Special Fund for Basic Research on Scientific Instruments of the National Natural Science Foundation of China (No. 4182780021), and the National Natural Science Foundation of China under (Nos. 41977233 and 41902275), the Scientific Research Foundation of Fuzhou University (No. XRC-18053).
Conflict of Interest
The authors declare that the research was conducted in the absence of any commercial or financial relationships that could be construed as a potential conflict of interest.
Publisher’s Note
All claims expressed in this article are solely those of the authors and do not necessarily represent those of their affiliated organizations, or those of the publisher, the editors and the reviewers. Any product that may be evaluated in this article, or claim that may be made by its manufacturer, is not guaranteed or endorsed by the publisher.
References
Beyabanaki, S. A. R., Ferdosi, B., and Mohammadi, S. (2009). Validation of Dynamic Block Displacement Analysis and Modification of Edge-To-Edge Contact Constraints in 3-D DDA. Int. J. Rock Mech. Mining Sci. 46 (7), 1223–1234. doi:10.1016/j.ijrmms.2008.12.001
Chen, G., Zheng, L., Zhang, Y., and Wu, J. (2013). Numerical Simulation in Rockfall Analysis: A Close Comparison of 2-D and 3-D DDA. Rock Mech. Rock Eng. 46 (3), 527–541. doi:10.1007/s00603-012-0360-9
Chen, H. K., Wang, R., and Tang, H. M. (2003). Review on Current Situation to Study and Trend of Dangerous Rock Mass[J]. J. Chongqing Jiaotong Univ. 22 (3), 18–22. doi:10.3969/j.issn.1674-0696.2003.03.005
Chen, L. Q. (2018). Analysis of Rolling Rock Motion Characteristics Based on 3D Discontinuous Deformation Analysis method[D]. Chengdu, Sichuan, China: Sichuan University.
Chen, X. Q., Cui, P., You, Y., Yang, Z. J., and Kong, Y. D. (2013). Secondary Mountain Disasters Induced by the 4.20 Lushan Earthquake and the Disasters Mitigation[J]. Earth Sci. Front. 20, 1–6.
Chen, Y., and Wei, T. (2017). Kinetic Characteristics of rockfall Induced by Earthquake and the Protective Measures[J]. Subgrade Eng. (06), 48–53. doi:10.13379/j.issn.1003-8825.2017.06.10
Cheng, Q., Hu, C. X., and Yang, X. B. (2018). Developmental Regularity and Preventive Countermeasures of Geological Hazards along the Highway in Jiuzhaigou Earthquake Area[J]. Chin. J. Geol. Hazard Control. 29 (4), 114–120. doi:10.16031/j.cnki.issn.1003-8035.2018.04.17
Cheng, Q., and Su, S. R. (2014). Movement Characteristics of Collapsed Stones on Slopes Induced by Wenchuan Earthquake[J]. Rock Soil Mech. 35 (3), 772–776. doi:10.16285/j.rsm.2014.03.011
Cheng, Q., and Zheng, T. J. (2014). Investigation and Evaluation of Geological Disasters Caused by Lushan Earthquake along the Highway[J]. J. Catastrophology 29 (1), 131–135. doi:10.3969/j.issn.1000-811X.2014.01.024
Dorren, L. K. A. (2003). A Review of rockfall Mechanics and Modelling Approaches. Prog. Phys. Geogr. Earth Environ. 27 (1), 69–87. doi:10.1191/0309133303pp359ra
Favreau, P., Mangeney, A., Lucas, A., Crosta, G. B., and Bouchut, F. (2010). Numerical Modeling of Landquakes[J]. Geophys. Res. Lett. 37 (15), L15305. doi:10.1029/2010gl043512
Gao, X. (2015). Research on the Damage Law of the Layered Unstable Rock Community Collapse Induced by earthquake[D]. Nanjing, Jiangsu, China: Nanjing Tech University.
Hatzor, Y. H., Arzi, A. A., Zaslavsky, Y., and Shapira, A. (2004). Dynamic Stability Analysis of Jointed Rock Slopes Using the DDA Method: King Herod's Palace, Masada, Israel. Int. J. Rock Mech. Mining Sci. 41 (5), 813–832. doi:10.1016/j.ijrmms.2004.02.002
Hatzor, Y. H., and Feintuch, A. (2001). The Validity of Dynamic Block Displacement Prediction Using DDA. Int. J. Rock Mech. Mining Sci. 38 (4), 599–606. doi:10.1016/s1365-1609(01)00026-0
He, S. M., Wang, D. P., Wu, Y., and Ouyang, C. J. (2014). Formation Mechanism and Key Prevention Technology of Rockfalls[J]. Chin. J. Nat. 36 (5), 336–345. doi:10.3969/j.issn.0253-9608.2014.05.004
Hou, T. X., Yang, X. G., Huang, C., Huang, K. X., and Zhou, J. W. (2010). A Calculation Method Based on Impulse Theorem to Determine Impact Force of rockfall on Structure[J]. Chin. J. Rock Mech. Eng. 34 (S1), 3116–3122. doi:10.13722/j.cnki.jrme.2013.1912
Huang, D., Song, Y. X., Cen, D. F., and Fu, G. Y. (2016). Numerical Modeling of Earthquake-Induced Landslide Using an Improved Discontinuous Deformation Analysis Considering Dynamic Friction Degradation of Joints[J]. Rock Mech. Rock Eng. 49 (12), 1–20. doi:10.1007/s00603-016-1056-3
Huang, F., Huang, J., Jiang, S., and Zhou, C. (2017). Landslide Displacement Prediction Based on Multivariate Chaotic Model and Extreme Learning Machine. Eng. Geology. 218, 173–186. doi:10.1016/j.enggeo.2017.01.016
Huang, F., Tao, S., Chang, Z., Huang, J., Fan, X., Jiang, S.-H., et al. (2021). Efficient and Automatic Extraction of Slope Units Based on Multi-Scale Segmentation Method for Landslide Assessments. Landslides 18, 3715–3731. doi:10.1007/s10346-021-01756-9
Huang, F., Yan, J., Fan, X., Yao, C., Huang, J., Chen, W., et al. (2021). Uncertainty Pattern in Landslide Susceptibility Prediction Modelling: Effects of Different Landslide Boundaries and Spatial Shape Expressions. Geosci. Front., 101317. doi:10.1016/j.gsf.2021.101317
Huang, S., Lyu, Y., Peng, Y., and Huang, M. (2019). Analysis of Factors Influencing rockfall Runout Distance and Prediction Model Based on an Improved KNN algorithm[J]. IEEE Access, 2917868. doi:10.1109/ACCESS.2019.2917868
Huang, X. F., Zhang, Y. B., Zhao, X. Q., and Chen, Y. Y. (2017). A Preliminary Study of Kinetic Characteristic of Rock-Fall under Seismic Loading[J]. Rock Soil Mech. 38 (2), 583–592. doi:10.16285/j.rsm.2017.02.035
Kamai, R., and Hatzor, Y. H. (2008). Numerical Analysis of Block Stone Displacements in Ancient Masonry Structures: A New Method to Estimate Historic Ground Motions. Int. J. Numer. Anal. Meth. Geomech. 32 (11), 1321–1340. doi:10.1002/nag.671
Li, X. Z., and Kong, J. M. (2014). Comparative Analysis of Development Law and Characteristics of Secondary Geo-hazard Induced by Lushan and Wenchuan Earthquakes[J]. J. Nat. Disasters 23 (5), 11–18. doi:10.13577/j.jnd.2014.0502
Li, X. Z., Kong, J. M., Cui, Y., Tian, S. J., Zhong, W., Han, P. F., et al. (2014). Analysis on Distribution Law, Types and Characteristics and Development Tendency of Secondary Geo-Hazards Induced by Lushan Earthquake[J]. J. Eng. Geology. 22 (2), 272–279.
Li, X. Z., and Kong, J. M. (2011). Types and Characteristics of Typical Landslides Triggered by “5.12” Wenchuan Earthquake[J]. J. Mountain Sci. 29 (5), 598–607. doi:10.13544/j.cnki.jeg.2014.02.014
Marzorati, S., Luzi, L., and De Amicis, M. (2002). Rock falls Induced by Earthquakes: a Statistical Approach. Soil Dyn. Earthquake Eng. 22 (7), 565–577. doi:10.1016/s0267-7261(02)00036-2
Romkens, M. J., and Wang, J. Y. (1986). Effect of Tillage on Surface Roughness. Trans. Asae 29 (2), 0429–0433. doi:10.13031/2013.30167
Ning, Y., and Zhao, Z. (2013). A Detailed Investigation of Block Dynamic Sliding by the Discontinuous Deformation Analysis. Int. J. Numer. Anal. Meth. Geomech. 37 (15), 2373–2393. doi:10.1002/nag.2140
Pei, X. J., and Huang, R. Q. (2013). Analysis of Characteristics of Geological Hazards by "4·20" Lushan Earthquake in Sichuan, China[J]. J. Chengdu Univ. Technology(Science Tech. Edition) 40 (3), 257–262. doi:10.3969/j.issn.1671-9727.2013.03.05
Pei, X. J., Huang, R. Q., Pei, Z., and Dong, X. J. (2011). Analysis on the Movement Characteristics of Rolling Rock on Slope Caused by Intensitive Earthquake[J]. J. Eng. Geology. 19 (4), 498–504. doi:10.1080/17415993.2010.547197
Qiu, R. D., Shi, Y. C., Gang, L. I., Chen, Y. M., Sun, J. J., Ming-Qing, , et al. (2009). Study on the Basic Characteristics of rockfall hazard Induced by Earthquake[J]. J. Seismological Res. 32 (2), 298–203. doi:10.1016/S1874-8651(10)60080-4
Sasaki, T., Hagiwara, I., Sasaki, K., Yoshinaka, R., Ohnishi, Y., and Nishiyama, S. (2004). “Earthquake Response Analysis of rockfall Models by Discontinuous Deformation Analysis,” in Proceedings of the ISRM International Symposium 3rd ARMS, Rotterdam (Rotterdam, Zuid-Holland: 2004 Millpress), 1267–1272.
Shi, G. H. (1988). Discontinuous Deformation Analysis: A New Numerical Model for the Statics and Dynamics of Block systems[D]. Berkeley: University of California.
Shi, G. H. (2001). “Three Dimensional Discontinuous Deformation Analysis,” in Proceedings of 4th international conference on analysis of discontinuous deformation, 1–21.
Su, S. R., Li, S., and Cheng, Q. (2012). Characteristics of the post-earthquake Rockfalls of Highway Slopes in Wenchuan-Earthquake-Stricken Area[J]. J. Mountain Sci. 30 (3), 321–327. doi:10.16089/j.cnki.1008-2786.2012.03.011
Teng, G. L., Chen, Y. M., Shi, Y. C., Sun, C. S., Lu, Y. X., and Qiang, Z. Y. (2013). A Study on the Influencing Factors of Joint Rock Slope Stability under Earthquake Activity[J]. China Earthquake Eng. J. 35 (1), 119–125. doi:10.3969/j.issn.1000-0844.2013.01.0119
Tetsuya, S., Yuzo, O., Satoshi, N., Koichi, N., and Naoki, S. (2009). Study on Fundamental Characteristics of Velocity Ratio Used in rockfall Simulation and its Application to Dda[J]. Doboku Gakkai Ronbunshuu C 65 (1), 53–65. doi:10.2208/jscejc.65.53
Volkwein, A., Schellenberg, K., Labiouse, V., Agliardi, F., Berger, F., Bourrier, F., et al. (2011). Rockfall Characterisation and Structural protection - a Review. Nat. Hazards Earth Syst. Sci. 11 (9), 2617–2651. doi:10.5194/nhess-11-2617-2011
Wang, W., Zhang, H., Zheng, L., Zhang, Y.-b., Wu, Y.-q., and Liu, S.-g. (2017). A New Approach for Modeling Landslide Movement over 3D Topography Using 3D Discontinuous Deformation Analysis. Comput. Geotechnics 81, 87–97. doi:10.1016/j.compgeo.2016.07.015
Wang, X. W. (2019). Dynamic Response Law and Failure Mechanism of Bedding Rock Slope under earthquake[D]. Dalian, Liaoning, China: Dalian University of Technology.
Wu, J. H. (2010). Seismic Landslide Simulations in Discontinuous Deformation Analysis[J]. Computer Geotechnics 37 (5), 594–601. doi:10.1016/j.compgeo.2010.03.007
Xue, K. (2016). Study on Dynamic Load of Expressway Rock Slope Collapse and rockfall Prevention Measures analysis[D]. Shijiazhuang, Hebei, China: Shijiazhuang Tiedao University.
Yang, L. (2018). Research on Deformation and Failure Mechanism of Counter-tilt Rock Slopes Subjected to Seismic loads[D]. Chengdu, Sichuan, China: Sichuan University.
Yin, Y., Wang, F., and Sun, P. (2009). Landslide Hazards Triggered by the 2008 Wenchuan Earthquake, Sichuan, China. Landslides 6 (2), 139–152. doi:10.1007/s10346-009-0148-5
Yuan, J. K., and Pei, X. J. (2014). Modeling and Study of Impact Damage to Piers of Chediguan Bridge[J]. Highway (02), 22–28.
Zhang, Y., Chen, G., Zheng, L., Li, Y., and Wu, J. (2013). Effects of Near-Fault Seismic Loadings on Run-Out of Large-Scale Landslide: A Case Study. Eng. Geology. 166, 216–236. doi:10.1016/j.enggeo.2013.08.002
Zhang, Z. W. (2011). Study of the Highway Collapse Type and Formation Mechanism under strong earthquake[D]. Chengdu, Sichuan, China: Chengdu University of Technology.
Keywords: rockfall, earthquake, stability, movement characteristics, 3-D DDA
Citation: Zheng L, Wu YH, Zhu ZY, Ren KH, Wei Q, Wu W and Zhang H (2022) Investigating the Role of Earthquakes on the Stability of Dangerous Rock Masses and Rockfall Dynamics. Front. Earth Sci. 9:824889. doi: 10.3389/feart.2021.824889
Received: 29 November 2021; Accepted: 13 December 2021;
Published: 19 January 2022.
Edited by:
Faming Huang, Nanchang University, ChinaReviewed by:
Qiang Liu, Shandong University of Science and Technology, ChinaGuoyang Liu, Shenyang University of Technology, China
Copyright © 2022 Zheng, Wu, Zhu, Ren, Wei, Wu and Zhang. This is an open-access article distributed under the terms of the Creative Commons Attribution License (CC BY). The use, distribution or reproduction in other forums is permitted, provided the original author(s) and the copyright owner(s) are credited and that the original publication in this journal is cited, in accordance with accepted academic practice. No use, distribution or reproduction is permitted which does not comply with these terms.
*Correspondence: Hong Zhang, aG9uZ3poYW5nQHRvbmdqaS5lZHUuY24=
 Lu Zheng
 Yihan Wu
 Zhiyuan Zhu
 Kaihui Ren
 Qi Wei
 Wei Wu
 Hong Zhang