 Yuanlong Wei1,2
 Lingyun Zhao
 Wei Liu
- 1Key Laboratory of Unconventional Natural Gas Evaluation and Development in Complex Tectonic Areas, Ministry of Natural Resources, Guiyang, China
- 2Guizhou Research Institute of Oil and Gas Exploration and Development Engineering, Guiyang, China
- 3Department of Mining Engineering, Chongqing University, Chongqing, China
In the process of shale gas development, different drilling, hydro-fracturing, and pumping speeds will produce different productivity effects. This reflects the effect of the loading rate of rock mechanics. Therefore, it is of great scientific significance to study the deformation and failure characteristics of shale under different loading rates. In order to reveal the loading rate effect of the Longmaxi shale, a series of laboratory experiments were carried out, including scanning electron microscope, XRD, and uniaxial compression tests at different loading rates. The results show that 1) the peak strength and elastic modulus of shale increase with the increase in the loading rate, but Poisson’s ratio has no obvious rule with the increase in the loading rate. In contrast, the loading rate causes the peak strength to vary by about 20%, which is larger than that of the elastic modulus. 2) The loading rate has a significant influence on shale failure. A higher loading rate will lead to severe damage but with simple cracks, whereas a lower loading rate will lead to complex damage of cracks. With the decrease in the strain rate, the length of the failure crack increases greatly. Therefore, a lower strain rate is helpful to form more broken fragments in the shale matrix. 3) By analyzing the relationship between elastic strain energy/dissipated energy and the loading rate, it is found that the elastic strain rate has a preliminary increasing and then a decreasing trend with the loading rate, but the dissipated energy has a decreasing trend with the loading rate. A higher loading rate is helpful to increase the brittleness of the shale, but a lower loading rate is beneficial to forming more cracks and a greater degree of fracture in the shale matrix. The effect of the loading rate on the mechanical properties and fracture properties of the shale is discussed. It is suggested that the lower hydro-fracturing rate is useful for generating more complex crack networks in the shale reservoirs.
Introduction
Natural gas is a type of clean and quality energy (Qiao et al., 2020a), and the consumption of natural gas in China has continuously increased in the past 2 decades (Zhang X et al., 2021; Qiao et al., 2020b). As a matter of fact, the conventional gas reserves of China are very limited (Shuai et al., 2021). Up until now, more than 45% of natural gas production depends on foreign export (Liu et al., 2020). However, China is rich in unconventional gas reserves, especially the shale gas reserves (Song et al., 2019). In recent years, shale gas has become a new hot spot in global oil and gas exploration (Zhiltsov and Zonn, 2016). Because of the need of economic and social development, China must vigorously promote the exploration and development of shale gas. (Figure 1 shows a diagram of hydro-fracture in a shale reservoir.) Huge shale gas reserves provide a reliable source for the development and upgrading of China’s economy (Zhao et al., 2015; Yang et al., 2020; Zhang et al., 2020).
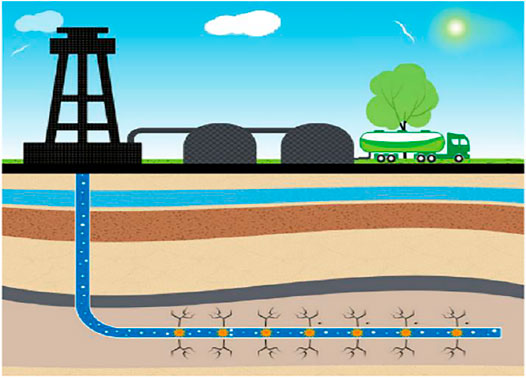
FIGURE 1. Schematic diagram for shale hydro-fracture.
A shale gas reservoir is an unconventional natural gas reservoir in the shale formation; its prospective reserves have far exceeded those of conventional natural gas, and it is an important development direction of clean energy in the future (National Development and Reform Commission and Ministry of Finance, 2012). Until 2020, the total shale gas production of China has exceeded 20 billion m3, and four commercial shale gas production bases were founded; thus, shale gas has become an important portion for the gas production increase in China. Taking the Sichuan Basin as an example, the sedimentary environment, geochemical characteristics, reservoir characteristics, natural gas enrichment degree, and resource potential of three different types of shale in China are introduced (Zou et al., 2010). The mechanical properties of shale are an important aspect that affects the formulation of shale development schemes and production effects. Therefore, the study on the influence of the loading rate on mechanical properties of shale is of great guiding significance for shale gas development.
In recent years, the research on the mechanical properties of shale is also an important trend. For example, Xie et al. (2020) studied the influence of the loading rate on shale fracture behavior under dynamic and static loading conditions and found that the crack propagation rate and fracture toughness were positively correlated with the loading rate. Wang et al. (2018) studied the geotechnical engineering characteristics of red shale and revealed the unfavorable factors of its geological environment. Li et al. (2017) conducted a series of uniaxial compression tests on coal, shale, and tight sandstone and established a constitutive model of micro-damage of various rocks based on power function distribution, Weibull distribution, and Gaussian distribution. Wen et al. (2014) established a chemical–mechanical coupling model for the wall stability of hard and brittle shale shaft lining. Liang et al. (2011) put forward the optimization method for studying the sweet spot area of shale gas exploration. Wei et al. (2015a) and Wei et al. (2015b) carried out uniaxial and triaxial cyclic loading tests on shale and revealed the deformation and fracture characteristics of shale. Hou et al. (2016) and Rybacki et al. (2016) put forward a new evaluation model for the brittleness of shale, in which the brittleness drop coefficient R can reflect the difficulty of brittle failure, and the stress landing coefficient P and softening modulus M can represent the brittleness strength. Heng et al. (2019) revealed the non-planar propagation of hydraulic fractures in shale through laboratory experiments and numerical research. Li et al. (2021) studied the thermal damage effect of fine grained granite. However, most of the current research studies focus mainly on the deformation and fracture characteristics, and the strain rate effect has not been deeply studied (Liu et al., 2014).
In fact, the loading rate effects of rock mass are a notable issue in the field of rock mechanics and rock engineering. Liang et al. Changyu et al. (2012) discussed the rate-dependent effect and energy mechanism of rocks through uniaxial compression tests. Guo et al. (2012) revealed the influence of the strain rate and cyclic load on the deformation and strength of rock salt. Song et al. (Yao and Yue (2021) studied the dynamic response of Beishan granite and found that with the increase in the loading rate, its dynamic fracture toughness increased. Zhao et al. (2020) studied the energy evolution of granite under different loading rates and proved that the elastic strain energy absorbed by rocks in the elastic stage is mainly stored in the form of elastic energy. Gautam et al. (2016) studied the strain rate and thermal damage of Dholpur sandstone at high temperature. Zhang X et al. (2021) studied the tensile strength and peak tensile strain of red sandstone under different loading rates through direct tensile tests. Chen et al. (2020) studied the deformation and mechanical properties of concrete under different loading conditions and used the acoustic emission technology as the observation technology. According to the aforementioned literature, it is concluded that the mechanical tests under different loading rates are helpful to understand the changing process of the mechanical properties of rocks. However, at present, there is little research on shale loading effects, which cannot support theoretical research and field application. Therefore, it is highly necessary to study the deformation characteristics of shale under different strain rates.
In this study, uniaxial compression tests were carried out on shale of Longmaxi Formation of lower Silurian in Enshi City, Hubei Province. During the loading process, experimental data of axial stress, axial strain, circumferential strain, and volumetric strain were collected. The deformation and fracture characteristics and stress characteristics of shale under different loading rates were analyzed, and the relationship between elastic energy and loading rate was also analyzed. The fracture characteristics under different strain rates were revealed emphatically. Finally, combined with the related background of shale gas development, its application was explored and discussed, which can provide guidance for shale gas development.
Sample Preparation and Experiment Equipment
Collection of Shale Samples
All the shale cores were collected from the newly excavated shale of Longmaxi Formation of lower Silurian in Enshi City, Hubei Province of China. The geological characteristics of coring position are shown in Figure 2, including the main rivers and faults. Large-sized shale cores were obtained on site and then transported to the laboratory for sample preparation. In order to reduce the individual differences among samples, the samples used for testing were taken from the same core (Figure 2). The process of sample preparation was carried out strictly according to the requirements of the International Rock Mechanics Test Regulations. All the samples had a height of 100 mm, a diameter of 50 mm, and an aspect ratio of 2:1. The axis of the samples was perpendicular to the standard cylinder of the bedding plane, and the parallelism between the upper and lower end faces was controlled within 0.02 mm. A total of 15 samples were produced, and each loading rate consisted of three samples. See Figure 3 and Table 1 for details of samples.
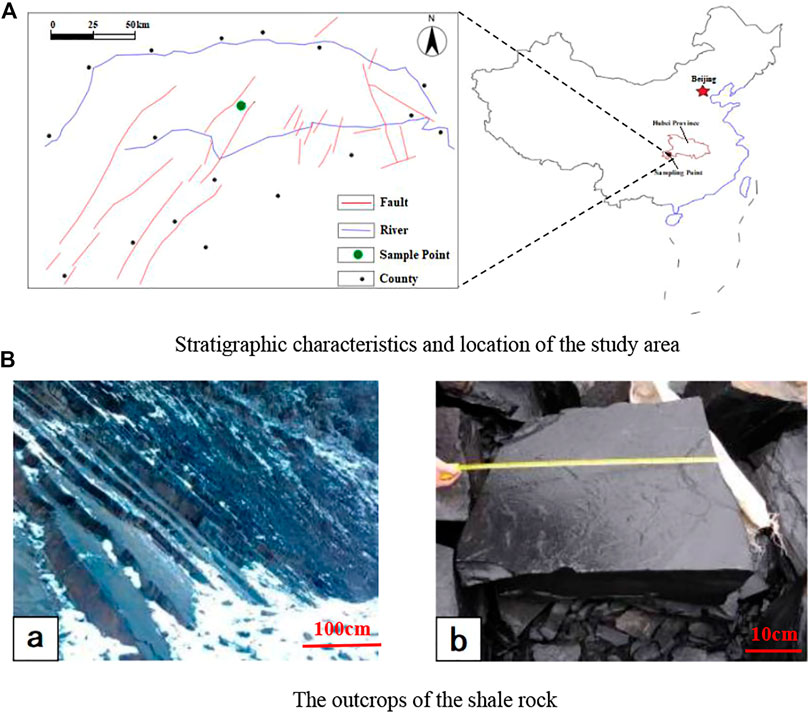
FIGURE 2. Location shale and outcrops of shale cores. (A) Stratigraphic characteristics and location of the study area. (B) Outcrops of the shale rock
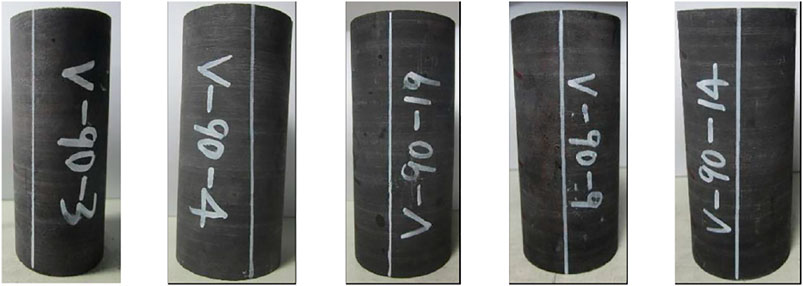
FIGURE 3. Representative samples of the study (diameter = 5 cm, length = 10 cm).
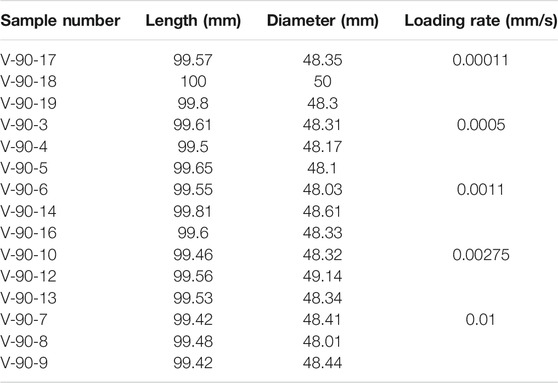
TABLE 1. Sample information and loading conditions.
Mineral composition and meso-structure are two aspects that influence the physical and mechanical properties of rock mass. Therefore, during the process of sample preparation, the small samples used for XRD and SEM tests were also prepared. The experiments were carried out in the XRD laboratory of the China University of Geosciences (Wuhan), and the equipment was a German Bruker AXS D8-Focus X-ray diffractometer. In order to ensure the uniformity of the shale samples and also avoid the mechanical property deviation that covers the deviation of the loading rate, the samples with obvious gap and vein filling were eliminated.
Test Program
The uniaxial compression tests of shale samples were carried out on an MTS 815.03 rock rigid press test system in the Wuhan Institute of Rock and Soil Mechanics, Chinese Academy of Sciences. During the process of testing, the system can automatically collect and record the axial load, axial displacement, and circumferential displacement of the sample, and the loading mode was the displacement control mode. In this study, as the displacement control mode was used, the loading rate referred to displacement within unit time during loading. Five different loading rates were designed, which were 0.00011 mm/s, 0.0005 mm/s, 0.0011 mm/s, 0.00275 mm/s, and 0.01 mm/s, respectively. The uniaxial compression test was carried out on 16 shale samples (Table 1). In order to reduce the error caused by data contingency, each test of loading rate consisted of three shale samples. The testing device and sample installation are shown in Figure 4.
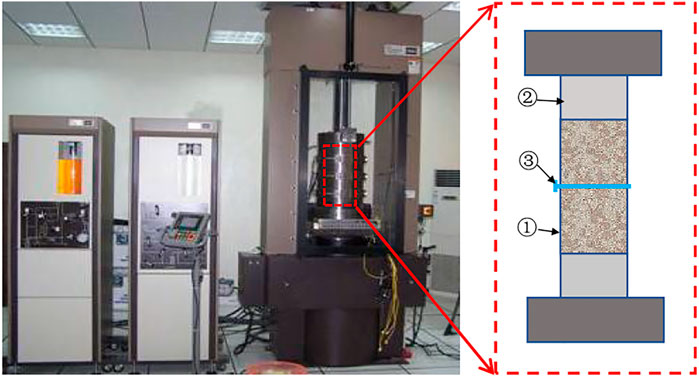
FIGURE 4. Testing device of MTS 815 (① shale sample; ② pressure head; ③ circumferential strain gauge).
Analysis of Experimental Results
Mineral Composition
The sedimentary environment of shale reservoirs can be divided into marine sediments, marine–terrestrial transitional sediments, and continental sediments. Due to the different sedimentary environments and models, the mineral composition, bedding structure, and internal pore/crack development of shale reservoirs also show great differences. At present, commercial development of shale gas in China is limited to marine strata in the Sichuan Basin and its periphery; the exploration and development of marine–terrestrial transitional shale have not made great progress and are still in the early evaluation stage (Liu et al., 2014). This also fully illustrates the influence and restriction of the sedimentary environment on mining. The greatest influence of sedimentary environment is the reservoir characteristics of shale, which further affects the subsequent gas-bearing characteristics and subsequent production capacity. Shale reservoir characteristics mainly depend on mineral composition, bedding structure, macro-/micro-pore structure, fracture/microfracture development degree, and other factors, especially on mineral composition and meso- and micro-view structures. Different reservoir characteristics, corresponding brittleness characteristics, bedding and microfracture development characteristics, and hydraulic characteristics will have great differences (Xiao et al., 2021), which will have a significant impact on the fracturing effect of shale gas wells. Therefore, classifying shale according to its mineral composition, microstructure, and mechanical properties has important engineering application significance.
In this study, the mineral composition of shale samples was analyzed. The samples were scanned using a SEM, and mineral analysis was done by X-ray diffraction for semi-quantitative analysis of the core phase. Detailed information of the mineral composition content and each element content is given in Table 2. Generally speaking, quartz, albite, potash feldspar, and calcite can be regarded as brittle minerals. The brittle mineral content of the shale cores is about 48.6%, and it is a group of shale samples with good fracturability.
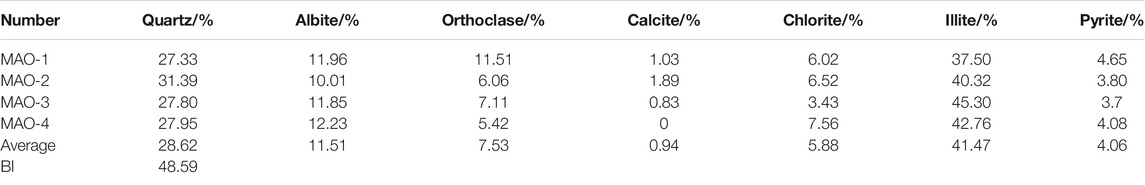
TABLE 2. Mineral composition information of shale samples (BM-brittle materials).
The brittleness index is defined as follows:
where BI is the brittleness index, and BMC refers to the brittle mineral contents of the shale cores.
SEM Testing Results
The shale samples were also tested by using the SEM. The observation directions are vertical and parallel to the bedding plane. The typical SEM photos of two groups of shale samples are shown later. Figure 5A shows the photos perpendicular to the bedding plane, and Figure 5B shows the photos parallel to the bedding plane. The magnification of the samples is 100 times, 500 times, and 2000 times, respectively. From Figure 5, it is found that the shale sample has a very compact matrix, and the minerals are arranged in a layer along the direction perpendicular to the bedding plane. After magnifying 2000 times, numerous micropores are found among mineral mass, and the micropores and micro-fissures have long aspects. Along the direction parallel to the bedding plane, the matrix structure is dense, and the micropores and micro-fissures have short aspects. The SEM photos evidently reveal the anisotropy of the shale in the point of view of micro-observation.
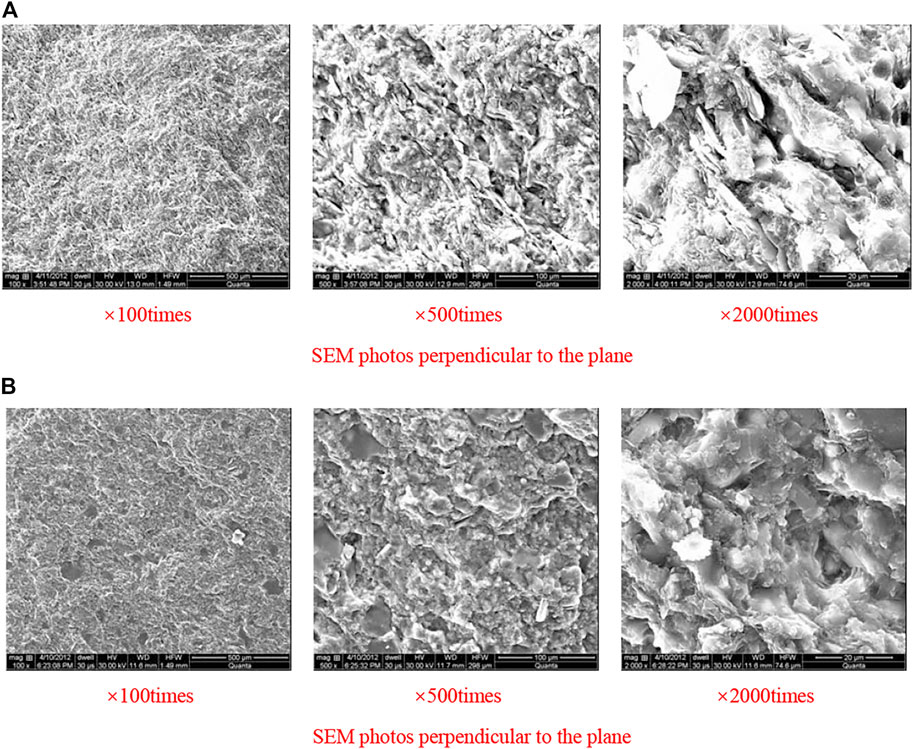
FIGURE 5. SEM pictures for shale samples. (A) SEM photos perpendicular to the plane. (B) SEM photos perpendicular to the plane.
Stress–Strain Relationship Under Different Loading Rates
By calculating the uniaxial compression testing data of shale samples, the stress–strain curves of shale under different loading rates are obtained. As is shown in Figure 6, the axial strain is on the right side of the vertical coordinate, while the circumferential strain is on the left side.
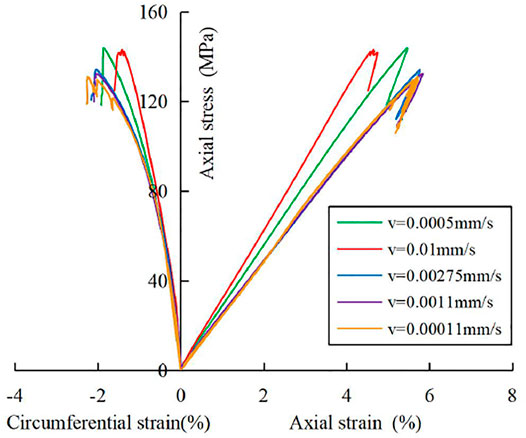
FIGURE 6. Stress–strain curves at different loading rates.
For the stress–strain curves for each group of loading rates, we selected the curves close to the average value of the curves under the same loading rate and drew them together. As shown in Figure 6, with the increase in the loading rate, the elastic modulus of the sample also increases. As the loading rate increases, the peak strength of the sample also increases. Shale is a type of hard and brittle rock with obvious elastic characteristics, that is, the stress–strain curve is usually very straight. It can be seen from Figure 6 that when the linear stage (elastic stage) continues to exceed 2/3 of the peak strength, the curve gradually deflects slightly and the slope decreases slightly. This also shows that the micro-cracks in the sample begin to gradually initiate, propagate gradually, and gradually weaken the stiffness of the sample, but the degree is still far less than the state that leads to the formation of macro-cracks. The decrease in stiffness is not as obvious as that of soft rock; the peak value drops slowly, and then suddenly, brittle fracture occurs. The lower the loading rate, the more sufficient will be the time for the sample to adjust itself, and then the more obvious the phenomenon of stress falling and rising, and the more will be the time of fluctuation. The circumferential strain is also influenced by the loading rate, as can be seen from the left part of the curve in Figure 6; the circumferential strain is also increased with the decrease in the loading rate. A lower loading rate allows more time for lateral deformation, so the circumferential strain has a negative relationship with the loading rate. To sum up, regardless of whether the loading rate is high or low, the axial stress of the specimen decreases rapidly after reaching the peak strength, and the characteristics of hard and brittle failure of the samples are extremely remarkable.
As shown in Figure 6, the compaction of cracks or fissures of shale samples is short or almost no. The reason for this result is that the bedding direction of the core is the horizontal direction of the rock sample, and there are almost no developed micro-cracks in the shale matrix, which leads to a very short initial compaction stage in the loading process. In the stage of elastic deformation, the axial deformation of the sample is dominant, but the circumferential deformation is small. When the shale sample enters the stage of stable failure and unstable failure, both the circumferential deformation rate and the axial deformation rate increase. With the change in the strain rate, there is a good corresponding relationship between the axial deformation and circumferential deformation, that is, with the increase in the loading rate, both axial deformation and circumferential deformation reach the peak strain rapidly and steadily.
Experimental Results
Considering the difference in mechanical response characteristics of rock mass under different loading rates, the loading rate used in this test is 0.00011 mm/s–0.01 mm/s, and there is only static load in the loading process. The static load is defined as the loading rate less than 1.07 mm/s, and when the loading rate is greater than 1.07 mm/s, it falls into the category of dynamic load (Zhou, 1990). Different loading rate is an important index to reflect the response of elastic modulus, peak strength, and Poisson’s ratio of the rock samples. It should be considered in the design of the rock compression experiment. Based on the aforementioned experimental data, Table 3 is obtained. The peak strength, Poisson’s ratio, and elastic modulus are discussed as follows:
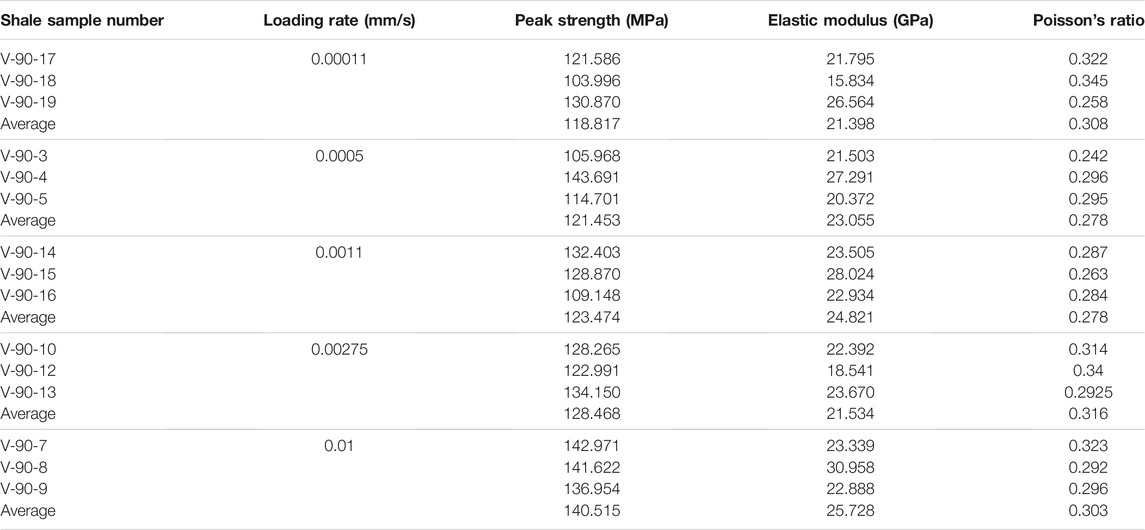
TABLE 3. Uniaxial compression test results of shale samples.
Peak Strength
In order to further clarify the changed rule of peak strength with loading rate, the relationship curve between peak strength and loading rate is drawn, as shown in Figure 7. It can be seen that with the increase in the loading rate, the peak strength is positively correlated with the loading rate. The variation range of peak strength is 118.817–140.515 MPa, and the average value is 126.45 MPa. With the increase in the loading rate, the peak strength also tends to increase, showing a fluctuation range of −6.11%–11.04%. The fitting curve is obtained by fitting with polynomial, where R2 = 0.9668, and the fitting polynomial given in Eq. 2:
where σp is the peak strength (MPa) and ut is the corresponding loading rate (mm/s).
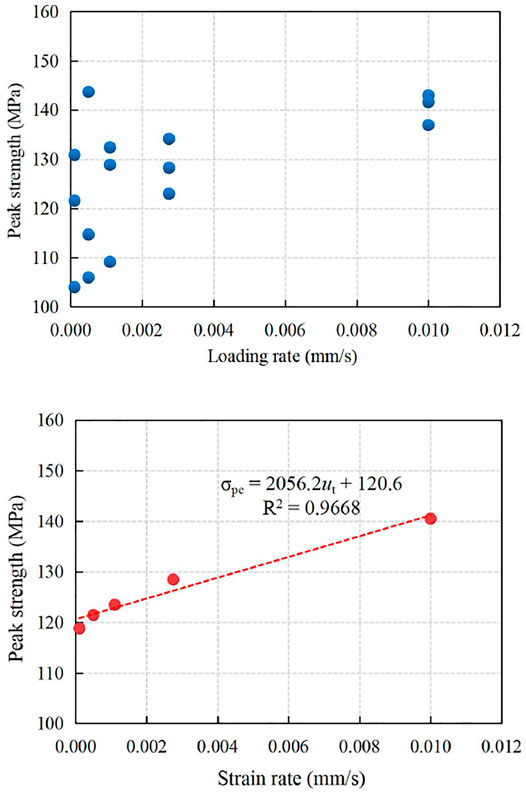
FIGURE 7. Relationship between loading rate and peak strength.
According to the test results of peak strength, it can be seen that the loading rate has a certain influence on the peak strength, that is, the loading rate improves the peak strength of shale to a certain extent, and with the increase in the loading rate, the growth rate of the peak strength increases slightly. Therefore, the negative value of the fluctuation range is −6.11%, and the positive value is 11.04%.
Elastic Modulus and Poisson’s Ratio
According to the data in Figure 8, the elastic modulus is calculated and its average value ranges from 21.398 to 25.728GPa, with an average of 23.550 GPa. With the increase in the loading rate, the elastic modulus also shows a certain increasing trend, with a fluctuation range from −9.14% to +9.25% around the average value. The relationship between peak strength and loading rate can be fitted by the following curves:
where E is the modulus under each loading rate.
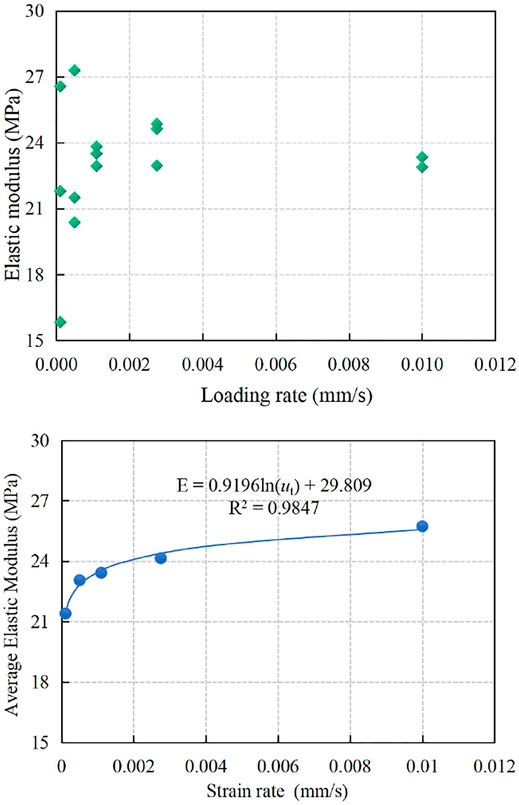
FIGURE 8. Relationship between loading rate and elastic modulus.
It can be seen that the influence of the loading rate also leads to the increase in the elastic modulus. According to the data fitting, the relationship between the loading rate and elastic modulus accords with logarithmic function. In the stage of low loading rate, the elastic modulus increases rapidly with the increase in the loading rate and then slows down gradually. Relatively speaking, the elastic modulus fluctuates uniformly around the average value. By comparison, both the peak strength and elastic modulus increase with the increase in the loading rate. Because of high strength and brittleness of shale, in the loading rate of 0.0001–0.01 mm/s, the peak strength and elastic modulus will fluctuate by nearly 20%. Therefore, the change in mechanical properties caused by loading rate should still be considered in wellbore stability analysis, fracturing design, and shale-related engineering in practical projects.
As shown in Figure 9, Poisson’s ratio changed from 0.242 to 0.345, with an average of 0.296. In analysis, the relationship between the loading rate and Poisson’s ratio is not obvious, and the fluctuation range of Poisson’s ratio is very small with the loading rates. Therefore, it can be inferred that the influence of loading rate on Poisson’s ratio of shale is not significant, so it is suggested to adopt the average Poisson’s ratio for practical engineering.
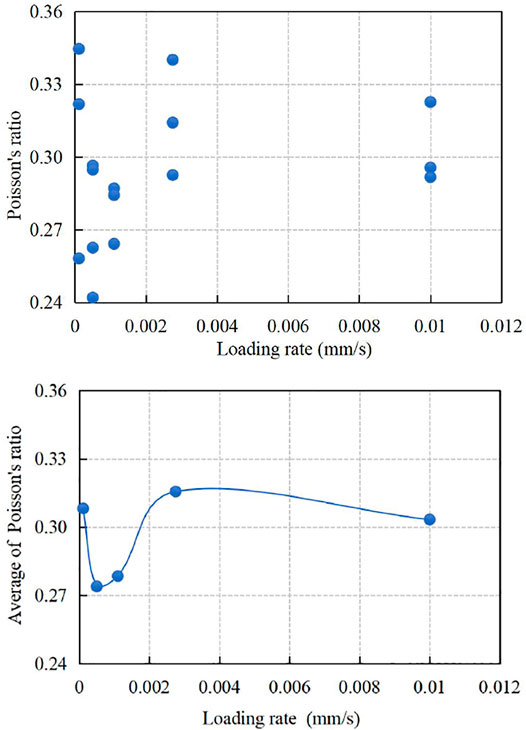
FIGURE 9. Relationship between loading rate and Poisson’s ratio.
Fracture Characteristics and Energy Analysis
Fracture Characteristics
The loading rate has non-negligible influences on the mechanical parameters of shale, which further affects the failure morphologies of the shale samples. Figure 10 shows the photos of shale samples after fracture with loading rates of 0.01 mm/s, 0.00275 mm/s, 0.0011 mm/s, 0.0005 mm/s, and 0.00011 mm/s, respectively. For each loading rate, it consists of two pictures: one is the sample photo after failure and the other is the failure surface (a half circle lateral surface). Apparently, it can be seen that the loading rate has a significant influence on the fracture morphology of the shale samples. The length of all the cracks is also calculated by using image processing technology. The results show that the total lengths of the cracks are 225.2, 304.1, 563.2, 492.4, and 807.5 mm, respectively, for the loading rate from high to low (0.01 mm/s–0.0001 mm/s).
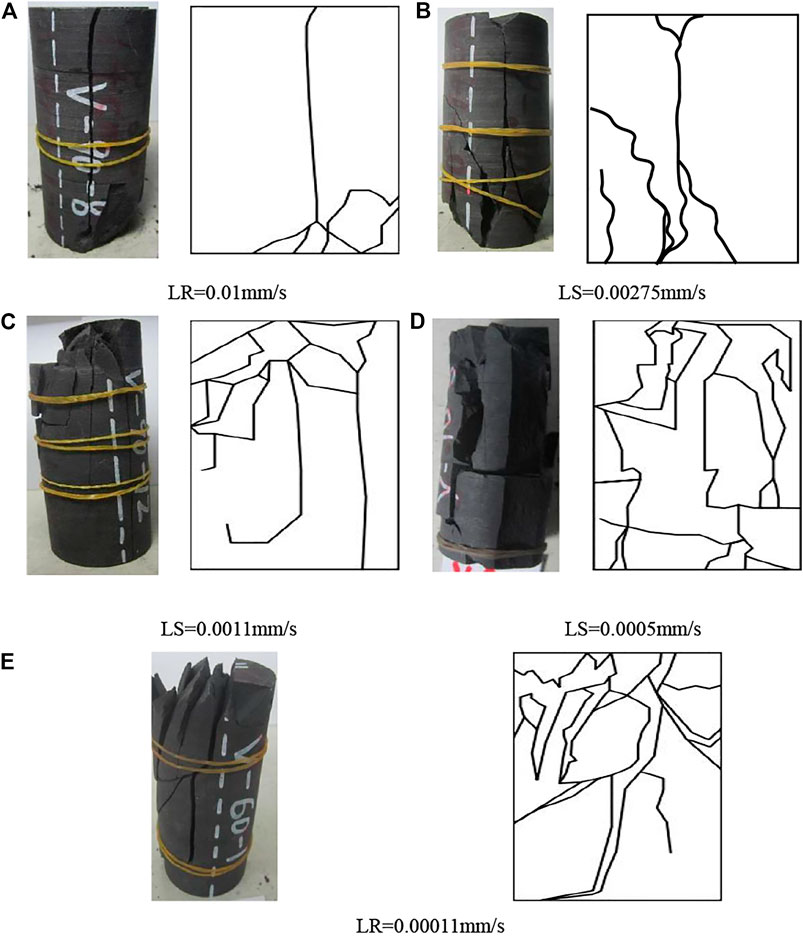
FIGURE 10. Failure modes and schematic diagrams at different loading rates (LR is short for loading rate, all the samples have a diameter of 5 cm and a length of 10 cm).(A) LR=0.01 mm/s. (B) LS=0.00275 mm/s. (C) LS=0.0011 mm/s. (D) LS=0.0005 mm/s. (E) LR=0.00011 mm/s
It can be seen from Figure 10 that at a higher loading rate, a single crack develops to failure, and when the sample reaches the peak strength, the sample is split into larger blocks. The failure crack has a large aperture, which implies that a large amount of energy is released. In addition, rock powder appears on the failure surface, which indicates that serious friction occurred on the failure surface before failure. Therefore, at a higher loading rate, it can be deduced that the crack initiation, propagation, and penetration time of the shale sample are very short. Moreover, it is observed that the cracks started from the upper end and then quickly destroyed the whole sample; most of the inclined sections appeared in the lower half of the rock sample.
With the decrease in the loading rate, the rock sample is no longer broken by a single crack but by a large number of fragments. When the loading rate is low, it can be clearly observed that the surface cracks of rock samples gradually initiate and penetrate, and brittle failure occurs after the peak value, but the broken pieces are not dispersed. These phenomena can be explained as follows: at a low loading rate, the deformation and crack development of rock samples have enough reaction time, and there is enough time to adjust the free structure so that the overall damage appears more uniform; after the damage, the rock samples appear as a dense crisscrossing crack distribution phenomenon.
Relationship Between Loading Rate and Elastic Energy
During the deformation and failure of rock samples, the initiation, propagation, and cut-through of micro-cracks will occur. The sample needs to absorb energy from the outside to produce new fracture surfaces. The relative sliding friction between fracture surfaces will dissipate energy, that is, the process of deformation and failure of rock sample is a process of energy absorption and dissipation (Li et al., 2019). In this study, the instability and failure processes of shale sample are analyzed from an energy point of view. According to the law of thermodynamics, energy dissipation is the essential attribute of rock deformation and failure, which reflects the continuous development, weakening, and ultimate strength loss of the micro-defects in the rock matrix. Therefore, energy dissipation is directly related to the destruction and loss of strength, and the amount of energy dissipation reflects the attenuation of original strength. According to the first law of thermodynamics, we can draw a conclusion as follows:
where W is the total energy absorbed by the rock sample during the loading process, Wd refers to the released dissipated energy (unrecoverable energy), and We is the recoverable elastic strain energy.
Figure 10 shows the stress–strain curve (V-90-14) of shale sample V-90-14. During uniaxial loading of the shale sample, the deformation and failure processes can be divided into four stages: the compaction stage, the linear elastic stage, the yielding stage, and the post-destruction stage. In the whole process of the rock sample loading test, the deformation of rock samples can be divided into recoverable elastic deformation and unrecoverable plastic deformation. The energies absorbed and dissipated by the rock samples at different stages are closely related to the failure mode of the rock samples. The relationship between the elastic strain energy We and dissipated energy Wd per unit volume is shown in Figure 11. In this figure, the total input energy W is the total area under the stress–strain curve. The dissipative energy is the area of curved, AOC, surface in the figure, which is used to induce internal damage and plastic deformation of the rock matrix. The area of triangle ABC in the figure represents the elastic strain energy released by the rock sample unit after unloading. After the external force is eliminated, the energy can restore the deformation of the rock mass to a certain extent. From a thermodynamic point of view, as long as certain conditions are met, energy dissipation is unidirectional and energy release is reversible. Energy dissipation is an essential attribute of deformation and failure of the rock samples, which reflects the continuous development, weakening, and ultimate strength loss of micro-defects in rock samples. Therefore, energy dissipation is directly related to the destruction and loss of strength of rock samples, and the dissipation reflects the attenuation of the original strength of rock samples.
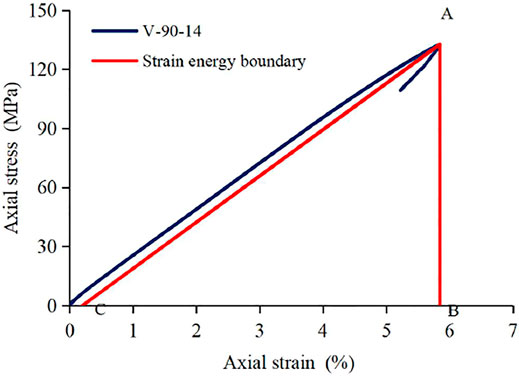
FIGURE 11. Relationship between elastic energy and dissipated energy in stress–strain curve.
According to the aforementioned analysis, the energy W absorbed by the rock samples under the uniaxial condition is the total area included in the stress–strain curve of the rock samples, which can be obtained by integrating the stress–strain curve. Considering the unknown curve equation, it is difficult to calculate using the integral method, so the definite integral method is adopted to solve (Changyu et al., 2012):
where σk is the stress value under a certain stress state and W is the total energy absorbed by the rock sample at the state of stress value σk, with a unit of mJ/m3.
The elastic energy of rock sample under the peak strength state is expressed as follows:
where We (elastic energy) is the area of right triangle ABC in the figure, σmax is the peak strength,
The line AC in the figure is given as follows:
where Ei is generally replaced by the initial elastic modulus of the sample (Changyu et al., 2012).That elastic energy is the area of triangle ABC in Figure 11. The curve closest to the average value at each loading rate is selected, and the strain energy of each shale sample under each loading rate when it is loaded to the peak strength is calculated. The calculated results are shown in Table 4.
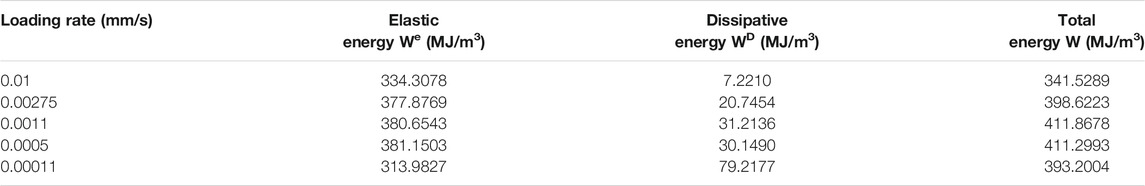
TABLE 4. Energy values of samples under peak strength at different loading rates.
The data in Table 4 are plotted in the coordinate system, and the trend line of strain energy is shown in Figure 12. It can be clearly seen that within the range of the loading rate in this study, with the increase in loading rate, the elastic strain energy We absorbed by the rock sample increases first and then decreases, and the peak of the elastic strain energy appears when the loading rate is about 0.0005 mm/s. With the increase in the loading rate, the dissipated energy WD absorbed by the sample decreases. Fatigue damage and new plastic deformation caused by interfacial friction between cracks during compression are a reflection of dissipated energy. The higher the dissipated energy, the more cracks and greater the fracturing degree will occur in the sample. Therefore, in the point of view of the dissipative energy, a lower loading rate is helpful to produce more cracks and greater degree of fracture in the shale matrix.
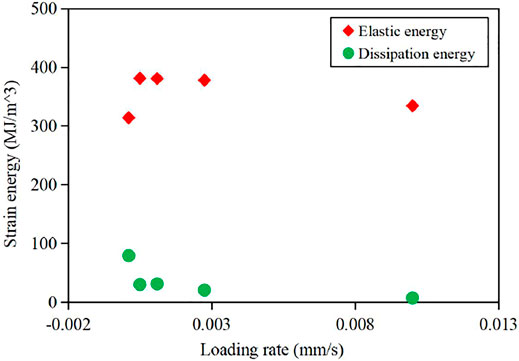
FIGURE 12. Relationship between elastic energy, dissipative energy, and loading rate.
In the process of uniaxial compression, when the shale sample reaches the peak strength, the elastic strain energy is suddenly released, resulting in complete crushing of the rock matrix immediately, and the consumed fracture energy is close to 0 (Changyu et al., 2012). Therefore, the elastic strain energy absorbed by the sample before the peak value represents the brittleness of the sample to some extent. In other words, the greater the elastic strain energy absorbed by the sample at the peak, the stronger will be the brittleness of the sample. Brittleness is reflected by the number of cracks and the fracturing effect. From this, it can be seen that with the increase in the loading rate, the absorbed elastic strain energy, the number of cracks, and the fracture degree of the sample all show a downward trend, that is, with the decrease of loading rate, the rock samples show stronger brittleness.
Discussion and Application
From the previous analysis, it can be seen that the response characteristics of loading rate to peak strength, elastic modulus, and elastic energy of rock sample are obvious. A comprehensive understanding of various parameters of rock mass is the need of extensive engineering design. Determining the characteristics of mechanical parameters of shale can provide effective and reliable technical references for the design of the shale gas development project. In the process of shale gas development and utilization, most researchers mainly pay attention to the influence of shale fracture characteristics on shale gas production efficiency. Shale is a special reservoir with the functions of production, storage, and covering. For rock mass like shale, the structure is compact, the permeability is low, and the micropores are developed. Therefore, shale has always been regarded as caprock, and it has not received enough attention in the past. With the increasing demand for energy and the gradual depletion of conventional oil and gas resources, we have to turn our attention to shale gas production, although it is difficult to be exploited. According to existing research results, apart from the loading rate, the bedding direction is also one main factor that affects the mechanical properties of shale. A large number of studies have shown that shale is easier to crack in the bedding direction than in the vertical bedding direction.
In the process of shale gas exploitation, it is the most effective way to produce shale gas by fracturing to produce dense, crisscrossing high-density fracture networks. The research results in this study show that the higher the loading rate, the greater will be the total energy absorbed by the sample. The fracture characteristic is that the larger the crack blocks, the fewer will be the cracks. Although the samples absorb more energy at a higher loading rate, most of the energy is used for the kinetic energy of the rock mass. Due to the relatively small number of cracks produced under a high loading rate, the production efficiency in shale gas development will not be ideal. However, when the loading rate is low, the energy absorbed by the rock sample is small. The fracture characteristics are that there are many cracks, the cracks are fully developed, and most of the absorbed energy is fully utilized in the crack development. Therefore, in shale gas development and utilization projects, a low loading rate can often improve the efficiency of shale gas exploitation.
Conclusion
1) During the uniaxial compression test of shale, different loading rates have an obvious response to the mechanical characteristics and deformation characteristics of rock samples. The peak strength of rock samples increases with the increase in loading rate, and it has a good linear relationship. The elastic modulus and Poisson’s ratio fluctuate with the loading rate.
2) In the process of compression, rock sample failure also has four basic stages: the compaction stage, the linear elastic stage, the yielding stage, and the post-destruction stage. Due to the physical properties of rock samples and sampling angle, the compaction time is very short. With the increase in the loading rate, the axial and circumferential deformation of rock samples can rapidly and stably reach the peak strain.
3) At high loading rates, shale is broken into pieces, but cracks are less developed; at low loading rates, vertical and horizontal fracture networks are formed. Under a lower loading rate, longer cracks will be formed. Therefore, in the process of hydraulic fracturing, the lower fracturing speed is conducive to the formation of crisscrossing fine fracture networks in the reservoir, which is also beneficial to improve the productivity of shale gas.
4) With the increase in the loading rate, the elastic energy, the dissipated energy, and the total energy of the rock samples all decrease. As the loading rate decreases, the dissipative energy and elastic energy absorbed by the rock samples increase. At a lower loading rate, the rock samples are accompanied by stronger brittleness, fully developed cracks, and a higher macroscopic fracture degree, that is, more and more cracks develop and more fracture surfaces are generated.
Data Availability Statement
The original contributions presented in the study are included in the article/Supplementary Material; further inquiries can be directed to the corresponding author.
Author Contributions
YW wrote the manuscript, LZ is the supervisor of the manuscript and project, TY did editing work, and WL designed the research structure and revised the manuscript.
Funding
This research was supported by the Guizhou Provincial Geological Exploration Fund (Grant No. 208-9912-JBN-UTS0) and the Fundamental Research Funds for the Central Universities (Grant No. 2021CDJQY-030).
Conflict of Interest
The authors declare that the research was conducted in the absence of any commercial or financial relationships that could be construed as a potential conflict of interest.
The handling editor declared a shared affiliation with the authors TY and WL at the time of review.
Publisher’s Note
All claims expressed in this article are solely those of the authors and do not necessarily represent those of their affiliated organizations, or those of the publisher, the editors, and the reviewers. Any product that may be evaluated in this article, or claim that may be made by its manufacturer, is not guaranteed or endorsed by the publisher.
References
Changyu, L., Xiao, L., Wang, S., Li, S., He, J., and Ma, C. (2012). Experimental Investigation on Rate-Dependent Stress-Strain Characteristics and Energy Mechanism of Rock under Uniaxial Compression. Chin. J. Rock Mech. Eng.31 (09), 1831–1838. doi:10.3969/j.issn.1000-6915.2012.02.003
Chen, C., Fan, X., and Chen, X. (2020). Experimental Investigation of concrete Fracture Behavior with Different Loading Rates Based on Acoustic Emission. Construction Building Mater.237, 117472. doi:10.1016/j.conbuildmat.2019.117472
Gautam, P. K., Verma, A. K., Jha, M. K., Sarkar, K., Singh, T. N., and Bajpai, R. K. (2016). Study of Strain Rate and thermal Damage of Dholpur sandstone at Elevated Temperature. Rock Mech. Rock Eng.49, 3805–3815. doi:10.1007/s00603-016-0965-5
Guo, Y., Yang, C., and Mao, H. (2012). Mechanical Properties of Jintan Mine Rock Salt under Complex Stress Paths. Int. J. Rock Mech. Mining Sci.56, 54–61. doi:10.1016/j.ijrmms.2012.07.025
Heng, S., Liu, X., Li, X., Zhang, X., and Yang, C. (2019). Experimental and Numerical Study on the Non-Planar Propagation of Hydraulic Fractures in Shale. J. Pet. Sci. Eng. 179, 410–426. doi:10.1016/j.petrol.2019.04.054
Hou, Z., Yang, C., Wang, L., and Xu, F. (2016). Evaluation Method of Shale Brittleness Based on Indoor Experiments. J. Northeast. Univ. (Natural Science).37 (10), 1496–1500. doi:10.3969/j.issn.1005-3026.2016.10.027
Li, S., Chen, G., Shuang, H., Lin, H., and Zhao, P. (2019). Experimental Study on Effect of Loading Rate and Initial Damage on Energy Evolution of sandstone. J. Mining Saf. Eng.36 (2), 373–380.
Li, X., Peng, K., Peng, J., and Hou, D. (2021). Effect of thermal Damage on Mechanical Behavior of a Fine-Grained Sandstone. Arab J. Geosci.14, 1212. doi:10.1007/s12517-021-07607-0
Li, Y., Jia, D., Rui, Z., Peng, J., Fu, C., and Zhang, J. (2017). Evaluation Method of Rock Brittleness Based on Statistical Constitutive Relations for Rock Damage. J. Pet. Sci. Eng.153, 123–132. doi:10.1016/j.petrol.2017.03.041
Liang, X., Ye, X., Zhang, J., and Shu, H. (2011). Reservoir Forming Conditions and Favorable Exploration Zones of Shale Gas in the Weixin Sag, Dianqianbei Depression. Pet. Exploration Development Online.38 (6), 225–230. doi:10.1016/S1876-3804(12)60004-4
Liu, J., Liu, W., Yang, C., and Liang, H. (2014). Experimental Research on Effects of Srain Rate on Mechanical Properties of Shale. Rock Soil Mech.35 (11), 3093–3100.
Liu, W., Zhang, Z., Fan, J., Jiang, D., Li, Z., and Chen, J. (2020). Research on Gas Leakage and Collapse in the Cavern Roof of Underground Natural Gas Storage in Thinly Bedded Salt Rocks. J. Energ. Storage.31, 101669. doi:10.1016/j.est.2020.101669
National Development and Reform Commission, Ministry of Finance (2012). Ministry of Land and Resources and Energy Bureau. Shale Gas Development Plan 2011-2015. Beijing: China Planning Press.
Qiao, W., Moayedi, H., and Foong, L. K. (2020a). Nature-inspired Hybrid Techniques of IWO, DA, ES, GA, and ICA, Validated Through a K-fold Validation Process Predicting Monthly Natural Gas Consumption. Energy and Buildings.217, 110023. doi:10.1016/j.enbuild.2020.110023
Qiao, W., Yang, Z., Kang, Z., and Pan, Z. (2020b). Short-term Natural Gas Consumption Prediction Based on Volterra Adaptive Filter and Improved Whale Optimization Algorithm. Eng. Appl. Artif. Intelligence.87, 103323. doi:10.1016/j.engappai.2019.103323
Rybacki, E., Meier, T., and Dresen, G. (2016). What Controls the Mechanical Properties of Shale Rocks? - Part II: Brittleness. J. Pet. Sci. Eng.144, 39–58. doi:10.1016/j.petrol.2016.02.022
Shuai, H., Li, X., Zhang, X., and Li, Z. (2021). Mechanisms for the Control of the Complex Propagation Behaviour of Hydraulic Fractures in Shale. J. Pet. Sci. Eng.200 (6), 108417. doi:10.1016/j.petrol.2021.108417
Song, X., Guo, Y., Zhang, J., Sun, N., Shen, G., Chang, X., et al. (2019). Fracturing with Carbon Dioxide: from Microscopic Mechanism to Reservoir Application. Joule.3 (8), 1913–1926. doi:10.1016/j.joule.2019.05.004
Wang, D.-y., Li, X.-b., Peng, K., Ma, C.-d., Zhang, Z.-y., and Liu, X.-q. (2018). Geotechnical Characterization of Red Shale and its Indication for Ground Control in Deep Underground Mining. J. Cent. South. Univ.25 (12), 2979–2991. doi:10.1007/s11771-018-3968-4
Wei, Y., Yang, C., Guo, Y., Liu, W., Wang, L., and Heng, S. (2015a). Experimental Investigation on Deformation and Fracture Characteristics of Brittle Shale with Natural Cracks Uniaxial Cyclic Loading. Rock Soil Mech.36 (06), 1649–1658. doi:10.16285/j.rsm.2015.06.017
Wei, Y., Yang, C., Guo, Y., Liu, W., Wang, L., and Xu, J. (2015b). Experimental Research on Deformation and Fracture Characteristics of Shale under Cyclic Loading. Chin. J. Geotechnical Eng.37 (12), 2262–2270. doi:10.11779/CJGE201512016
Wen, H., Chen, M., Jin, Y., Wang, K., Xia, Y., Dong, J., et al. (2014). A Chemo-Mechanical Coupling Model of Deviated Borehole Stability in Hard Brittle Shale. Pet. Exploration Development.41 (6), 817–823. doi:10.1016/s1876-3804(14)60099-9
Xiao, D., Lu, S., Shao, M., Zhou, N., Zhao, R., and Peng, Y. (2021). Comparison of marine and continental Shale Gas Reservoirs and Their Gas-Bearing Properties in China: the Examples of the Longmaxi and Shahezi Shales. Energy Fuels.35 (5), 4029–4043. doi:10.1021/acs.energyfuels.0c04245
Xie, Q., Li, S.-x., Liu, X.-l., Gong, F.-q., and Li, X.-b. (2020). Effect of Loading Rate on Fracture Behaviors of Shale under Mode I Loading. J. Cent. South. Univ.27 (10), 3118–3132. doi:10.1007/s11771-020-4533-5
Yang, L. A., Ma, T. S., Hao, W. C., and Chen, P. B. (2020). Investigation on Mechanical Behaviors of Shale Cap Rock for Geological Energy Storage by Linking Macroscopic to Mesoscopic Failures. J. Energ. Storage.29, 101326. doi:10.1016/j.est.2020.101326
Yao, S., and Yue, Z. (2021). Experimental Study on Dynamic Fracture Behaviors of Beishan NSCB and CCNSCB Granite Specimens under Different Loading Rates. Soil Dyn. Earthquake Eng.141, 106512. doi:10.1016/j.soildyn.2020.106512
Zhang, Q., Fan, X., Chen, P., Ma, T., and Zeng, F. (2020). Geomechanical Behaviors of Shale after Water Absorption Considering the Combined Effect of Anisotropy and Hydration. Eng. Geology.269, 105547. doi:10.1016/j.enggeo.2020.105547
Zhang, X., Liu, W., Jiang, D., Qiao, W., Liu, E., Zhang, N., et al. (2021). Investigation on the Influences of Interlayer Contents on Stability and Usability of Energy Storage Caverns in Bedded Rock Salt. Energy.231, 120968. doi:10.1016/j.energy.2021.120968
Zhang, Y., Zhang, Q.-Y., Zhou, X.-Y., and Xiang, W. (2021). Direct Tensile Tests of Red sandstone under Different Loading Rates with the Self-Developed Centering Device. Geotech Geol. Eng.39, 709–718. doi:10.1007/s10706-020-01515-y
Zhao, J., Liu, C., Yang, H., and Li, Y. (2015). Strategic Questions about China's Shale Gas Development. Environ. Earth Sci.73 (10), 6059–6068. doi:10.1007/s12665-015-4092-5
Zhao, K., Yu, X., Zhou, Y., Wang, Q., Wang, J., and Hao, J. (2020). Energy Evolution of Brittle Granite Under Different Loading Rates. Int. J. Rock Mech. Mining Sci.132 (7), 104392. doi:10.1016/j.ijrmms.2020.104392
Zhiltsov, S. S., and Zonn, I. S. (2016). Shale Gas Production in the USA. Moscow, Russia: Shale Gas: Ecology, Politics, Economy.
Zhou, W. (1990). Advanced Rock Mechanics. Beijing: China Water Conservancy and Hydropower Press, pp219.
Keywords: shale gas, loading rate, deformation characteristics, dissipated energy, fracture characteristics
Citation: Wei Y, Zhao L, Yuan T and Liu W (2022) Study on Mechanical Properties of Shale Under Different Loading Rates. Front. Earth Sci. 9:815616. doi: 10.3389/feart.2021.815616
Received: 15 November 2021; Accepted: 03 December 2021;
Published: 15 February 2022.
Edited by:
Jie Chen, Chongqing University, ChinaReviewed by:
Tianshou Ma, Southwest Petroleum University, ChinaHuafu Qiu, Xi’an University of Science and Technology, China
Shi Xilin, Institute of Rock and Soil Mechanics (CAS), China
Copyright © 2022 Wei, Zhao, Yuan and Liu. This is an open-access article distributed under the terms of the Creative Commons Attribution License (CC BY). The use, distribution or reproduction in other forums is permitted, provided the original author(s) and the copyright owner(s) are credited and that the original publication in this journal is cited, in accordance with accepted academic practice. No use, distribution or reproduction is permitted which does not comply with these terms.
*Correspondence: Lingyun Zhao, NTE3NTQzMjM5QHFxLmNvbQ==; Wei Liu, Z3VhcmVubGl1d2VpQDEyNi5jb20=