 Chengcheng Gao1,2
 Guangliang Feng
95% of researchers rate our articles as excellent or good
Learn more about the work of our research integrity team to safeguard the quality of each article we publish.
Find out more
ORIGINAL RESEARCH article
Front. Earth Sci. , 28 January 2022
Sec. Geohazards and Georisks
Volume 9 - 2021 | https://doi.org/10.3389/feart.2021.812661
This article is part of the Research Topic Spatial Modelling and Failure Analysis of Natural and Engineering Disasters through Data-based Methods View all 42 articles
Safe and effective mining of phosphate rock plays an important role in the sustainable development of phosphorus resources. The mechanical properties and failure process of phosphate rock under different mining rates remain unclear, further restricting the safe and efficient mining of phosphate rock. In this paper, infrared radiation and uniaxial compression tests of phosphate rock under different loading rates, e.g., 0.0005, 0.001, 0.005, and 0.01 mm/s, were conducted to investigate the failure process of phosphate rock. Energy evolution and infrared radiation characteristics of the phosphate rock damage process were analyzed using nondestructive, real-time, and noncontact infrared thermal imaging technology. The results show that the higher the loading rate of phosphate rock, the more obvious the high-temperature zone and high-temperature point of phosphate rock in the loading process. At failure, the friction and slippage between internal cracks are intense, showing that the infrared radiation temperature difference increases with the increase of loading rate. As loading rate increases, the energy release time of phosphate rock before damage is reduced, resulting in more energy stored in the rock as evinced by its infrared radiation characteristics, finally resulting in greater damage. The increase of loading rate reduces the dissipation energy of phosphate rock before failure so that more energy remains in the rock mass through the weak surface of the grain boundary. The results of this work will be helpful in enhancing theoretical support for prevention and control of dynamic disasters in phosphate mines.
Phosphate rock, as a nonrenewable resource (Vaccari and Strigul, 2011), is an important nonmetallic mineral resource, mainly distributed in Africa, North America, South America, Asia, and the Middle East. In recent years, global phosphate rock production driven by demand has been increased year on year. According to statistics, 90% of the world's phosphate rock is used to produce phosphate fertilizer. Based on the current global phosphate rock production capacity and the amount of retained resources, the available period of resources is a further 99 years. Due to insufficient rich ore reserves in China and the gradual depletion of shallow phosphate resources, deep phosphate must be mined. Because the phosphate deposit is inclined layered, which contains geological structures such as faults and folds, the stress environment around mining areas is complex. With the increase of mining depth, rockbursts in deep phosphate rock frequently occur, which seriously threaten the safety of underground mining. The identification of rockburst precursors is of great significance to the safe mining of phosphorus resources and deep engineering (Guang-Liang et al., 2015a; Guang-Liang et al., 2019a; Guang-Liang et al., 2021).
It is a common phenomenon for rock to produce the thermal effect and infrared radiation change due to rock stress. As a nondestructive testing method, infrared thermal imaging technology is widely used in the field of damage detection of rock and other materials. Wu et al. (Li-Xin and Jin-Zhuang, 1998) proposed that under uniaxial compression, the average infrared radiation temperature (AIRT) had three precursory characteristics, and the infrared thermal image could reflect the form and position of rock before fracture. Zhang et al. (Yan-Bo et al., 2020) used a uniaxial loading system and an infrared thermal imager to study the spatiotemporal evolution characteristics of thermal radiation during the stress and fracture process of granite specimens. Huang et al. (Fu-Run et al., 2021) fitted and analyzed the average infrared radiation temperature of, and stress in gneiss, and found that there was a strong correlation between them. Huo et al. (Meng-Zhe et al., 2020) studied the influences of different gradient stresses on the evolution characteristics of the infrared temperature field leading up to rockburst. It was found that the fracture of the specimens was accompanied by the abnormal infrared radiation temperature, and the abnormal phenomenon can predict the location of the rockburst. Tian et al. (Bao-Zhu et al., 2016) simulated the rockburst process of granite surrounding rock roadway by two-way loading test and found that the spatiotemporal evolution of infrared radiation in the rockburst process of granite has good synchronization with the occurrence of a rockburst. Wu et al. (Xian-Zhen et al., 2015) explored the mutations of infrared temperature field in the process of rock failure and instability by infrared monitoring test of the high-temperature water-immersed siltstone loading process. Other scholars studied the infrared radiation characteristics of rock fracture from the perspectives of spatiotemporal changes and their evolution (Da-Jun et al., 2019; Li-Qiang et al., 2019).
The loading rate applied during engineering construction has a significant effect on the mechanical properties of the rock encountered therein (Guang-Liang et al., 2015b; Guang-Liang et al., 2019b; Guang-Liang et al., 2020; Zhang et al., 2021). The stress distribution and evolution of the working face and surrounding rock are affected by the rate of tunnel excavation and mining operation. Therefore, the loading rate applied in engineering construction has often been studied; however, the mechanical properties and failure process of phosphate rock under different loading rates are unclear. As mentioned earlier, infrared thermal imaging technology has the advantages of fast response, noncontact, all-weather use with no visible light compared with the widely used acoustic emission detection technique. The infrared radiation characteristics of phosphate rock under different loading rates are rarely investigated. In this paper, through the uniaxial loading test of phosphate rock specimens under different loading rates, the infrared radiation characteristics of phosphate rock under failure are observed using an infrared thermal imager. The stress–strain curves, visible light photos, infrared radiation information, and the energy change of the whole loading process were compared and analyzed. The results will provide theoretical support for the prevention and early warning of rockburst disasters in phosphate mines.
Due to the room and pillar method usually being used in underground phosphate mining, the empty pillar bears the stress caused by the rock mass. In the mining process, the loading rate of axial force of underground pillar also changes owing to the effects of excavation disturbance and limits to excavation conditions. Therefore, the uniaxial compression testing of phosphate rock under different loading rates was performed in the laboratory. The axial equal displacement control method was used to load phosphate rock specimens at rates of 0.0005, 0.001, 0.005, and 0.01 mm/s, with three replicates in each group. The infrared radiation changes were captured and recorded using an infrared thermal camera and high-speed camera system to further determine the infrared radiation characteristics of phosphate rock under the action of nonworking conditions.
The phosphate rock was sampled from a mine in Hubei Province, China. The phosphate layer occurs in the sedimentary phosphate rock of the second member of the Doushantuo Formation of the upper Sinian system. The deposit is a gently inclined thin-to-medium-thick ore body. Some rockbursts occurred during mining under the influences of tectonic stress and excavation disturbance. With the increase of mining rate, the rockbursts of the excavation face become more intense and the severity and extent of the ensuing damage increase. A typical rockburst is shown in Figure 1.
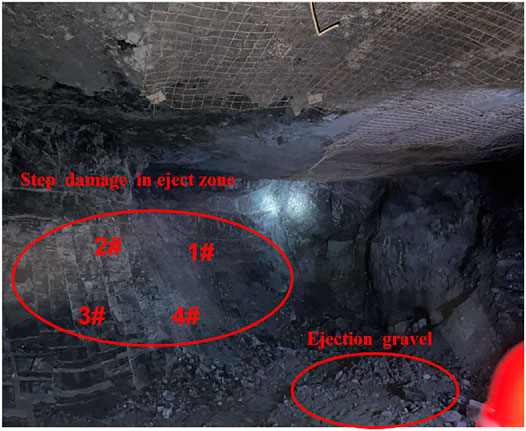
FIGURE 1. A typical rockburst in mine.
To explore the causes of rockburst difference, an in-situ infrared inspection was conducted on the face of the mining area, and it was found that there were differences in infrared thermal images in different areas of the face. Therefore, infrared spectrum analysis and stress analysis of phosphate rock were conducted. The phosphate rock at different positions in the mining area (area 1#, 2#, 3#, and 4#, as shown in Figure 1) was assessed by Fourier infrared spectrometer (Barra et al., 2021; Enders et al., 2021). The infrared spectrum analysis results of ore rock at different positions are shown in Figure 2. The infrared spectra of phosphate rocks in four different regions are the same, and the main absorption ranges are 400–2,000 and 2,500–3,700 cm−1. The infrared spectra of phosphate rocks in four regions all exhibit sharp multiple bands at 400–600 cm−1, indicating that the composition of phosphate rocks is relatively simple but with many types of elements. The spectral analysis of phosphate rocks in different locations indicated that the difference in composition is not the main reason for the difference in infrared thermal images; therefore, the mechanical experiments of phosphate rock under different loading rates were conducted, and the whole loading process was observed by infrared thermal imager to ascertain the reasons for the observed in-situ differences.
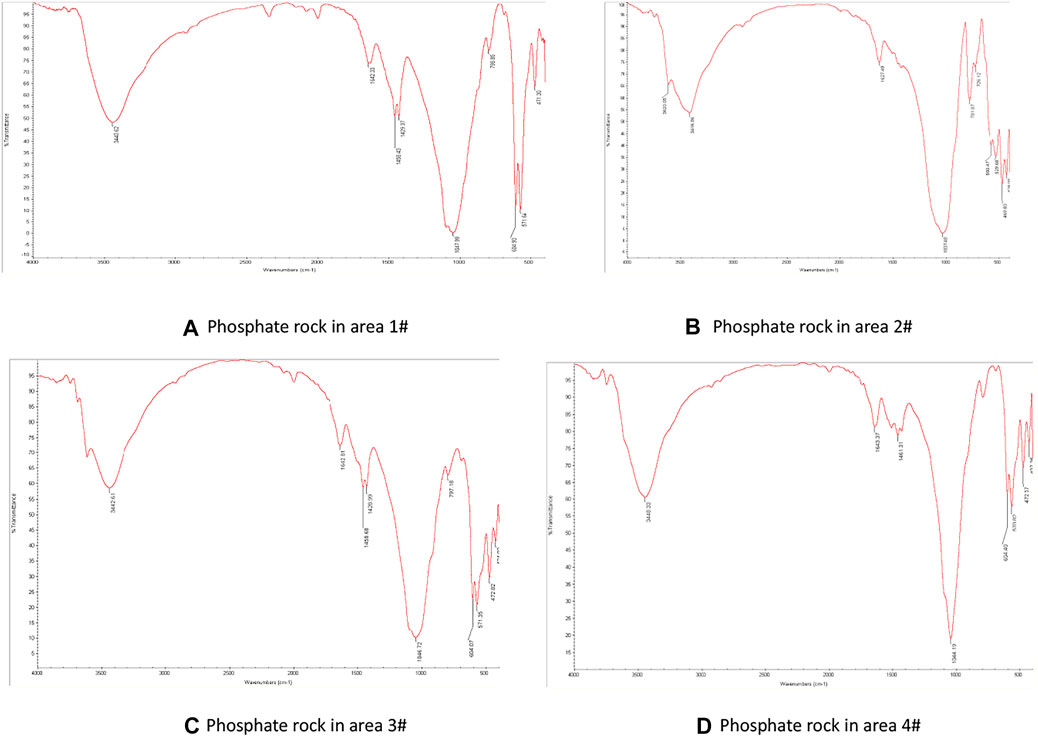
FIGURE 2. Infrared spectrum of phosphate rock specimens. (A) Phosphate rock in area 1#, (B) Phosphate rock area 2#, (C) Phosphate rock in area 3#, (D) Phosphate rock in area 4#.
The typical phosphate rock in the phosphate rock mining site was sampled and processed, and the phosphate rock in the natural state was processed into a standard cylinder with a diameter of 50 mm and a height of 100 mm. The specimens were carefully polished at both ends of the loading to make the surface non-parallelism less than 0.02 mm and divided into four groups, with three specimens in each group.
The infrared thermal imager used herein was developed by the Wuhan Institute of Technology. The detector resolution is 384 × 288 pixels, the spectral range is 8–14 μm, and the temperature sensitivity is less than 0.05°C. The uniaxial compression test was carried out by RMT-301 rock and a concrete mechanics experimental loading device. The test process was recorded using a high-speed camera system. An infrared thermal imager and digital fast camera were installed at 1.0 m in front of the specimen. The display time of each computer was calibrated before the test so that the press, infrared thermal imager, and digital fast camera could synchronously collect data. The loading system is shown in Figure 3.
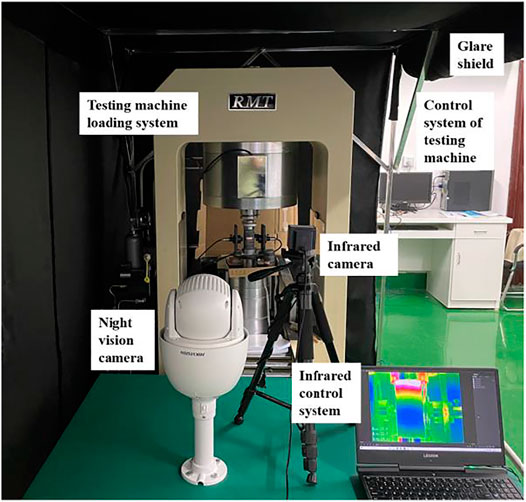
FIGURE 3. Loading system diagram.
To ensure the complete contact between the phosphate rock specimen and the loading surface, the specimen was preloaded, then loaded to failure at a constant rate; because the infrared thermal imager was more sensitive to the reaction, a black shading cloth was used to cover the loading system and the monitoring system during the test, the indoor doors and windows were closed, and the personnel was prohibited from moving around. We reduce the airflow at the test site as much as possible to ensure better test results.
After the specimen was placed, the temperature was monitored, and the test was started when the surface temperature of the specimen was uniform. To avoid the influences of uncontrollable factors on the temperature of the specimen in the test site, before the test, the phosphate rock specimen with the same properties was placed next to the phosphate rock specimen to be loaded as a reference, and the temperature change of the phosphate rock specimen under loading was compared and analyzed to compensate for the temperature error during the test, as illustrated in Figure 4. The uniaxial loading tests of phosphate rock specimens at loading rates of 0.0005, 0.001, 0.005, and 0.01 mm/s were conducted, and the test results were analyzed.
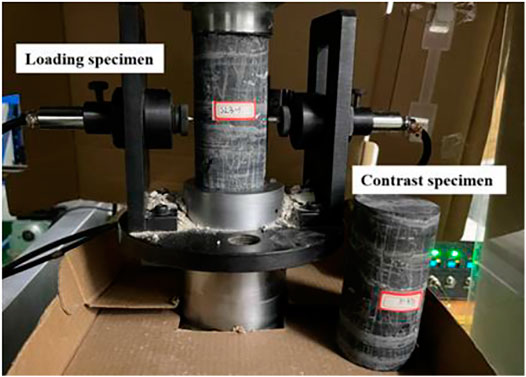
FIGURE 4. Comparison of loading phosphorite specimens and reference material.
The failure mode of rock is not only related to internal crystalline particles and initial defects but also has a great correlation with the loading rate. The degree of rock fragmentation and failure mode can reflect the stress on the rock to a certain extent. The macroscopic failure of phosphate rock specimens under different loading rates is depicted in Figure 5. Figure 5A shows the failure diagram of the phosphate rock specimen at the loading rate of 0.0005 mm/s: the surface of the specimen is broken and accompanied by surrounding debris shedding, but the integrity of the specimen remains good. Figures 5B,C are the failure diagrams of the specimens at loading rates of 0.001 and 0.005 mm/s, which exhibit local failure and instability dominated by the middle part failing and the splitting along the direction parallel to the axial stress. As shown using red labels in Figure 5B, the damaged specimens maintained their integrity. Figure 5D demonstrates the failure of a specimen at a loading rate of 0.01 mm/s. The specimen is crushed into multiple blocks of different sizes at failure, which cannot maintain its integrity: the degree of crushing of phosphate rock increases with the increase of loading rate, and many particles are crushed at a higher loading rate.
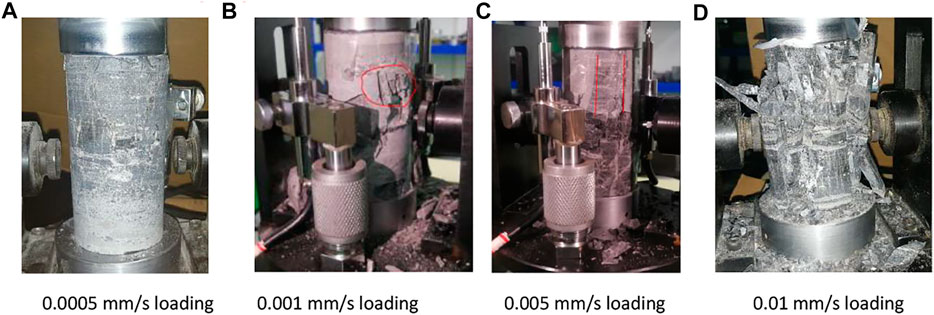
FIGURE 5. Failure of specimens under different loading rates. (A) 0.0005 mm/s loading, (B) 0.001 mm/s loading, (C) 0.005 mm/s loading, (D) 0.01 mm/s loading.
The residual parent body of phosphate rock specimen tested at a loading rate of 0.01 mm/s can be observed, and the surface is found to exhibit obvious failure mode of step-shaped and cone-shaped combination, as shown in Figures 6A,B. According to the analysis, because the diagenesis of phosphate rock is affected by sedimentary evolution, its internal structural plane is obvious, so under loading, the dominant structure plays a leading role in the formation of internal steps of rock mass, and thus shows obvious stepped failure characteristics (Peng and Mei-Feng, 2021). However, for the rock mass between structural planes, the rock mass is mainly affected by cementation and is subjected to shear under load. More micro-cracks are found to form, expand, and penetrate, then form a macroscopic conical fracture surface. The higher the loading rate of the phosphate rock specimen, the more obvious the macroscopic fracture surface and the more damaged fragments there are.
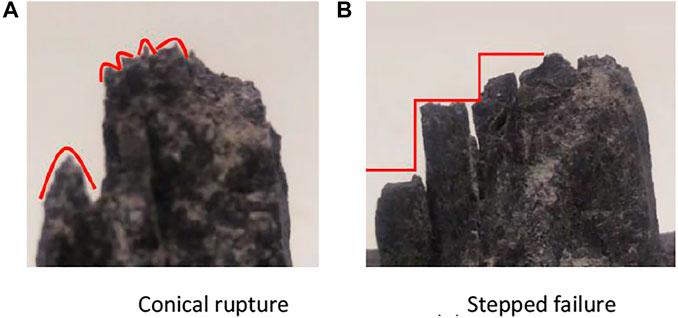
FIGURE 6. Local failure diagram of specimen. (A) Conical rupture, (B) Stepped failure.
The stress–strain curves of rock mass are important responses to the mechanical properties of the rock mass. The stress–strain curves of phosphate rock specimens under four loading rates are shown in Figure 7. There are obvious differences in stress–strain curves of phosphate rock specimens under loading rates of 0.0005, 0.001, 0.005, and 0.01 mm/s, but there are staged characteristics, which can be divided into five stages.
I) In the initial compaction stage, because there are many pores and cracks in the phosphate rock, the cracks and pores in the specimen are compacted at the beginning of loading. With the increase of the loading rate, the slope of the stress–strain curves increases, as shown in sections A-A1, B-B1, C-C1, and D-D1 (Figure 8);
II) Linear elastic stage: linear elastic deformation occurs in the specimen, such as D1 < C1 < B1 < A1 (Figure 7); the greater the loading rate, the earlier the specimen enters the linear elastic stage;
III) Plastic stage: plastic deformation occurs in the rock, the stress–strain curves of the specimens under four loading rates are step-like en route to the peak stress, and an obvious convexity is seen, indicating that the stress–strain curves under four loading rates all include a plastic strain stage, and the plastic strain stage is the longest under a loading rate of 0.0005 mm/s.
IV) Near the instability point: the specimen reaches the peak stress, such as A3, B3, C3, or D3 (Figure 8): the compressive strength values of specimens with different loading rates are 111.332 MPa (0.0005 mm/s), 152.820 MPa (0.001 mm/s), 171.357 MPa (0.005 mm/s), and 186.324 MPa (0.01 mm/s), respectively. When the loading rate is increased from 0.0005 to 0.01 mm/s, the compressive strength increases by approximately 40.2%. This indicates that the greater the loading rate, the greater the compressive strength of the specimen.
V) Post-peak weakening stage: Under loading at 0.0005 mm/s, the specimen underwent significant residual deformation, and an obvious “climbing tooth” feature appeared in the weakening stage, as shown in Figure 7, from A3 to the end. The stress–strain curves at 0.005 mm/s, and 0.01 mm/s exhibit a quasi-vertical drop after experiencing plastic strain, and the extent of the drop increases with the increase of loading rate. As shown in Figure 7 in D3 to the end, C3 to the end, and B3 to the end, the higher the loading rate, the faster the specimen weakens.
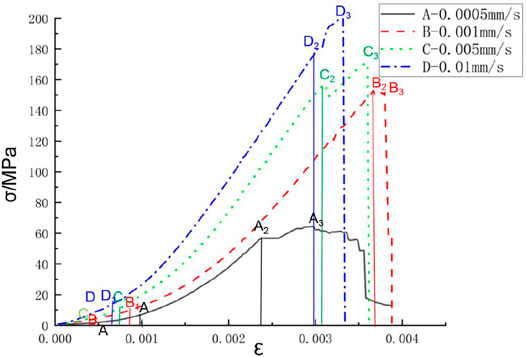
FIGURE 7. Stress–strain curves of specimens under load.
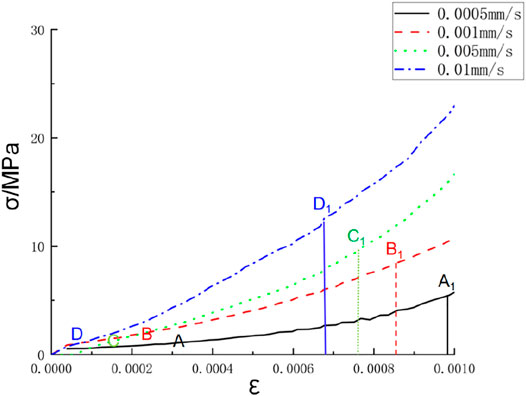
FIGURE 8. Stress–strain curves of specimens in initial compaction stage.
The test results of 12 specimens are summarized in Table 1: With the increase of loading rate, the compressive strength of phosphate rock specimens and the elastic modulus at two-thirds of the compressive strength gradually increase. The error in specimen A3 is caused by factors such as instrument error and cracks in the rock mass.
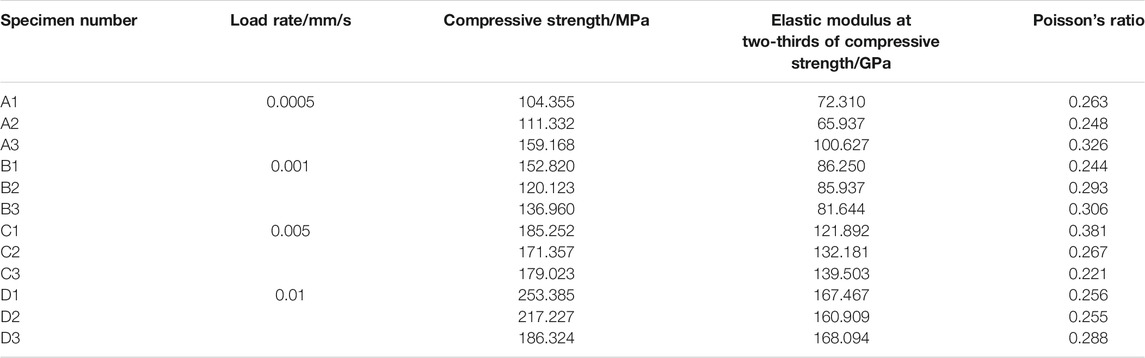
TABLE 1. Test parameters of specimens under different loading rates.
In summary, as the loading rate increases, the time from the compaction stage to the elastic stage of the phosphate rock specimen decreases, the compression deformation stage of the specimen is shorter, and the slope of the stress–strain curves increases, which is manifested by the increases of elastic modulus and compressive strength. The mechanical properties of the phosphate rock specimen show a pseudo-enhanced state; that is, as the loading rate increases, the compressive strength of the phosphate rock specimen is enhanced, and the weakening of the specimen in the post-peak stage increases.
(1) Energy calculation principle
According to thermodynamics, the destruction of rock materials is the result of energy conversion. The energy in the rock material per unit volume is assumed to cause deformation under external force in a closed system; according to the first law of thermodynamics, energy conversion is defined as:
where
The total strain energy accumulated by rock elements in principal stress space is:
where:
The relationship between elastic strain energy and loss energy of rock specimen under uniaxial compression is depicted in Figure 9. The blank area under the stress–strain curves represents the dissipation energy caused by internal damage and irreversible plastic deformation of rock
(2) Analysis of the energy evolution process
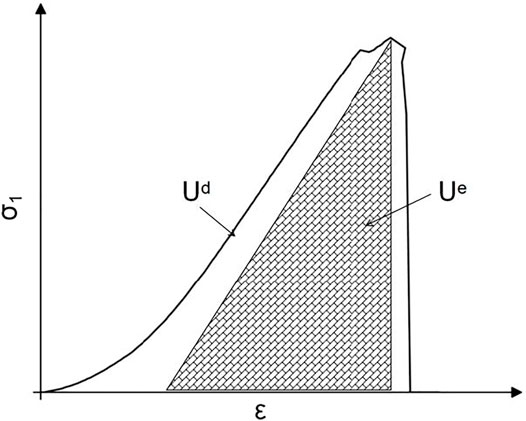
FIGURE 9. Quantitative relationship between elastic strain energy and damage dissipation energy.
The energy evolution of phosphate rock specimens under uniaxial compression can be divided into four stages: initial compaction, a linear elastic stage, plastic stage, and a post-peak weakening stage, as shown in Figure 10.
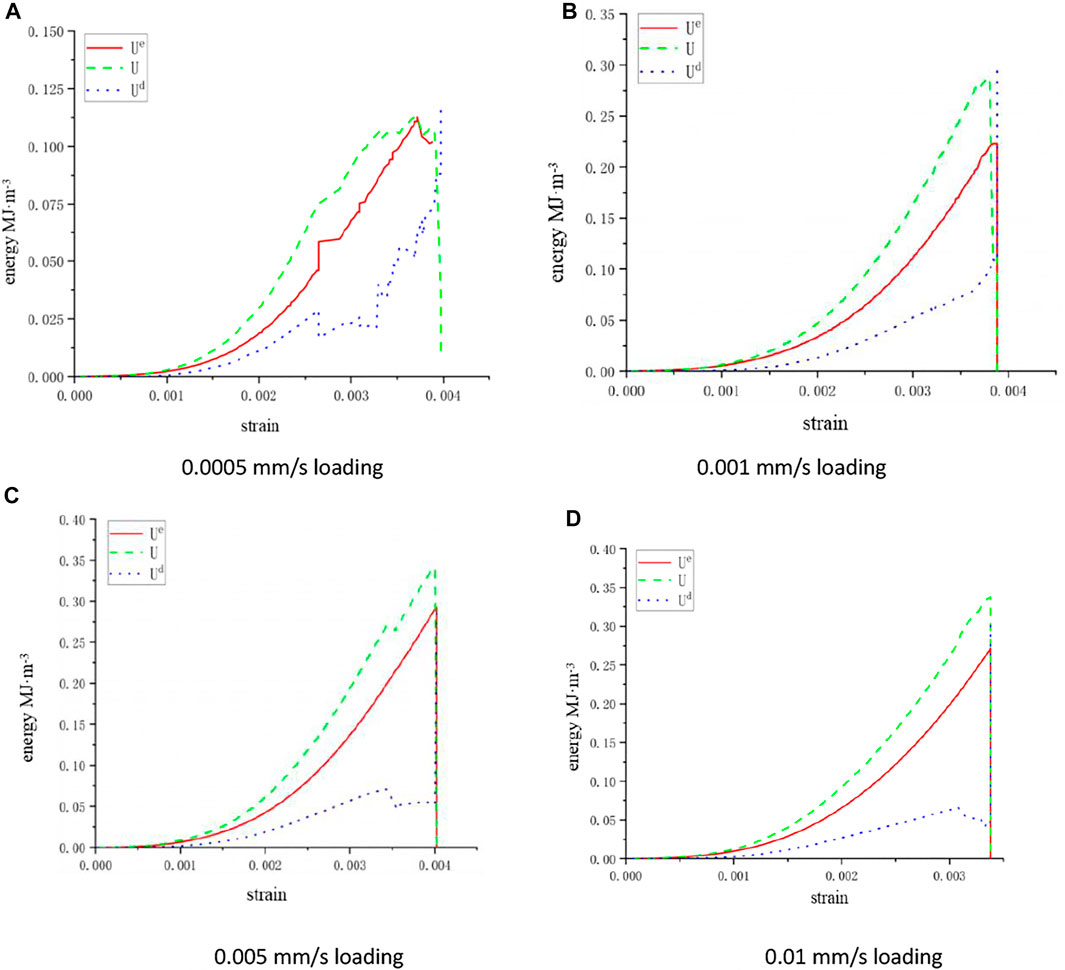
FIGURE 10. Energy evolution in phosphate rock during damage under different loading rates. (A) 0.0005 mm/s loading, (B) 0.001 mm/s loading, (C) 0.005 mm/s loading, and (D) 0.01 mm/s loading.
With the increase of stress, the primary cracks in the specimen are gradually compressed and closed. The total energy input shows a nonlinear growth trend with deformation. The closure of microcracks and friction in the rock mass dissipates most of the energy. Therefore, at this stage, the difference between the dissipated energy and the elastic deformation energy is not large, but there remains a small accumulation of elastic strain energy.
With the increase of strain, the total energy and elastic strain energy increase approximately linearly. At this time, the specimen after compaction is in an elastic state, and new cracks have not yet been initiated. The energy input by an external force is continuously transformed into the elastic strain energy inside the specimen, and the increase in energy dissipation is small.
The external load gradually approaches the compressive strength, the specimen undergoes plastic deformation, and micro-failure develops continuously, gradually forming more widespread damage and friction between cracks. The internal elastic strain energy is thus released, part of the external input energy is dissipated by the change of the internal structure, and the dissipation of energy fluctuates.
After reaching the peak strength, the rock specimen begins to be damaged, and the elastic strain energy accumulated in the rock specimen is released rapidly, and the plastic deformation shows a significant increase. At a low loading rate, the micro-fractures inside the rock specimen become fully developed, and the cracks are fully expanded and penetrated. The rock specimen loses its bearing capacity, and the dissipation of energy increases rapidly, whereas the elastic strain energy decreases. Under a high loading rate, the cracks in the rock mass have not fully expanded and collapsed, resulting in a continuous increase of elastic strain and a decrease in the dissipation of energy.
Under different loading rates, the change of elastic strain energy in the failure stage leads to the difference in the severity of damage to phosphate rock specimens when they are broken. At low loading rates, the specimens are close to being damaged, and the elastic strain energy decreases. Therefore, damage to the specimen is only manifest as the surrounding debris shedding and local failure instability, as shown in Figure 10A. At a high loading rate, the elastic strain energy still increases, so the specimen damage is characterized by severe damage being crushed into multiple blocks of different sizes, which cannot maintain its integrity.
Infrared thermography can observe the distribution and variation characteristics of the surface thermal field of rock specimens during loading in real-time; however, due to the influences of the experimental environment and the resolution of the instrument, there is often noise in the thermal image, which affects the experimental analysis. Histogram equalization is a method to enhance image contrast by stretching the pixel intensity distribution. In this paper, the original infrared thermal image is subject to histogram equalization using MATLAB, and one such image is shown in Figure 11. The image histogram is completely uniformly distributed, the image entropy is the largest, and the image contrast is the largest (Farhadian, 2021; Shan et al., 2021; Zaghloul and Hiary, 2021). The transformation function to improve image contrast needs to meet the following conditions:
(1)
(2) The range of
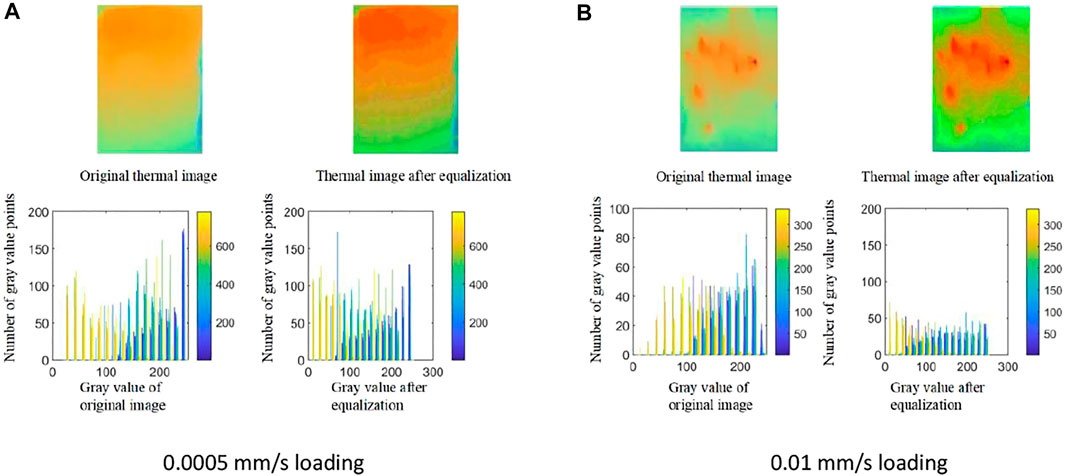
FIGURE 11. Histogram equalization for phosphate rock specimens under different loading rates. (A) 0.0005 mm/s loading and (B) 0.01 mm/s loading.
Therefore, ideally, the histogram of the image can be uniformly distributed after the transformation. The function satisfying the condition is expressed as:
where
Figures 12, 13 show the results of infrared thermal images with typical loading rates after histogram equalization. During the fracturing of phosphate rock loaded at 0.0005 mm/s, there is an obvious high-temperature zone in the upper left part of the specimen. The damage of the specimen begins from the high-temperature zone after gradual evolution. After fracturing, the integrity of residual rock remains good. The residual rock emits radiation consistent with an orange high-temperature zone, and there is no red high-temperature point seen throughout the process (Figure 12E). At a load rate of 0.01 mm/s, there are many red high-temperature points seen on thermal images recorded in the fracture process of the specimen, and the high-temperature area gradually evolves and finally presents overall collapse at failure. The specimen is broken and fell in many places, and the residual rock mass is scattered in the form of red high-temperature points, as shown in Figure 13E.
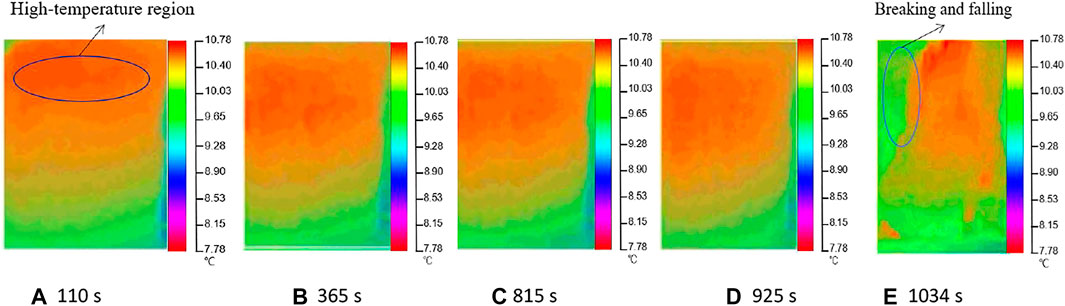
FIGURE 12. Equalization treatment: compression of phosphate rock specimens loaded at 0.0005 mm/s. (A) 110 s, (B) 365 s, (C) 815 s, (D) 925 s, and (E) 1034 s.
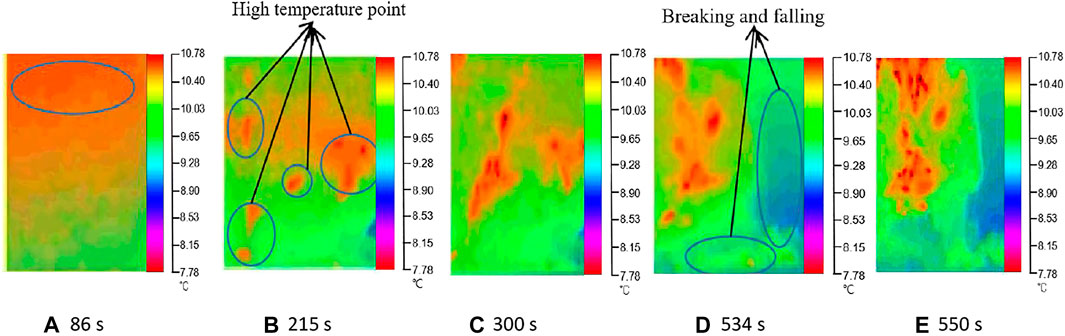
FIGURE 13. Equalization treatment: compression of phosphate rock specimens loaded at 0.01 mm/s. (A) 86 s, (B) 215 s, (C) 300 s, (D) 534 s, and (E) 550 s.
The phosphate rock specimen is taken from the phosphate rock forming the cemented structure around the mining area, so the failure and cracking of the specimen occur mostly at the contact grain boundaries of the phosphate rock and dolomite. Figure 14 shows the scanning electron microscope micrograph of the specimen loaded to failure on a cross-section magnified 3,000 times. This grain boundary is the grain boundary weak plane in the microstructure of the phosphate rock; therefore, with the increase of loading rate, the stress on the weak surface of grain boundary in a rock mass cannot be fully transferred and transmitted, and the weak surface is damaged, which accelerates the development of cracks. The greater the loading rate, the greater the energy accumulation inside the phosphate rock specimen, and the energy is suddenly released during a rockburst. The cracks formed by the residual energy rupture through the weak surface of the rock grain boundary are manifest in the form of high-temperature points. Under the small loading rate, the stress in the rock mass is fully adjusted and transferred, and the energy distribution is more uniform. Only a small part of the weak crystal interface appears damaged by the release of energy, and most of the other energy is distributed throughout the residual rock mass in the form of a high-temperature zone.
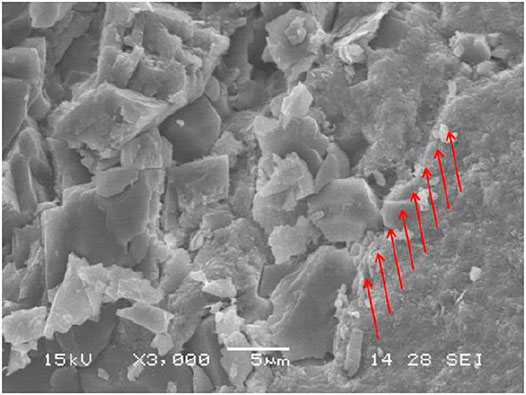
FIGURE 14. SEM images of specimen fragments under different loading rates (grain boundary weakness).
The AIRT refers to the average value of the infrared radiation temperature corresponding to all the pixels on the infrared thermal image of the target surface at a certain time. The AIRT on the rock surface is an effective indicator used to characterize the total energy change of thermal infrared radiation under load (Athar and Osama, 2018; Qing-Qing et al., 2019). Characteristics of infrared radiation temperature on the target surface could be studied on the whole by comparing the temperature change of the phosphorus rock specimen under loading using the method that places the reference material of the phosphorus rock specimen with the same properties next to the phosphorus rock specimen under load and measuring the difference between them.
The time–history curves of the temperature difference between the specimen and the reference at different loading rates are captured (Figure 15): y1 represents the temperature difference corresponding to the temperature rise precursor before specimen fracture, and y2 is the initial temperature difference between the specimen and the reference object. With increasing load, the difference of infrared radiation temperature between the phosphorite specimen and the reference generally shows a fluctuating upward trend. In the early stage of failure, the temperature difference increases sharply, and the temperature difference reaches a maximum before the stress reaches the peak. After the failure of the phosphate rock specimen, the temperature decreases with the decrease of stress. Under the loading at 0.01 mm/s, the temperature difference between the specimen and the reference material demonstrates a steep downward trend in the weakening thereof, whereas the temperature difference between the target and the reference material exhibits a fluctuating downward trend in the weakening process under loading at 0.0005 mm/s.
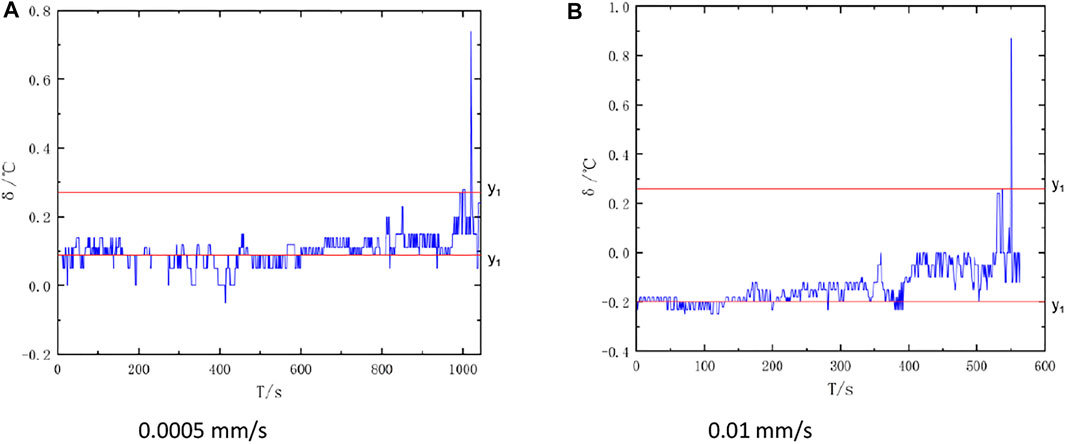
FIGURE 15. Temperature difference between specimen and reference with loading time. (A) 0.0005 mm/s and (B) 0.01 mm/s.
Before fracturing, the temperature difference between the phosphorite specimen and the reference material under loading at 0.0005 mm/s increases to its maximum value, and the temperature difference is around 0.2°C, and the temperature rise is close to 0.8°C at the moment of fracture, as shown in Figure 15A. Before fracturing, the temperature difference between the phosphorite specimen and the reference material loaded at 0.01 mm/s shows a sharp increase resulting in a temperature difference of around 0.4°C and one of around 1.2°C at the moment of fracture (Figure 15B). Before the specimen ruptures, there are obvious precursors in the form of temperature rises, and there are double peaks, as shown in Figure 15; these double peaks provide some basis for on-site rockburst warning, but the relationship between the causes of double peaks and the structural components of phosphate rock remains to be clarified.
The temperature difference between the phosphate rock specimen and the reference under loading at 0.01 mm/s is greater than that at 0.0005 mm/s. Due to the fracturing of the specimen, the mechanical deformation characteristics between particles are different, and friction and slippage occur, resulting in infrared radiation from low-speed energy and load transmission. The greater the loading rate, the faster and more severe the internal friction and sliding of the rock mass, leading to a larger temperature difference between the phosphorite specimen and the reference substance.
Under different loading rates, the difference in the change of dissipated energy in the failure stage leads to the difference in the infrared radiation characteristics of the specimen. At low loading rates, the dissipated energy increases upon the onset of damage, and the input energy is dissipated due to the change of the structure. A small part of the energy remains in the rock mass as evinced by the infrared radiation characteristics; therefore, at low loading rates, the average infrared radiation temperature of the specimen before the damage of the specimen changes slowly, and there is no red high-temperature point in the infrared thermal image. At a high loading rate, near the damage, the dissipation energy decreases, and more energy remains in the rock mass as evinced by the infrared radiation characteristics. Therefore, at a high loading rate, the average infrared radiation temperature of the specimen before damage changes significantly, and the infrared thermal image shows obvious red high-temperature points.
To ascertain the reasons for the difference in infrared thermal images of phosphate rock in the field, uniaxial compression tests of phosphate rock under four different loading rates were conducted. An infrared thermal imager was used to monitor the whole loading process of the specimens. The stress–strain curves, visible light photographs, infrared radiation information, and the energy changes throughout the loading process were compared and analyzed. The result indicated that the change of loading rate affects the failure mode of phosphate rock specimens. The higher the loading rate, the greater the damage to the phosphate rock specimens. The failure mode of the phosphate rock specimens changes from local failure and instability to comprehensive failure and instability. The specimens show obvious conical failure under loading at 0.01 mm/s. The mechanical properties of the phosphate rock change with loading rate. The variation of elastic strain energy in the failure stage is the fundamental reason for the difference in time to failure. The increase of loading rate makes the mechanical properties of phosphate rock specimens show a pseudo-enhanced state. The elastic modulus and compressive strength of phosphate rock specimens increase in the elastoplastic stage, and the weakening of specimens is greater in the post-peak stage, which is in good agreement with the weakening stage of the infrared radiation average temperature difference curves.
The influence of loading rate on infrared thermography of phosphate rock specimens is mainly reflected in the high-temperature zone and high-temperature points. The greater the loading rate applied to the phosphate rock specimens, the faster and more intense the internal friction and slip of the rock mass, resulting in an increase in the average infrared radiation temperature amplitude and an obvious high-temperature point in the infrared thermal image; the increase of loading rate reduces the time to release of energy in the loading of phosphate rock, and the dissipation of energy decreases before failure so that more energy remains in the rock mass and the grain boundary weak surface formed by cementation is characterized by increased infrared radiation. This study will be helpful in guiding engineers responsible for safety in phosphate mining operations.
The original contributions presented in the study are included in the article/Supplementary Material; further inquiries can be directed to the corresponding authors.
Methodology, CG and ML; formal analysis, CG and YL; investigation and experiment, DZ, CG, and XL; resources, ML and GF; writing—original draft preparation, CG; writing—review and editing, GF; supervision, ML. All authors have read and agreed to the published version of the manuscript.
This research was funded by the National Natural Science Foundation of China (grant nos. 52174085 and 42177168), Central Leading Local Science and Technology Development Project of Hubei Province (grant no. 2017ZYYD007), Key Research and Development Program Project of Hubei Province (grant no. 2020BCB078), and Wuhan Institute of Technology Graduate Innovation Fund Project (grant nos. CX2020367 and CX2020372).
The authors declare that the research was conducted in the absence of any commercial or financial relationships that could be construed as a potential conflict of interest.
All claims expressed in this article are solely those of the authors and do not necessarily represent those of their affiliated organizations or those of the publisher, the editors, and the reviewers. Any product that may be evaluated in this article, or claim that may be made by its manufacturer, is not guaranteed or endorsed by the publisher.
Athar, A. E., and Osama, S. F. (2018). Quality Enhancement of Infrared Images Using Dynamic Fuzzy Histogram Equalization and High Pass Adaptation in DWT. Optik 160, 146–158. doi:10.1016/j.ijleo.2017.12.056
Bao-Zhu, T., Shan-Jun, L., Yan-Bo, Z., Peng, L., and Xiang-Xin, L. (2016). Experimental Study on the Spatial and Temporal Evolution of Infrared Radiation during Rockburst in Granite Roadways. Geotechnics 37, 711–718. doi:10.16285/j.rsm.2016.03.013
Barra, I., Khiari, L., Haefele, S. M., Sakrabani, R., and Kebede, F. (2021). Optimizing Setup of Scan Number in FTIR Spectroscopy Using the Moment Distance index and PLS Regression: Application to Soil Spectroscopy. Sci. Rep. 11, 13358. doi:10.1038/s41598-021-92858-w
Da-Jun, Z., Shu-Lei, Z., Yan, Z., and Mei-Yan, W. (2019). Experimental Study on Damage Characteristics of Granite under Ultrasonic Vibration Load Based on Infrared Thermography. Environ. Earth Sci. 78, 419. doi:10.1007/s12665-019-8450-6
Enders, A. A., North, N. M., Fensore, C. M., Velez-Alvarez, J., and Allen, H. C. (2021). Functional Group Identification for FTIR Spectra Using Image-Based Machine Learning Models. Anal. Chem. 93, 9711–9718. doi:10.1021/acs.analchem.1c00867
Farhadian, H. (2021). A New Empirical Chart for Rockburst Analysis in Tunnelling: Tunnel Rockburst Classification (TRC). Int. J. Mining Sci. Tech. 31, 603–610. doi:10.1016/j.ijmst.2021.03.010
Fu-Run, H., Shun-Xi, Y., Xiao-Lei, W., Peng-Cheng, J., and Si-Bo, Z. (2021). Infrared Radiation Characteristics of Gneisses under Uniaxial Compression. J. Mining Rock Control. Eng. 3, 96–103. doi:10.13532/j.jmsce.cn10-1638/td.20200730.001
Guang-Liang, F., Xia-Ting, F., Bing-Rui, C., and Ya-Xun, X. (2015). Microseismic Sequences Associated with Rockbursts in the Tunnels of the Jinping II Hydropower Station. Int. J. Rock Mech. Min. Sci. 80, 89–100. doi:10.1016/j.ijrmms.2015.06.011
Guang-Liang, F., Xia-Ting, F., Bing-Rui, C., Ya-Xun, X., and Yang, Y. (2015). A Microseismic Method for Dynamic Warning of Rockburst Development Processes in Tunnels. Rock Mech. Rock Eng. 48, 2061–2076. doi:10.1007/s00603-014-0689-3
Guang-Liang, F., Xia-Ting, F., Bing-Rui, C., Ya-Xun, X., and Zhou-Neng, Z. (2019). Effects of Structural Planes on the Microseismicity Associated with Rockburst Development Processes in Deep Tunnels of the Jinping-II Hydropower Station, China. Tunn. Undergr. Sp. Tech. 84, 273–280. doi:10.1016/j.tust.2018.11.008
Guang-Liang, F., Xia-Ting, F., Ya-Xun, X., Zhi-Bin, Y., Lei, H., Wen-Jing, N., et al. (2019). Characteristic Microseismicity during the Development Process of Intermittent Rockburst in a Deep Railway Tunnel. Int. J. Rock Mech. Mining Sci. 124, 104135. doi:10.1016/j.ijrmms.2019.104135
Guang-Liang, F., Xia-Ting, F., Bing-Rui, C., Ya-Xun, X., Guo-Feng, L., Wei, Z., et al. (2020). Characteristics of Microseismicity during Breakthrough in Deep Tunnels: Case Study of Jinping-II Hydropower Station in China. Int. J. Geomech. 20 (2), 04019163. doi:10.1061/(asce)gm.1943-5622.0001574
Guang-Liang, F., Bing-Rui, C., Quan, J., Ya-xun, X., Wen-jing, N., and Peng-xiang, L. (2021). Excavation-induced Microseismicity and Rockburst Occurrence: Similarities and Differences between Deep Parallel Tunnels with Alternating Soft-Hard Strata. J. Cent. South Univ. 28, 582–594. doi:10.1007/s11771-021-4623-z
Lei, X., Feng-Qiang, G., and Luo, S. (2021). Effects of Pre-existing Single Crack Angle on Mechanical Behaviors and Energy Storage Characteristics of Red sandstone under Uniaxial Compression. Theor. Appl. Fracture Mech. 113, 102933. doi:10.1016/j.tafmec.2021.102933
Li-Qiang, M., Yao, Z., Ke-Wang, C., and Zhong-Wei, W. (2019). An Experimental Study on Infrared Radiation Characteristics of sandstone Samples under Uniaxial Loading. Rock Mech. Rock Eng. 52, 3493–3500. doi:10.1007/s00603-018-1688-6
Li-Xin, W., and Jin-Zhuang, W. (1998). Infrared Radiation Features of Coal and Rocks under Loading. Int. J. Rock Mech. Mining Sci. 93, 144–153. doi:10.1016/s0148-9062(98)00007-2
Meng-Zhe, H., Yuan-You, X., Xi-Qi, L., Man-Qing, L., Zhi-De, W., and Wen-Hua, Z. (2020). Evolution Characteristics of Temperature fields of Rockburst Samples under Different Stress Gradients. Infrared Phys. Tech. 109, 103425. doi:10.1016/j.infrared.2020.103425
Peng, L., and Mei-Feng, C. (2021). Energy Evolution Mechanism and Failure Criteria of Jointed Surrounding Rock under Uniaxial Compression. J. Cent. South Univ. 28, 1857–1874. doi:10.1007/s11771-021-4735-5
Qing-Qing, F., Mehmet, C., and Ai-Ping, W. (2019). An Improved Algorithm Based on CLAHE for Ultrasonic Well Logging Image Enhancement. Cluster Comput. 22, 12609–12618. doi:10.1007/s10586-017-1692-8
Shan, Y., Zhong-Hui, L., Da-Zhao, S., Xue-Qiu, H., Li-Ming, Q., Quan, L., et al. (2021). Experimental Study on the Infrared Precursor Characteristics of Gas-Bearing Coal Failure under Loading. Int. J. Mining Sci. Tech. 31, 901–912. doi:10.1016/j.ijmst.2021.07.003
Vaccari, D. A., and Strigul, N. (2011). Extrapolating Phosphorus Production to Estimate Resource Reserves. Chemosphere 84, 792–797. doi:10.1016/j.chemosphere.2011.01.052
Xian-Zhen, W., Xiang, G., Xiang-Xin, L., and Kui, Z. (2015). Abnormality of Infrared Temperature Mutation in the Process of Saturated Siltstone Failure. J. China Coal Soc. 40, 328–336. doi:10.13225/j.cnki.jccs.2015.0885
Yan-Bo, Z., Wen-Rui, W., Xu-Long, Y., Peng, L., Bao-Zhu, T., Yan-Li, H., et al. (2020). Experimental Study on Acoustic Emission, Infrared Characteristics and Damage Evolution of Granite under Uniaxial Compression. Geotechnics 41, 139–146. doi:10.16285/j.rsm.2019.0305
Zaghloul, R. I., and Hiary, H. (2021). A Fast Single Image Fog Removal Method Using Geometric Mean Histogram Equalization. Int. J. Image Grap. 21, 2150001. doi:10.1142/S0219467821500017
Zhang, H., Lan, Z., Li, X., and Huang, X. (2021). The Sedimentary Facies and Evolution Characteristics of the Middle and Deep Strata in the Nanpu No. 3 Structural Area. Front. Earth Sci. 9, 1–13. doi:10.3389/feart.2021.703070
Keywords: phosphate rock, loading rate, failure process, mechanical properties, infrared radiation
Citation: Gao C, Lin M, Lu Y, Zhang D, Feng G and Liang X (2022) Characteristics of Infrared Radiation in the Failure of Phosphate Rock at Different Loading Rates. Front. Earth Sci. 9:812661. doi: 10.3389/feart.2021.812661
Received: 10 November 2021; Accepted: 20 December 2021;
Published: 28 January 2022.
Edited by:
Faming Huang, Nanchang University, ChinaReviewed by:
Yingchun Li, Dalian University of Technology, ChinaCopyright © 2022 Gao, Lin, Lu, Zhang, Feng and Liang. This is an open-access article distributed under the terms of the Creative Commons Attribution License (CC BY). The use, distribution or reproduction in other forums is permitted, provided the original author(s) and the copyright owner(s) are credited and that the original publication in this journal is cited, in accordance with accepted academic practice. No use, distribution or reproduction is permitted which does not comply with these terms.
*Correspondence: Manqing Lin, bWFucWluZ19saW5AZm94bWFpbC5jb20=; Guangliang Feng, Z2xmZW5nQHdocnNtLmFjLmNu
Disclaimer: All claims expressed in this article are solely those of the authors and do not necessarily represent those of their affiliated organizations, or those of the publisher, the editors and the reviewers. Any product that may be evaluated in this article or claim that may be made by its manufacturer is not guaranteed or endorsed by the publisher.
Research integrity at Frontiers
Learn more about the work of our research integrity team to safeguard the quality of each article we publish.