- 1Key Laboratory of High-Speed Railway Engineering, MOE/School of Civil Engineering, Southwest Jiaotong University, Chengdu, China
- 2Guangdong Dapeng LNG Company Ltd, Shenzhen, China
- 3School of Computer Science and Engineering, University of Electronic Science and Technology of China, Chengdu, China
- 4Analysis and Test Center of Sichuan Province, Chengdu, China
Pipelines are important methods of oil and gas transportation and are fundamental to many country’s economies. Pipeline safety is a critical issue; over 96% of pipeline accidents due to ground movement are caused by slope hazards and these can lead to serious personnel and property losses. Therefore, effective pipeline slope hazard monitoring and early warning is crucial, but there are many limitations to existing measures. The recent advance in remote sensing technologies enables the collection of slope hazards information that maps the spatial distribution of landslide. But this approach cannot provide real-time monitoring and early warning as there is a time lag due to image processing. Also, pipelines are considered separately from the slope hazard, with only slope event occurrence assessed rather than quantification of the impact of the hazard on the pipeline. Here, we report on a whole process risk management system for the pipeline slope hazard, incorporating monitoring and early warning of pipeline slope hazards. Three sites at risk of slope hazard on the Guangdong Dapeng Liquefied Natural Gas (LNG) Company pipeline in Guandong, South China - Zhangmutou, Huoshaogang and Dapeng New District - were selected for research and implementation of the whole process risk management, monitoring and early warning system. The system is shown to operate well and, overall, we found that the three sites are relatively stable at present. This research provides widely applicable guidance for the prevention, control, and early warning of pipeline slope hazards.
1 Introduction
As important methods of oil and gas transportation, oil and gas pipelines are fundamental to the economy of many countries, and pipeline safety is a critical issue. The total length of global oil and gas pipelines is expected to increase from 1.89 million km in 2020 to 2.03 million km in 2024 (GlobalData, 2020). As of the end of 2020, there were 144,000 km of long-distance oil and gas pipelines in China, with many under planning and construction (Gao et al., 2021). Long-distance transportation pipelines inevitably traverse complex geological areas (Hall et al., 2003) and face many natural hazards (Zhao et al., 2006). The EGIG report on failure data (EGIG, 2020) showed that 96.55% of pipeline accidents due to ground movement in 2010–2019 were caused by slope hazards, and these can lead to serious personnel and property losses (Honegger et al., 2010; Liu et al., 2010; Zheng et al., 2012). For example, in July 2016, a landslide along the Sichuan-East Gas Pipeline, China, caused two deaths, nine injuries, direct economic losses of nearly 30 million yuan and indirect economic losses of over 23 million yuan (Zhou, 2018). In March 2019, a landslide induced by heavy rainfall caused a natural gas pipeline in Iran to rupture and explode, interrupting the gas supply to over 12,000 users (Vasseghi et al., 2021). Prevention and control of pipeline slope hazards is needed to reduce the losses associated with pipeline slope accidents, and this requires effective monitoring and early warning. Two main approaches to slope hazard monitoring are remote sensing and ground monitoring.
Improvements in the technology for remote sensing of slope hazards means that information on the spatial distribution of landslide kinematics can be obtained rapidly (Delacourt et al., 2007; Wasowski and Bovenga, 2014). Optical remote sensing methods have been successfully used in semi-autonomous mapping of landslide morphometrics (Martha et al., 2010; Lahousse et al., 2011), but interpretation efficiency is low. With increasing launches of radar satellites and improvements in processing technology, Interferometric Synthetic Aperture Radar (InSAR) has also been used in landslide monitoring (Strozzi et al., 2005; Carla et al., 2019; Zhang et al., 2020). However, vegetation coverage, atmospheric effects and deformation gradients all complicate interpretation of the surface deformation signal so that landslide identification is not sufficiently accurate for early warning (Li et al., 2021). In recent years, remote sensing based on uncrewed aerial vehicles (UAVs) has been increasingly used to obtain spatially distributed data for landslide monitoring (Marek et al., 2015; Turner et al., 2015; Balek and Blahůt, 2016; Peppa et al., 2017; Peternel et al., 2017; Rossi et al., 2018), and hazard mapping, monitoring and analysis (Giordan et al., 2018). However, remote sensing approaches are based on comparative analysis of multiple phases of images, and this processing takes time, so they cannot achieve real-time monitoring and early warning.
Ground monitoring broadly covers three aspects, rainfall, ground displacement and soil hydrological properties (Luo et al., 2008; Yin et al., 2010; Bittelli et al., 2012). Data obtained from multiple monitoring instruments can be combined to assess the risk level of landslides (Macciotta et al., 2015) and establish warning standards (Yin et al., 2010). However, hazard locations need to be identified in advance of installing the monitoring/warning network; the sudden and destructive nature of the hazard means that installation and operation of instruments is difficult (Vaziri et al., 2010). Also, there is also a certain amount of physical contact with the monitored object, which may influence the results.
In recent years, studies have applied the developments in remote sensing and ground monitoring technology to pipeline geological hazard monitoring and early warning (Leynes et al., 2005; Li et al., 2009; Marinos et al., 2019; Yan et al., 2021). Long-term monitoring allows pipeline geological hazards to be effectively identified and mitigated to ensure safe operation of the pipeline (Vasconez et al., 2010). The safety of pipelines under the action of landslides can be evaluated using strength theory based on monitoring surface displacement and strain of the pipeline slope (Feng and Huang, 2009; Liu et al., 2010; Marinos et al., 2019). To deal with the particularity and complexity of pipeline landslides, Yan et al. (2019) developed a multi-parameter comprehensive monitoring system that could be applied to pipeline evaluation using a mechanical model of failure probability (Alvarado-Franco et al., 2017). However, most monitoring approaches separate the pipeline from the slope hazard and only assess hazard occurrence; the impact of the hazard on the pipeline, and the vulnerability of the pipeline, needs further research.
In this study, we develop a procedure for whole process risk management, monitoring and early warning to prevent and control pipeline slope hazards. The whole process of slope hazards: formation process, evolution process, and disaster process. First, InSAR, UAV and ground survey are used to divide the pipeline into different hazard risk areas/sections. Then, monitoring and early warning measures are implemented for the risky areas – those with high hazard probability and high potential for pipeline damage. The real-time monitoring data is used to numerically simulate pipeline slope hazards, quantitatively predict the hazards, and formulate rapid prevention and control measures. The procedure developed in this research provides widely applicable guidance for the prevention, control, and early warning of pipeline slope hazards.
2 Study Area
2.1 Introduction to Dapeng Pipeline
The main gas pipeline of Guangdong Dapeng LNG Co., Ltd. is c. 442.35 km in length, with a design pressure is 9.2 MPa, and includes one main line, three branch lines and ten user dedicated lines. As the pipeline construction schedule was restricted by the government’s land use plan, the dangers of natural and artificial geological hazards and water damage during the pipeline operation period were not fully documented. Sections of the pipeline traverse water networks, around 190 km of pipeline pass through mountains, with steep slopes and high landslide potential, and the nearby coastline is prone to typhoon that generate heavy rainfall. Risk zoning of the pipeline route (Figure 1) identifies sections of high, medium, and low risk. We selected three sites representing typical pipeline unstable slope hazards in high-risk sites for our monitoring and early warning research: Zhangmutou, Dongguan; Huoshaogang landfill in Panyu; and Shenzhen Dapeng New District.
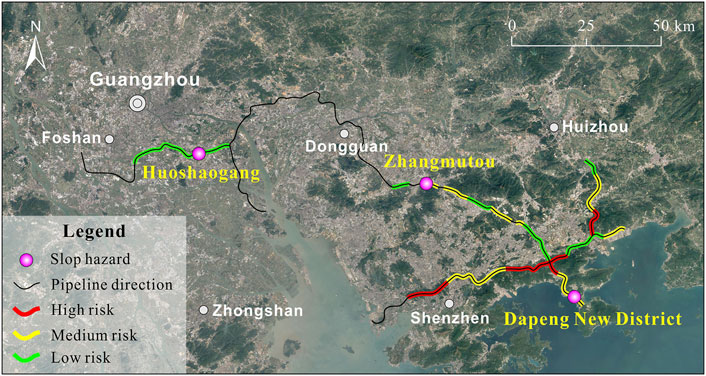
FIGURE 1. Geological hazard risk zoning map of the Dapeng Pipeline, Guangdong, China. The main hazards relate to the mountainous setting of part of the pipeline, combined with the effects of heavy rainfall and typhoons.
2.2 Characteristics of Pipeline Slope Hazard Monitoring and Early Warning Study Sites
The first monitoring site is at Zhangmutou in Huangjiang Town, in the south of Dongguan City (22°54′5.4″ N, 114°2′9″ E). Surface stratum is dominated by silty clay or gravel clay, and the sub-surface comprises strongly weathered granite or shale. Zhangmutou is a forest site with low mountain and hill topography that is relatively prone to landslides. The landslides are generally small and medium-sized, and mainly occur in the rainy season, from April to October. Lithology exposed in the pipeline trench comprises heavily weathered and fragmented quartz sandstone and the surface of the slope is strongly or completely weathered. In the trench, the fully weathered layer is about 0.5–1.0 m thick, with an unknown thickness of the strongly weathered layer below. The fragmented lithology in this section is susceptible to formation of shallow landslides, especially within the fully weathered layer, which endangers the safety of the pipeline.
The second monitoring site is at Huoshaogang landfill, Guangzhou (22°59′8″ N, 113°21′46″ E). The topography of the area comprises plains and hills, with a few low mountains, and surface stratum mainly comprises silty soil or clay. The landfill site is now full, with accumulation of waste extending to the upper hillside; a retaining wall has been constructed and the pipeline is locally less than 10 m from the toe of the slope. On-site investigations show the pipeline was constructed before the storage yard, and the complicated hydrogeological conditions of the accumulated waste have led to drainage of water at the foot of the slope to form a swampy depression. The soil in the pipeline trench is plastic to soft plastic. The existing protection and reinforcement work, which include engineering measures such as stacking forms and retaining walls, are not sufficient to prevent seepage of surface water into the spoil yard. If the waste heap deformed, it would seriously threaten pipeline safety.
The third monitoring site is in Dapeng New District in Shenzhen, Guangdon (22°34′10″ N, 114°28′35″ E). The regional topography comprises low mountains and hills, with stratum of strongly and moderately weathered granite, conglomerate, and gravel-bearing sandstone. The surface is covered by gravelly soil, with silty clay and gravel in valley bottoms. The pipeline is laid along a shoulder of flat land halfway up the mountainside. The surrounding terrain is steep, with highly weathered rock formations and boulders outcropping locally on the surface. Excavation during pipeline construction has affected slope stability to some extent, but the steep slope is in any case prone to landsliding with heavy rain. The pipeline is about 5 m from the toe of the slope, which has low retaining walls, and the pipeline is within the range of the landslide hazard area, which threatens its safe operation.
3 Methodology
3.1 Refined Whole Process Hierarchical Management System for the Pipeline Slope Hazard
The procedure we developed for whole process risk management, monitoring and early warning of pipeline slope hazards, which incorporates pre-hazard risk assessment-hazard monitoring and early warning-real-time calculation of hazard risk, is in the form of a hierarchical management system (Figure 2). The whole process of management we propose includes risk assessment before hazards, monitoring and early warning when hazards are about to occur, and pre-judgment of danger for downstream risks after hazards occur. Preliminary hazard risk assessment, using InSAR and UAV technology to facilitate multi-scale assessment, quantitatively assesses hazard risk and severity at three levels (areas, sections, and single points along the pipeline). Based on the hazard risk assessment, monitoring and early warning is established for areas, sections and points deemed high risk, comprising real-time monitoring of the status and trend of pipeline hazards. Numerical simulation is used to analyze the real-time monitoring data and predict forthcoming hazards, which allows emergency plans to be made.
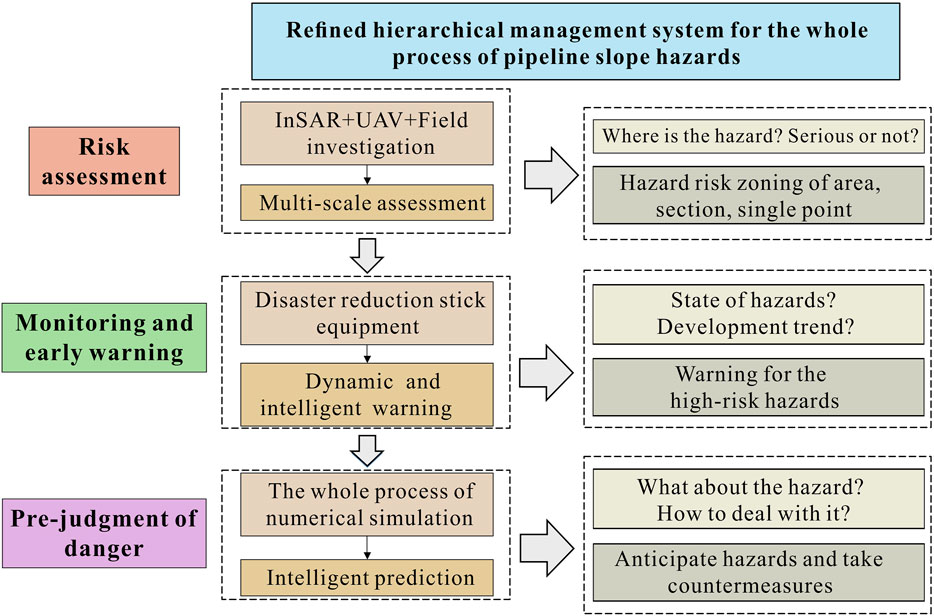
FIGURE 2. Flow diagram of the hierarchical whole process risk management, monitoring and early warning system developed for the pipeline slope hazard.
3.2 Monitoring and Early Warning
To analyze the deformation trend of the unstable slope and judge the stability and danger of the pipeline project’s operating state we needed to monitor the driving factors of the pipeline slope hazards in the study area. We identified the key monitoring parameters as: 1) rainfall conditions, specifically, hourly, and daily totals; 2) pore water pressure in the shallow surface soil; 3) angular displacement and tilting deformation of unstable slopes; 4) horizontal displacement of the unstable slope to obtain cumulative deformation and the deformation rate. We used our self-developed pipeline slope hazard monitoring stick equipment system (Yan et al., 2019) to measure these parameters. The system includes multiple sensors and a network data platform so that sensor parameters can be directly uploaded to the network system, and data can be directly observed and retrieved through the web client (Figure 3). The stick equipment was installed at the three pipeline monitoring sites in January 2020. The system automatically collects monitoring data and transmits it to the server in real time to allow background analysis of the real-time deformation of unstable slopes. The inherent data collection frequency of the monitoring equipment is once every 5 min, but it can be adjusted as needed. At the study sites, data collection frequency was varied according to conditions: 1) under normal climatic conditions and when the slope is stable, data is collected every hour; 2) during floods, rainy season, forecast period, and control project construction period monitoring frequency is increased to every 5, 10, 15 or 30 min, according to needs.
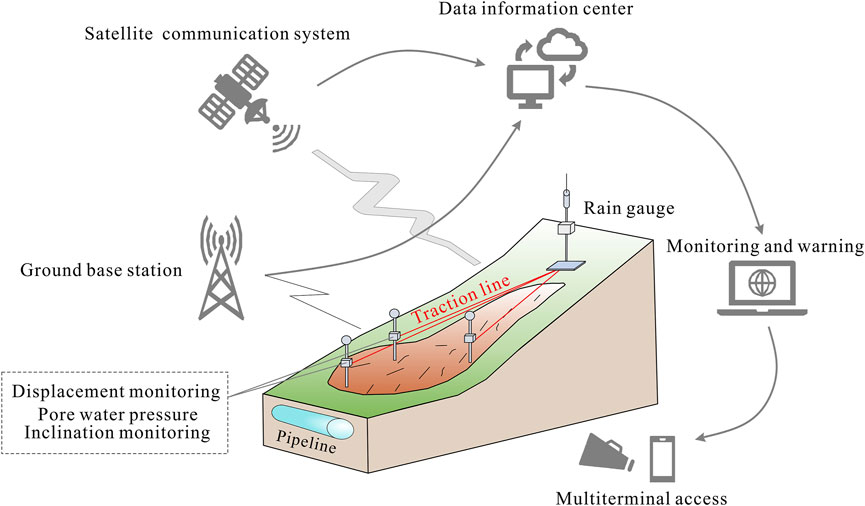
FIGURE 3. Schematic diagram of the pipeline slope hazard early warning system that allows remote observation of field variables.
The early warning framework is based on likelihood of slope hazard occurrence (Figure 4), with four warning levels (Levels I–IV). When rainfall reaches the warning rainfall threshold, the warning level is determined with reference to changes in parameters such as surface displacement, deep tilt and pore water pressure. Level I (Attention level) is the initial deformation stage where the possibility of damage within a year is unlikely. Level II (Warning level) is where uniform deformation is detected and the is probability of damage in a few months to a year is relatively high. Level III (Alert level) is in the initial acceleration and deformation stage, with certain macro-precursor characteristics, and the probability of damage in a few days or weeks is high. Level IV (Alarm level) is in the critical deformation stage, where short-term pre-sliding signs are marked, and the probability of damage in a few hours or weeks is very high.
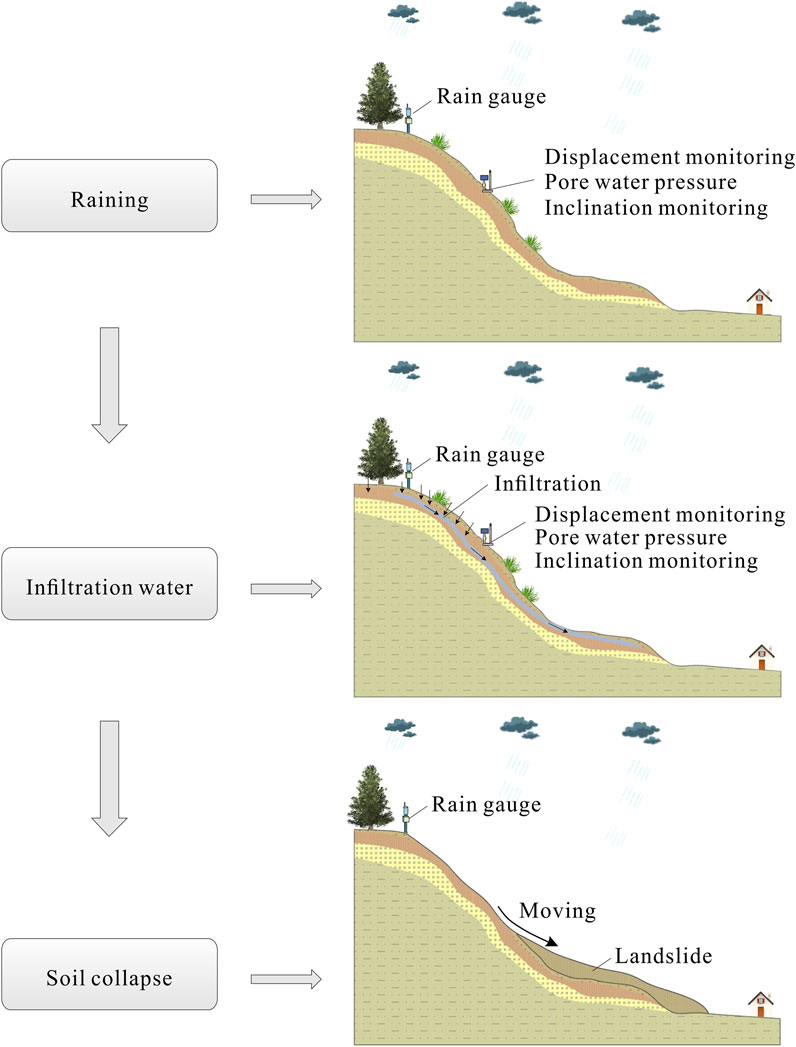
FIGURE 4. Framework of the early warning method for pipeline slope hazard assessment used in the whole process system, involving monitoring of surface displacement and inclination and hydrological characteristics.
4 Results and Analysis
4.1 Construction of Monitoring and Early Warning Systems at the Study Sites
The monitoring set-up at each site involved a primary station and three substations. The primary station was positioned on the slope above the pipeline, and the substations below the pipeline. The equipment configurations at Zhangmutou, Huoshaogang and Dapeng New District are shown in Figures 5–7, respectively. According to the pipeline design specifications, all the Dapeng LNG pipelines are designed to be buried at a depth of 1.2 m from the top of the pipeline to the earth’s surface. Therefore, the buried depth of the substation we designed in this study is 1.5 m, which can effectively monitor the displacement and inclination of the soil around the pipeline. The distance between the primary station and the substations varied at each site, depending on ground conditions, etc. At.
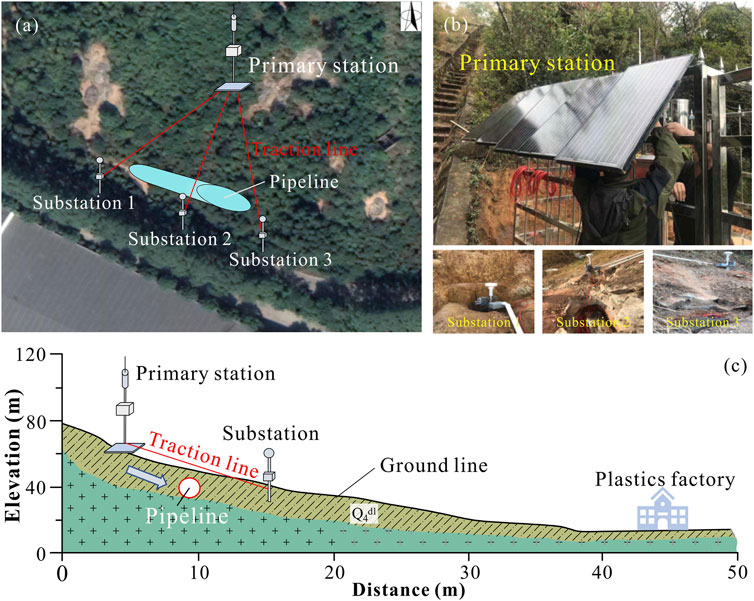
FIGURE 5. Layout of slope hazard monitoring equipment at Zhangmutou. (A) Aerial view of the monitoring configuration; (B) Detail of monitoring set-up at each station; (C) Elevation-distance plot showing location of the pipeline and monitoring equipment.
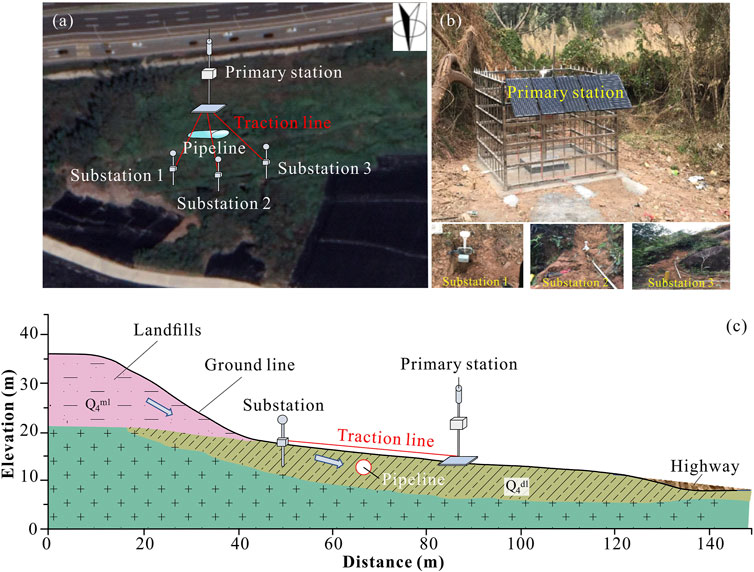
FIGURE 6. Layout of slope hazard monitoring equipment at Huoshaogang. (A) Aerial view of the monitoring configuration; (B) Detail of monitoring set-up at each station; (C) Elevation-distance plot showing location of the pipeline and monitoring equipment.
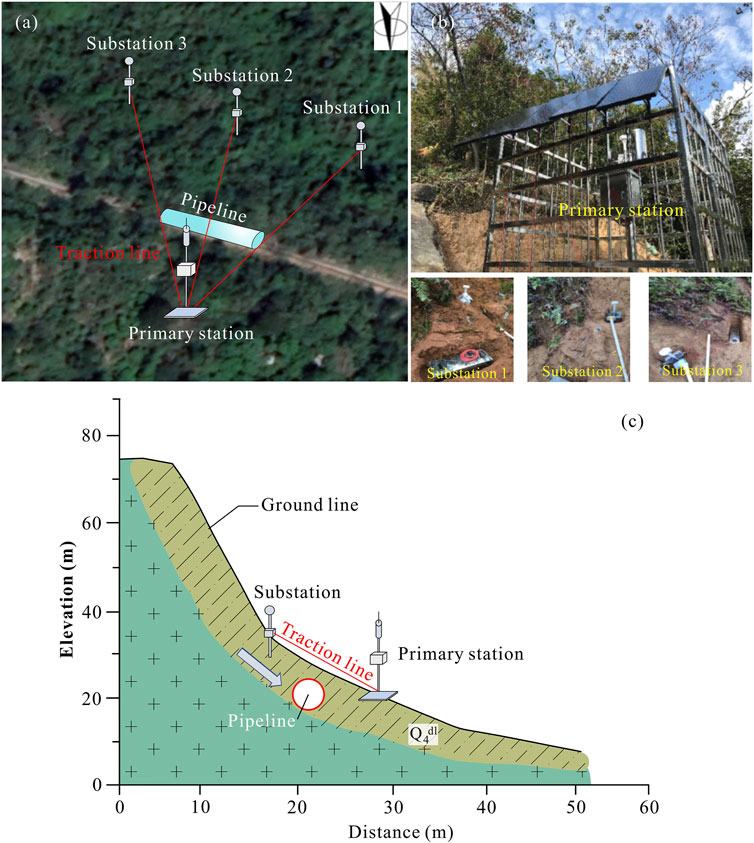
FIGURE 7. Layout of slope hazard monitoring equipment at Dapeng New District. (A) Aerial view of the monitoring configuration; (B) Detail of monitoring set-up at each station; (C) Elevation-distance plot showing location of the pipeline and monitoring equipment.
Zhangmutou, substations 1, 2 and 3 were placed at distances of 13, 10 and 14 m from the primary station. At Huoshaogang landfill, substations 1, 2 and 3 were placed at 10, 8 and 10 m from the primary station. At Dapeng New District, substations 1, 2 and 3 were placed 10, 12 and 11 m from the primary station. According to on-site investigations, we install the primary station on the bedrock outside the landslide body, or drive deep concrete piles, so that the primary station basically does not follow the landslide body movement. The substations are installed on the landslide body.
4.2 Analysis of Monitoring Data
Rainfall is the most important trigger for landslide hazards in the region. Monitoring equipment at each of the three study sites recorded higher annual and rainy season (April 1 to August 31) rainfall totals in 2021 compared with 2020. For example, at Zhangmutou annual rainfall of 1215.5 mm was recorded in 2020, of which 578.7 mm was in the rainy season. In 2021, annual rainfall was 1809.1 mm, of which 1685.6 mm was in the rainy season. We selected the rainy season of 2021 as the test data set for our risk management and early warning procedure due to its higher rainfall total.
4.2.1 Zhangmutou Unstable Slope
Cumulative rainy season rainfall for 2021 was 1685.6 mm (Figure 8). Two rainfall peaks are evident in early June and early August, with daily totals of over 75 mm on June 4 and August 9. The maximum daily total of 84.3 mm was during a heavy rainstorm on August 9. However, hourly rainfall, single-day rainfall and 3-day maximum rainfall days did not reach the warning threshold, so the pipeline was deemed to be in a safe state and no alert was needed.
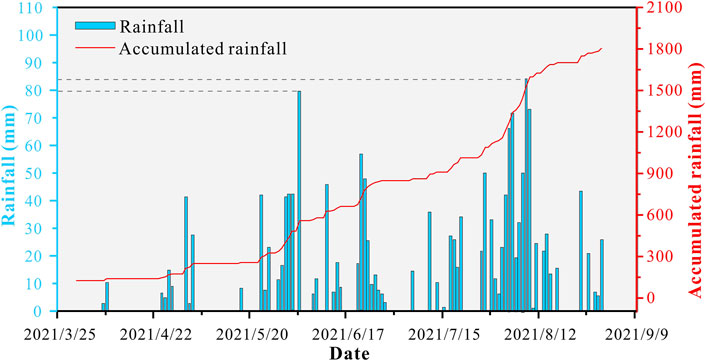
FIGURE 8. Daily and accumulated rainy season rainfall at Zhangmutou site, April 1 to August 31, 2021.
Pore water and displacement monitoring data from the three substations show relatively stability over the 2021 rainy season. Maximum pore water pressure at substation 1 was 101.2 KPa, the maximum pore water pressure difference was 2.5 KPa, the maximum dip angle deviation was 0.08° and the maximum horizontal displacement was 5.3 mm. The trend at substation 2 is similar. Substation 2 recorded maximum pore water pressure of 101.3 KPa, maximum pore water pressure difference of 2.6 KPa, maximum dip angle deviation of 0.097°, and maximum horizontal displacement of 3 mm. However, substation 3 recorded larger fluctuations in pore water pressure and dip angle deviation; maximum pore water pressure was 106.3 KPa, maximum pore water pressure difference was 7.6 KPa, maximum dip angle deviation was 0.179° and maximum horizontal displacement 2.64 mm. Due to the greater variability in monitoring data that is more useful for testing purposes, we focused our pipeline risk analysis on substation 3.
The maximum pore water pressure of 106.3 KPa at substation 3 was recorded on August 10 and the minimum of 98.7 KPa on August 4 (Figure 9A). The rate of water pressure change (0.67 KPa/d) and the pore water pressure values are within the normal tolerable range, so there was no danger to the pipeline. The maximum tilt angle and horizontal deviation at substation 3 were also all within the safe range (Figures 9B,C); maximum tilt of 0.149° in the x direction and 0.179° in the y direction, maximum rate of change 0.014°/d, and maximum horizontal displacement 2.64 mm. Thus, no pipeline warning was triggered.
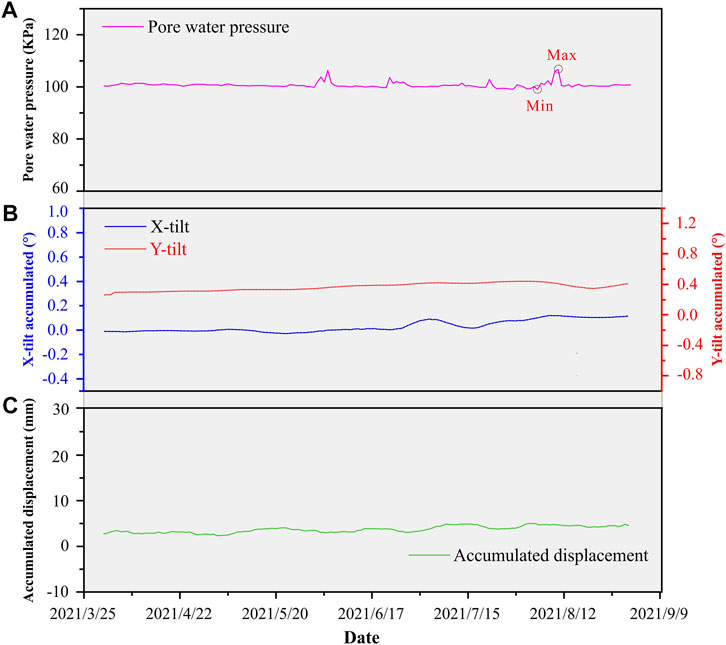
FIGURE 9. Slope monitoring data recorded at Zhangmutou substation 3, April 1 to August 31, 2021. (A) Daily pore water pressure; (B) Accumulated offset in the x and y directions; (C) Accumulated horizontal displacement.
4.2.2 Huoshaogang Landfill Unstable Slope
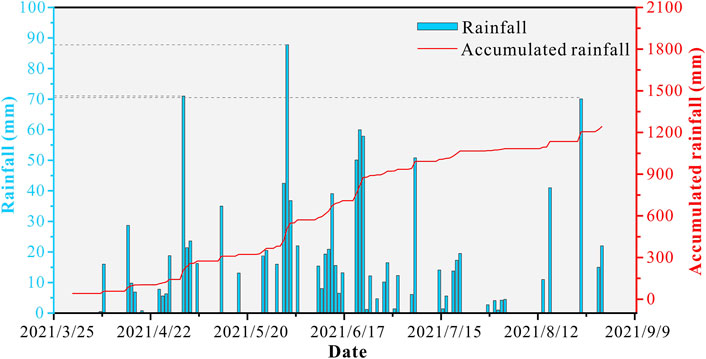
The monitoring data shows that rainy season rainfall at this site in 2021 was relatively evenly distributed (Figure 10), with a cumulative total of 1201.4 mm. The overall trend shows generally low magnitude rainfall across the season, with episodic high magnitude events. Heavy rain, classed as daily rainfall over 70 mm, was recorded on May 2, June 1 and August 25, with a maximum single-day rainfall of 97.8 mm on June 1. None of the rainfall events reached the warning threshold, and the pipeline was considered as within a safe range.
Pore water and displacement monitoring results for Huoshaogang landfill site show greater fluctuations at substation 1 compared to substations 2 and 3. Substation 1 recorded maximum pore water pressure of 107.8 KPa, maximum pore water pressure difference of 8.4 KPa and maximum displacement in the horizontal direction is 8.94 mm. At substation 2, maximum pore water pressure was 101.5 KPa, maximum pore water pressure difference was 2.4 KPa and maximum horizontal displacement was 4.94 mm. Substation 3 recorded maximum pore water pressure of 100.6 KPa, maximum pore water pressure difference of 2.4 KPa and maximum horizontal displacement of 5.2 mm. Due to the larger data fluctuations that are more useful for testing purposes, substation 1 was chosen for further analysis.
Pore water pressure at substation 1 increased significantly with daily rainfall peaks, with maximum water pressure corresponding with the large rainfall event on June 1 (Figure 11A). The minimum pore water pressure of 99.4 KPa was on August 4, with a maximum pore pressure change rate of 0.78 KPa/d. All the pore water pressure data recorded at substation 1 is within the allowable variation range. In terms of ground deformation, the maximum x direction inclination angle deviation was 0.096°, with a maximum rate of change of 0.008°/d; in the y direction, the maximum deviation was 0.368° and the maximum rate of change 0.019°/d (Figure 11B). The maximum horizontal displacement was 8.94 mm (Figure 11C). All displacement indicators are within the safe range, so the pipeline was considered in a safe state.
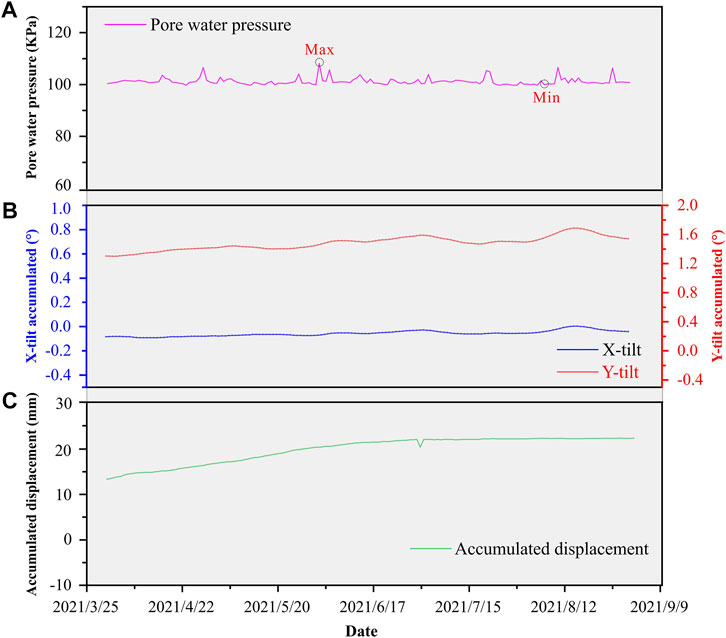
FIGURE 11. Slope monitoring data recorded at Huoshaogang substation 1, April 1 to August 31, 2021. (A) Daily pore water pressure; (B) Accumulated offset in the x and y directions; (C) Accumulated horizontal displacement.
4.2.3 Dapeng New District Unstable Slope
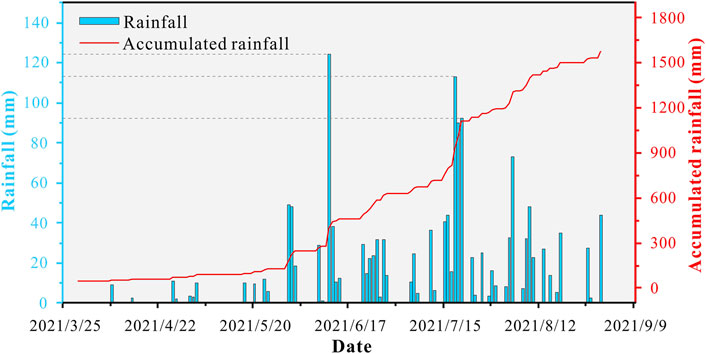
Rainfall monitoring data for Dapeng New District (Figure 12) shows cumulative rainy season rainfall in 2021 of 1528.9 mm, with the highest daily totals concentrated around mid-June and late July. Daily rainfall exceeding 90 mm, classed as a heavy rainstorm, was recorded on June 24 (124.3 mm) and over a 3-day period on July 19–21. None of the short-term heavy rainfall events reached the rainfall threshold. Thus, no danger of landslide hazards was triggered, and the pipeline was considered in a safe state.
Pore water data from the three substations are quite similar, but the displacement results are more varied. Maximum pore water pressure recorded at substation 1 was 100.4 KPa, minimum pore water pressure value was 98 KPa and maximum inclination deviation was 0.754°. At substation 2, maximum and minimum pore water pressure was 100.5 KPa and 98.2 KPa, respectively, with maximum inclination deviation of 0.063°. At substation 3, maximum and minimum pore water pressure was 99.8 KPa and 97.7 KPa, with a maximum inclination angle deviation of 0.085°. The maximum inclination offset monitored by substation 1 is much larger than that of the other two substations. The positions monitored by substation 2 and substation 3 are dangerous, so substation 1 was selected for further analysis.
The maximum pore water pressure of 100.4 KPa at substation 1 was recorded on April 11, and the minimum pore water pressure of 98 KPa was recorded on several days (Figure 13A). The maximum pore water pressure difference was 2.4 KPa and maximum rate of change was 0.15 KPa/d. The pore water pressure data is all within the normal tolerable range, so the pipeline was not considered to be in danger. In terms of ground deformation, the maximum deviation of the inclination angle was 0.771° in the x direction, with a maximum change rate of 0.102°/d, and the maximum deviation in the y direction was 0.754°, with a maximum change rate of 0.108°/d (Figure 13B). The maximum inclination angle deviation and deviation rate are slightly elevated but are both are within the controllable range. The maximum horizontal displacement was only 2.52 mm (Figure 13C). Based on these results, the pipeline in the monitoring area was considered in a safe state.
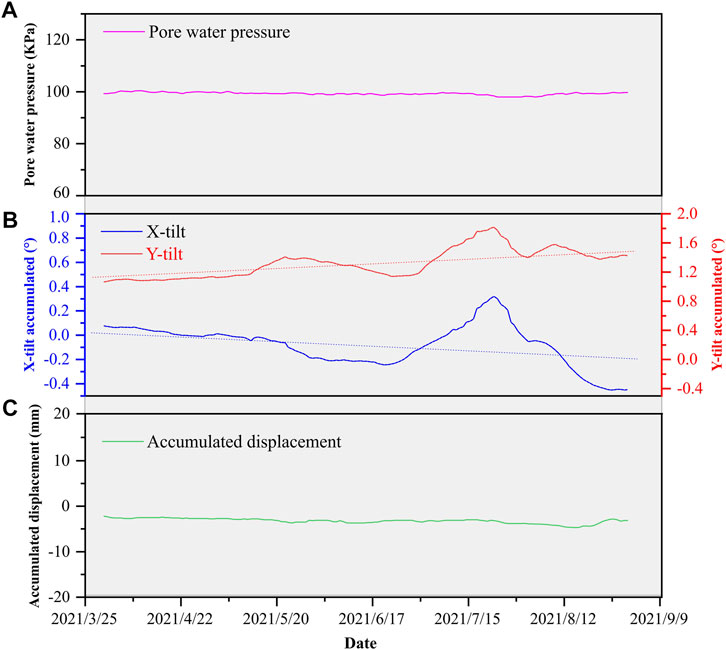
FIGURE 13. Slope monitoring data recorded at Dapeng New District substation 1, April 1 to August 31, 2021. (A) Daily pore water pressure; (B) Accumulated offset in the x and y directions; (C) Accumulated horizontal displacement.
4.3 Trend Estimation and Recommendations
According to the risk assessment, three high-risk hazard points were selected to monitor the formation process, evolution process, and disaster process. For real-time monitoring data, we use a sliding window-based method to detect anomalous points in the rainfall, pore water pressure, displacement, and inclination data to conduct preliminary detection of hazard events. We have established an early warning system driven by both the physical model and the data model. Within the framework of the traditional physical early warning model, the early warning threshold is continuously adjusted and optimized through the multiobjective evolutionary optimization method (Yan et al., 2020). Once the occurrence of hazards is forewarned, numerical simulation scenarios and data mining methods are used to quickly make recommendations for downstream risks.
Since the installation of the three slope hazard monitoring and early warning demonstration sites in January 2020, we have been focusing our research on the development of pipeline slope hazards. The annual rainy season at the sites is concentrated between April and September, and is characterized by abundant heavy rainfall events, but these are scattered throughout the period. The warning thresholds for rainfall intensity (75 mm in 1 h), and hourly, daily and 3-days maximum totals were not reached in our monitoring period. Likewise, the maximum recorded slope deformation rate is relatively small, and no characteristic features such as collapses and landslides have been observed on site, so the early warning threshold was not reached, and no warning was issued. Therefore, it was not possible to enact real-time simulation and pipeline hazard assessment. Our monitoring data shows that the three hazard sites are in a relatively stable state at present. In the future, now that the monitoring system is established, implementation of the proposed pipeline slope hazard risk management, monitoring and early warning system should ensure that there is effective early warning of pipeline danger.
5 Discussion
This study proposes a whole process risk management, monitoring and early warning system for pipeline slope hazards. A real-time simulation/calculation system, based on monitoring data transmitted from on-site equipment, gives timely hazard risk assessment that early warning of hazard risk using a hierarchical approach. Traditional early warning systems for the pipeline slope hazard use a black box model based on the critical rainfall threshold, which has limitations and often lead to false alarms. Also, existing monitoring methods usually separate the pipeline from the slope hazard and can only determine hazard occurrence; they cannot quantify the impact of the hazard on the pipeline. Based on the event process chain of pipeline slope hazards (i.e., rainfall–water infiltration–slope collapse), this study proposes a four-level early warning method that effectively overcomes the shortcomings of traditional monitoring and early warning methods. We use real-time monitoring data to numerically simulate pipeline slope hazards, focusing on areas where hazards are most likely to occur, and the risk of pipeline damage is high. The hazard risk is quantitatively estimated, and rapid prevention and control measures are then formulated. The procedure allows monitoring and early warning measures to be more targeted, reducing the incidence of false alarms, and guides the implementation of prevention and control measures.
Three sites of high slope instability risk along the Guangdong Dapeng LNG Company pipeline were selected for demonstration of the approach, located at Zhangmutou, Huoshaogang and Dapeng New District, and the whole process risk management, monitoring and early warning system of pipeline slope hazards was implemented. The system operated well; overall, the three hazard sites were shown to be in a state of relative stability at present. In future research, we will further develop the rapid numerical simulation of pipeline slope hazards based on real-time monitoring data to predict the danger of pipeline slope hazards and allow timely formulation of emergency plans.
In fact, this research also has some limitations that could be addressed in the future. The substation used in this study only measures within 10 m in space, which is only suitable for shallow slope hazards. Before the construction of oil and gas pipelines, large-scale hazards have been avoided, and only some shallow slope hazards will exist around the pipeline. In view of this situation, we generally install three substations on the landslide body to meet the measurement requirements. After the installation is completed, the sensor transmits data to the early warning system through the ad-hoc network. We use rainfall to judge the triggering effect of external stimulating factors on hazards; pore water pressure is only used to judge whether the soil has an abnormal precursor after rainfall infiltration; and the inclination and displacement can reflect the precursors of landslide sliding. Data transmission relies on 5G and China Beidou satellite transmission technology. The emergence of extreme weather will affect 5G signals, and China Beidou satellite transmission technology will play a good role in emergency communications. In future research, we will study low-cost open-source technologies to create and deploy your sensors. At the same time, we will use more physical models and data models to establish early warning systems to make our early warning methods more accurate.
6 Conclusion
In this study, we develop a procedure for whole process risk management, monitoring and early warning to prevent and control pipeline slope hazards. Three sites at risk of slope hazard on the Guangdong Dapeng Liquefied Natural Gas (LNG) Company pipeline in Guandong, South China - Zhangmutou, Huoshaogang and Dapeng New District - were selected for research and implementation of the whole process risk management, monitoring and early warning system. The three hazard sites were shown to be in a state of relative stability at present. This research provides widely applicable guidance for the prevention, control, and early warning of pipeline slope hazards.
Data Availability Statement
The original contributions presented in the study are included in the article/Supplementary Material, further inquiries can be directed to the corresponding author.
Author Contributions
YY is the first author, is responsible for most of the work and paper writing in this research. GX is the second author and is responsible for the processing and verification of the article data. JZ is the third author and is responsible for the production of the article figures. RW is the fourth author and is responsible for checking the overall logical structure of the article. WH and MY are responsible for the measurement of field data. RW is the seventh author and is responsible for drawing the Instrument layout figures. DG is the corresponding author and is responsible for construction of monitoring and early warning system.
Funding
This study was financially supported by the National Natural Science Foundation of China (No. 42120104002 and No. 41901008), the Fundamental Research Funds for the Project of Science and Technology Department of Sichuan Province (No. 2020YFH0085).
Conflict of Interest
Author WH, MY are employed by Guangdong Dapeng LNG Company Ltd. Author DG is employed by Analysis and Test Center of Sichuan Province.
The remaining authors declare that the research was conducted in the absence of any commercial or financial relationships that could be construed as a potential conflict of interest.
Publisher’s Note
All claims expressed in this article are solely those of the authors and do not necessarily represent those of their affiliated organizations, or those of the publisher, the editors and the reviewers. Any product that may be evaluated in this article, orclaim that may be made by its manufacturer, is not guaranteed or endorsed by the publisher.
References
Alvarado-Franco, J. P., Castro, D., Estrada, N., Caicedo, B., Sánchez-Silva, M., Camacho, L. A., et al. (2017). Quantitative-mechanistic Model for Assessing Landslide Probability and Pipeline Failure Probability Due to Landslides. Eng. Geology. 222, 212–224. doi:10.1016/j.enggeo.2017.04.005
Balek, J., and Blahůt, J. (2016). A Critical Evaluation of the Use of an Inexpensive Camera Mounted on a Recreational Unmanned Aerial Vehicle as a Tool for Landslide Research. Landslides 14 (3), 1217–1224. doi:10.1007/s10346-016-0782-7
Bittelli, M., Valentino, R., Salvatorelli, F., and Rossi Pisa, P. (2012). Monitoring Soil-Water and Displacement Conditions Leading to Landslide Occurrence in Partially Saturated Clays. Geomorphology 173-174, 161–173. doi:10.1016/j.geomorph.2012.06.006
Carlà, T., Intrieri, E., Raspini, F., Bardi, F., Farina, P., Ferretti, A., et al. (2019). Perspectives on the Prediction of Catastrophic Slope Failures from Satellite InSAR. Sci. Rep. 9 (1), 14137. doi:10.1038/s41598-019-50792-y
Delacourt, C., Allemand, P., Berthier, E., Raucoules, D., Casson, B., Grandjean, P., et al. (2007). Remote-sensing Techniques for Analysing Landslide Kinematics: a Review. Bull. de la Société Géologique de France 178 (2), 89–100. doi:10.2113/gssgfbull.178.2.89
EGIG (2020). “11th Report of the European Gas Pipeline Incident Data Group, 1970-2019,”. Available at: https://www.egig.eu/.
Feng, W., and Huang, J. Z. (2009). Influence of Landslide Deformation on Safety of Gas Pipeline. Chin. J. Geol. Hazard. Control. 20 (1), 51–54. (In Chinese).
Gao, P., Gao, Z. Y., and Liu, G. R. (2021). New Progress in China’s Oil and Gas Pipeline Construction in 2020. Int. Petrol. Econ. 29, 53–60.
Giordan, D., Hayakawa, Y., Nex, F., Remondino, F., and Tarolli, P. (2018). Review Article: the Use of Remotely Piloted Aircraft Systems (RPASs) for Natural Hazards Monitoring and Management. Nat. Hazards Earth Syst. Sci. 18 (4), 1079–1096. doi:10.5194/nhess-18-1079-2018
GlobalData (2020). Global Length and Capital Expenditure Outlook for Oil and Gas Pipelines, 2020−2024: Asia Leads Global Pipeline Growth. Available at: https://store.globaldata.com/report/global-length-and-capital-expenditure-outlook-for-oil-and-gas-pipelines-2020%e2%88%922024-asia-leads-global-pipeline-growth/
Hall, W., Nyman, D., Johnson, E., and Norton, J. (2003). “Performance of the Trans-Alaska Pipeline in the November 3, 2002 Denali Fault Earthquake,” in Sixth U.S. Conference and Workshop on Lifeline Earthquake Engineering (TCLEE) 2003, Long Beach, California, United States, August 10-13, 2003. doi:10.1061/40687(2003)54
Honegger, D. G., Hart, J. D., Phillips, R., Popelar, C., and Gailing, R. W. (2010). Recent PRCI Guidelines for Pipelines Exposed to Landslide and Ground Subsidence Hazards. 8th Int. Pipeline Conf. Vol. 2, 71–80. doi:10.1115/ipc2010-31311
Lahousse, T., Chang, K. T., and Lin, Y. H. (2011). Landslide Mapping with Multi-Scale Object-Based Image Analysis - a Case Study in the Baichi Watershed, Taiwan. Nat. Hazards Earth Syst. Sci. 11 (10), 2715–2726. doi:10.5194/nhess-11-2715-2011
Leynes, R. D., Pioquinto, W. P. C., and Caranto, J. A. (2005). Landslide hazard Assessment and Mitigation Measures in Philippine Geothermal fields. Geothermics 34 (2), 205–217. doi:10.1016/j.geothermics.2004.08.002
Li, C., Huiming, T., Liangqing, W., and Jing, H. (2009). “Hazard Evaluation Method Study on Pipeline of Underground Crossing Landslide Area,” in International Conference on Pipelines and Trenchless Technology (ICPTT) 2009, Shanghai, China, October 18-21, 2009, 1081–1092. doi:10.1061/41073(361)115
Li, G., Hu, B., Li, H., Lu, F., and Maruccio, G. (2021). Early Identifying and Monitoring Landslides in Guizhou Province with InSAR and Optical Remote Sensing. J. Sensors 2021, 1–19. doi:10.1155/2021/6616745
Liu, P. F., Zheng, J. Y., Zhang, B. J., and Shi, P. (2010). Failure Analysis of Natural Gas Buried X65 Steel Pipeline under Deflection Load Using Finite Element Method. Mater. Des. 31 (3), 1384–1391. doi:10.1016/j.matdes.2009.08.045
Luo, X., Wang, F., Zhang, Z., and Che, A. (2008). Establishing a Monitoring Network for an Impoundment-Induced Landslide in Three Gorges Reservoir Area, China. Landslides 6 (1), 27–37. doi:10.1007/s10346-008-0140-5
Macciotta, R., Hendry, M., and Martin, C. D. (2015). Developing an Early Warning System for a Very Slow Landslide Based on Displacement Monitoring. Nat. Hazards 81 (2), 887–907. doi:10.1007/s11069-015-2110-2
Marek, L., Miřijovský, J., and Tuček, P. (2015). Monitoring of the Shallow Landslide Using UAV Photogrammetry and Geodetic Measurements. Eng. Geology. Soc. Territory 2, 113–116. doi:10.1007/978-3-319-09057-3_8
Marinos, V., Stoumpos, G., and Papazachos, C. (2019). Landslide Hazard and Risk Assessment for a Natural Gas Pipeline Project: The Case of the Trans Adriatic Pipeline, Albania Section. Geosciences 9 (2), 61. doi:10.3390/geosciences9020061
Martha, T. R., Kerle, N., Jetten, V., van Westen, C. J., and Kumar, K. V. (2010). Characterising Spectral, Spatial and Morphometric Properties of Landslides for Semi-automatic Detection Using Object-Oriented Methods. Geomorphology 116 (1–2), 24–36. doi:10.1016/j.geomorph.2009.10.004
Peppa, M. V., Mills, J. P., Moore, P., Miller, P. E., and Chambers, J. E. (2017). Brief Communication: Landslide Motion from Cross Correlation of UAV-Derived Morphological Attributes. Nat. Hazards Earth Syst. Sci. 17 (12), 2143–2150. doi:10.5194/nhess-17-2143-2017
Peternel, T., Kumelj, Š., Oštir, K., and Komac, M. (2017). Monitoring the Potoška Planina Landslide (NW Slovenia) Using UAV Photogrammetry and Tachymetric Measurements. Landslides 14 (1), 395–406. doi:10.1007/s10346-016-0759-6
Rossi, G., Tanteri, L., Tofani, V., Vannocci, P., Moretti, S., and Casagli, N. (2018). Multitemporal UAV Surveys for Landslide Mapping and Characterization. Landslides 15 (5), 1045–1052. doi:10.1007/s10346-018-0978-0
Strozzi, T., Farina, P., Corsini, A., Ambrosi, C., Thüring, M., Zilger, J., et al. (2005). Survey and Monitoring of Landslide Displacements by Means of L-Band Satellite SAR Interferometry. Landslides 2 (3), 193–201. doi:10.1007/s10346-005-0003-2
Turner, D., Lucieer, A., and de Jong, S. (2015). Time Series Analysis of Landslide Dynamics Using an Unmanned Aerial Vehicle (UAV). Remote Sensing 7 (2), 1736–1757. doi:10.3390/rs70201736
Vasconez, F., Estrella, M., Velastegui, A., Nunez, J., Ponce, H., and Riofrio, P. (2010). Landslide Hazard Assessment, Monitoring, and Stabilization: Villano Oil Pipeline System, Ecuador. in SPE Annual Technical Conference and Exhibition, Florence, Italy, September 2010. doi:10.2118/135504-ms
Vasseghi, A., Haghshenas, E., Soroushian, A., and Rakhshandeh, M. (2021). Failure Analysis of a Natural Gas Pipeline Subjected to Landslide. Eng. Fail. Anal. 119, 105009. doi:10.1016/j.engfailanal.2020.105009
Vaziri, A., Moore, L., and Ali, H. (2010). Monitoring Systems for Warning Impending Failures in Slopes and Open Pit Mines. Nat. Hazards 55 (2), 501–512. doi:10.1007/s11069-010-9542-5
Wasowski, J., and Bovenga, F. (2014). Investigating Landslides and Unstable Slopes with Satellite Multi Temporal Interferometry: Current Issues and Future Perspectives. Eng. Geology. 174, 103–138. doi:10.1016/j.enggeo.2014.03.003
Yan, Y., Ma, S., Yin, S., Hu, S., Long, Y., Xie, C., et al. (2021). Detection and Numerical Simulation of Potential Hazard in Oil Pipeline Areas Based on UAV Surveys. Front. Earth Sci. 9. doi:10.3389/feart.2021.665478
Yan, Y., Yang, D.-s., Geng, D.-x., Hu, S., Wang, Z.-a., Hu, W., et al. (2019). Disaster Reduction Stick Equipment: A Method for Monitoring and Early Warning of Pipeline-Landslide Hazards. J. Mt. Sci. 16 (12), 2687–2700. doi:10.1007/s11629-019-5613-6
Yan, Y., Zhang, Y., Hu, W., Guo, X.-j., Ma, C., Wang, Z.-a., et al. (2020). A Multiobjective Evolutionary Optimization Method Based Critical Rainfall Thresholds for Debris Flows Initiation. J. Mt. Sci. 17 (8), 1860–1873. doi:10.1007/s11629-019-5812-1
Yin, Y., Wang, H., Gao, Y., and Li, X. (2010). Real-time Monitoring and Early Warning of Landslides at Relocated Wushan Town, the Three Gorges Reservoir, China. Landslides 7 (3), 339–349. doi:10.1007/s10346-010-0220-1
Zhang, Y., Meng, X. M., Dijkstra, T. A., Jordan, C. J., Chen, G., Zeng, R. Q., et al. (2020). Forecasting the Magnitude of Potential Landslides Based on InSAR Techniques. Remote Sensing Environ. 241, 111738. doi:10.1016/j.rse.2020.111738
Zhao, Z. G., Yao, A. L., and Zhao, X. F. (2006). Types of Geologic Disasters for Long Distance Transmission Pipelines as Well as Prevention Control Measures and Prediction Techniques. Pet. Eng. Constr. 32, 7–12. doi:10.3969/j.issn.1001-2206.20
Zheng, J. Y., Zhang, B. J., Liu, P. F., and Wu, L. L. (2012). Failure Analysis and Safety Evaluation of Buried Pipeline Due to Deflection of Landslide Process. Eng. Fail. Anal. 25, 156–168. doi:10.1016/j.engfailanal.2012.05.011
Keywords: pipeline slope hazards, monitoring and early warning, whole process risk, refined hierarchical management system, Guangdong Dapeng LNG
Citation: Yan Y, Xiong G, Zhou J, Wang R, Huang W, Yang M, Wang R and Geng D (2022) A Whole Process Risk Management System for the Monitoring and Early Warning of Slope Hazards Affecting Gas and Oil Pipelines. Front. Earth Sci. 9:812527. doi: 10.3389/feart.2021.812527
Received: 10 November 2021; Accepted: 13 December 2021;
Published: 12 January 2022.
Edited by:
Haijun Qiu, Northwest University, ChinaReviewed by:
Chao Kang, University of Northern British Columbia Canada, CanadaHaowen Xu, Oak Ridge National Laboratory (DOE), United States
Copyright © 2022 Yan, Xiong, Zhou, Wang, Huang, Yang, Wang and Geng. This is an open-access article distributed under the terms of the Creative Commons Attribution License (CC BY). The use, distribution or reproduction in other forums is permitted, provided the original author(s) and the copyright owner(s) are credited and that the original publication in this journal is cited, in accordance with accepted academic practice. No use, distribution or reproduction is permitted which does not comply with these terms.
*Correspondence: Dongxian Geng, Z2VuZzA5MDlAMTI2LmNvbQ==
 Yan Yan
 Guanglin Xiong1