
94% of researchers rate our articles as excellent or good
Learn more about the work of our research integrity team to safeguard the quality of each article we publish.
Find out more
ORIGINAL RESEARCH article
Front. Earth Sci. , 16 February 2022
Sec. Environmental Informatics and Remote Sensing
Volume 9 - 2021 | https://doi.org/10.3389/feart.2021.810964
This article is part of the Research Topic Mine Engineering Geological Disaster Forecasting, Monitoring, and Prevention View all 27 articles
 Chunyan Bao1,2,3,4
 Qi Liu1,2
 Yingjie Xia5*Yi Cui6Zongyong Cao3Yidong Qian3
 Minghao Liu7Chaoqian Mu5Hongliang Wang3
The damage of asphalt concrete pavement (AC pavement) structure caused by reflection crack is an urgent problem in many areas of China, especially in cold regions of China, so it is necessary to study how to reduce the reflective cracking and prevent the AC pavement structures cracking. The acoustic emission (AE) information is fetched in this paper to study the AE characteristics of pavement structures and the crack propagation law inside the system. On the above basis, cracks with crack spacing/layer thickness values of 1.25, 2.5, 3.75, and 5 were prefabricated in the foundation course by the numerical simulation method. The models with different foundation course crack spacing were calculated by Realistic Failure Process Analysis finite element software. The influence of varying crack spacing on the propagation mechanism of reflective cracks in the foundation course structure was studied. The results show that the AC pavement structure has prominent AE characteristics. The faster the cooling rate is, the more serious the damage to the AC pavement surface is. In addition, with the increase of crack spacing/layer thickness value, the stress level between cracks increases continuously. Most of the stress will make the cracks expand toward the foundation course structure, and only a tiny part of stress is used to form reflective cracks. In practical engineering, it is suggested to increase the crack resistance of foundation course materials and preset some small spacing cracks in the large spacing cracks in the foundation course.
In southwestern China, the Qinghai–Tibet Plateau and its surrounding areas are mainly alpine regions with a wide area (Liang et al., 2020; Duan et al., 2021). The asphalt concrete (AC) pavement structure is fatal in cold areas with significant temperature differences between winter and summer and seasonal freeze–thaw alternation. Low-temperature cracks are a significant disease of the pavement structure (Wei et al., 2020; Wei et al., 2021). Relevant studies have pointed out an internal relationship between the acoustic emission (AE) of AC pavement structures and the damage location of pavement structures (Li and Marasteanu, 2011; Wei et al., 2019; Yang et al., 2021b). So far, AE technology has been widely used in concrete materials and concrete bridges, and many AE analyses have been carried out (Nair and Cai, 2010; Behnia et al., 2014; Jiao et al., 2020), as well as the use of AE to study the cracking of mixtures (Li et al., 2006; Behnia et al., 2018; Xu et al., 2018; Yang et al., 2021a). AE was also used to evaluate the related subjects (Hill et al., 2013; Sun et al., 2017; Jiao et al., 2019b; Cai et al., 2021). In recent years, AE detection methods have also been used to characterize AC materials (Jiao et al., 2019a; Qiu et al., 2020). For example, Seo and Kim (2008) applied AE technology to study AC materials' damage and healing characteristics and proved that cumulative AE energy could be a feasible AE parameter to identify fatigue damage and healing in the AC. Hakimzadeh et al. (2017) mainly studied three different asphalt mixtures' internal crack damage characteristics under low temperatures. Hakimzadeh et al. (2017) found that the AE of asphalt mixtures corresponding to three other asphalt binders could be used as a good indicator of low-temperature cracking performance. The research discussed earlier shows that the experience of AE technology in the application of AC materials has been relatively mature and has achieved specific results.
In addition, reflective cracks have long been a severe problem in the process of AC pavement renovation. Reflective cracks will also cause cracks in the AC pavement overlay, affecting the service life of AC pavement (Hu et al., 2010). Qisen and Zheng (1990) applied fracture mechanics to study the reflective cracking of semirigid foundation course in AC pavement and concluded that the shear stress perpendicular to the pavement direction is the main reason for forming reflective cracks. Xie (2018) studied the distribution of cracks on AC pavement overlay pavement surface deflection. When the inclination angle is 45° and the crack spacing increases from 200 to 600 mm, two different forms of cracks will be formed in the cement concrete slab, as shown in Figure 1. It is also found that when the intersection point of cracks is located in a concrete slab, the unevenness of bending and settling of the whole structure becomes more evident with the increase of crack spacing. This phenomenon also reflects that the crack spacing d value affects the overall structural stability (d value is also the S value of this paper) (Xie, 2018).
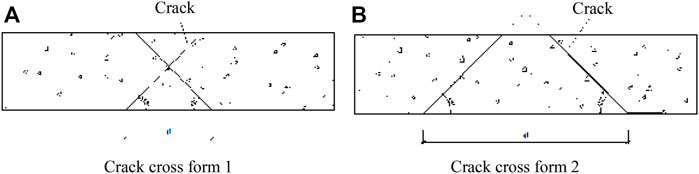
FIGURE 1. Two types of cracks (Xie, 2018). (A) Crack cross form 1 and (B) Crack cross form 2.
Brown et al. (2001), through experiments and the establishment of a theoretical model, grid steel in the appropriate application can improve the crack resistance and rutting resistance of the AC layer. Khodaii et al. (2009) using geosynthetic materials laid on a third of the cover can effectively reduce the probability of reflection cracks, providing a more excellent service life. Kim et al. (1999) carried out experiments on the overlay and found that some modified asphalt mixtures and reinforced asphalt mixtures can effectively prevent crack propagation. Tsai et al. (2010) calibrated the model based on mechanical principles. Through this model, hot mix asphalt can virtually reproduce the growth and severity of reflection cracks in field observation. Bai et al. (2000) used the finite element method to study that the spacing of cracks in layered materials is usually proportional to the thickness of the crack layer. Morris et al. (1982) used the finite element program to analyze the stress value near the crack of the pavement structure after cracking and found that the main reason for reflection crack is the displacement difference of foundation course after cracking. Dave and Buttlar (2010) used finite element software to study the reflective cracks of AC pavement under temperature load.
Zhang and Guan (2001) calculated the temperature field of AC pavement surface under a wide range of cooling and analyzed the influence of different crack widths and cooling rates on temperature stress. Liu et al. (2011) used a three-dimensional finite element model to study the distribution of the stress intensity factor value of foundation course cracks in AC pavement structures in a large temperature difference area. Wang and Zhong (2019) used the extended finite element method to study AC pavement's reflection crack propagation mechanism under combined temperature and mobile traffic loads. Based on ABAQUS finite element software and extended finite element method, Hou et al. (2021) analyzed the propagation process of reflection cracks and proved that properly reducing the elastic modulus of the stress absorbing layer could improve antireflection performance cracks. Wang (2012) believes that eliminating reflective cracks is neither feasible nor economical. It should be considered whether it can delay the expansion of reflective cracks.
In this paper, Realistic Failure Process Analysis (RFPA) will be used for numerical simulation. As for the authenticity of RFPA, Chinese researcher Changxu used RFPA to verify Bai's proposal that elastic modulus of the material in uniform medium and prefabricated crack depth would have an essential impact on crack propagation. In addition, Professor Tang Chunan used RFPA to study the change of stress distribution of equal-spacing cracks with crack spacing/layer thickness (S/T) under axial tensile action on a typical three-layer material model and found that the results are in good agreement with Bai results. At the same time, Tang Shibin used an RFPA temperature plate to verify the correctness of concrete temperature conduction characteristics and concrete temperature crack formation, simulated the pavement cracking problem, and achieved good simulation results. So, it is feasible to use an RFPA temperature plate to study the reflection crack propagation process of AC pavement structure under the action of low temperature.
Nowadays, research on applying AE technology in the overall structure of AC pavements is scarce. This paper uses the numerical simulation method to explore the AE of AC pavement structures. This paper attempts to examine the application of AE detection technology in pavement structure detection, which is realized by the RFPA analysis system. AE characteristics of pavement structure and internal crack propagation law are studied. On this basis, we need to further explore AC pavement reflection cracks. At present, research on reflection cracks mainly focuses on the mechanism of temperature shrinkage cracks. However, there is little research on the influence of crack spacing based on the propagation of reflective cracks. Therefore, this paper studies the effect of different S/T values on the propagation of reflective cracks (S/T represents the ratio of crack spacing to surface thickness). The model with different foundation course crack spacing is calculated using RFPA finite element software to determine whether different foundation course crack spacing influences the overall pavement structure. At the same time, according to the results, some preventive measures are provided to provide corresponding guidance for the prevention and control of AC pavement in the future.
This section uses an RFPA analysis system to study the AE characteristics of pavement structure and the law of crack propagation inside the structure. This basis paves the way for further exploration of AC pavement reflection cracks below. The low-temperature performance of AC pavement mainly depends on the low-temperature performance of the asphalt binder. The low-temperature performance of asphalt binder plays a 90% role in the low-temperature crack resistance of the whole asphalt pavement materials. Road AC pavement needs to be tested all year round of the four seasons, and the properties of asphalt are soft in summer and brittle in winter, which is opposite to the people's expectations. Typically, when the temperature changes from 70 to −40°C, the asphalt material changes from Newtonian liquid to nearly Hookean elastomer. Under the action of low temperature, the behavior of asphalt is close to elastic brittleness. Therefore, the crack of asphalt at low temperature should be mainly studied under the action of a low-temperature environment.
The AC pavement structure is a continuous layered structure. To simulate the AC pavement structure under the actual low-temperature state, the AC pavement structure is simplified as a double-layer model, as seen in Figure 2A. Therefore, this chapter selected the red line section in Figure 2A as the research object, simplifying the AC pavement into a double-layer model, shown in Figure 2B. The model's width is 5,000 mm, and the thickness is 1,200 mm. Furthermore, the thickness of the top layer is 200 mm, and the cell is 40 × 1,000; the bottom layer is 1,000 mm, and the cell number is 200 × 1,000. The model is fixed at the left and right sides and lower and free upper boundary. According to the meteorological data, the low-temperature region is in China (Shen et al., 2011). The cooling in the cold areas is divided into three periods. The cooling rates are reduced by approximately 1, 2, and 4°C per hour, respectively, and the lowest temperature is also below −30°C. Therefore, this paper uses these parameters. We set the top layer temperature from 0 to −40°C, and we lowered the temperature to −40°C in the following three ways: the first cooling condition is temperature reduced by 1°C per step, the second by 2°C per step, and the third by 4°C per step. The initial temperature of the lower layer of the model is 20°C. The mechanical parameters of model materials are shown in Table 1. The variable coefficient represents the unevenness of AC. In the surface layer, the variable coefficient is smaller than that of the foundation course.
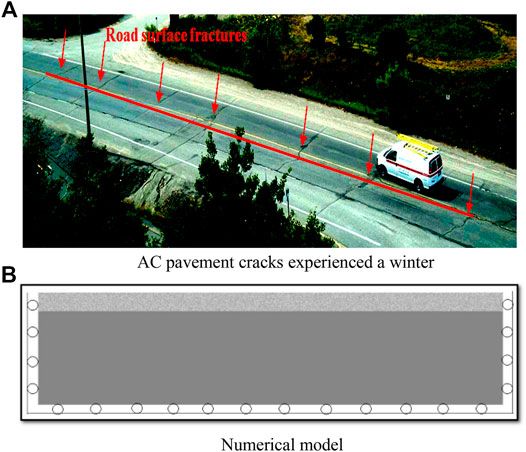
FIGURE 2. Cracks of AC pavement in winter and its numerical model. (A) AC pavement cracks experienced a winter and (B) Numerical model.
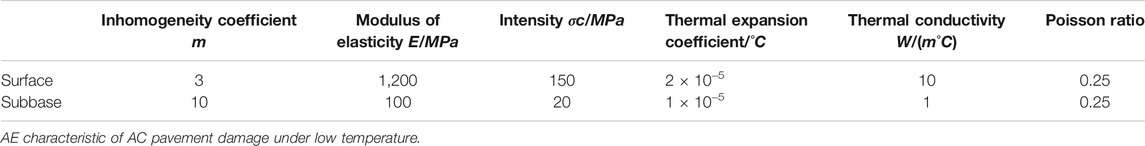
TABLE 1. Material mechanical properties.
Figure 3 shows the relationship between the cooling step–tensile stress change curve and the cooling step–AE number change curve within the structure with the decrease of temperature during the damage and failure of AC pavement structure under three cooling rates. The cooling step−σ−emission number is carried out below. It can be observed that the data can be divided into several distinct stages with specific characteristics under three cooling rates.
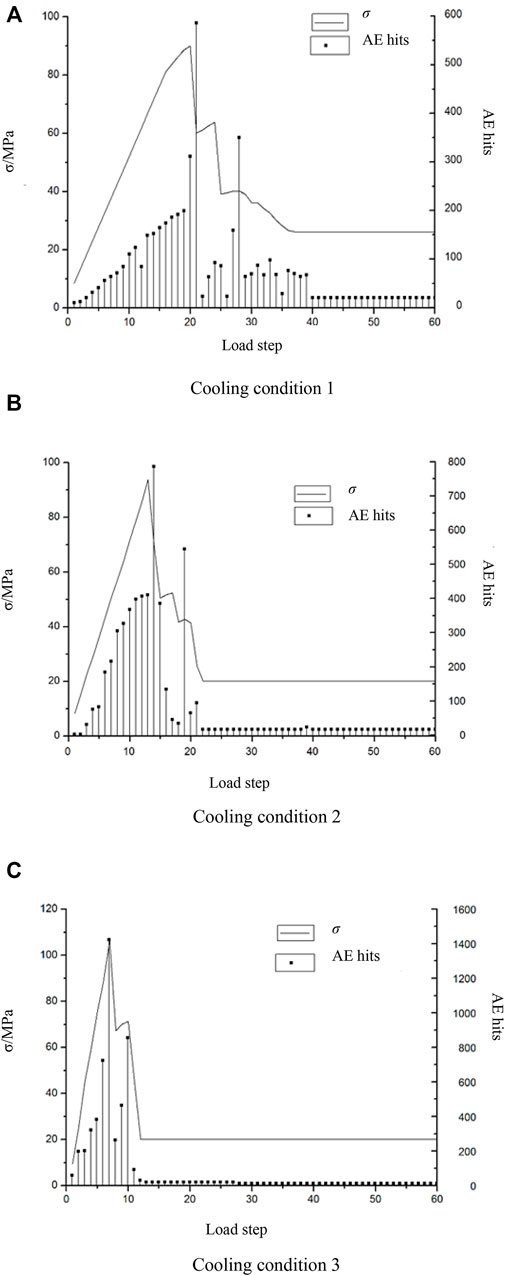
FIGURE 3. Load step–σ–AE curves under three cooling conditions. (A) Cooling condition 1, (B) Cooling condition 2, and (C) Cooling condition 3.
As shown in Figure 3, cooling condition 1 means 1°C per step, cooling condition 2 means 2°C per step, and cooling condition 3 means 4°C per step. The results of numerical experiments show that the micro-crack process of AC pavement can be divided into three stages:
1) Linear deformation stage. In the initial cooling stage, AE occurs in the structure of AC pavement with a decrease in temperature. However, the energy released is less in the early stages of the three load steps. The relationship between the three load steps and σ is linear in the initial stage.
2) The macroscopic failure stage of crack formation, propagation, and penetration. The number of AE events in the AC pavement structure increases sharply when the cooling condition is 1/2/3. When the loading step reaches 20/13/7, the load step–σ curve reaches the maximum value, and the number of AE comes at the peak time. This shows that with the increase of cooling rate, the peak value of AE number and pavement structure damage occur earlier.
3) At the late stage of macroscopic rupture. The AE frequency of the three cooling conditions is different from that of the initial stage. Also, the energy released is much less than that of the initial loading stage. In addition, the number of AE in the AC pavement structure is relatively stable and trimmed after the corresponding load step.
The process of crack and damage of AC pavement structure is a process of brittleness and toughness transformation in the whole process of AE. There is a critical transition temperature for toughness and brittleness. In general, the AC pavement structure has viscoelastic properties at room temperature. Due to the decreasing temperature, the upper layer continues to shrink, the tensile stress increases, and the lower layer stress cannot be recovered, which leads to the relative embrittlement of the AC pavement structure. Without the original characteristics, the AC pavement structure was destroyed before the ultimate strength was reached when the temperature reached the rupture point, which led to the appearance of various cracks. In addition, the AE curve in Figure 3 shows a basic pattern of foreshock–main shock–aftershock similar to the law of seismic activity, and the initial temperature drop shows a linear way. Also, the stress drop after the mainshock is apparent, showing strong brittleness.
Figure 4 shows the final instability and failure mode diagram of the AC pavement structure under three different cooling rates.
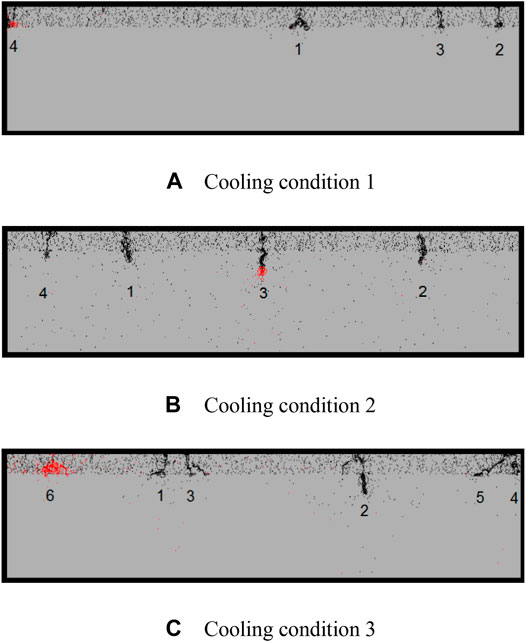
FIGURE 4. Final failure patterns of three cooling conditions. (A) Cooling condition 1, (B) Cooling condition 2, and (C) Cooling condition 3.
Figure 4 shows the final instability and failure mode with the AE result of AC pavement structure under these three cooling conditions. It can be seen from Figure 4 in the case of the cooling conditions 1, 2, and 3, respectively. The number of AE cracks in the AC pavement structure is 4, 4, and 6, as the boundary constraint effect may mainly cause the cracks that appear at both ends of the model. So, the number of damages caused by cooling may be 3, 4, and 5. Some of these rupture zones extend to the foundation course. With the increase of cooling rate, the number of AE fracture bands increases, and the crack propagation deepens. With the growth of the cooling rate, the number of AE fracture zones increases, and the crack propagation deepens. This phenomenon is because, with the growth of cooling rate, AE rupture points of AC pavement surface accumulate, connect, and expand earlier, resulting in shrinkage deformation. At this point, combined with the interlayer binding force of the lower layer, the stress generated between layers increases, and thus the interlayer peeling increases, so the crack increases. At the same time, it can be found through observation that the speed of temperature reduction is a crucial factor affecting the number and depth of cracks.
In addition, by collecting the cumulative AE hits of the final damage under three cooling conditions (as shown in Figure 5, it can be seen that the cumulative AE inside the AC concrete pavement structure increases with the loading step, wherein, when AC pavement temperature of cooling condition 3, cumulative AE hits of the road surface are the largest, that is, the damage degree is the most serious. On the other hand, we found that the cumulative AE hits of the AC pavement structure under different cooling conditions are within a broad range. When getting to the content, the AE hits of the AC pavement structure will erupt and result in ultimate instability. Therefore, the AE source can be judged by the received AE signal, and then, the damage magnitude and state of the structure can be evaluated. In the future, if conditions permit, a large number of indoor and outdoor experiments could be carried out to obtain a more accurate range before the AE burst, and a more profound study should be done into the relationship between the AE information and the degree of damage and damage inside the AC pavement structure.

FIGURE 5. Comparison of cumulative AE hits of three cooling processes.
Because there are many evolution diagrams of AE spatial distribution under different cooling conditions, process change diagrams that can highlight the acoustical emission characteristics of each stage in cooling condition 2 (Figure 6) and cooling condition 3 (Figure 7) are selected as the representatives of the AC pavement damage development process. The saturation process refers to the crack propagation gradually reaching its maximum, and crack propagation with the four stages, and finally got saturation, no longer apparent crack propagation.
1) Figure 6 temperature loading conditions: the initial temperature is 0°C, each step cools 2°C. Different sizes of red circles and black circles in the model represent AE, red circles represent tensile failure, and black circles represent final failure. The circle's position represents the rupture point of the AC pavement structure model. Also, the circle's size means the energy's size (the same to discussions later). The specific evolution process is shown in the following figure:
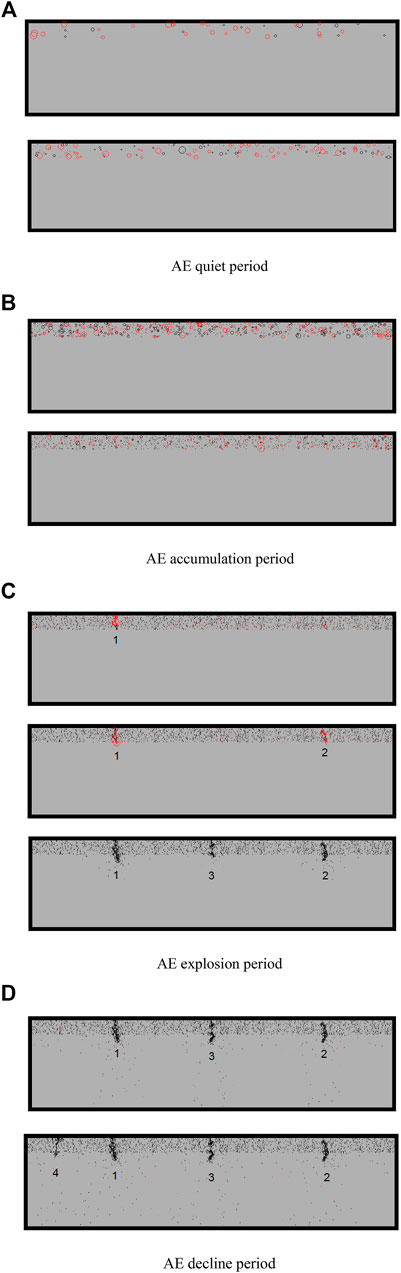
FIGURE 6. AE evolution with cooling down 2°C per step. (A) AE quiet period, (B) AE accumulation period, (C) AE explosion period, and (D) AE decline period.
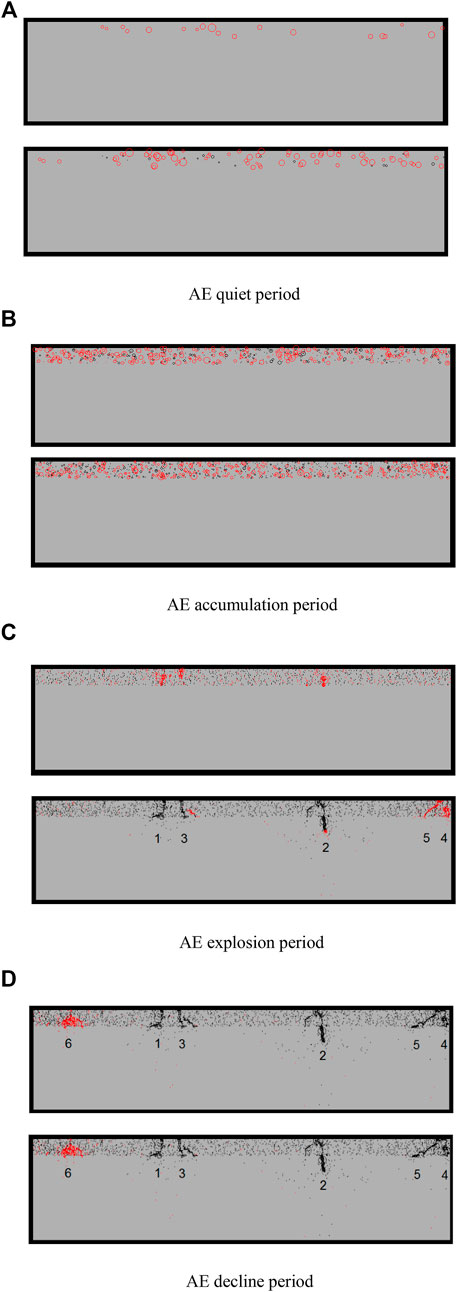
FIGURE 7. Sample AE evolution with cooling down 4°C per step. (A) AE quiet period, (B) AE accumulation period, (C) AE explosion period, and (D) AE decline period.
First, (A) Quiet period: In the early cooling stage, a minimal number of red circles appear on the AC pavement. These circles first appear at the top of the pavement surface and then appear inside the cover. These small circles represent a small number of AE, indicating that the AC pavement structure has begun to appear as a phenomenon of AE.
Secondly, (B) the development period is also called the uniform random development stage. With the decrease in temperature, the model's black circle and red circle of AE increased significantly. These AE circles gradually evolved into minor points filled with the upper surface of the AC pavement structure. This phenomenon is because some elements on the upper surface generate tensile stress due to temperature stress under the action of tensile stress. The dislocation and displacement of lattices occur in the model, resulting in AE on the surface of the AC pavement structure. At this stage, AE is independent and has no mutual influence.
Again, (C) the outbreak period is also called the micro-crack nonuniform development stage. It is the most important of the four stages. At this stage, the number of AE increased significantly. Most of the previous circles developed into rupture points, accounting for most of the total. Some rupture points continued to create locally, forming large black and red spots. At the same time, some of the scattered AE crack points in the specimen are connected and superimposed with each other. Finally, the auricular emission crack points gather together first, appear as a red crack zone, and then become a black crack zone, which is presented in the form of cracks 1, 2, and 3 in the left and right of the pavement surface. These cracks will block the shrinkage of adjacent areas, reduce the strength of the AC pavement structure, and continuously reduce the service function.
Finally, (D) the fallback period is called the micro-crack bureau breaking development stage. At this stage, the mutual penetration of AE crack points is increasing. From the original AE crack zones 1, 2, and 3, new AE crack zones are continuously inserted and extended to the grassroots. Finally, there are four AE rupture zones on the AC pavement, which appear in the specimen's surface and the foundation course of the model.
2) Figure 7 shows the evolution process of the spatial distribution of AE inside AC pavement structure when the temperature is reduced by 4°C in each step. Similar to Figure 6, the characteristics of each stage are not repeated.
As shown in Figure 7, six AE rupture bands appeared in the sample model with 4°C cooling per step. Compared with the spatial distribution evolution process of AE in Figure 5, it can be found that with the increase of cooling rate, the number of AE generated in the model increases, and the interlayer stripping phenomenon is more prominent, that is, the damage to the pavement is more serious.
From the above research, it can be seen that under cooling conditions 2 and 3, the cracks extend to the foundation course. Only the surface layer will be excavated and repaved when the pavement is renovated. The gaps in the foundation course will cause reflection cracks on the repaved surface layer, resulting in damage to the surface layer, as shown in Figure 8. This is inevitable. Therefore, how to reduce the probability of reflective cracking and reduce the damage to AC pavement structures are very important.
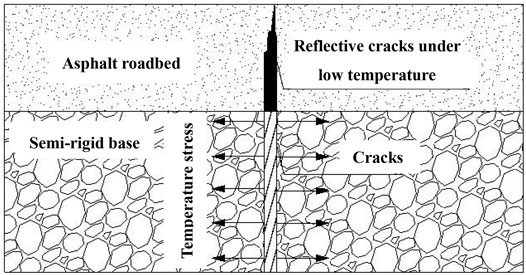
FIGURE 8. Reflective crack from temperature changes.
At present, most of the research on reflective cracks focuses on the cracking mechanism of temperature shrinkage cracks. The previous study of Xie (2018) showed that crack spacing affects the stability of the overall structure to a certain extent (this crack spacing is S in this paper). In addition, Chang et al. (2005) pointed out that the stress distribution in the layered model will change due to the prefabricated cracks with different S/T values. Because the asphalt pavement is also a layered model, is this phenomenon possible in the asphalt model? Therefore, the influences of different S/T values on reflection crack propagation (S/T represents the ratio of crack spacing to surface thickness) are studied later to find ways to reduce the probability of reflection crack formation and reduce the damage degree of the asphalt pavement structure. Because the surface thickness T of AC pavement is also an important influencing factor, the influence of different S/T values on the propagation of reflective cracks is studied later.
Three cracks with equal spacing and the same depth are present on the upper surface of the AC pavement structure foundation course. Also, the middle crack is located in the center of the model. The preset crack spacing is 250, 500, 750, and 1,000 mm, so the corresponding S/T values are 1.25, 2.5, 3.75, and 5, respectively. The actual length of the prefabricated model is 5 m; the thickness is 1.2 m. Also, the double-layer structure model is adopted. The thickness of the superstructure is 200 mm, and the number of cells is 40 × 1,000. The thickness of the lower structure is 1,000 mm, and cells are 200 × 1,000. The model's left and right boundary and lower boundary are fixed, and the upper surface is accessible. The corresponding model is shown in Figure 9. The mechanical parameters of the materials are shown in Table 1.
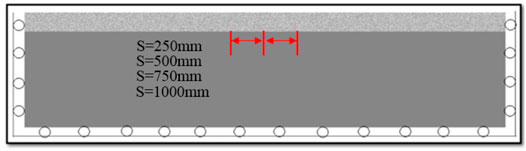
FIGURE 9. Numerical model and boundary conditions.
As shown in Figure 10, the curves of horizontal stress and AE with the change of loading step under four S/T conditions are shown. The entire simulation process can be divided into three stages:
1) The linear stage, which occurs before the explosive growth of AE. The stress level of the whole structure and the number of AE show a linear growth trend.
2) Reflective crack formation, development, and penetration stage. At this stage, the AE and stress levels peaked. The comparison of images shows that the external loading temperature during the formation and development of reflective cracks under different S/T ratios was significantly different. Under four conditions, the temperatures of reflection cracks in the model are −23, −22, −21, and −20°C. At this time, the stress peaks of each model are 72.8, 62.8, 69.5, and 66.3 MPa, and the AE peak also has a noticeable difference.
3) In the later crack stage, many stress and AE levels drop after the model's failure under four conditions. Also, the trend is almost the same; the final stress falls back to approximately 20 MPa.
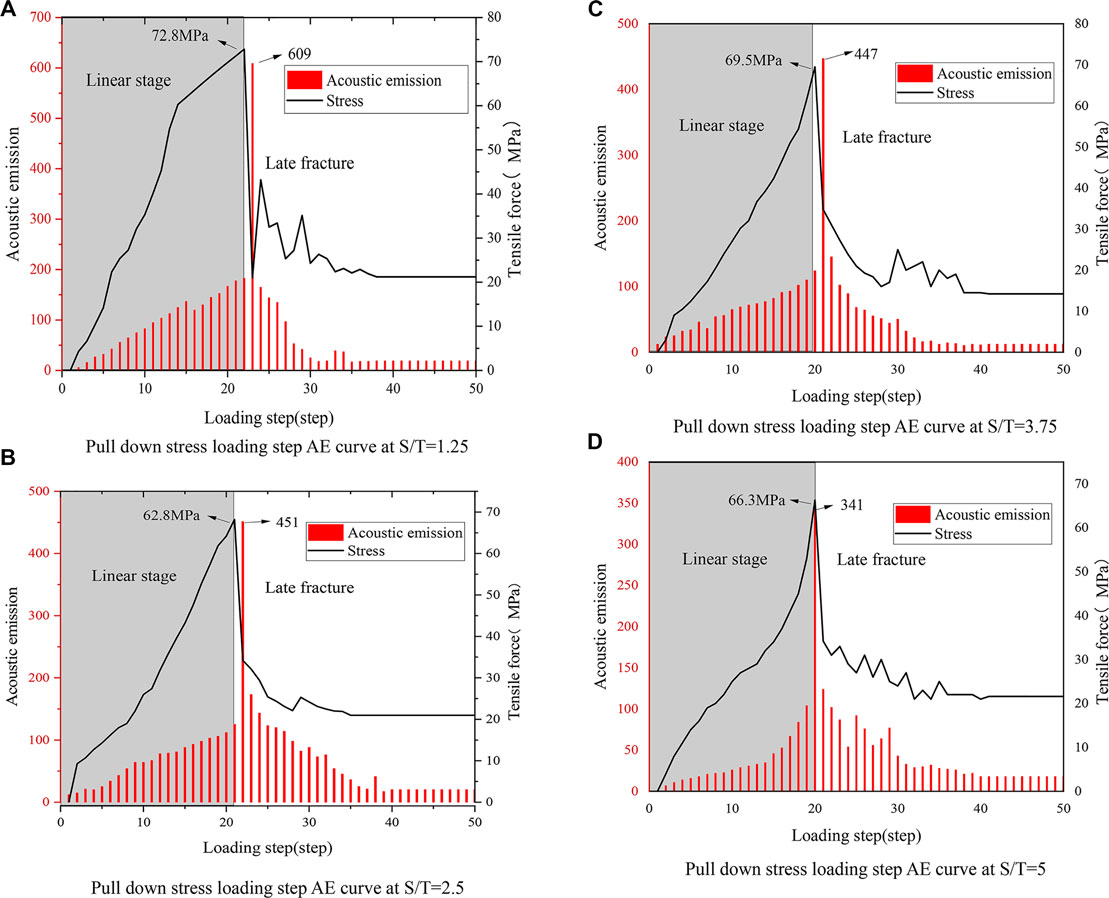
FIGURE 10. Different S/T Stress-Load Step-Sound Emission. (A) Pull down stress loading step AE curve at S/T = 1.25, (B) Pull down stress loading step AE curve at S/T = 2.5, (C) Pull down stress loading step AE curve at S/T = 3.75, and (D) Pull down stress loading step AE curve at S/T = 5.
Figure 11 shows the cumulative AE curve of the whole model under four S/T values. It can be seen under the four conditions when the loading step is 20 steps. The cumulative AE of the overall structure has explosive growth, and then, the increase is slow. Finally, with the stop of temperature loading, the overall cumulative number of AE has reached a fixed level. It can be seen from the figure that with the increase of crack spacing, the cumulative amount of AE of the whole pavement structure will decrease. The cumulative number of AE of the system when S/T = 1.25 is much larger than that of the form when S/T = 5, which shows that the damage degree of the whole pavement structure will decrease with the increase of crack spacing.
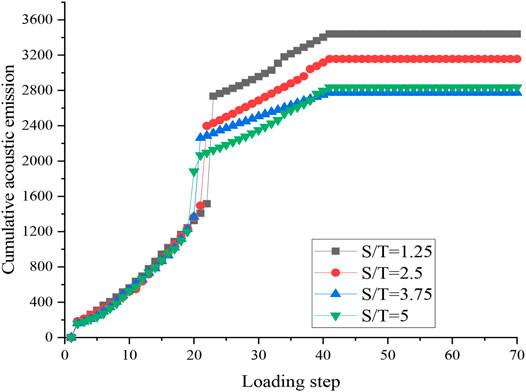
FIGURE 11. Cumulative AE under four S/T conditions.
Combined with the conclusions discussed earlier, the pavement is more easily damaged with increased crack spacing. We can draw a particular initial determination that the overall AC pavement structure is more prone to damage with increased crack spacing in the foundation course under the uniform cooling effect. However, the degree of injury is lower than when the crack space is small. Also, the life of the overall pavement structure will also be extended accordingly.
To intuitively observe the formation process of reflection cracks under four S/T conditions, this section follows the formation and expansion process of reflection cracks in AC pavement structure under each state by AE module in finite element software to determine the occurrence time and expansion mode of reflection cracks.
They are prefabricated with S/T values of 1.25, 2.5, 3.75, and 5 crack models for numerical simulation, obtained in different S/T values of the AE distribution model. The diagram mentioned later shows the distribution of AE selected in the process of AC pavement structure failure (Figures 12–15).
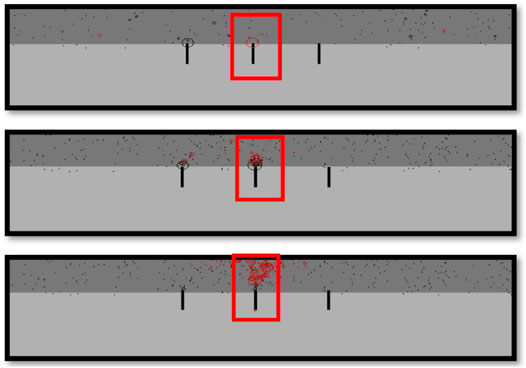
FIGURE 12. Distribution of AE during formation of reflection cracks when S/T = 1.25.
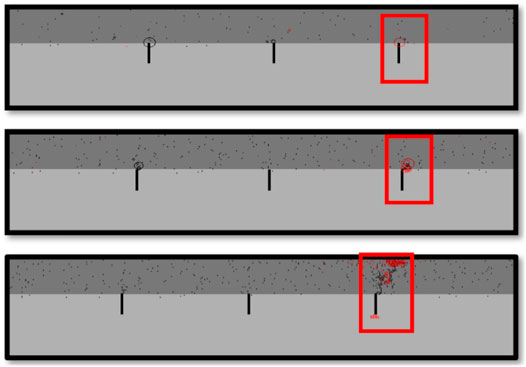
FIGURE 13. Distribution of AE during formation of reflection cracks when S/T = 2.5.
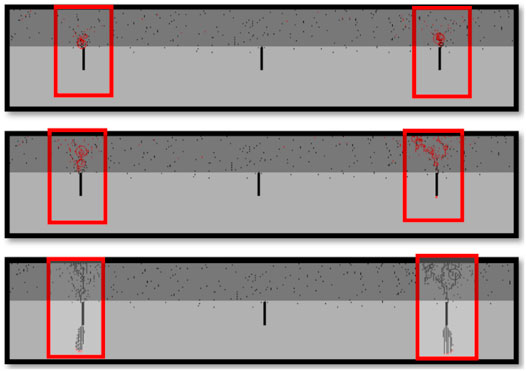
FIGURE 14. Distribution of AE during formation of reflection cracks when S/T = 3.75.
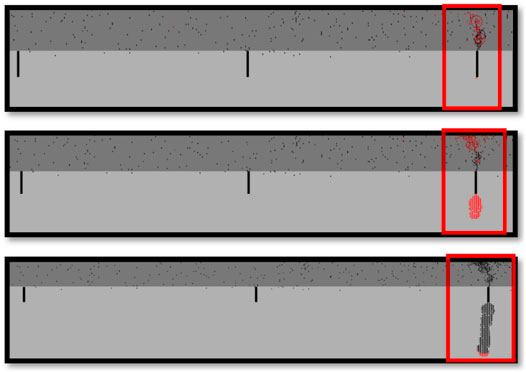
FIGURE 15. Distribution of AE during formation of reflection cracks when S/T = 5.
It can be seen that when S/T = 1.25, reflected cracks appeared at the prefabricated crack position in the central part of the model foundation course. At first, AE seemed at the crack's tip and gradually expanded to the AC pavement surface layer. Finally, the reflected shots penetrated the surface structure, destroying the pavement structure.
At S/T = 2.5, the reflection cracks appear in the right area of the central position. Also, the failure area is more significant than that at S/T = 1.25. When S/T = 3.75, many AE phenomena appeared on both sides of the central part of the structural model at first. Also, two reflection cracks appeared in the final failure state of the AC pavement structure. It is evident that after the reflection cracks appeared, the trials expanded to the foundation course. Finally, it formed two shots in the ground, and the depth was almost the same. When S/T = 5, a reflection crack appears in the AC pavement structure after uniform cooling and is located in the right area of the model. At the same time, this crack also continues to expand toward the foundation course with the decrease in temperature. The expansion depth is more profound than S/T = 3.75, and the damage to the floor is more serious. Finally, the number of micro-cracks in the AC pavement surface under four conditions shows that the AC pavement surface will decrease with increased space.
In summary, we can analyze the AE distribution map under four different spacing of preset cracks. With the increase of preset crack spacing, the damage degree of the AC pavement surface layer in the AC pavement structure will decrease. Still, the increase in preset crack spacing will lead to the expansion of cracks in the foundation course, and the depth will increase with the increase in space. In this case, the damage degree of the road structure foundation course will grow.
To better analyze the reasons for the difference in the overall damage of AC pavement caused by preset crack spacing, this section analyses the stress level between four crack spacing and the changing state of the displacement at the crack—Figure 16 analysis of minimum principal stress state between cracks under four S/T conditions.
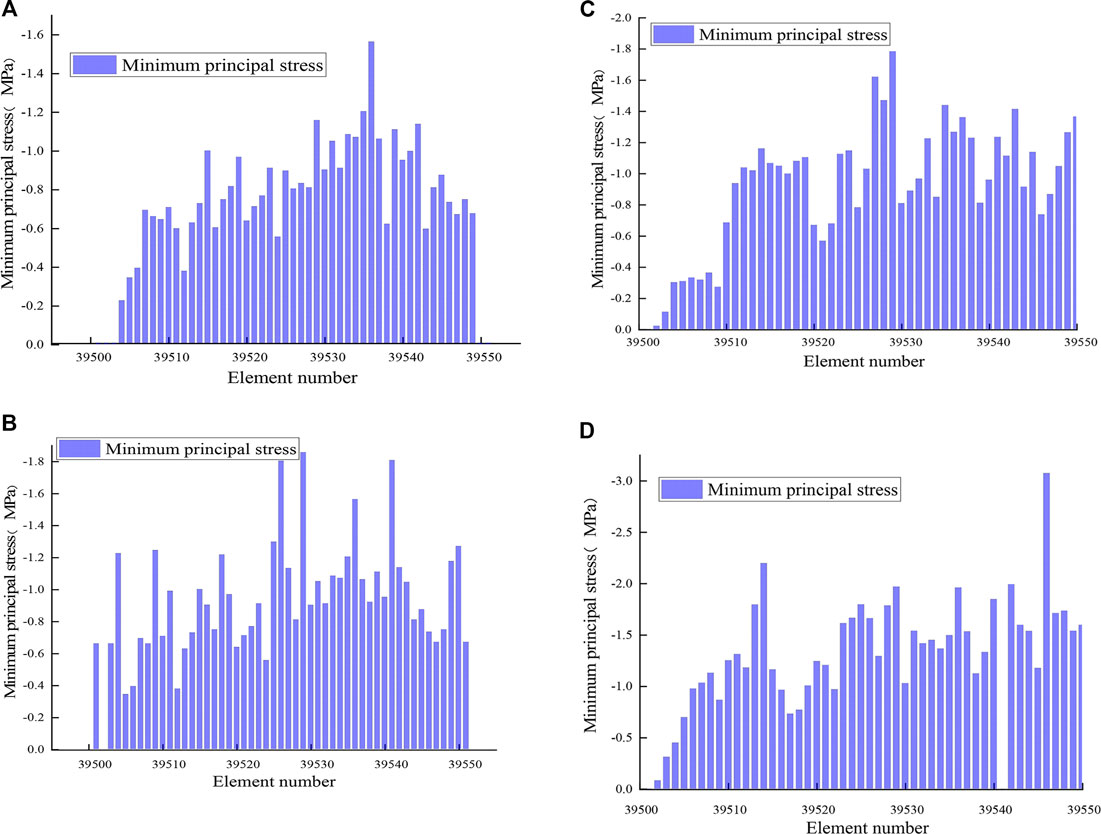
FIGURE 16. Stress levels between cracks. (A) S/T = 1.25 distribution of minimum principal stress between cracks, (B) S/T = 2.5 distribution of minimum principal stress between cracks, (C) S/T = 3.75 distribution of minimum principal stress between cracks, and (D) S/T = 5 distribution of minimum principal stress between cracks.
Figure 16 shows the minimum principal stress level between cracks under different S/T spaces. It can be seen from the figure that the curve is more compact with the increase in S/T value because the number of units selected is also increased with the rise of crack space. Overall, the minimum principal stress between cracks under the four S/T values is a state of less than zero. Therefore, the main force between cracks is the tensile force, the point where the minimum principal stress is zero in the image. This is due to the unit's failure due to the tensile stress, which has lost its born capacity. Specifically, when the S/T value is 1.25, the peak value of horizontal tensile stress between cracks is 1.6 MPa, and the overall level between shots is concentrated near 0.8 MPa. When the S/T value is 2.5, the peak stress between cracks is 1.8 MPa, and the stress level of the whole unit between cracks is approximately 1.2 MPa. When the S/T value is 3.75, the horizontal stress peak between cracks reaches approxiamtely 2 MPa, and the overall stress level between shots is approximately 1.5 MPa. Finally, when the S/T value comes 5, the stress peak between the cracks has reached 3 MPa. Also, the overall stress level between the crack shots is approximately 2 MPa; the stress state is precarious, and the fluctuation range is extensive.
The analysis shows that with the increase of crack spacing, the horizontal tensile stress level between cracks will also appear to be an inevitable increase. The peak stress between attempts at S/T = 5 is twice that of attempts at S/T = 1.25. Therefore, by analyzing the stress level between shots, it can be concluded that the horizontal tensile stress between cracks will increase with the increase of crack spacing in the foundation course. This also explains why the degree of AC pavement structure increases with the preset crack space. Due to the high level of horizontal stress between cracks, it is more likely to have a micro-crack at the intersection of the surface and the foundation course. In addition, the high level of tensile stress between cracks will put the overall structure in a high-stress state for a long time. Micro-crack will gradually develop and evolve and progressively expand to the surface layer to form reflective cracks. In addition, the high-stress state will also make cracks develop downward along with the pavement foundation course structure. Therefore, the foundation course structure will also suffer a certain degree of damage.
To better observe the propagation state of reflection cracks under different S/T values, the horizontal displacement state at the formation of reflection cracks under four S/T values was analyzed. Figure 17 is a multielement horizontal displacement analysis of the reflection cracks in the surface layer under four S/T conditions, where the positive and negative displacements represent the direction.
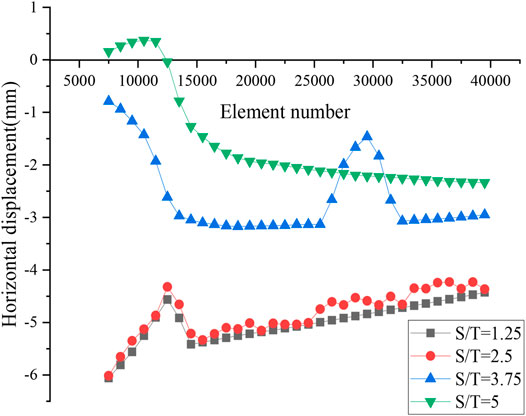
FIGURE 17. Multielement displacement state.
It can be seen from Figure 17 that when S/T = 1.25, the horizontal displacement at the formation of the reflection crack is approximately 5.5 mm. When S/T = 2.5, the overall curve and the curve trend of S/T = 1.25 are consistent and above S/T = 1.25. When S/T = 3.5, the horizontal displacement is approximately 3 mm. Finally, when S/T = 5, the horizontal displacement is approximately 2 mm. In summary, with the increase of S/T value, the horizontal displacement formed in the surface layer shows a decreasing state. With the rise of the S/T value, the width of the reflective cracks in the surface structure decreases. Also, the damage degree of the surface layer in the overall pavement structure is also low.
Based on the temperature version of RFPA software, this paper mainly studies the AE damage process of AC pavement structure under a low-temperature environment, analyzes the auditory emission characteristic information in detail, and studies the propagation mechanism of reflection cracks under cooling mode for four models with different S/T values. The main conclusions are as follows:
1) The numerical test process reproduces the AE damage process of the AC pavement structure. This clearly shows that the instability of the AC pavement structure is not completed instantly. The internal fracturing points of the system are superimposed, gathered, and penetrated to form cracks. The instability of the AC pavement structure starts as the micro-cracks expand and penetrate. This process demonstrates that AE technology can detect the location of the crack and predict the location of crack propagation.
2) It is found that the development process of AE of AC pavement structure is summarized into four development stages: quiet period, development period, outbreak period, and fallback period. Moreover, different locations have different characteristics. In a low-temperature environment, the greater the temperature reduction rate, the earlier AE burst time and failure in AC pavement structure will occur. This shows that the speed of temperature reduction is a crucial factor affecting the structural damage of AC pavement.
3) By observing the change curve of the load–stress–AE number of the AC pavement structure. It can be observed that the AE amplitude change shows a primary mode of the foreshock–main shock–aftershock type similar to the seismic activity law. The temperature at the beginning of temperature reduction showed linearity. The stress drop after the mainshock was significant, offering a solid brittleness.
4) The crack generated by the AC pavement structure under temperature is divided into two cases. One is that the surface is expanded with the change of temperature. The other is gradually developed from the middle layer of the surface layer. It shows that under the influence of a low-temperature environment, the cracks appearing in pavement structure are manifested on the road surface and hidden inside, which becomes a hidden danger of engineering. Therefore, AE monitoring is critical.
5) Through the study of the cumulative AE, it is found that the AE of the entire structure shows a downward trend with the increase of S/T value, indicating that although the rise of preset crack spacing will make pavement structure more vulnerable to damage, the damage degree of overall surface structure is low. The AE distribution analysis of the model found that with the increase of S/T value, the number of reflective cracks in the surface layer will increase. Also, the gaps will gradually expand to the foundation course, causing significant damage to the overall AC pavement structure.
6) The stress level between cracks and the multielement displacement state at the reflection crack is analyzed. It is concluded that with the increase of preset crack spacing, the overall stress level between shots will increase, and the width of reflection crack in the surface decreases. I am finally combined with the AE distribution of the whole structure. The reasons for the failure difference of the entire system under different S/T conditions are analyzed. With the increase of crack spacing, the stress level between cracks will increase, but it is mainly used to expand trials in the foundation course, and only a tiny part of the stress is used to develop to the surface layer structure to form reflective cracks.
Based on the conclusions discussed earlier, this paper proposes corresponding prevention measures to guide engineering practice:
1) According to the conclusion of this paper, in the actual construction process, some small spacing cracks can be present in the large spacing cracks in a foundation course. The reduction of spacing can slow down the frequency of reflection cracks in some ways and avoid cracks extending to the foundation course structure.
2) Before overlaying the AC pavement surface, if there is a relatively concentrated crack area on the base surface, asphalt material can be overlayed, such as using an asphalt mixture with extensive low-temperature penetration to better protect the surface structure.
The original contributions presented in the study are included in the article/supplementary material, further inquiries can be directed to the corresponding author.
All authors listed have made a substantial, direct, and intellectual contribution to the work and approved it for publication.
The work presented in this paper was supported by the Open Research Fund of Collaborative Innovation Center for Prevention and Control of Mountain Geological Hazards of Zhejiang Province (PCMGH-2016-Z-04).
Authors CB, ZC, and YQ were employed by the Huahui Engineering Design Group Corporation Ltd. Author YC was employed by the China Huaneng Zhalainuoer Coal Industry Co. Ltd.
The remaining authors declare that the research was conducted in the absence of any commercial or financial relationships that could be construed as a potential conflict of interest.
All claims expressed in this article are solely those of the authors and do not necessarily represent those of their affiliated organizations or those of the publisher, the editors, and the reviewers. Any product that may be evaluated in this article, or claim that may be made by its manufacturer, is not guaranteed or endorsed by the publisher.
Bai, T., Pollard, D. D., and Gao, H. (2000). Explanation for Fracture Spacing in Layered Materials. Nature 403 (6771), 753–756. doi:10.1038/35001550
Behnia, A., Chai, H. K., and Shiotani, T. (2014). Advanced Structural Health Monitoring of concrete Structures with the Aid of Acoustic Emission. Construction Building Mater. 65, 282–302. doi:10.1016/j.conbuildmat.2014.04.103
Behnia, B., Buttlar, W., and Reis, H. (2018). Evaluation of Low-Temperature Cracking Performance of Asphalt Pavements Using Acoustic Emission: A Review. Appl. Sci. 8 (2), 306. doi:10.3390/app8020306
Brown, S. F., Thom, N. H., and Sanders, P. J. (2001). A Study of Grid Reinforced Asphalt to Combat Reflection Cracking (With Discussion). Clearwater Beach, Florida. Asphalt Paving Technology 2001. Conference presentation] https://trid.trb.org/view/720140.
Cai, X., Shi, C., Chen, X., and Yang, J. (2021). Identification of Damage Mechanisms during Splitting Test on SFP at Different Temperatures Based on Acoustic Emission. Construction Building Mater. 270, 121391. doi:10.1016/j.conbuildmat.2020.121391
Chang, X., Zhong, H., Tang, C., Zhang, Y., and Zhang, J. (2005). Numerical Research on Fracture Saturation for Layered Rock Stratum. Chin. J. rock Mech. Eng. 024 (A01), 5151–5156. Available at: https://kns.cnki.net/kcms/detail/detail.aspx?FileName=ZGYJ200508002024&DbName=CPFD2006
Dave, E. V., and Buttlar, W. G. (2010). Thermal Reflective Cracking of Asphalt concrete Overlays. Int. J. Pavement Eng. 11 (6), 477–488. doi:10.1080/10298430903578911
Duan, R., Huang, G., Li, Y., Zheng, R., Wang, G., Xin, B., et al. (2021). Ensemble Temperature and Precipitation Projection for Multi-Factorial Interactive Effects of GCMs and SSPs: Application to China. Front. Environ. Sci. 9, 382. doi:10.3389/fenvs.2021.742326
Hakimzadeh, S., Behnia, B., Buttlar, W. G., and Reis, H. (2017). Implementation of Nondestructive Testing and Mechanical Performance Approaches to Assess Low Temperature Fracture Properties of Asphalt Binders. Int. J. Pavement Res. Techn. 10 (3), 219–227. doi:10.1016/j.ijprt.2017.01.005
Hill, B., Behnia, B., Buttlar, W. G., and Reis, H. (2013). Evaluation of Warm Mix Asphalt Mixtures Containing Reclaimed Asphalt Pavement through Mechanical Performance Tests and an Acoustic Emission Approach. J. Mater. Civ. Eng. 25 (12), 1887–1897. doi:10.1061/(Asce)Mt.1943-5533.0000757
Hou, F., Li, T., Li, X., Li, Y., and Guo, M. (2021). Research on the Anti-reflective Cracking Performance of a Full-Depth Asphalt Pavement. Sustainability 13 (17), 9499. doi:10.3390/su13179499
Hu, S., Zhou, F., and Scullion, T. (2010). Reflection Cracking-Based Asphalt Overlay Thickness Design and Analysis Tool. Transportation Res. Rec. 2155 (1), 12–23. doi:10.3141/2155-02
Jiao, Y., Fu, L., Shan, W., and Liu, S. (2019a). Damage Fracture Characterization of Pervious Asphalt Considering Temperature Effect Based on Acoustic Emission Parameters. Eng. Fracture Mech. 210, 147–159. doi:10.1016/j.engfracmech.2018.10.007
Jiao, Y., Zhang, L., Guo, Q., Guo, M., and Zhang, Y. (2020). Acoustic Emission-Based Reinforcement Evaluation of Basalt and Steel Fibers on Low-Temperature Fracture Resistance of Asphalt Concrete. J. Mater. Civ. Eng. 32 (5), 04020104. doi:10.1061/(Asce)Mt.1943-5533.0003118
Jiao, Y., Zhang, Y., Zhang, M., Fu, L., and Zhang, L. (2019b). Investigation of Fracture Modes in Pervious Asphalt under Splitting and Compression Based on Acoustic Emission Monitoring. Eng. Fracture Mech. 211, 209–220. doi:10.1016/j.engfracmech.2019.02.025
Khodaii, A., Fallah, S., and Moghadas Nejad, F. (2009). Effects of Geosynthetics on Reduction of Reflection Cracking in Asphalt Overlays. Geotextiles and Geomembranes 27 (1), 1–8. doi:10.1016/j.geotexmem.2008.05.007
Kim, K. W., Doh, Y. S., and Lim, S. (1999). Mode I Reflection Cracking Resistance of Strengthened Asphalt Concretes. Construction Building Mater. 13 (5), 243–251. doi:10.1016/s0950-0618(99)00032-x
Li, X., and Marasteanu, M. O. (2011). Investigation of Low Temperature Cracking in Asphalt Mixtures by Acoustic Emission. Road Mater. pavement Des. 7 (4), 491–512. doi:10.1080/14680629.2006.9690048
Li, X., Marasteanu, M. O., Iverson, N., and Labuz, J. F. (2006). Observation of Crack Propagation in Asphalt Mixtures with Acoustic Emission. Transportation Res. Rec. 1970 (1), 171–177. doi:10.1177/0361198106197000118
Liang, M., Xu, J., Chan, J. C. L., Wu, L., and Xu, X. (2020). Changing Relationship between Tibetan Plateau Temperature and South China Sea Summer Monsoon Precipitation. Front. Environ. Sci. 8. doi:10.3389/fenvs.2020.583466
Liu, J. Q., Chen, C. C., Wang, B. S., and Hao, N. (2011). The Fatigue Fracture Analysis of Semi-rigid Base-Course Asphalt Pavement under the Temperature Effect. J. Xi'an Univ. Techn.. doi:10.19322/j.cnki.ISSN.1006-4710.2011.03.024
Morris, G. R., Chen, N. J., and Di Vito, J. A. (1982). “Application of Asphalt-Rubber on New Highway Pavement Construction,” in Paper presented at the 61st annual meeting of the Transportation Board.
Nair, A., and Cai, C. S. (2010). Acoustic Emission Monitoring of Bridges: Review and Case Studies. Eng. structures 32 (6), 1704–1714. doi:10.1016/j.engstruct.2010.02.020
Qisen, J. Z. J., and Zheng, J. L. (1990). Finite Elements Analysis of Reflection Crack and Stress Intensity Factors in Half Rigid Pavements [J]. Chin. J. Geotechnical Eng. 12 (3), 22–30.
Qiu, X., Xu, J., Xu, W., Xiao, S., Wang, F., and Yuan, J. (2020). Characterization of Fatigue Damage Mechanism of Asphalt Mixtures with Acoustic Emission. Construction Building Mater. 240, 117961. doi:10.1016/j.conbuildmat.2019.117961
Seo, Y., and Kim, Y. R. (2008). Using Acoustic Emission to Monitor Fatigue Damage and Healing in Asphalt Concrete. KSCE J. Civ Eng. 12 (4), 237–243. doi:10.1007/s12205-008-0237-3
Shen, Z. W., Shao, X. S., and Wang, N. X. (2011). Prediction Model of Measured Temperature Field of Asphalt Pavement in Cold Region. J. China Foreign Highw. 31 (6), 129–133. doi:10.14048/j.issn.1671-2579.2011.06.043
Sun, Z., Behnia, B., Buttlar, W. G., and Reis, H. (2017). Assessment of Low-Temperature Cracking in Asphalt Materials Using an Acoustic Emission Approach. J. Test. Eval. 45 (6), 20160579–20161958. doi:10.1520/Jte20160579
Tsai, F.-L., Lytton, R. L., and Lee, S. (2010). Prediction of Reflection Cracking in Hot-Mix Asphalt Overlays. Transportation Res. Rec. 2155 (1), 43–54. doi:10.3141/2155-05
Wang, J. (2012). “Analysis the Control Techniques of Reflection Crack on Asphalt Overlay of Old Cement concrete Pavement,” in Paper presented at the Applied Mechanics and Materials, Beijing, September 26, 2012.
Wang, X., and Zhong, Y. (2019). Reflective Crack in Semi-rigid Base Asphalt Pavement under Temperature-Traffic Coupled Dynamics Using XFEM. Construction Building Mater. 214, 280–289. doi:10.1016/j.conbuildmat.2019.04.125
Wei, H., Hu, B., Wang, F., Zheng, J., Jin, J., and Liu, C. (2020). Temporal-spatial Evolution Characteristics of Acoustic Emission in Asphalt concrete Cracking Process under Low Temperature. Construction Building Mater. 248, 118632. doi:10.1016/j.conbuildmat.2020.118632
Wei, H., Li, J., Wang, F., Zheng, J., Tao, Y., and Zhang, Y. (2021). Numerical Investigation on Fracture Evolution of Asphalt Mixture Compared with Acoustic Emission. Int. J. Pavement Eng., 1–11. doi:10.1080/10298436.2021.1902524
Wei, J., Zhu, W., Guan, K., Zhou, J., and Song, J.-J. (2019). An Acoustic Emission Data-Driven Model to Simulate Rock Failure Process. Rock Mech. Rock Eng. 53 (4), 1605–1621. doi:10.1007/s00603-019-01994-3
Xie, W. K. (2018). Research on the Influence of Slice-Cracks Technology on Mechanical Behavior of Asphalt Overlay on Existing Cement Concrete Pavement. [dissertation/doctoral thesis]. Xian: Xi'an University of architecture and technology.
Xu, J., Fu, Z., Han, Q., Lacidogna, G., and Carpinteri, A. (2018). Micro-cracking Monitoring and Fracture Evaluation for Crumb Rubber concrete Based on Acoustic Emission Techniques. Struct. Health Monit. 17 (4), 946–958. doi:10.1177/1475921717730538
Yang, K., He, Z., Li, D., Xu, H., and Kong, L. (2021a). Experimental Study on Basalt Fiber Crack Resistance of Asphalt Concrete Based on Acoustic Emission. Materials 14 (15), 4096. doi:10.3390/ma14154096
Yang, K., Li, D., He, Z., Zhou, H., and Li, J. (2021b). Study on Acoustic Emission Characteristics of Low-Temperature Asphalt Concrete Cracking Damage. Materials 14 (4), 881. doi:10.3390/ma14040881
Keywords: value of S/T, mechanism, reflective crack, low temperature effect, asphalt pavement, crack propagation
Citation: Bao C, Liu Q, Xia Y, Cui Y, Cao Z, Qian Y, Liu M, Mu C and Wang H (2022) Influence of Crack Spacing/Layer Thickness Value on Reflection Crack Propagation Mechanism Under Low Temperatures. Front. Earth Sci. 9:810964. doi: 10.3389/feart.2021.810964
Received: 08 November 2021; Accepted: 28 December 2021;
Published: 16 February 2022.
Edited by:
Jie Chen, Chongqing University, ChinaReviewed by:
Hui Li, Xi’an Jiaotong University, ChinaCopyright © 2022 Bao, Liu, Xia, Cui, Cao, Qian, Liu, Mu and Wang. This is an open-access article distributed under the terms of the Creative Commons Attribution License (CC BY). The use, distribution or reproduction in other forums is permitted, provided the original author(s) and the copyright owner(s) are credited and that the original publication in this journal is cited, in accordance with accepted academic practice. No use, distribution or reproduction is permitted which does not comply with these terms.
*Correspondence: Yingjie Xia, eGlheWluZ2ppZUBkbHV0LmVkdS5jbg==
Disclaimer: All claims expressed in this article are solely those of the authors and do not necessarily represent those of their affiliated organizations, or those of the publisher, the editors and the reviewers. Any product that may be evaluated in this article or claim that may be made by its manufacturer is not guaranteed or endorsed by the publisher.
Research integrity at Frontiers
Learn more about the work of our research integrity team to safeguard the quality of each article we publish.