 Hao Li
 Genbo Peng*
- Department of Petroleum Engineering, Northeast Petroleum University, Daqing, China
CO2 foam fracturing fluid is widely used in unconventional oil and gas production because of its easy flowback and low damage to the reservoir. Nowadays, the fracturing process of CO2 foam fracturing fluid injected by coiled tubing is widely used. However, the small diameter of coiled tubing will cause a large frictional pressure loss in the process of fluid flow, which is not beneficial to the development of fracturing construction. In this paper, the temperature and pressure calculation model of gas, liquid, and solid three-phase fluid flow in the wellbore under annulus injection is established. The model accuracy is verified by comparing the calculation results with the existing gas, solid, and gas and liquid two-phase model of CO2 fracturing. The calculation case of this paper shows that compared with the tubing injection method, the annulus injection of CO2 foam fracturing fluid reduces the friction by 3.06 MPa, and increases the wellbore pressure and temperature by 3.06 MPa and 5.77°C, respectively. Increasing the injection temperature, proppant volumetric concentration, and foam quality will increase the wellbore fluid temperature and make the CO2 transition to the supercritical state while increasing the mass flow rate will do the opposite. The research results verify the feasibility of the annulus injection of CO2 foam fracturing fluid and provide a reference for the improvement of CO2 foam fracturing technology in the field.
Introduction
With the development of the economy, the exploitation of conventional oil and gas resources has been unable to meet the energy consumption required by scientific and technological progress. Therefore, the development focus has gradually shifted to low permeability and dense unconventional oil and gas resources (Song et al., 2017; Li C et al., 2017; Tang et al., 2021; Tang et al., 2020; Tan and Qiao, 2020; Zhang et al., 2021). Due to the low permeability of unconventional reservoirs (Tang et al., 2019; Xie et al., 2020; Shao et al., 2019; Wang et al., 2020), application of hydraulic fracturing technology for unconventional oil and gas production has many problems, such as low flowback and damage to the reservoir, which has been unable to meet the technical requirements of unconventional oil and gas development. CO2 fracturing is widely recognized by engineers, experts, and scholars because it can achieve several times higher permeability than hydraulic fracturing (Wang et al., 2012; He et al., 2016; Wanniarachchi et al., 2018; Cong et al., 2022), and has little damage to the reservoir and easy flowback during fracturing (Gupta et al., 2005; Wang et al., 2011; Yi et al., 2019). Nowadays, CO2 fracturing technology is mainly divided into CO2 foam fracturing, CO2 dry fracturing, supercritical CO2 fracturing, CO2 dry foam fracturing, and the other special CO2 fracturing (Sun F et al., 2017). Compared with CO2 dry fracturing, CO2 foam fracturing has many advantages, such as low construction difficult and technical equipment requirements, and has been widely used. He et al. (2018) found through fracturing tests that Supercritical CO2 can obtain lower breakdown pressure than freshwater under the same pressure. Carter et al. (1996), McAndrew et al. (2017), and Tong et al. (2017, 2019) found through experiments that CO2 foam fracturing fluid has a greater sand-carrying capacity than water. Gu and Mohanty (2014) simulated the effect of foam quality on fracture morphology by using the PKN model and found that the length of cracks decreases with the increase of foam quality, while the width increases. Friehauf and Sharma (2009b) found through simulation that the foam quality is between 0.3 and 0.5, and the optimal fracturing effect will be obtained. A large number of studies have shown that CO2 foam fracturing can effectively improve the fracturing effect of unconventional reservoirs. However, when CO2 foam fracturing is used, there is an interaction between the rheological parameters of fracturing fluid in the wellbore and the pressure and temperature (Guo and Zeng 2015; Friehauf and Sharma 2009a; Song et al., 2017a; 2017b). How to accurately calculate the rheological parameters of CO2 foam fracturing fluid in wellbore and fracture and determine the fracturing fluid phase has become an important prerequisite for accurately predicting the shape of fracturing fractures. A lot of theoretical and experimental studies have been done on CO2 foam fluids (Sherif et al., 2016; Ahmed et al., 2017; Faroughi et al., 2018; Moridis 2018; Yekeen et al., 2018). Li et al. (2008) established a coupled mathematical model of density, pressure, and temperature distribution of foam fluid flowing in the wellbore. The analysis showed that foam quality had a great influence on fluid parameters. However, although this model has a wider range of application than previous models, the effect of proppant on CO2 foam fracturing fluid flow in the wellbore is not considered. An et al. (2014), Li Y et al. (2017), Luo et al. (2014) found through foam rheological experiments that CO2 foam fracturing fluid belongs to power-law fluid, whose viscosity increases with foam quality and pressure, and decreases with temperature and shear rate. Li et al. (2010) established a model of proppant flowing with foam. Through Reynolds number to calculate the friction coefficient of foam and proppant, and added them to obtain the friction coefficient of three-phase fluid. For the CO2 injection process, Cheng et al. (2013), and Shen et al. (2010) proposed using coiled tubing to inject CO2, which is more conducive to the transformation of CO2 into a supercritical state. With the development of coiled tube fracturing technology, the coiled tube sandblasting perforating annulus fracturing is one of the most concerned and the most rapidly developing technologies (Yu et al., 2013). Compared with tubing injection, annulus injection can significantly reduce the friction caused by the flow of fracturing fluid in the wellbore (Wang et al., 2010).
At present, although a variety of models for CO2 foam fracturing fluids have been established, most of them only consider the gas-liquid phase and ignore the influence of proppant on temperature and pressure. When the CO2 foam fracturing fluid flows in the wellbore, the friction between the proppant and the pipe wall will cause serious frictional pressure loss, and the proppant will also change the density and viscosity of the fracturing fluid, so the two-phase model will produce large errors in the calculation of temperature and pressure of CO2 foam fracturing fluid in the wellbore. In this paper, the gas, liquid, and solid three-phase flow model of CO2 foam fracturing fluid in the wellbore was established to realize the accurate prediction of fluid temperature and pressure during the flow process, which provided a theoretical basis for the design of CO2 foam fracturing parameters.
Temperature and Pressure Calculation Model in Wellbore
Model Assumptions
To establish the temperature and pressure calculation model for the flow of CO2 foam fracturing fluid in the wellbore, the following assumptions are proposed: 1) CO2 foam fracturing fluid flow along the wellbore is treated as a one-dimensional flow; 2) The injection pressure, injection mass flow rate, and surface temperature are assumed to be constant; 3) The gas phase, liquid phase, and solid phase are present in the wellbore at the same time; 4) The annulus fluid only has heat conduction, and the effects of natural convection and radiation are ignored. According to the construction characteristics of CO2 foam fracturing, a physical model is established as shown in Figure 1 (Guo et al., 2015).
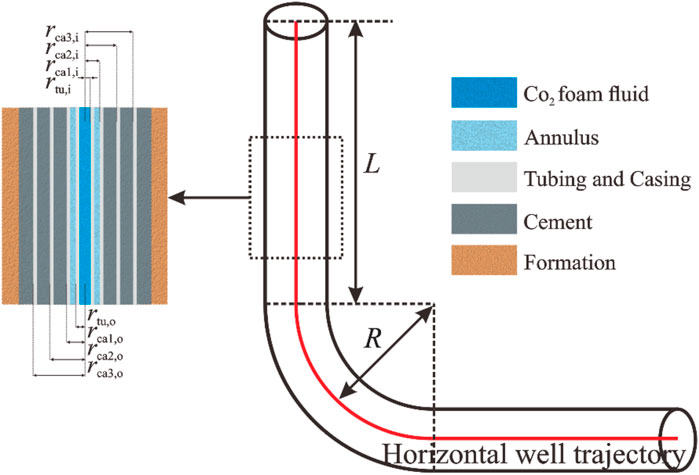
FIGURE 1. Diagram of the wellbore-formation system for CO2 foam fracturing fluid.
Numerical Model
Proppant has a great influence on the temperature and pressure of CO2 foam fracturing fluid flowing in the wellbore, so the CO2 foam two-phase flow equation needs to be corrected (Xu et al., 2019). In this paper, the solid phase is coupled to the CO2 foam two-phase flow model by volume averaging method, and the governing equation of the steady state model of CO2 foam fracturing fluid is established.
Heat Transfer Model
During CO2 foam fracturing fluid injection, the temperature change depends on heat transfer down the tubing and heat exchange between the fluid and the tubing wall. Therefore, the energy conservation equation of CO2 foam fracturing fluid in the tubing can be obtained (Sun X et al., 2017; Sun et al., 2018; Xu et al., 2018):
where the subscripts “f,” “tu,” and “i” represent the CO2 foam fracturing fluid, tubing, and inner radius, respectively; ρ represents the density, kg/m3; T represents the temperature, °C; Cp represents the specific heat capacity, J/(kg·°C); Q represent the mass flow rate, kg/s; h represents the heat transfer coefficient between CO2 foam fracturing fluid and tubing, W/(m2·°C).
Heat is transferred in the axial direction by conduction; the heat exchange between the tubing wall and the fluid, and the heat exchange between the tubing wall and the annulus fluid in the radial direction through conduction are factors that affect the tubing temperature. The energy conservation equation of the tubing is given by (Xu et al., 2019):
where the subscripts “an” and “ca1” represent the annulus fluid and the production casing, respectively; λtu-an represents the thermal conductivity between the tubing and the annulus fluid, W/(m·°C); the subscripts “o” represents the outer radius, respectively.
The temperature of the wellbore-formation system is determined by the heat transfer in the axial direction through conduction and the heat exchange between the phase layers.
where the subscripts “ce1” and “fo” represent the cement layer and the formation, respectively; λan-ca1 represents the thermal conductivity between the annulus fluid and the production casing, W/(m·°C); λca1-ce1 represents the thermal conductivity between the production casing and the cement layer, W/(m·°C).
Heat transfer of carbon dioxide foam fracturing fluid mainly includes thermal conductivity coefficient, heat transfer coefficient, and specific heat capacity, the calculation formula is as follows:
where the subscripts “g,” “l,” and “s” represent the internal phase and external phase and proppant, respectively; Csf represents the proppant volumetric concentration; Γ represents the foam quality.
Pressure Model
where p represents the pressure, MPa; g represents the gravity acceleration, m/s2; θ represents the inclination angle; f represents the friction coefficient; v represents the velocity, m/s; r represents the radius, m; △v represents the speed difference between two positions, m/s (Xu et al., 2019).
The velocity equation of CO2 foam fracturing fluid is given by:
where q represents the volume flow rate, m3/s.
The foam quality and proppant volumetric concentration are given by:
where V represents the volume, m3.
The liquid phase density can be calculated as follows:
where the subscript “ref” represent the reference condition (pref = 0.101325 MPa, Tref = 20°C); β represents the isothermal volume modulus of the external phase, Pa; α represents the volume expansion coefficient, °C−1. In this paper, the external phase of CO2 foam fracturing fluid is water, ρref = 1000 kg/m3, β = 2.2 × 10⁹ Pa, α = 0.000207°C−1 (Xu et al., 2019).
According to volume averaging, gas, liquid, and proppant mass are given by:
The density of CO2 foam fracturing fluid is given by:
where m represents the mass, kg.
Substituting Eqs. 14–16 into Eq. 17, the density of foam fracturing fluid can be obtained:
CO2 properties are calculated by S-W model (Span and Wagner 1996), because the model is more accurate.
where Φ represents the Helmholtz energy; ΦO represents the ideal gas part of Helmholtz energy; Φr represents the residual fluid part of Helmholtz energy; δ and τ represent the reduced density and inverse reduced temperature, respectively.
Friction Calculation
For CO2 foam fracturing fluid, whose flow pattern has a direct effect on the friction coefficient, when Re ≤ Rec, it is laminar flow; otherwise, it is turbulent flow, where Rec = 3470−1370 n (Li et al., 2010).
The friction coefficient of CO2 foam fracturing fluid containing proppant is calculated by the sum of fluid friction coefficient and proppant friction coefficient.
The calculation of the proppant friction coefficient is given by:
Then, the friction coefficient of CO2 foam fracturing fluid containing proppant is ff = fl + fs.
The friction of CO2 foam fracturing fluid flowing in the wellbore is given by:
where F represents the friction, Pa; l represents the casing length, m.
Boundary Conditions
Boundary conditions of the model:
where A, B, and C are the initial values, respectively.
The model solving process is shown in Figure 2. The model is divided into several elements, and it is assumed that the properties of the fracturing fluid in each element are constant. The initial fluid parameters such as phase state, density, and viscosity are calculated from the initial values of pressure and temperature. The new pressure distribution is obtained from the initial fluid parameters. New fluid parameters are obtained from the new pressure and initial temperature. The energy conservation equation of the wellbore-formation system is calculated with the new fluid parameters to obtain a new temperature. Finally, the new temperature and pressure distribution are compared with the old temperature and pressure distribution to verify the convergence.
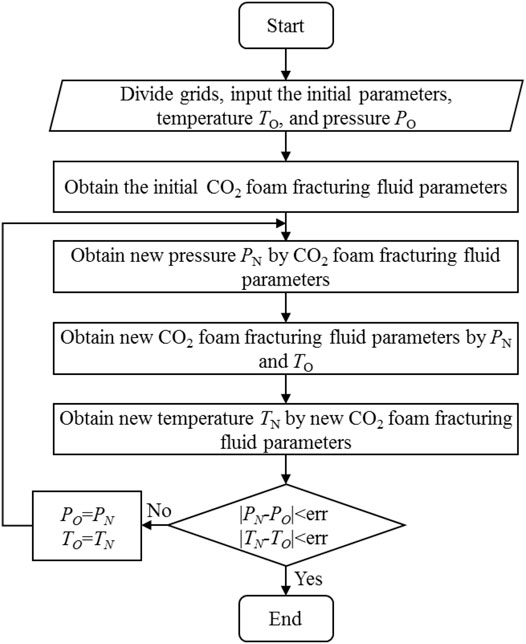
FIGURE 2. Model solving flowchart.
Model Verification
In this paper, the two-phase fluid temperature and pressure calculation data of CO2 proppant and CO2 foam are used because of the lack of gas, liquid, and solid phase field measured data (Xu et al., 2019). The calculated data is compared with the calculated results of the model to verify the model’s accuracy. The calculation parameters are shown in Table 1.
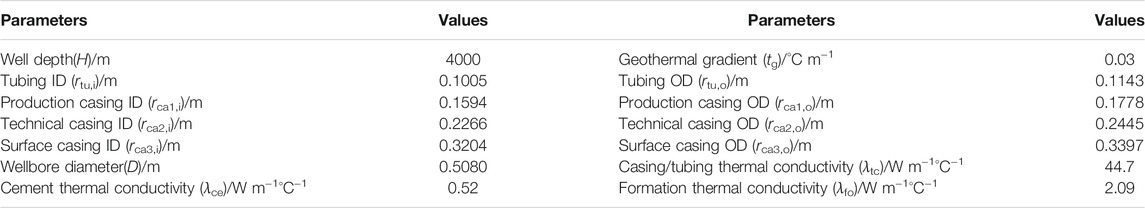
TABLE1. The calculation parameters.
The model is validated with the CO2 proppant two-phase model of Xu. The injection mass flow rate Qw is 80 kg/s; the injection temperature ti, proppant volumetric concentration Csf, and injection pressure Pi are −20°C, 0.2, and 40 MPa, respectively. The comparison between the model calculation results of Xu et al. and the simulation results in this paper is shown in Figure 3.
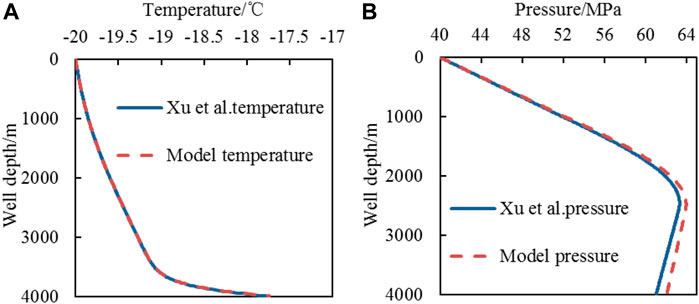
FIGURE 3. Temperature and pressure distribution of CO2 proppant gas-solid two phases in the wellbore [(A): temperature profile; (B): pressure profile].
The bottom hole temperature calculated result by the model of Xu and in this paper are −17.77°C and −17.74°C respectively, the temperature difference is 0.03°C, the error is 0.18%, and the average error of the whole well is 0.01%. The bottom hole pressure calculated result by the model of Xu and in this paper are 61.03 and 62.06 MPa, respectively, the pressure difference is 1.03 MPa, the error is 1.03%, and the average error of the whole well is 0.86%.
The model is validated with the CO2 foam two-phase model of Xu. The injection mass flow rate Qw is 60 kg/s; the injection temperature ti, foam quality Γ, and injection pressure Pi are 5°C, 0.75, and 40 MPa, respectively.
As shown in Figure 4, the bottom hole temperature calculated result by the model of Xu et al. and in this paper are 11.26°C and 12.62°C respectively, the temperature difference is 1.36°C, the error is 12.03%, and the average error of the whole well is 1.47%. The bottom hole pressure calculated result by the model of Xu and in this paper are 36.79 and 37 MPa, respectively, the pressure difference is 0.21 MPa, the error is 0.58%, and the average error of the whole well is 0.49%.
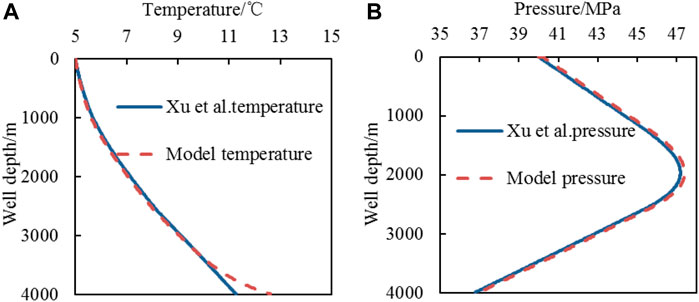
FIGURE 4. Temperature and pressure distribution of CO2 foam gas-liquid two phases in the wellbore [(A): temperature profile; (B): pressure profile].
The comparison of the calculation results proves that the model in this paper has good accuracy, indicating that the model is suitable for CO2 foam fluid in the wellbore calculation.
Comparison of Injection Methods of CO2 Foam Fracturing Fluid
This section compares the temperature and pressure distribution in the wellbore of the two injection methods with tubing-carrying proppant, annulus replenishes fracturing fluid, and annulus-carrying proppant, tubing replenishes fracturing fluid, to illustrate the impact of injection methods on wellbore fluid temperature and pressure. The basic parameters of the calculation are shown in Table 2.
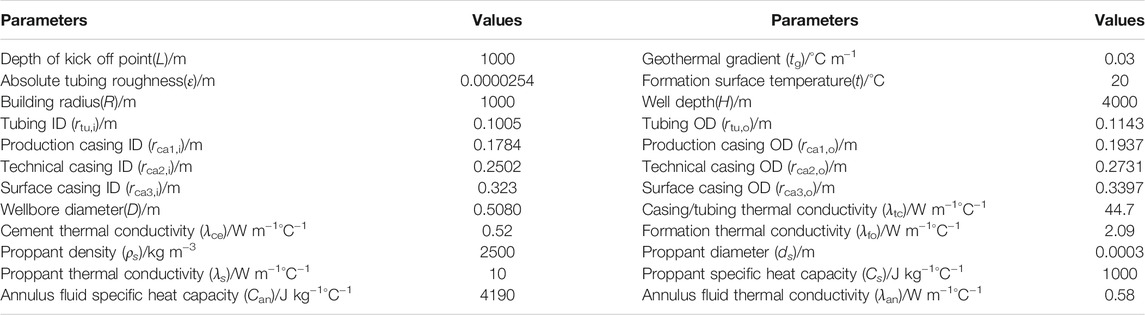
TABLE 2. The basic parameters of calculation.
The injection mass flow rate Qw is 80 kg/s, the foam quality Γ is 0.6, and the injection temperature ti, proppant volumetric concentration Csf, and injection pressure Pi are 20°C, 0.2, and 40 MPa, respectively. Figure 5 shows the pressure and friction changes of CO2 foam fracturing fluid in the wellbore. Figure 6 shows the changes in the temperature and foam quality in the wellbore.
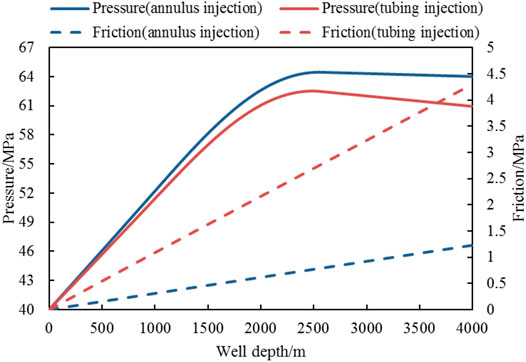
FIGURE 5. Changes of pressure and friction under different injection methods.
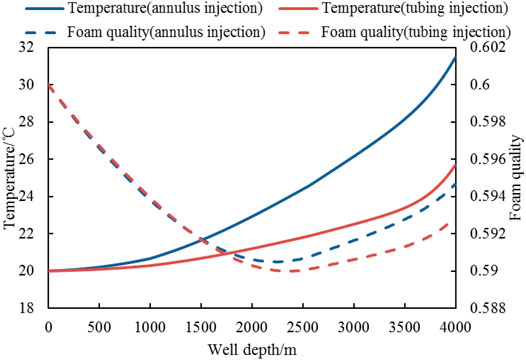
FIGURE 6. Changes in temperature and foam quality under different injection methods.
Figure 5 shows that the bottom hole pressure of annulus injections and tubing injection are 64.02 and 60.95 MPa, respectively. The bottom hole pressure of annulus injection is 3.07 MPa higher than that of tubing injection. The temperature curve of Figure 6 shows that the bottom hole temperature is 31.43°C and 25.66°C, respectively. The bottom hole temperature of the annulus injection method is 5.77°C higher than that of the tubing injection. The annulus cross-section is larger than that of the tubing, so during the injection process, the friction of the annulus injection is smaller than that of the tubing injection. Therefore, under the same injection pressure, the annulus injection has a higher bottom hole pressure. Xu’s study showed that the temperature increased with the increase of foam quality. The foam quality curve of Figure 6 shows that the foam quality of the annulus injection is greater than that of the tubing injection after the wellbore reaches 2,000 m, so the temperature in the annulus injection wellbore is higher than that of the tubing injection. The above results show that the use of annulus injection can achieve higher pressure, temperature, and lower frictional pressure loss.
Analysis of the Factors Affecting the Temperature and Pressure of the Fluid in the Wellbore Through Annulus Injection
The Influence of Injection Pressure
The injection mass flow rate Qw is 70 kg/s, the foam quality Γ is 0.6, and the injection temperature ti and proppant volumetric concentration Csf are 20°C and 0.2, respectively. Change the injection pressure Pi increases from 35 to 55 MPa with an interval of 5 MPa, and analyze the influence of injection pressure on temperature and pressure. Figure 7 shows the temperature and pressure changes of CO2 foam fracturing fluid in the wellbore.
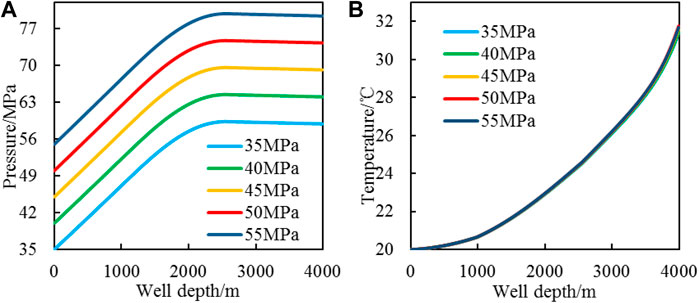
FIGURE 7. CO2 foam fracturing fluid pressure and temperature change with injection pressure [(A): pressure profile; (B): temperature profile].
The pressure calculation results in Figure 7 show that the wellbore pressure increases with the increase of well depth and stabilizes when CO2 foam fracturing fluid reaches the horizontal section. Every 5 MPa increase in injection pressure, the pressure in the wellbore will increase by 5 MPa uniformly. The pressure change is mainly caused by the increase in injection pressure. As the well depth increases, the pressure of the CO2 foam fracturing fluid in the wellbore also gradually increases. It can be seen from the temperature profile that the injection pressure increases by 20 MPa and the bottom hole temperature increase does not exceed 0.2°C, indicating that the temperature in the wellbore does not change with the pressure change.
The Influence of Foam Quality
The injection mass flow rate Qw, injection temperature ti, proppant volumetric concentration Csf, and injection pressure Pi are 70 kg/s, 20°C, 0.2, and 40 MPa, respectively. Change the foam quality Γ to increase from 0.5 to 0.9 with an interval of 0.1.
The results in Figure 8 show that changing the foam quality mainly has a greater impact on the temperature in the wellbore. The foam quality increases by 0.4, and the wellbore temperature increases by 3.8°C, a growth of 12.3%. Analysis of the reasons shows that the specific heat capacity of the gas phase is smaller than that of the liquid phase. As the foam quality increases, the specific heat capacity of CO2 foam fracturing fluid decreases, and the heat required to increase the same temperature is reduced, increasing the temperature of CO2 foam fracturing fluid in the wellbore. The increase in foam quality has little effect on pressure changes.
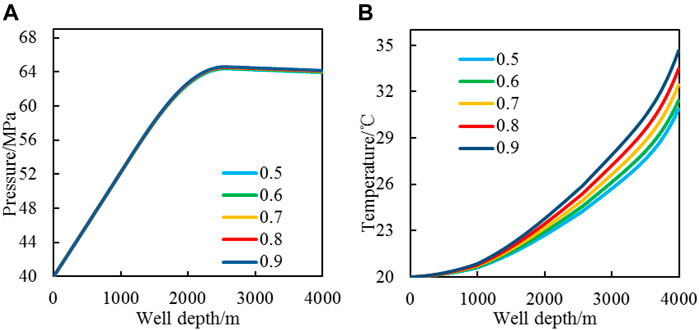
FIGURE 8. CO2 foam fracturing fluid pressure and temperature change with foam quality [(A): pressure profile; (B): temperature profile].
The Influence of Mass Flow Rate
The injection temperature ti, proppant volumetric concentration Csf, foam quality Γ, and injection pressure Pi are 20°C, 0.2, 0.6, and 40 MPa, respectively. Change the injection mass flow rate Qw to increase from 70 to 230 kg/s with an interval of 40 kg/s. Figure 9 shows the temperature and pressure changes of the CO2 foam fracturing fluid in the wellbore.
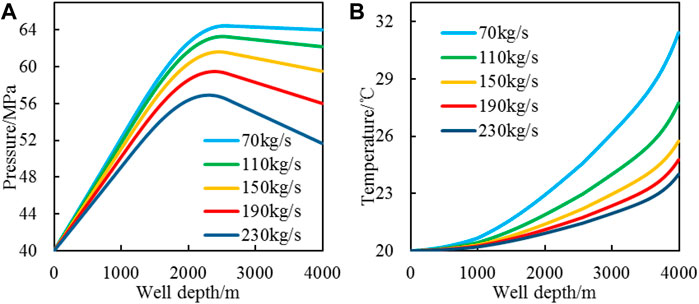
FIGURE 9. CO2 foam fracturing fluid pressure and temperature change with mass flow rate [(A): pressure profile; (B): temperature profile].
It can be seen from Figure 9 that the injection flow rate increases by 190 kg/s, the bottom hole pressure reduces 12.35 MPa, a decrease of 19.29%, and the bottom hole temperature reduces 7.42°C, a decrease of 23.61%. With the increase of the injection flow rate, the temperature and pressure decrease drastically, the pressure decrease rate increases with the increase of the injection flow rate, and the temperature decrease rate decreases with the increase of the injection flow rate. Analysis of the reasons shows that the increase of injection flow rate will lead to insufficient heat transfer and temperature drop because the contact time between fracturing fluid and wellbore is reduced. The increase of injection flow rate will also lead to frictional pressure loss increase between fracturing fluid and wellbore, making the pressure drop.
The Influence of Proppant Volumetric Concentration
The injection mass flow rate Qw, injection temperature ti, foam quality Γ, and injection pressure Pi are 70 kg/s, 20°C, 0.6, and 40 MPa, respectively. Change the proppant volumetric concentration Csf to increase from 0.1 to 0.3 with an interval of 0.05. The temperature and pressure changes of the CO2 foam fracturing fluid in the wellbore after changing the proppant volumetric concentration are shown in Figure 10.
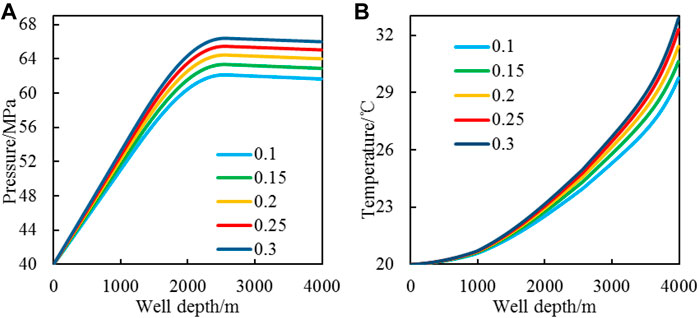
FIGURE 10. CO2 foam fracturing fluid pressure and temperature change with proppant volumetric concentration [(A): pressure profile; (B): temperature profile].
Figure 10 pressure profile shows that the increase of the proppant volumetric concentration causes the CO2 foam fracturing fluid pressure to increase because the hydrostatic pressure and density of the fracturing fluid increase with the proppant volumetric concentration increase. The temperature calculation results show that the bottom hole temperature only increases 3.13°C as the proppant volumetric concentration increases 0.2 because the specific heat capacity of the proppant is lower than that of the CO2 foam. As the proppant volumetric concentration increases, the CO2 foam fracturing fluid absorbs the same heat from the environment to obtain a higher temperature, but the influence of proppant volumetric concentration on bottom hole temperature is small.
The Influence of Injection Temperature
The injection mass flow rate Qw, proppant volumetric concentration Csf, foam quality Γ, and injection pressure Pi are 70 kg/s, 0.2, 0.6, and 40 MPa, respectively. The injection temperature ti is 24, 25, 26, 27, and 28°C. The influence of different injection temperatures on the temperature and pressure of the CO2 foam fracturing fluid in the wellbore is shown in Figure 11.
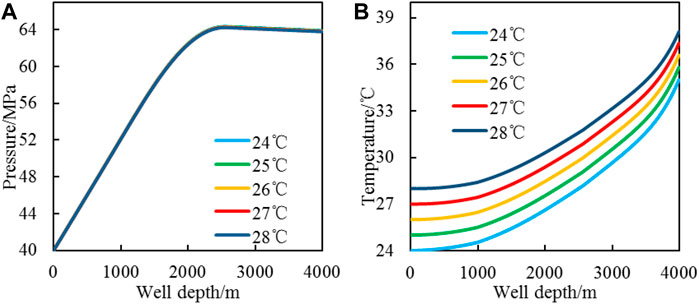
FIGURE 11. CO2 foam fracturing fluid pressure and temperature change with injection temperature [(A): pressure profile; (B): temperature profile].
Figure 11 shows that the higher the injection temperature, the higher the temperature in the wellbore. For every 1°C increase in the injection temperature, the bottom hole temperature increases by 0.8°C. Comparing the influence of injection temperature on the temperature distribution of CO2 foam fracturing fluid in the wellbore, the pressure change of the CO2 foam fracturing fluid in the wellbore is small.
The Influence of Geothermal Gradient
The injection mass flow rate Qw, proppant volumetric concentration Csf, injection temperature ti, foam quality Γ, and injection pressure Pi are 70 kg/s, 0.2, 20°C, 0.6, and 40 MPa, respectively. Change the geothermal gradient to increase from 0.03°C/m to 0.05°C/m with an interval of 0.005. Figure 12 shows the temperature and pressure changes of CO2 foam fracturing fluid in the wellbore.
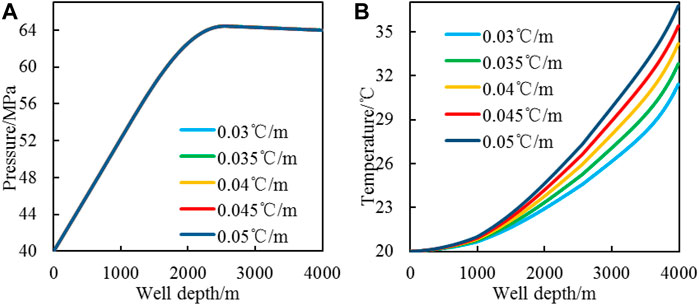
FIGURE 12. CO2 foam fracturing fluid pressure and temperature change with geothermal gradient [(A): pressure profile; (B): temperature profile].
The increase of the geothermal gradient will cause the formation temperature to rise. The temperature difference between formation and wellbore CO2 foam fracturing fluid increases and heat transfer increases. From the temperature calculation results in Figure 12, the temperature in the wellbore gradually increases with the geothermal gradient increase and the bottom hole temperature increases by 1.4°C for every increase of the geothermal gradient by 0.005°C/m. The geothermal gradient has a small influence on the pressure distribution in the wellbore.
Study on the Phase State of CO2 Foam Fracturing Fluid in the Wellbore
According to the previous study, the pressure and temperature of CO2 foam fracturing fluid increase with the increase of well depth. When the pressure and temperature reach 7.38 MPa and 31.1°C, the CO2 phase will change to a supercritical state (Zhang et al., 2017). Supercritical CO2 is a dense, low-viscosity fluid with excellent hole cleaning capabilities. Kolle (2000) by studying the phase change of CO2, the well depth when CO2 changes into a supercritical state can be obtained, which provides a basis for the design of fracturing parameters in the field. In this paper, the injection pressure has exceeded 7.38 MPa. If the temperature exceeds 31.1°C, it can indicate that the CO2 has reached the supercritical state. Through the random combination of the above six factors, the well depth when the CO2 foam fracturing fluid reaches the critical temperature under different factors is obtained.
Through analysis of the influence of six factors on supercritical state, the main factors are proppant volumetric concentration Csf, foam quality Γ, mass flow rate Qw, injection temperature ti and geothermal gradient tg. These five factors are randomly combined to obtain the well depth data when the CO2 foam fracturing fluid reaches the critical temperature, as shown in Table 3, where W is the well depth when the CO2 foam fracturing fluid reaches the critical temperature, m.
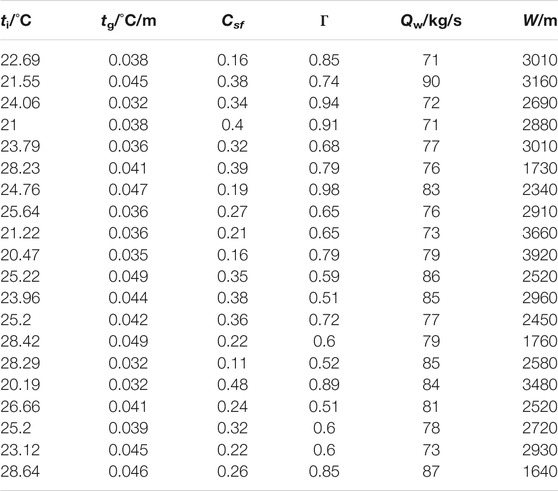
TABLE 3. Well depth at supercritical.
After normalizing the above data, Eq. 25 is obtained by fitting, where R2 = 0.997.
It can be seen from Eq. 25 that the well depth when reaching the critical temperature decreases with the increase of proppant volumetric concentration, injection temperature, foam quality, geothermal gradient, and injection temperature, and increases with the increase of injection mass flow rate. In the design of fracturing parameters, reducing the injection mass flow rate, increasing the injection temperature, proppant volumetric concentration, and foam quality, CO2 can be transformed into a supercritical state in a shallow well depth to improve the fracturing effect.
Conclusion
Under the same conditions, compared with tubing injection, the annulus injection of CO2 foam fracturing can effectively increase the pressure and temperature in the wellbore and reduce the frictional pressure loss during the flow of CO2 foam fracturing fluid.
The pressure and temperature in the wellbore of the annulus injected CO2 foam fracturing fluid decrease with the increase of the mass flow rate. The mass flow rate increased by 190 kg/s, and the bottom hole pressure and temperature decreased by 12.35 MPa and 7.42°C, respectively. The increase of mass flow rate is not conducive to the transformation of CO2 into a supercritical state.
The proppant volumetric concentration, foam quality, injection temperature, and geothermal gradient are positively correlated with the temperature, while the injection flow rate is negatively correlated with the temperature. Under the permitting construction conditions, increasing the injection temperature, proppant volumetric concentration, and foam quality is conducive to the transition of CO2 to a supercritical state.
Data Availability Statement
The original contributions presented in the study are included in the article/Supplementary Material. Further inquiries can be directed to the corresponding author.
Author Contributions
HL and GP contributed to conception and design of the study. GP conducts numerical model establishment, verification, and influencing factor analysis. HL wrote the manuscript. All authors contributed to manuscript revision and read and approved the submitted version.
Funding
This research was supported by the National Natural Science Foundation of China (No. 51874098).
Conflict of Interest
The authors declare that the research was conducted in the absence of any commercial or financial relationships that could be construed as a potential conflict of interest.
Publisher’s Note
All claims expressed in this article are solely those of the authors and do not necessarily represent those of their affiliated organizations, or those of the publisher, the editors and the reviewers. Any product that may be evaluated in this article, or claim that may be made by its manufacturer, is not guaranteed or endorsed by the publisher.
References
Ahmed, S., Elraies, K. A., Forooozesh, J., Bt Mohd Shafian, S. R., Hashmet, M. R., Hsia, I. C. C., et al. (2017). Experimental Investigation of Immiscible Supercritical Carbon Dioxide Foam Rheology for Improved Oil Recovery. J. Earth Sci. 28 (5), 835–841. doi:10.1007/s12583-017-0803-z
An, Z., Li, Z., Huang, S., Lv, Q., Jia, Z., et al. (2014). Flow Pattern of Nitrogen Foam Fracturing Fluid in Horizontal Pipe. Sci. Technol. Eng. 14 (35), 220–224. doi:10.7623/syxb202110011
Carter, R. H., Holditch, S. A., and Wolhart, S. L. (1996). “Results of a 1995 Hydraulic Fracturing Survey and a Comparison of 1995 and 1990 Industry Practices,” in SPE Annual Technical Conference and Exhibition (Denver, Colorado: OnePetro).
Cheng, Y., Li, G., Wang, H., Shen, Z., and Fan, A. (2013). Feasibility Analysis on Coiled-Tubing Jet Fracturing with Supercritical CO2. Oil Drilling Prod. Technol. 35 (06), 73–77. doi:10.13639/j.odpt.2013.06.004
Cong, Z., Li, Y., Pan, Y., Liu, B., Shi, Y., Wei, J., et al. (2022). Study on CO2 Foam Fracturing Model and Fracture Propagation Simulation. Energy 238, 121778. doi:10.1016/j.energy.2021.121778
Faroughi, S. A., Pruvot, A. J.-C. J., and McAndrew, J. (2018). The Rheological Behavior of Energized Fluids and Foams with Application to Hydraulic Fracturing: Review. J. Pet. Sci. Eng. 163, 243–263. doi:10.1016/j.petrol.2017.12.051
Friehauf, K. E., and Sharma, M. M. (2009a). A New Compositional Model for Hydraulic Fracturing with Energized Fluids. SPE Prod. Operations 24 (04), 562–572. doi:10.2118/115750-pa
Friehauf, K. E., and Sharma, M. M. (2009b). “Fluid Selection for Energized Hydraulic Fractures,” in SPE Annual Technical Conference and Exhibition (Calgary, Alberta: Society of Petroleum Engineers). doi:10.2118/124361-ms
Gu, M., and Mohanty, K. K. (2014). Effect of Foam Quality on Effectiveness of Hydraulic Fracturing in Shales. Int. J. Rock Mech. Mining Sci. 70, 273–285. doi:10.1016/j.ijrmms.2014.05.013
Guo, J., and Zeng, J. (2015). A Coupling Model for Wellbore Transient Temperature and Pressure of Fracturing with Supercritical Carbon Dioxide[J]. Acta Petrolei Sinica 36 (02), 203–209.
Guo, J., Zeng, J., Zhang, R., and Zhou, C. (2015). A Dual Transient Coupling Model for Wellbore of Carbon Dioxide Injection Well. Acta Petrol. Sinica 36 (08), 976–982. doi:10.7623/syxb201508008
Gupta, A. P., Gupta, A., and Langlinais, J. (2005). “Feasibility of Supercritical Carbon Dioxide as a Drilling Fluid for Deep Underbalanced Drilling Operation,” in SPE Annual Technical Conference and Exhibition (Calgary, Alberta: Society of Petroleum Engineers). doi:10.2118/96992-ms
He, J., Afolagboye, L., Lin, C., and Wan, X. (2018). An Experimental Investigation of Hydraulic Fracturing in Shale Considering Anisotropy and Using Freshwater and Supercritical CO2. Energies 11 (3), 557. doi:10.3390/en11030557
He, Z., Li, G., Tian, S., Wang, H., Shen, Z., and Li, J. (2016). SEM Analysis on Rock Failure Mechanism by Supercritical CO 2 Jet Impingement. J. Pet. Sci. Eng. 146, 111–120. doi:10.1016/j.petrol.2016.04.023
Kolle, J. J. (2000). “Coiled-tubing Drilling with Supercritical Carbon Dioxide,” in SPE/CIM international conference on horizontal well technology (Calgary, Alberta: Society of Petroleum Engineers). doi:10.2118/65534-ms
Li, C., Huang, Y., Sun, X., Gao, R., Zeng, F., Tontiwachwuthikul, P., et al. (2017). Rheological Properties Study of Foam Fracturing Fluid Using CO 2 and Surfactant. Chem. Eng. Sci. 170, 720–730. doi:10.1016/j.ces.2017.03.022
Li, S., Li, Z., Lin, R., and Li, B. (2010). Modeling of Sand Cleanout with Foam Fluid for Vertical Well. SPE J. 15 (03), 805–811. doi:10.2118/120449-pa
Li, Y., Jia, D., Rui, Z., Peng, J., Fu, C., and Zhang, J. (2017). Evaluation Method of Rock Brittleness Based on Statistical Constitutive Relations for Rock Damage. J. Pet. Sci. Eng. 153, 123–132. doi:10.1016/j.petrol.2017.03.041
Li, Z., Wang, D., and Huang, S. (2008). The Coupling Mathematical Model for Foam Fluid Flowing in Wellbore. J. Southwest Pet. University(Science Technol. Edition) 30 (06), 1–201. doi:10.3863/j.issn.1000-2634.2008.06.001
Luo, X., Wang, S., Wang, Z., Jing, Z., and Lv, M. (2014). Experimental Research on Rheological Properties and Proppant Transport Performance of GRF-CO2 Fracturing Fluid. J. Pet. Sci. Eng. 120, 154–162. doi:10.1016/j.petrol.2014.06.009
McAndrew, J., Cisternas, P., Pruvot, A., Kong, X., and Tong, S. (2017). “Water Consumption and Proppant Transport Aspects of Foam Fracturing Fluids,” in Unconventional Resources Technology Conference, 24-26 July 2017 (Austin, Texas: Society of Exploration Geophysicists, American Association of Petroleum Geologists, Society of Petroleum Engineers), 1027–1034.
Moridis, G. (2018). Literature Review and Analysis of Waterless Fracturing Methods. Berkeley, CA (United States): Lawrence Berkeley National Lab. (LBNL).
Shao, Y., Liu, J., Xi, B., Sun, J., Qu, C., Song, H., et al. (2019). Drilling Fluid Invasion Law for Reservoir with Medium-Low Porosity and Permeability. Well Logging Technol. 43 (1), 70–74. doi:10.16489/j.issn.1004-1338.2019.01.013
Shen, Z., Wang, H., and Li, G. (2010). Feasibility Analysis of Coiled Tubing Drilling with Supercritical Carbon Dioxide. Pet. Exploration Develop. 37 (06), 743–747. doi:10.1016/s1876-3804(11)60008-6
Sherif, T., Ahmed, R., Shah, S., and Amani, M. (2016). Rheological Correlations for Oil-Based Drilling Foams. J. Nat. Gas Sci. Eng. 35, 1249–1260. doi:10.1016/j.jngse.2016.09.064
Song, W., Ni, H., Wang, R., Sun, B., and Shen, Z. (2017a). Pressure Transmission in the Tubing of Supercritical Carbon Dioxide Fracturing. J. CO2 Utilization 21, 467–472. doi:10.1016/j.jcou.2017.08.012
Song, W., Ni, H., Wang, R., and Zhao, M. (2017b). Wellbore Flow Field of Coiled Tubing Drilling with Supercritical Carbon Dioxide. Greenhouse Gas Sci. Technol. 7 (4), 745–755. doi:10.1002/ghg.1685
Song, Y., Li, Z., Jiang, Z., and Luo, Q. (2017). Progress and Development Trend of Unconventional Oil and Gas Geological Research. Pet. Exploration Develop. 44 (4), 638–648. doi:10.1016/s1876-3804(17)30077-0
Span, R., and Wagner, W. (1996). A New Equation of State for Carbon Dioxide Covering the Fluid Region from the Triple‐Point Temperature to 1100 K at Pressures up to 800 MPa. J. Phys. Chem. reference Data 25 (6), 1509–1596. doi:10.1063/1.555991
Sun, F., Yao, Y., Chen, M., Li, X., Zhao, L., Meng, Y., et al. (2017). Performance Analysis of Superheated Steam Injection for Heavy Oil Recovery and Modeling of Wellbore Heat Efficiency. Energy 125, 795–804. doi:10.1016/j.energy.2017.02.114
Sun, F., Yao, Y., and Li, X. (2018). The Heat and Mass Transfer Characteristics of Superheated Steam Coupled with Non-condensing Gases in Horizontal wells with Multi-point Injection Technique. Energy 143, 995–1005. doi:10.1016/j.energy.2017.11.028
Sun, X., Du, M., Han, B., Sun, Y., Zhao, M., Guan, B., et al. (2017). Review on Carbon Dioxide Fracturing Technology. Oilfield Chem. 34 (02), 374–380. doi:10.19346/j.cnki.1000-4092.2017.02.035
Tan, K., and Qiao, J. (2020). Development History and prospect of Remote Sensing Technology in Coal Geology of China. Int. J. Coal Sci. Technol. 7 (2), 311–319. doi:10.1007/s40789-020-00323-2
Tang, J., Fan, B., Xiao, L., Tian, S., Zhang, F., Zhang, L., et al. (2021). A New Ensemble Machine-Learning Framework for Searching Sweet Spots in Shale Reservoirs. SPE J. 26 (01), 482–497. doi:10.2118/204224-pa
Tang, J., Wu, K., Zuo, L., Xiao, L., Sun, S., and Ehlig–Economides, C. (2019). Investigation of Rupture and Slip Mechanisms of Hydraulic Fractures in Multiple-Layered Formations. SPE J. 24 (05), 2292–2307. doi:10.2118/197054-pa
Tang, Y., Li, R., and Wang, S. (2020). Research Progress and Prospects of Coal Petrology and Coal Quality in China. Int. J. Coal Sci. Technol. 7 (2), 273–287. doi:10.1007/s40789-020-00322-3
Tong, S., Gu, M., Singh, R., and Mohanty, K. K. (2019). Proppant Transport in Foam Fracturing Fluid during Hydraulic Fracturing. J. Pet. Sci. Eng. 182, 106279. doi:10.1016/j.petrol.2019.106279
Tong, S., Singh, R., and Mohanty, K. K. (2017). “Proppant Transport in Fractures with Foam-Based Fracturing Fluids,” in SPE Annual Technical Conference and Exhibition (Calgary, Alberta: Society of Petroleum Engineers).
Wang, H., Shen, Z., and Li, G. (2012). A Wellbore Flow Model of Coiled Tubing Drilling with Supercritical Carbon Dioxide. Energy Sourc. A: Recovery, Utilization, Environ. Effects 34 (14), 1347–1362. doi:10.1080/15567036.2010.520065
Wang, H., Shen, Z., and Li, G. (2011). Wellbore Temperature and Pressure Coupling Calculation of Drilling with Supercritical Carbon Dioxide. Pet. Exploration Develop. 38 (1), 97–102.
Wang, S., Sun, D., Du, W., Geng, D., Bai, R., and Wang, Y. (2020). Evaluation Method of Shale Brittleness index. Well Logging Technol. 44 (3), 294–299. doi:10.16489/j.issn.1004-1338.2020.03.015
Wang, T., Xu, Y., Jiang, J., et al. (2010). The Technology of Annulus Hydraulic-Jet Fracturing with Coiled Tubing. Nat. Gas Industry 30 (01), 65–143. doi:10.3787/j.issn.1000-0976.2010.01.018
Wanniarachchi, W. A. M., Ranjith, P. G., Perera, M. S. A., Rathnaweera, T. D., Zhang, D. C., and Zhang, C. (2018). Investigation of Effects of Fracturing Fluid on Hydraulic Fracturing and Fracture Permeability of Reservoir Rocks: An Experimental Study Using Water and Foam Fracturing. Eng. Fracture Mech. 194, 117–135. doi:10.1016/j.engfracmech.2018.03.009
Xie, J., Tang, J., Yong, R., Fan, Y., Zuo, L., Chen, X., et al. (2020). A 3-D Hydraulic Fracture Propagation Model Applied for Shale Gas Reservoirs with Multiple Bedding Planes. Eng. Fracture Mech. 228, 106872. doi:10.1016/j.engfracmech.2020.106872
Xu, Z., Song, X., Li, G., Wu, K., Pang, Z., and Zhu, Z. (2018). Development of a Transient Non-isothermal Two-phase Flow Model for Gas Kick Simulation in HTHP Deep Well Drilling. Appl. Therm. Eng. 141, 1055–1069. doi:10.1016/j.applthermaleng.2018.06.058
Xu, Z., Wu, K., Song, X., Li, G., Zhu, Z., and Sun, B. (2019). A Unified Model to Predict Flowing Pressure and Temperature Distributions in Horizontal Wellbores for Different Energized Fracturing Fluids. SPE J. 24 (02), 834–856. doi:10.2118/194195-pa
Yekeen, N., Padmanabhan, E., and Idris, A. K. (2018). A Review of Recent Advances in Foam-Based Fracturing Fluid Application in Unconventional Reservoirs. J. Ind. Eng. Chem. 66, 45–71. doi:10.1016/j.jiec.2018.05.039
Yi, L.-P., Li, X.-G., Yang, Z.-Z., and Li, Y. (2019). Wellbore Temperature and Pressure Calculation Model for Coiled Tubing Drilling with Supercritical Carbon Dioxide. Energ. Sourc. Part A: Recovery, Utilization, Environ. Effects 41 (8), 959–974. doi:10.1080/15567036.2018.1522394
Yu, D., Hu, Q., and Tan, D. (2013). Current Situation of Coiled Tubing Sandblast Perforation Sandpack Annular Fracture Technology. China Pet. Machinery 41 (12), 112–117. doi:10.3969/j.issn.1001-4578.2013.12.026
Zhang, J., Li, Y., Pan, Y., Wang, X., Yan, M., Shi, X., et al. (2021). Experiments and Analysis on the Influence of Multiple Closed Cemented Natural Fractures on Hydraulic Fracture Propagation in a Tight sandstone Reservoir. Eng. Geology. 281, 105981. doi:10.1016/j.enggeo.2020.105981
Zhang, X., Lu, Y., Tang, J., Zhou, Z., and Liao, Y. (2017). Experimental Study on Fracture Initiation and Propagation in Shale Using Supercritical Carbon Dioxide Fracturing. Fuel 190, 370–378. doi:10.1016/j.fuel.2016.10.120
Nomenclature
A initial values
B initial values
C initial values
Cp specific heat capacity, J/(kg°C)
Csf proppant volumetric concentration
d diameter, m
f friction coefficient
F friction, Pa
g gravity acceleration, m/s2
h heat transfer coefficient, W/(m2·°C)
H Well depth, m
ID inner diameter, m
K consistency index of power-law fluids, Pa∙sn
l casing length, m
L Depth of kick off point, m
m Mass, kg
n flow behavior index of power-law fluids
OD outer diameter, m
p fluid pressure, MPa
Pi injection pressure, MPa
q volume flow rate, m3/s
Q mass flow rate, kg/s
Qw injection mass flow rate, kg/s
r radius, m
Re Reynolds number
Rec critical Reynolds number
tg Geothermal gradient, °C/m
ti injection temperature, °C
T temperature, °C
v fluid velocity, m/s
V volume, m3
W well depth when the CO2 foam fracturing fluid reaches the critical temperature, m
z one-dimensional coordinate along the wellbore trajectory, m
Subscripts
an annulus fluid
ca1 production casing
ca2 technical casing
ca3 surface casing
ce1 cement layer for production casing
ce2 cement layer for technical casing
ce3 cement layer for surface casing
f CO2 foam fracturing fluid
fo formation
g internal phase
i inner radius
l external phase
n normalizing data
o outer radius
ref reference condition
s proppant
tu tubing
Greek letters
α volume expansion coefficient, °C−1
β isothermal volume modulus of the external phase, Pa
λtu-an thermal conductivity between the tubing and the annulus fluid, W/(m·°C)
λan-ca1 thermal conductivity between the annulus fluid and the production casing, W/(m·°C)
λca1-ce1 thermal conductivity between the production casing and the cement layer, W/(m·°C)
θ inclination angle
ρ density of CO2 foam fracturing fluid, kg/m3
Γ foam quality
Φ the Helmholtz energy
ΦO the ideal gas part of Helmholtz energy; represents
Φr the residual fluid part of Helmholtz energy
δ the reduced density
τ the inverse reduced temperature
ε Absolute tubing roughness, m
Keywords: CO2 foam, temperature distribution, pressure distribution, multi-field coupling, annulus injection
Citation: Li H and Peng G (2022) Flow Simulation and Influence Factors Analysis of CO2 Foam Fracturing in Annulus Injection. Front. Earth Sci. 9:807788. doi: 10.3389/feart.2021.807788
Received: 02 November 2021; Accepted: 29 November 2021;
Published: 17 January 2022.
Edited by:
Jizhou Tang, Tongji University, ChinaReviewed by:
Meng Wang, University of Houston, United StatesChunkai Fu, University of Louisiana at Lafayette, United States
Wan Cheng, China University of Geosciences Wuhan, China
Copyright © 2022 Li and Peng. This is an open-access article distributed under the terms of the Creative Commons Attribution License (CC BY). The use, distribution or reproduction in other forums is permitted, provided the original author(s) and the copyright owner(s) are credited and that the original publication in this journal is cited, in accordance with accepted academic practice. No use, distribution or reproduction is permitted which does not comply with these terms.
*Correspondence: Genbo Peng, MTE3MzczNjUxN0BxcS5jb20=