- 1College of Resources and Security, Chongqing University, Chongqing, China
- 2China Coal Technology Engineering Group Huaibei Blasting Technology Research Institute Limited Company, Huaibei, China
This study aims to effectively control the effects of blast vibrations and improve the safety factor for personnel and facilities in blasting engineering. Using high-precision digital electronic detonators according to the propagation and superposition principle of blasting vibration signals, a superposition prediction method based on single-hole blasting vibration waveform is proposed to determine the group-hole blasting vibration waveform. Experimental results show that the variation law of the predicted blasting vibration wave is consistent with that of the measured blasting vibration wave, and the error rate is less than 16%. Based on the proposed superposition prediction method, the variation law of particle vibration velocity peak with micro-differences in time is studied. Consequently, an optimal differential time interval (delay time) is obtained with regard to the blasting vibration reduction. The results are applied in a site leveling project, and the results show that the slight time difference between zones has an evident effect on vibration reduction. The maximum reduction achieved with the proposed method is superior (69.7%) to that obtained via other controlled blasting delay methods. This result has been successfully applied in a flat project in China.
Introduction
Effective control of blasting vibration damage is one of the major problems in the field of engineering blasting that needs in-depth exploration (Deng and Chen, 2021). Blasting vibrations tend to affect the structural stability and construction environment (Liu et al., 2020). With a continuous increase in the in-depth understanding of engineering construction, surrounding environment, resource mining, national defense engineering, and reconstruction engineering, the impact of blasting vibrations on the environment has been elucidated well (Qiang et al., 2016). In the blasting process of mines containing goaf (Jiang et al., 2016; Fan et al., 2018b; Fan et al., 2019; Fan et al., 2020b), the energy generated by the explosion in the blasting hole propagates to the rock mass medium in the form of seismic waves and then accumulates and dissipates, thereby weakening its stability.
The main way to reduce the effect of blasting vibrations is to adopt an appropriate differential time. Fish (Wang, 2007) was the first to determine that when the blasting vibration waves differ by half a period, the vibration waves are superimposed and weakened, thus reducing the amplitude of blasting vibrations (Iwano et al., 2020). Jimeno (1995) and Tripathy and Gupta (2002) indicated that blasting vibration could generally be represented by an equation comprising the explosive quantity, wave propagation distance, blasting parameters, and rock characteristics at each millisecond. Jiang et al. (2019) and Zheng and Amp (2018) used this equation to transform the prediction model of blasting vibration velocity based on the Sadovsky model by considering the elevation and cumulative damage of rock mass, thereby revealing the propagation and attenuation law of vibrations in the blasting area. However, the differential time associated with vibration reduction could not be predicted accurately.
Currently, the Sadovsky formula and empirical coefficient method are the two main methods used in blasting engineering.
where V is the particle vibration velocity, Q is the section charge, R is the distance from the measuring point to the center of the blast zone, K is the site condition coefficient, and α is the attenuation index of blasting vibration.
However, the actual test results show that it is necessary to perform multiple blasting vibration tests in the blasting site while utilizing the maximum number of measuring points. It is noteworthy that more accurate values of K and α can only be obtained using the nonlinear regression method. Although the correlation coefficient of regression analysis meets the requirements, when K and α are used to guide the prediction of an unknown blasting vibration velocity, the calculation error associated with the peak value of blasting vibration in areas close to the blast zone is large; that is, it exceeds 200%, and the error is greater than 30% even in areas far from the blast zone. This is because the formula is put forward according to the ketone chamber blasting experiment, and deep-hole blasting uses millisecond detonating tube detonators that comprise a delay relay in both internal and external networks. Furthermore, a small delay interval, continuous holes, and an insufficient study period render this formula inapplicable for calculating the peak value associated with small intervals of millisecond delay blasting vibrations. Moreover, the traditional blasting system, regardless of whether it is electric or nonelectric, uses a detonator that depends on the delayed effects of chemical agents to form the blasting network. The micro-delay time of this detonator is limited to multiples of 25 ms, which does not allow it to accurately set a micro-delay.
With the advent of digital electronic detonators, the micro-differences in the time of high-precision digital electronic detonators can be arbitrarily set at 1 ms, making it possible to reduce the blasting vibration effect through an accurately designed initiation network (Chi et al., 2015) and thus gradually commencing the research on the use of delay time to reduce blasting vibrations. Han et al. (2019) determined the amplitude variation associated with the vibration velocity of the superimposed signal that occurred due to distance changes using the equal-interval two-segment superposition method and established a probability model to quantitatively analyze the influence of the delay error on the vibration reduction via seismic wave interference. Liu and Chen (2019) analyzed the time–frequency characteristics of the superposition signal of a single row of holes using the single-stage blasting vibration signal and proposed the variation rule of the millisecond blasting superposition signal. Qiu et al. (2017) used MATLAB to analyze the time–frequency characteristics of two stages of superimposed signals with different intervals, defined the energy reduction rate in combination with HHT energy and analyzed the vibration reduction effect of different blasting parameters on short superimposed blasting signals. However, the majority of existing research has been performed at a laboratory scale, and the results have not been corroborated with parameters in actual blasting engineering.
Ye et al. (2014) used the approximate optimization test method in the Jin Duicheng open-pit mine to compare the selection range of the differential time associated with the optimal vibration reduction rate. Combined with the dimensional analysis theory, Zhong et al. (2016) discussed the influencing factors of the blasting vibration duration and deduced its prediction formula; the linear correlation of the formula reached 89.7%. Based on the principle of linear superposition of seismic waves, the delay interval of millisecond blasting with different core distances was calculated. Although these studies have determined the delay associated with the vibration reduction differential time, they have limited the test site and geological conditions. For example, when mining soft rock with low stress (Fan et al., 2018a; Fan et al., 2020a; Kang et al., 2021) in China, the geological conditions are completely different from those of coal and metal mines; therefore, numerous engineering tests must still be performed after the site changes.
Accordingly, Anderson (1985) proposed the theory of using linear superposition to simulate and predict multi-row blasting, elaborated the basic assumptions of simulation and prediction, and successfully predicted the porous shock wave associated with the delayed initiation of high-precision detonators according to the theoretical model. Based on the linear superposition proposed by Hinzen (1988), a hybrid prediction method that combines field and computed measurements is proposed. The predicted waveform is obtained by a convolution operation between the measured single-hole waveform and the pulse train of each hole. However, the random deviations in actual blasting engineering are not considered. Ma et al. (2021) analyzed the blasting failure mechanism, failure mode, and real-time damage evolution laws of homogeneous surrounding rock and horizontal layered surrounding rock for single-hole porous blasting; this was aimed at determining unstable conditions under blasting loads, such as collapse and spalling of tunnels with the horizontal layered surrounding rock.
In this study, blasting vibration waveforms have been calculated with a high-precision digital electronic detonator. A single-hole blasting vibration signal acquisition method has been implemented using the MATLAB software (Lv and Lv, 2011), in which single-hole blasting signals under different differential times are stacked. Subsequently, the time–frequency characteristics of blasting vibration signals, the peak value of blasting vibrations, and the error rate associated with the blasting vibration peak value are calculated. This study introduces the concept of “vibration reduction rate” and determines the variation rule of the high-precision blasting vibration signal with micro-delay time, which is used to guide the selection of micro-delay time for reducing vibrations in subsequent blasting construction; this rule was verified using experiments.
Overlay of Blasting Vibration Signals
Signal Superposition Principle
Under the same geological conditions, single-hole blasting vibration signals travel from the blast zone to the measuring point position. Meanwhile, group-hole blasting vibration signals can be summed up in a single waveform for a selected delay time. Combining superimposition results (Yang et al., 2011), the waveform expression can be written as:
where S(T) is the total blasting vibration velocity at the measured point, T is a certain moment in the blasting vibration process, and Ki is the charge coefficient of the I subsection. When blasting parameters, such as the charge amount and explosive type, in each subsection are the same and the topographic and geological conditions from the detonation source to the measuring point exhibit little difference, then 1; S (t-ti) is the particle vibration velocity generated after the detonation of the i-sublevel explosive; ti is the time taken by seismic waves to travel from the source to the measuring point after the explosion in subsection i; n is the number of segments; and δ(t) is the unit step signal (Farsangi, 2015), whose expression is:
In Eq. 1, S (t-ti) can be obtained through a single-hole blasting test. Therefore, when the blasting parameters of each section are the same along with the geological and topographic conditions of rock mass within the blasting range, the single-hole vibration signals of any measuring point can be superimposed.
Realization of Blasting Vibration Signal Superposition in MATLAB
By using the data processing, calculation, programming, and visualization functions of MATLAB, the blasting vibration signals are superimposed based on the principle of signal superposition via the following steps:
Step 1: Prediction of the maximum blasting vibration velocity of the particle. Using the xlsread function of MATLAB, the document is read under the specified path of the single-hole blasting vibration signal. The selection of an optimal single-hole blasting vibration signal involved the measurement of the vertical, radial, and tangential velocities of blasting vibrations, maximum number of blasting holes (stack section), and delay time Δt to determine the total waveform duration. In the FOR cycle, the superimposed group-hole blasting waveform with a set delay time is realized, and the maximum blasting particle vibration velocity is predicted.
Step 2: Fitting the relationship curve between different delay times and the maximum blasting particle vibration velocity. Here, we determine the sampling frequency, set the delay time associated with the vibration instrument in the range of 1–100 ms, measure the single-hole blasting vibration signal under different delay times for each superposition cycle, and define the maximum blasting vibration velocity to compute the delay time and obtain its relationship curve with the maximum blasting particle vibration velocity.
Step 3: Fitting the relationship curve between different delay times and vibration reduction rate.
Blasting Test
The blasting seismic wave interference is used to reduce the peak value of blasting vibration velocity and control secondary disasters (Wang et al., 2020). From the viewpoint of the signal superposition principle, the influence of a minor time difference on the blasting vibration velocity peak is analyzed. The flexibility and accuracy associated with the delay time of a high-precision digital electronic detonator (Agrawal and Mishra, 2018) are utilized to greatly improve the selectivity and stability of the delay in the blasting network.
Test Steps
The implementation steps are as follows:
1) Select an appropriate hole in the blasting area to collect single-hole blasting vibration data: To collect complete single-hole blasting data and eliminate the influence of seismic waves in the main blasting area on the vibration data of single-hole blasting, the waveform of the final blasting hole is considered the single-hole blasting vibration signal, and the delay interval between the final blasting hole and the penultimate one should exceed 500 ms.
2) Determine the radial distance of each measuring point from the explosion point of single-hole blasting: A number of vibrometers (not less than 3) are arranged. The vibrometers are arranged in the bedrock, or the vibrometer is wedged into the ground with the vibration oscillator.
3) Collect single-hole and group-hole blasting vibration data and record on-site blasting parameters, including the hole position, measuring point distance, hole depth, propagation medium, single hole charge, hole row spacing, and blasting network.
4) Select the appropriate single hole blasting vibration signal, analyze the collected single hole blasting vibration data with the MATLAB software, input the design delay time of group hole blasting under n segments, and predict the complete blasting vibration waveform at the measuring point as well as the maximum group-hole blasting vibration velocity.
5) Fit the relationship curve between different delay times and the maximum blasting particle vibration velocity, as well as the relationship curve between different micro-differences in time and vibration reduction rate (using MATLAB).
6) Based on the predicted results of the program, perform multiple on-site blasting vibration tests under the same geological conditions and the same blasting parameters to verify the optimal blasting network delay.
Obtaining Vibration Data of Single Hole Blasting
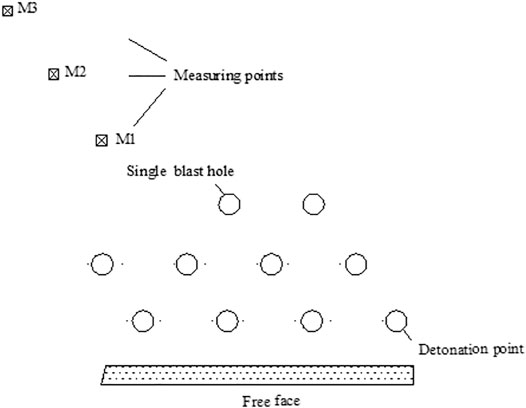
According to the test implementation steps, the final hole in group-hole blasting was selected for single-hole blasting, and the delay interval between the penultimate holes of single-hole blasting and group-hole blasting was set at 500 ms. The positions of holes and measuring points are shown in Figure 1.
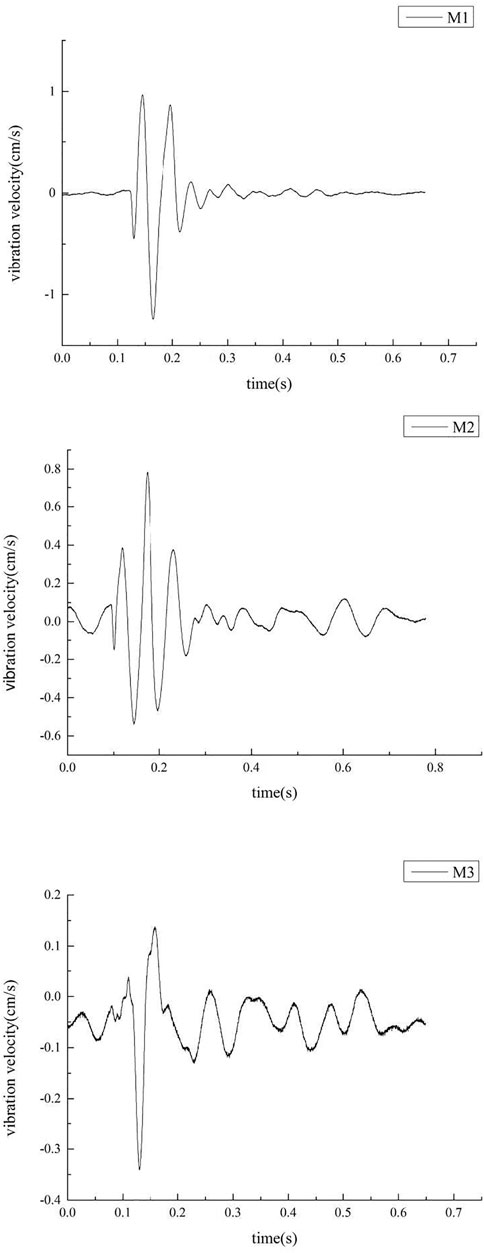
Figure 2 shows the vibration data of single-hole blasting at three measuring points. These monitoring points were arranged in the near and far radial directions of each vibration measurement area and denoted as M1, M2, and M3. Table 1 shows the parameters of single-hole blasting and the measured peak value of vibration velocity associated with single-hole blasting.
Prediction and Analysis of Blasting Vibration Waveform
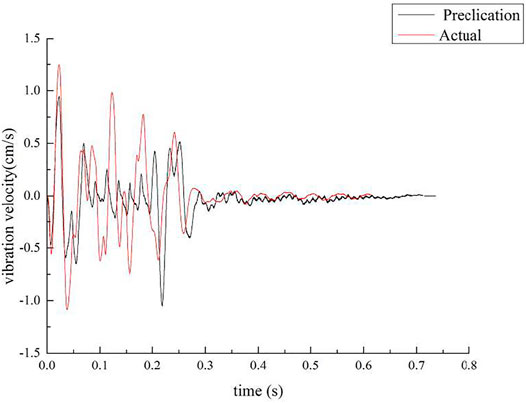
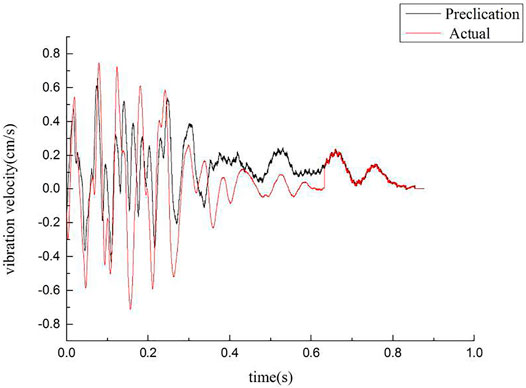
Before group-hole blasting, based on existing blasting design parameters, the single-hole vibration waveform with the highest vibration speed in the three channels is selected. The prediction program in this study has been used to perform numerical simulation of the group-hole blasting vibration waveform for 10 cycles of superposition under a delay time of 22 ms; the simulated waveform is compared with the measured group-hole blasting vibration data. Waveform distortion is observed at measuring point 3. Simulated and measured vibration waveforms associated with group-hole blasting at measuring points 1 and 2 are shown in Figures 3 and 4.
Figures 3 and 4 show that the predicted blasting vibration waveforms at two different positions are basically consistent with the measured blasting vibration waveforms, and the periods of vibration enhancement and weakening last for similar durations. The predicted blasting vibration waveforms in this study basically reflect the variation trend of blasting vibration waveforms at each measuring point. Table 2 shows that the measured peak vibration velocity (VA) at the two vibrating measurement points is close to the predicted peak vibration velocity (VP); the error rate is less than 16%, which is significantly lower than that obtained with the regression prediction analysis method based on the Sadovsky formula (Lu et al., 2007). It can be proved that the prediction method used for blasting vibration velocity peak is effective and reliable.
Prediction of Time of Deviation
When the main vibration frequencies are similar, the intensity of blasting vibration is mainly reflected by the maximum blasting vibration velocity; consequently, the relationship curve between different delay times and the maximum blasting particle vibration velocity can be obtained (Figure 5).
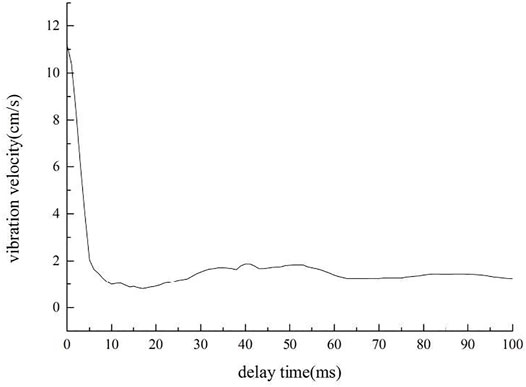
FIGURE 5. Relationship curve between different delay times and maximum blasting particle vibration velocity.
The “vibration reduction rate” is used to describe the weakening degree of the maximum vibration velocity after the vibration signal of single-hole blasting is superimposed for n times. Subsequently, the difference in the maximum vibration velocity is calculated after the superposition of the homogeneous explosion (the delay time is 0 ms) and different delay times. Then, the ratio of the differential value to the velocity of the homogeneous explosion is used to measure the vibration reduction rate:
where V0 is the maximum blasting particle vibration velocity associated with the homogeneous explosion, and Vi is the maximum blasting particle vibration velocity with different delay times in N segments. Eq. 3 can be programmed to obtain the change curve of the vibration reduction rate and delay time (Figure 6).
During the entire period with micro-differences in time (0–100 ms), the peak value of the stacking signal associated with group-hole blasting increased and decreased to different degrees with the micro-differences in time. At 18 ms, the maximum vibration reduction rate was 92.5% when compared with that of the full-blown blasting; this is not in accordance with the interference damping theory of “Δt = T/2” (25 ms), with half the main wave period (Chen et al., 2011). This is because the blasting vibration signal is a typical nonstationary random signal with the characteristics of short time and quick mutation (Yi et al., 2011).
The variation rule of vibration signals of superimposed group-hole blasting with micro-differences in time is as follows: the peak value of the superimposed signal decreases rapidly with the generation of micro-differences in time. The vibration reduction rate of signals of group-hole blasting ranges from 16 to 20 ms, thereby exceeding 91.5%. The maximum rate of decline reached up to 18 ms, reaching 92.5%. When the reduction rate exceeds 60 ms, the delay time for blasting vibration signals exhibits a straight line, which is close to the single-hole blasting vibration signal peak. At this time, each vibration signal interference between the main vibration superposition effect is eliminated, and the group-hole vibration signal acts independently as a single-hole blasting vibration signal.
Test Verification and Analysis
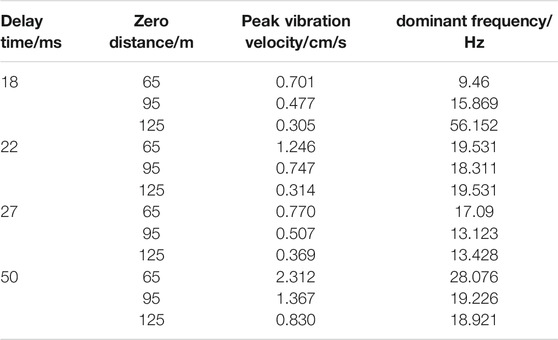
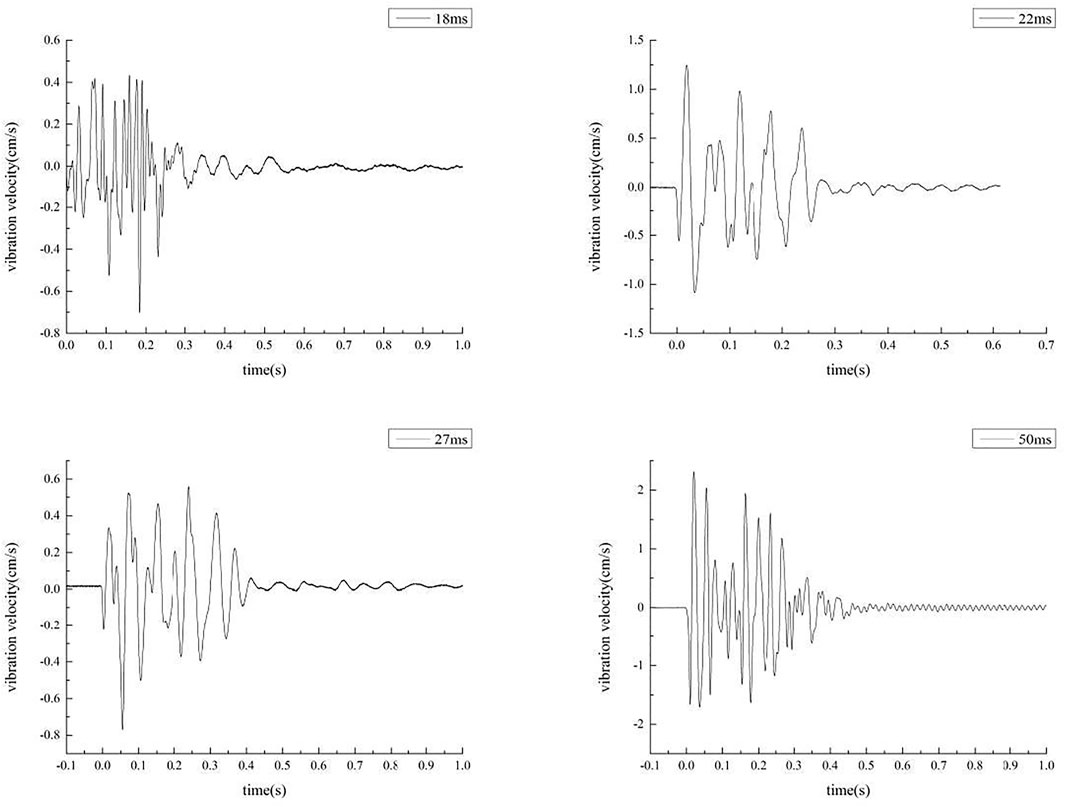
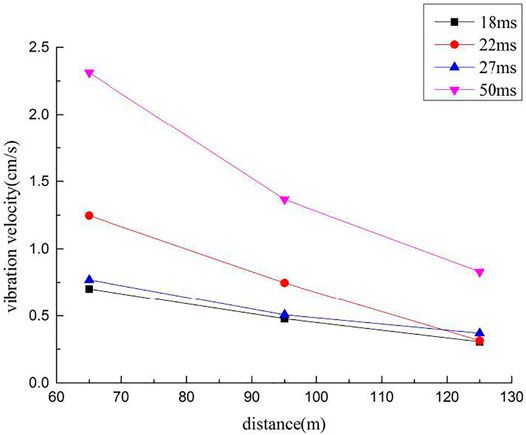
Four group-hole blasting tests were performed in a limestone stope in Hangzhou. The field experimental instruments included the Sichuan Tuopu NUBOX-8016 blasting vibration monitor and Zhonghaida GPS measuring instrument (Rao and Cai, 2016; Ling et al., 2018). The Nubox-8016 Blasting Vibration Monitor has three channels. It usually measures vibration components in three directions at a certain point, among which the largest component is selected; the largest component is generally found in the vertical channel after the tests. The accuracy of the predicted blasting vibration delay time was verified through the measured blasting vibration velocity peak at different delay times in the blasting test. The parameters of group-hole blasting and single-hole blasting are consistent along with four geological conditions. The diameter of blasting holes is 120 mm, hole depth is 10 m, hole network parameters are 5 m × 4 m, the single-hole charge is 49 kg, the number of holes is 10, and the total blasting charge is 490 kg. There is no interval coupling charge, and one digital electronic detonator is installed in each hole. Digital electronic detonators have been selected among the four experimental rows to form a micro-difference initiation network, with micro-differences in time being 18, 22, 27, and 50 ms. The measured peak value of group-hole blasting vibration velocity is shown in Table 3. The attenuation law of the blasting vibration velocity at measuring point M1 for the four monitoring times is shown in Figure 7.
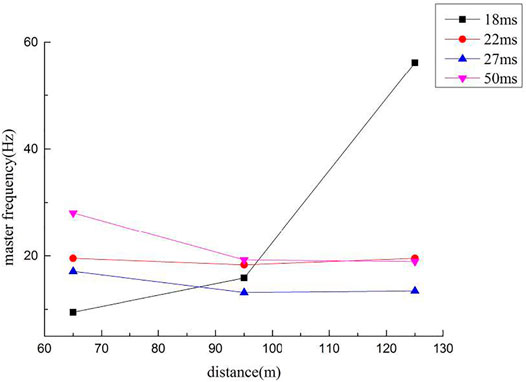
Through the analysis of the vibration velocity peaks at 12 measuring points in four groups of test areas with different micro-differences in time, it is found that the main frequency associated with blasting vibration at each measuring point is basically maintained within 9–20 Hz, and the effect of micro-differences in time on the main vibration frequency is not evident. At 65 m, when the delay time is 18 ms, the maximum value of blasting vibration velocity measured at S1 is 0.701 cm/s. At 95 m, when the delay time is 18 ms, the maximum value of the minimum blasting vibration velocity measured at S1 is 0.477 cm/s. At 125 m, the minimum blasting vibration velocity peak is 0.305 cm/s at S1, and the delay time is 18 ms.
When the delay time is 18 ms, the blasting vibration velocity peak value at each measuring point is lower than that at delay times of 22, 27, and 50 ms; this proves that the proposed superposition prediction method based on single-hole blasting vibrations adopted is consistent with the practical results.
According to Figures 8 and 9, during blasting seismic wave propagation, the peak value of blasting vibration velocity decreases continuously with an increase in the distance from the blast center. The main frequency of blasting vibration basically continues to be in a fixed range, and only a few measuring points exhibit abrupt changes in the main frequency. With a change in the difference time at the same measuring point, the peak value of blasting vibration velocity decreases to different degrees, and the main vibration frequency of blasting vibration does not change significantly. In areas close to the blasting zone, the vibration can be reduced by 69.7% with a change in the micro-differences in time. In areas at intermediate and higher distances from the blasting zone, the vibration reduction effect remains comparable with a change in the micro-differences in time. For the optimal delay time of the vibration reduction effect (18 ms), the vibration reduction effect is not evident; however, the blasting vibration frequency is significantly increased, which plays a certain protective role for the structure (its own frequency is generally less than 10 Hz).
In a flat project in China, engineers and technicians performed blasting operations according to this method and selected several delay times to monitor vibrations in the project; they obtained the vibration reduction effect observed in this study, which proved that a delay time range of 16–20 ms is effective for vibration reduction.
Conclusion
1) This study uses MATLAB for performing numerical simulations to predict the group-hole blasting vibration waveform through the single-hole blasting vibration waveform, which in turn consistently follows the variation law of the measured blasting vibration waveform. The error rate of the peak velocity associated with group-hole blasting vibration is less than 16%, thereby rendering the proposed method more effective and reliable than the traditional prediction method.
2) From 0 to 100 ms, the reduction rate of blasting vibration intensity is evident in the range of 16–20 ms. When it reaches more than 60 ms, the group-hole vibration signal acts independently as a single-hole blasting vibration signal.
3) The interference superposition of blasting vibration signals can be realized using a high-precision digital electronic detonator to change the micro-differences in time. In areas close to the blasting zone, the micro-difference in time has a significant effect on vibration reduction, which can be reduced by up to 69.7%. In areas that are at intermediate and greater distances from the blasting zone, the effect of micro-differences in time on vibration reduction is similar. Before blasting construction, vibration intensity can be effectively controlled at different distances using a small delay time.
4) This study analyzes the influence of delay time on the blasting vibrations of an open-pit mine and achieves precise control of delay time to reduce the harmful effect of seismic waves. The proposed method can also be used for areas sensitive to blasting vibrations, such as salt mines and the upper rock mass of mined-out areas. However, it is also necessary to control the maximum single response charge and realize a reasonable charge structure to reduce the vibration hazard.
Data Availability Statement
The raw data supporting the conclusion of this article will be made available by the authors without undue reservation.
Author Contributions
RL, ZZ, and DJ designed experiments. FL, JC, and YL conducted experiments. FL and RL wrote and analyzed experimental data; FL wrote the main manuscript and prepared figures. All authors reviewed the manuscript.
Funding
This study was supported by the Fundamental Research Funds for the Special Key Project of Chongqing Technology Innovation and Application Development (cstc2019jscx-tjsbX0015), the National Natural Foundation of China (NSFC, grant numbers 51904039), and the State Key Program of National Natural Science of China (NSFC, grant numbers 51834003).
Conflict of Interest
FL, ZZ, JC, and YL are with the China Coal Technology Engineering Group Huaibei Blasting Technology Research Institute Limited Company.
The remaining authors declare that the research was conducted in the absence of any commercial or financial relationships that could be construed as a potential conflict of interest.
Publisher’s Note
All claims expressed in this article are solely those of the authors and do not necessarily represent those of their affiliated organizations or those of the publisher, the editors, and the reviewers. Any product that may be evaluated in this article, or claim that may be made by its manufacturer, is not guaranteed or endorsed by the publisher.
References
Agrawal, H., and Mishra, A. K. (2018). Evolution of Digital Detonators as an Intelligent Tool for Control Blasting in Indian Mines. Ann. de Chim. Sci. des Matériaux 41 (3-4), 157–171. doi:10.3166/acsm.41.157-171
Anderson, D. A. (1985). A Method Site-specific Prediction and Control of Ground Vibration from Blasting. Proc. Lst Symp. Explosives Blasting Research, 28–42.
Chen, S., Yan, Y., Qi, G., Zhang, X., and Zhang, W. (2011). Analysis of Influencefactors of Interference Vibration Reduction of Millisecond Blasting. Rock and Soil Mechanics 32, 3003–3008.
Chi, E. A., Zhao, M. S., and Kang, Q. (2015). “Study on Blasting Vibration Reduction Technology by Digital Detonator,” in 5th International Conference on Advanced Design and Manufacturing Engineering (ICADME)), 1326–1331. doi:10.2991/icadme-15.2015.245
Deng, K., and Chen, M. (2021). Blasting Excavation and Stability Control Technology for Ultra-high Steep Rock Slope of Hydropower Engineering in China: a Review. Eur. J. Remote Sensing 54, 92–106. doi:10.1080/22797254.2020.1752811
Fan, J., Jiang, D., Chen, J., Liu, W., Ngaha, W. T., and Chen, J. (2018a). Fatigue Performance of Ordinary concrete under Discontinuous Cyclic Loading. Construction Building Mater. 166, 974–981. doi:10.1016/j.conbuildmat.2018.01.115
Fan, J., Jiang, D., Liu, W., Wu, F., Chen, J., and Daemen, J. J. K. (2019). Discontinuous Fatigue of Salt Rock with Low-Stress Intervals. Int. J. Rock Mech. Mining Sci. 115, 77–86. doi:10.1016/j.ijrmms.2019.01.013
Fan, J., Liu, W., Jiang, D., Chen, J., Ngaha, W. T., Chen, J., et al. (2018b). Thermodynamic and Applicability Analysis of a Hybrid CAES System Using Abandoned Coal Mine in China. Energy 157, 31–44. doi:10.1016/j.energy.2018.05.107
Fan, J., Liu, W., Jiang, D., Chen, J., Ngaha, W. T., and Daemen, J. J. K. (2020a). Time Interval Effect in Triaxial Discontinuous Cyclic Compression Tests and Simulations for the Residual Stress in Rock Salt. Rock Mech. Rock Eng. 53 (9), 4061–4076. doi:10.1007/s00603-020-02150-y
Fan, J., Xie, H., Chen, J., Jiang, D., Li, C., Tiedeu, W. N., et al. (2020b). Preliminary Feasibility Analysis of a Hybrid Pumped-Hydro Energy Storage System Using Abandoned Coal Mine Goafs. Appl. Energ. 258. doi:10.1016/j.apenergy.2019.114007
Farsangi, M. (2015). Blast Vibration Modeling Using Linear Superposition Method. Journal of Mining and Environment 6 (2), 125–140.
Hai-Wang, Y. E., Wang, L., Zhang, Y. J., Zhao, C. X., Xiao-Zong, A. I., and Wang, Y. K. (2014). Damping Blasting Field experiment with Digital Detonator in Jinduicheng Open-Pit Mine. China Mining Magazine.
Han, L., Hongjiang, L. I., Liu, D., Ling, T., Chen, L. I., Liang, S., et al. (2019). Probability Analysis for Influence of Time-Delay Error of Detonators on Superposed Seismic Wave Vibration Reduction. J. Vibration Shock 38 (3), 96–101+124. doi:10.13465/j.cnki.jvs.2019.03.014
Hinzen, K.-G. (1988). Modelling of Blast Vibrations. Int. J. Rock Mech. Mining Sci. Geomechanics Abstr. 25 (6), 439–445. doi:10.1016/0148-9062(88)90984-9
Iwano, K., Hashiba, K., Nagae, J., and Fukui, K. (2020). Reduction of Tunnel Blasting Induced Ground Vibrations Using Advanced Electronic Detonators. Tunnelling Underground Space Tech. 105, 103556. doi:10.1016/j.tust.2020.103556
Jiang, D., Fan, J., Chen, J., Li, L., and Cui, Y. (2016). A Mechanism of Fatigue in Salt under Discontinuous Cycle Loading. Int. J. Rock Mech. Mining Sci. 86, 255–260. doi:10.1016/j.ijrmms.2016.05.004
Jiang, W., Tang, C., Cheng, G., and Zhang, Q, Resources S.O, and Environment (2019). Study on Propagation and Attenuation of Blasting Vibration in Complex Environment. Ind. Minerals Process. 48 (10), 19–22+27. doi:10.16283/j.cnki.hgkwyjg.2019.10.006
Kang, Y., Fan, J., Jiang, D., and Li, Z. (2021). Influence of Geological and Environmental Factors on the Reconsolidation Behavior of fine Granular Salt. Nat. Resour. Res. 30 (1), 805–826. doi:10.1007/s11053-020-09732-1
Ling, T., Cao, F., Zhang, S., Zhang, L., and Gu, D. (2018). Blast Vibration Characteristics of Transition Segment of a branch Tunnel. Zhendong yu Chongji/Journal of Vibration and Shock 37 (2), 43–50.
Liu, R., He, Y., Zhao, Y., Jiang, X., and Ren, S. (2020). Tunnel Construction Ventilation Frequency-Control Based on Radial Basis Function Neural Network. Automation in Construction 118, 103293. doi:10.1016/j.autcon.2020.103293
Liu, X. M., and Chen, S. H. (2019). Prediction of Surface Vibration Waveform Caused by Cuthole Blasting in Tunneling. Chin. J. Geotechnical Eng. 41 (9), 1731–1737. doi:10.11779/CJGE201909018
Lu, T., Shi, Y. Q., Huang, C., Li, H. B., and Li, J. R. (2007). Study on Attenuation Parameters of Blasting Vibration by Nonlinear Regression Analysis. Rock Soil Mech. 28 (9), 1871–1878.
Lv, S., and Lv, S. (2011). “Applying BP Neural Network Model to Forecast Peak Velocity of Blasting Ground Vibration,” in 1st International Symposium on Mine Safety Science and Engineering (ISMSSE)). doi:10.1016/j.proeng.2011.11.2166
Ma, L. H., Jiang, X., Chen, J., Zhao, Y. F., Liu, R., and Ren, S. (2021). Analysis of Damages in Layered Surrounding Rocks Induced by Blasting during Tunnel Construction. Int. J. Str. Stab. Dyn. 21 (07), 2150089. doi:10.1142/s0219455421500899
Qiang, Y., Xingguo, Y., and Hongtao, L. I. (2016). Review on Status Quo and prospect of Assessment Methods for comfort under Blasting Vibration. J. Vibration Shock 35 (22), 152–160+175. doi:10.13465/j.cnki.jvs.2016.22.023
Qiu, X., Shi, X., Zhou, J., Huang, D., and Chen, X. (2017). On Vibration Reduction Effect of Short Millisecond Blasting by High-Precision Detonator Based on HHT Energy Spectrum. Explosion and Shock Waves 37 (1), 107–113.
Rao, Z., and Cai, S. (2016). The Blasting Test and Blasting Vibration Monitoring of Vertical Crater Retreat Mining Method in the Luohe Iron Mine. Geotechnical & Geological Engineering 34, 1047–1056. doi:10.1007/s10706-016-0025-7
Tripathy, G. R., and Gupta, I. D. (2002). Prediction of Ground Vibrations Due to Construction Blasts in Different Types of Rock. Rock Mech. Rock Engng 35 (3), 195–204. doi:10.1007/s00603-001-0022-9
Wang, J. Y. (2007). Superposition Method of Blasting Vibration and its Application in Open-Pit Mine. Wuhan University of Technology.
Xianyang, Q., Xiuzhi, S., Jian, Z., Dan, H., and Xin, C. (2017). On Vibration Reduction Effect of Short Millisecond Blasting by High-Precision Detonator Based on HHT Energy Spectrum. Explosion and Shock Waves.
Yang, Nianhua., and Zhang, Le. (2011). Superposition Simulation and Prediction Model Based on Single Hole Blasting Vibration Wave. China: Chinese Society of Theoretical and Applied Mechanics, 43–50.
Yang, Y., Sun, W., and Li, S. F. (2011). “Research to Blasting Vibration Distribution of an Open Pit Mine Based on Wavelet Packet Theory,” in 3rd International Conference on Mechanical and Electronics Engineering (ICMEE 2011)), 1547–1555. doi:10.4028/www.scientific.net/amm.130-134.1547
Ye, H., Wang, L., Zhang, Y., Zhao, C., Ai, X., and Wang, Y. (2014). Damping Blasting Field Experiment With Digital Detonator in Jin Duicheng Open-Pit Mine. China Mining Magazine 23 (12), 136–139+146.
Yi, Y., Wei, S., and Shu, F. L. (2011). Research to Blasting Vibration Distribution of an Open Pit Mine Based on Wavelet Packet Theory. Applied Mechanics and Materials.
Zheng, R. B., and Amp, C. H. (2018). Analysis of Blasting Vibration Velocity Prediction Model in Complex Environment. Engineering Blasting 24 (6), 75–79+90.
Keywords: high-precision, digital electronic detonator, blasting vibration, waveform superposition, delay time, vibration reduction rate
Citation: Lin F, Liu R, Zhang Z, Jiang D, Chen J and Li Y (2022) Reduction of Blasting Induced Ground Vibrations Using High-Precision Digital Electronic Detonators. Front. Earth Sci. 9:804504. doi: 10.3389/feart.2021.804504
Received: 29 October 2021; Accepted: 28 December 2021;
Published: 10 February 2022.
Edited by:
Alexandre Chemenda, UMR7329 Géoazur (GEOAZUR), FranceReviewed by:
Claudia Finger, Fraunhofer IEG—Fraunhofer Research Institution for Energy Infrastructures and Geothermal Systems, GermanyKunlun Hu, Anhui University of Science and Technology, China
Laishan Chang, University of Science and Technology Liaoning, China
Copyright © 2022 Lin, Liu, Zhang, Jiang, Chen and Li. This is an open-access article distributed under the terms of the Creative Commons Attribution License (CC BY). The use, distribution or reproduction in other forums is permitted, provided the original author(s) and the copyright owner(s) are credited and that the original publication in this journal is cited, in accordance with accepted academic practice. No use, distribution or reproduction is permitted which does not comply with these terms.
*Correspondence: Rong Liu, Y3F1X2xpdXJvbmdAY3F1LmVkdS5jbg==
 Fei Lin
 Rong Liu
 Zhigang Zhang2
 Deyi Jiang