- 1National Institute of Natural Hazards, MEMC, Beijing, China
- 2Institute of Disaster Prevention, He Bei, China
- 3China Coal Research Institute, Beijing, China
- 4Department of Earth Science, Western University, London, ON, Canada
- 5Faculty of Engineering, The University of Hong Kong, Hong Kong, Hong Kong SAR, China
Soil slopes, located near rivers or the sea, often get damaged dramatically under seismic action due to the high groundwater level. To determine the failure mechanism, this study proposed an analytical method for a composite critical slip surface of a multi-layer slope considering the effects of the excess pore water pressure using the Newmark’s method and variational principle. Based on this, a method for evaluating the effects of the excess pore water pressure on the permanent displacement of the slope under seismic action was established, and influence mechanisms of the excess pore water pressure on failure modes of the multi-layer bank slope at different groundwater levels were studied. The research results show that slip surfaces basically have same shapes at different groundwater levels; however, with the rise of the groundwater level, soil above a seepage line is not affected by the excess pore water pressure, and its sliding scale slightly changes. For soil below the seepage line influenced by the excess pore water pressure, the slip surface constantly extends to the interior of the slope, resulting in the increase in the sliding scale. Due to the cumulative increase in the excess pore water pressure, the bank slope at different groundwater levels is generally manifested as shear sliding at the slope toe and tensile fracture at the top. Finally, based on the shaking table test, the proposed method was verified to be reasonable and accurate. This research provides a simple and reliable method for slope engineering technicians to evaluate the stability of water-rich soil slopes.
Introduction
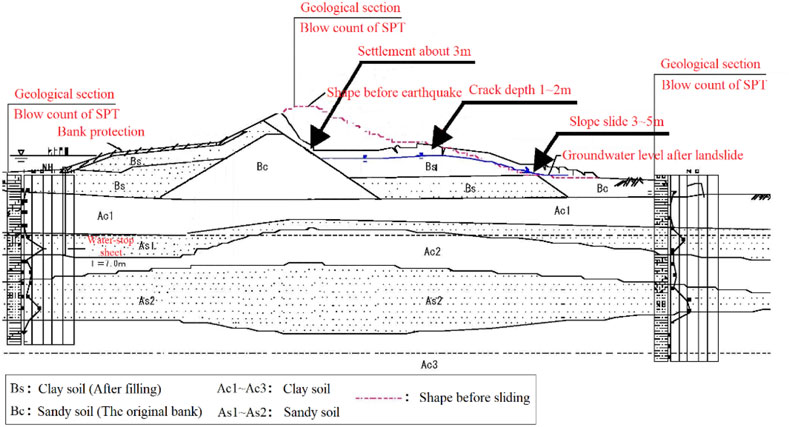
With the advancement of construction goals of “the Belt and Road Initiative” and “Maritime Silk Road,” a large number of marine engineering projects are developing far out in the sea of China and most of the water transportation projects are located in strong earthquake areas. Bank slopes are widely involved in water transportation engineering (Zhang et al., 2020). Different from general road slopes, one side of a bank slope is immersed in water all year round and the internal groundwater level is higher. The excess pore water pressure can be produced under seismic action so that the slope is very likely to slide and collapse (Wang and Sassa, 2009; Huang et al., 2018). For example, during an earthquake in Miyagi Prefecture, Japan, in July 2003, a lot of river bank slopes were seriously damaged, most of which were caused by the principal earthquake (Ms = 6.2). There was a settlement of about 3 m at the top of a bank slope and the slope toe protruded to the road outside the slope for 3–5 m as shown in Figure 1. Therefore, coastal or riverside slopes are more prone to sliding and collapse under seismic action due to a high water content. Determining the seismic stability of such slopes to take engineering protective measures for technical reinforcement and prevent engineering accidents in time is of great significance.
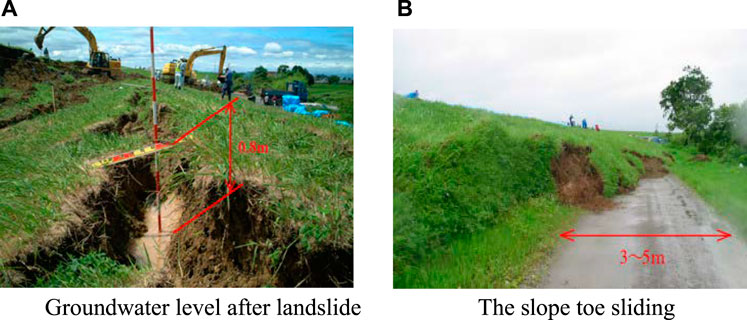
FIGURE 1. Sliding failure of a river bank slope during the earthquake. (A) Groundwater level after landslide. (B) The slope toe sliding.
For seismic stability analysis of a slope, the design methods recommended in specifications (American Society of Civil Engineers, 2014; JTS146-2012, 2012; Faccioli et al., 2005) in the world mainly include the quasi-static method, time history analysis method, and Newmark’s sliding block displacement method. Of them, the quasi-static method is relatively simple and practical and easy to master by engineering designers, so at present, it has been widely used in specifications of various nations in the world. However, this method only provides one stability index (safety factor) and cannot offer displacement information related to failure surfaces, so it fails to determine the initial sliding position and sliding surface of the slope. The time history analysis method is a nonlinear analysis method, which inputs the seismic acceleration record in the basic motion equation of the structure and performs the integral operation to obtain the seismic effects of the structure in the whole-time history. However, due to large calculation workload, this method is difficult for general engineering designers to master quickly and is not practical in actual engineering. The Newmark’s sliding block displacement method integrates the advantages of the above two methods. It can consider the time cumulative effects of the earthquake, more specifically describe deformation information of sliding blocks, and determine a critical sliding surface of the slope. When the Newmark’s sliding block displacement method is used to analyze the seismic stability of a slope, it is necessary to solve two problems: one is to determine the critical slip surface and the other is to calculate the permanent displacement. At present, slip surfaces of soil slopes are mostly assumed to be circular arcs and logarithmic spirals. Leshchinsky et al. (2016) pointed out that the shape of the logarithmic spiral slip surface obtained by Baker and Garber (1978) based on variational principle is consistent with those obtained by the supremum theorem and proposed the permanent deformation analysis method combined with the Newmark’s method. Based on the Newmark’s method, Huang et al. (2014) considered the slip surface of a homogeneous soil slope as a logarithmic spiral slip surface and put forward a simplified calculation method for the permanent displacement of the slope, considering effects of earthquake-induced excess pore water pressure. Through a Newmark’s rigid-plastic sliding block model, Wang et al. (2016) derived calculation equations for the yield acceleration and permanent displacement of the slope with the logarithmic spiral linear slip surface. Moreover, the calculation model for the permanent displacement of the slope under seismic action was optimized and solved. However, the slope is mostly assumed as homogeneous in seismic stability analysis of the slope using the Newmark’s method in previous studies. This is mainly because the composite critical slip surface of the multi-layer slope cannot be represented by a single logarithmic spiral and it is difficult to carry out analytical calculation.
Furthermore, for a bank slope, the excess pore water pressure is the main factor that causes its destruction under earthquake aciton (Du and Chen, 2018; Cao et al., 2019; Huang et al., 2020). In the seismic stability analysis of the slope with the Newmark’s method, how the excess pore water pressure affects the critical slip surface and permanent displacement, especially for the multi-layer slope, is another important problem to be solved in this study. There have been many studies on cumulative development of the excess pore water pressure under seismic action (Chiaradonna et al., 2020; Carey et al., 2017; Hidemasa et al., 2018; Fattah et al., 2016). However, most of the previous studies have been carried out through indoor tests and numerical simulation (Gordan et al., 2016) and mainly focus on changes of the excess pore water pressure of soil under seismic action and its influences on the slope stability. Although physical modeling is an effective way to investigate the seismic behaviors of soil slopes with the influence of the excess pore water pressure, it is unrealistic for engineers to apply the approach in practical engineering. By far, most engineers still adopt the limit equilibrium method with which they are more familiar. These methods are widely documented in geotechnical literatures and use principles of static equilibrium to evaluate the balance of driving and resisting forces. These methods will not consider the excess pore water pressure (Ishii et al., 2012).
To sum up, the Newmark’s method for analyzing the seismic stability of the slope has been widely used. However, for calculation of the permeant deformation of multi-layer slopes, especially slopes with a high groundwater level, how to determine the composite critical slip surface and what is the effect of excess pore water pressure on multi-layer slope are problems urgent to be solved. Based on this, the method for determining the composite critical slip surface of the multi-layer slope was proposed based on the Newmark method and variational principle. By combining with the proposed simplified calculation method of the earthquake-induced excess pore water pressure (Huang et al., 2021), this research put forward the method for calculating the permanent displacement of the multi-layer slope considering effects of the excess pore water pressure. On this basis, influence mechanisms of the excess pore water pressure on failure of the bank slope at different groundwater levels were analyzed. Moreover, the method was verified to be reasonable and accurate through the shaking table test.
Calculation Method for the Permanent Displacement of the Multi-Layer Slope
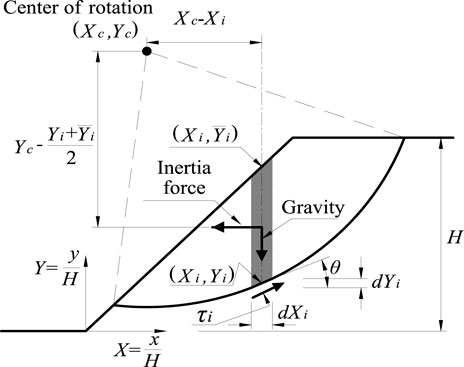
There are many methods to calculate the logarithmic spiral critical slip surface of the slope in the Newmark’s method, among which the calculation method based on variational principle is widely recognized. Before introducing the proposed calculation method for the critical slip surface of the multi-layer slope, this study first introduced the calculation process of the logarithmic spiral critical slip surface of a homogeneous slope based on the variational principle, as shown in Figure 2.
As displayed in Figure 2, a sliding body is simplified as a rigid body in the calculation of the logarithmic spiral slip surface of the homogeneous slope, and its resisting moment and down-sliding moment relative to the center of rotation satisfy Eq. 1 of rotational equilibrium,
where
According to the standardized coordinate system based on the slope height H in Figure 2, calculation methods for different rotational moments can be obtained from Eqs 2–4 by taking the slope toe as the coordinate origin,
where Xi, Yi, and
The groundwater level in the bank slope is a factor that cannot be ignored. Under seismic action, the coupling effect of earthquake and groundwater can also produce the excess pore water pressure. Therefore, it is necessary to consider the effects of sliding force of the sliding body induced by the pore water pressure in Eq. 1 of rotational equilibrium. The effects of the excess pore water pressure are mainly obtained through use of a simplified calculation method proposed in the existing study (Huang et al., 2021), as demonstrated in
where
Through Eqs. 7 and 8, the pore water pressure on the critical slip surface can be determined as follows:
Eq. 1 for rotational equilibrium can be changed into
where
For the shape of the logarithmic spiral critical slip surface, Eqs 11 and 12 can be used for calculation,
where XC and YC indicate the polar coordinates of a logarithmic spiral and A and β represent the constant of the logarithmic spiral and the angle relating to the position of the inclined plane, respectively. Here, β is the angle of counterclockwise rotation around the polar coordinates of the logarithmic spiral from the vertical direction to the point (X, Y) on the slip surface. The yield acceleration asy can be calculated by substituting the safety factor Fs of 1.0 of slope stability in Eq. 2 into equilibrium Eq. 1. Furthermore, for the critical slip surfaces of the multi-layer slopes with different soil strengths, they cannot be expressed by a single logarithmic spiral. Therefore, the research refers to variational solutions to slopes with discontinuous soil strength proposed by Baker and Garber (1978), namely, the slip surfaces of each layer in the multi-layer slope are logarithmic spirals, that is, the slip surfaces are same in shape. Based on the above analysis, although the logarithmic spiral slip surfaces have different constants, their polar coordinates in various layers of the slope are same.
In conclusion, the shapes of logarithmic spirals of slip surfaces in each layer can be obtained by
where ψmj and Aj separately represent the standardized internal friction angle and constant of the logarithmic spiral of the jth layer, respectively.
To determine the shapes of logarithmic spirals in each layer of the slope, it is necessary to set unified polar coordinates, constants of logarithmic spirals, boundaries of each layer, and polar coordinates β of the upper or lower end of the slip surface, as shown in Figure 3.
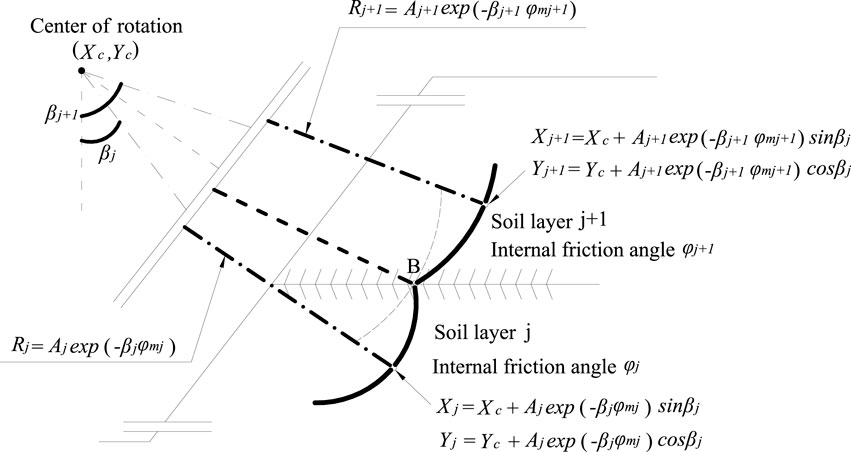
FIGURE 3. Calculation diagram of shape of the logarithmic spiral slip surface of the multi-layer slope.
It is assumed that the number of layers in the slope is N and the polar coordinates are XC and YC. There are N constants of the logarithmic spiral in each layer, which means that there are N boundaries and β for the lower or upper end of the slip surface, so 2N+2 unknowns need to be solved. On the boundary of the adjacent layer, because the slip surfaces in two layers are consistent in Figure 3, the continuity conditions of sliding lines are established, thus obtaining 2(N-1) equations with continuity conditions. In the polar coordinate system of the slip surface, considering the lower or upper end of the slip surface, there are 2N-2 unknowns, which can be solved according to continuity conditions of layer boundaries. The specific calculation process is shown as follows.
First, because the depth of the boundary of adjacent layers is known, the Y coordinate of the slip surface on the boundary is also known. In this way, since the values of Y coordinates of the slip surfaces in the two adjacent layers are the same, the relationships of constants Aj+1 and Aj of logarithmic spirals in the upper and lower layers, standardized internal friction angles
where Aj+1 and Aj represent the constants of logarithmic spirals of the upper and lower layers, respectively;
After determining the composite critical slip surface of the multi-layer slope, the permanent displacement is calculated by using the Newmark’s method, like previous studies. First, as shown in Eq. 17, the excess of sliding moment MD relative to resisting moment MR of the soil block on the slip surface is calculated (hereinafter referred to as excess sliding moment). The soil block on the slip surface slides all the time in the period from a positive sliding moment (ΔM ≥ 0) to a negative rotational speed
Case Analysis
Calculation Model and Selection of Seismic Waves
By taking a bank slope as a research object, the proposed method for determining the composite critical slip surface under seismic action was used to determine the critical slip surface of the bank slope. Moreover, the seismic deformation behaviors of the bank slope were analyzed and compared with the actual seismic deformation. The bank slope slid and collapsed in an earthquake and a lot of river bank slopes were seriously damaged, most of which were caused by the principal earthquake, as shown in Figure 4. After the earthquake, there was a settlement of about 3 m at the top of the bank slope, and the slope toe protruded to the road outside of the slope for 3–5 m. The large sliding displacement of the bank slope is due to the rise of the groundwater level in the bank slope caused by the rainfall before the earthquake, and the stacking of new sandy soil at the top of the original clay bank slope is also an important influence factor leading to the landslide.
The position of the slip surface and permanent deformation of the bank slope after the earthquake are shown in Figure 5A–D. Based on the geological survey report, the borehole information and shear wave velocity along the depth of the formation of the bank slope were obtained, as displayed in Figure 5E.
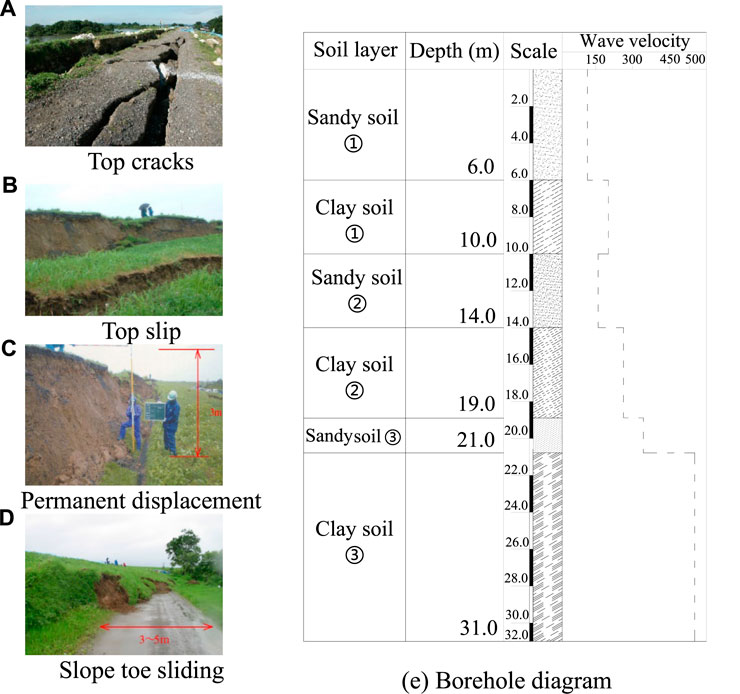
FIGURE 5. Sliding and other formation information of the bank slope after the earthquake. (A) Top cracks. (E) Borehole diagram. (B) Top slip. (C) Permanent displacement. (D) Slope toe sliding.
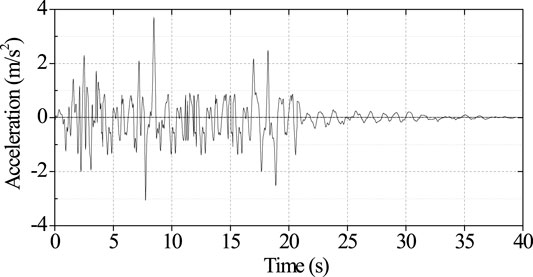
The Ms6.2 earthquake with the epicentral distance of 12 km was recorded at MYG011 and occurred at 38.405°N, 141.170°E and the maximum peak acceleration was recorded as 367.6 Gal. The river bank slope was located in Miyagi Prefecture, Japan. The time-history information of the recorded ground motion is demonstrated in Figure 6.
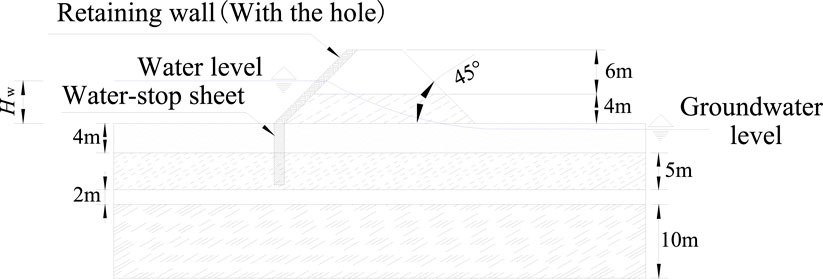
Considering that the left side of the slope was protected through a bank protection structure, the left side is more stable relative to the right side, which is the reason why the left bank slope was not damaged, but the right slope slid and collapsed in the earthquake. Therefore, the stability of the right side of the slope was mainly analyzed. Considering that a simpler slope model can eliminate the interference of other factors on analysis results and the obtained results are more universal, a generalized model of the bank slope was built, as shown in Figure 7. The right slope of the generalized model is 10 m in height and the slope angle is 45°. Six soil layers are distributed from the top to the bottom: ① sandy soil layer, ② clay soil layer, ③ sandy soil layer, ④ clay soil layer, ⑤ sandy soil layer, and ⑥ clay soil layer.
The physical and mechanical parameters of different soil layers of the slope were mainly selected based on geological survey reports and geotechnical design manuals, as listed in Table 1.
Slip Surface Shapes Analysis of the Bank Slope at Different Groundwater Levels”
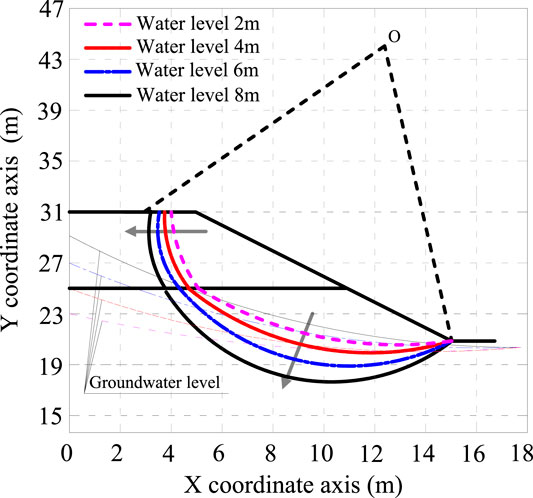
Considering the rainfall before the earthquake, the groundwater level on one side of the bank slope rises, and the excess pore water pressure generated in the slope is the main influence factor of sliding failure. Based on this, the shapes of the slip surface of the slope under the earthquake were studied at different groundwater levels by setting the groundwater level on the left side of the slope as 2, 4, 6, and 8 m. To determine the reasonability of the proposed method in evaluating the critical slip surface of the multi-layer slope, the yield acceleration of the slope can be obtained by substituting the safety factor Fs = 1 in Eq. 2 into Eq. 1 of rotational equilibrium, as shown in Table 2.
In Table 2, the critical yield acceleration gradually decreases with the increase in the groundwater level and its minimum is 2.4 m/s2, which is about 31% lower than the yield acceleration obtained at the groundwater level of 2 m. This indicates that the excess pore water pressure under the seismic action is the main factor influencing the slope stability, and the higher the groundwater level is, the more significant the influences. Through analytical methods of Eqs 15, 16, the critical slip surfaces of the slope at different groundwater levels are determined in Figure 8.
As displayed in Figure 8, different groundwater levels on the left side of the bank slope result in a large difference in the fracture position of the slope under seismic action, while the shapes of the slip surface are basically consistent. In other words, the sliding failure in the form of logarithmic spirals is shown in soil in both the upper and lower layers of the slope. The failure mode of the bank slope at different groundwater levels is manifested as shear slip at the slope toe and tensile fracture at the top overall. Furthermore, the height of the seepage line in the slope constantly rises with the increase in the groundwater level, and the slip surface of soil above the seepage line slightly extends inside the slope. However, the slip surface of the slope below the seepage line extends more apparently inside the slope. This suggests that as the groundwater level rises, soil above the seepage line is not affected by the excess pore water pressure and the sliding scale of the sliding body slightly changes under seismic action. While for soil below the seepage line that is influenced by the excess pore water pressure, the sliding scale increases at a growing amplitude with the gradual rise of the water depth because the slip surface continues to extend into the slope and its sliding scale rises obviously. For instance, when the groundwater level rises from 2 to 4 m, the extension of the slip surface to the interior of the slope is significantly less than that when the groundwater level increases from 6 to 8 m. Under the coupling effects of the earthquake and groundwater at the slope toe, the excess pore water pressure rapidly accumulatively increases so that the slope toe is most likely to become the shear crack of slip.
Permanent Displacement Analysis of the Bank Slope at Different Groundwater Levels
The influences of different groundwater levels on shapes of the critical slip surface of the slope were analyzed in the previous section. This section mainly analyzed influences of different groundwater levels on the permanent displacement of the slope. First, by using the calculation method for the permanent displacement proposed in this research, the excess pore water pressure of the slope toe and permanent displacements of the slope at the groundwater levels of 2, 4, 6, and 8 m were analyzed, as shown in Figure 9.
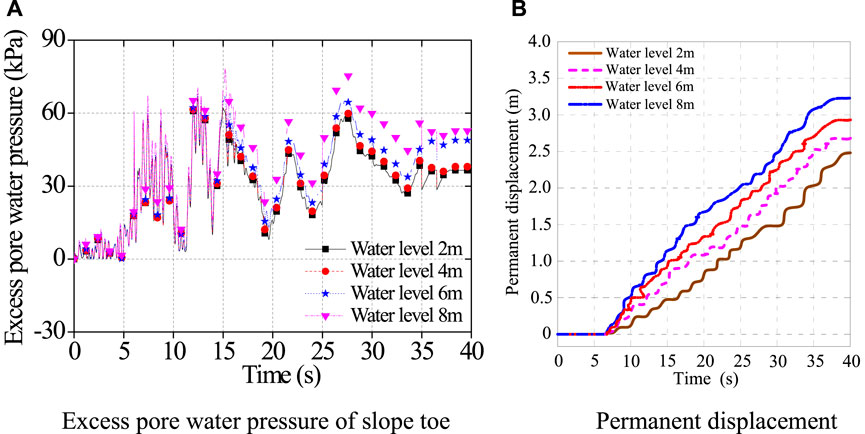
FIGURE 9. Permanent displacements of the slope under different strengths. (A) Excess pore water pressure of slope toe. (B) Permanent displacement.
Figure 9A shows the excess pore water pressure of the slope toe under different water levels, and the excess pore water pressure cumulative increases with the earthquake action in different time. The higher the water level, the greater the excess pore water pressure. Therefore, the water level 8 m has more influence on slope deformation. Figure 9B shows cumulative changes of the permanent displacement of the multi-layer slope at different groundwater levels. At different groundwater levels, the vertical permanent displacement of sliding body of the slope gradually accumulatively increases. First, when the groundwater level is 6 m, the permanent displacement of the slope is calculated as 2.9 m, which is close to the actual vertical displacement of 3 m recorded in the actual disaster, with the error within 10%. Therefore, this further indicates that the calculation method for the permanent displacement considering the excess pore water pressure is reasonable and reliable. At the groundwater level of 2 m, the yield acceleration of the slope is 3.15 m/s2 and the cumulative permanent displacement is 2.5 m. As the groundwater level is 4 m, the cumulative permanent displacement is 2.7 m, which increases by about 8% compared with that at the groundwater level of 2 m. When the groundwater level is 8 m, the permanent displacement reaches 3.25 m, which rises by about 30% compared with that at the groundwater level of 2 m. Therefore, the bank slope experiences a large sliding displacement under seismic action. This is mainly because the rainfall raises the groundwater level of the river, which indirectly increases the groundwater level in the slope and produces the excess pore water pressure under seismic action, thus leading to a large scale of landslide.
Comparative Analysis Based on Shaking Table Tests
Test Model
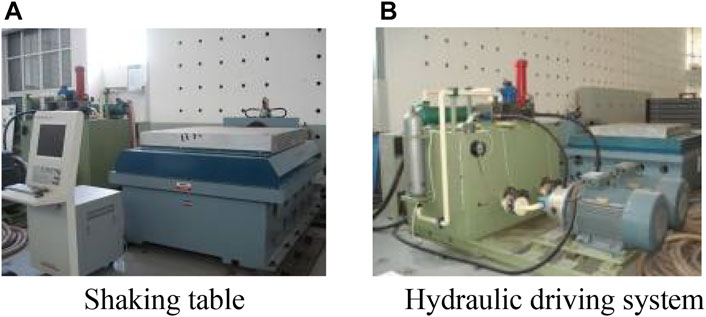
To verify the accuracy of the evaluation method for the composite slip surface of the multi-layer slope proposed in this study, shaking table tests were conducted in the laboratory. The shaking table equipment included a hydraulic table controller, an oil pump station, and a horizontal shaking table, as demonstrated in Figure 10. Through use of the test table, the horizontal constant-frequency vibration test and swept-frequency vibration test with sine waveform were performed on the structure sample with the weight less than 5,000 kg in the laboratory under the frequency of 1–40 Hz and acceleration of 0–20 m/s2. Moreover, various types of time-history seismic waves could be applied.
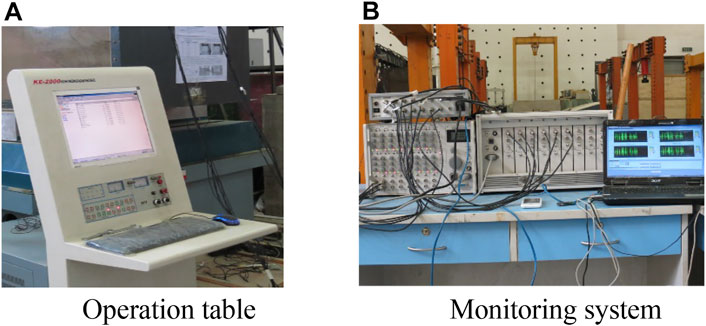
To obtain seismic dynamic response data of a test model, it is necessary to collect and test the multi-channel structural data, so a multi-channel data acquisition system and a vibration test and analysis system were equipped. This system can collect dynamic response data of the slope (acceleration, displacement and dynamic pore water pressure), as displayed in Figure 11.
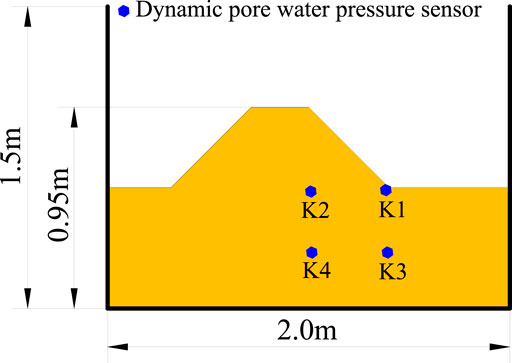
Considering that the groundwater level in the slope is high, the excess pore water pressure produced by seismic action is a main factor influencing the permanent displacement. Therefore, four dynamic pore water pressure sensors were set at positions where sliding shear is most likely to occur, as shown in Figure 12. The attributes of the sensors are listed in Table 3.
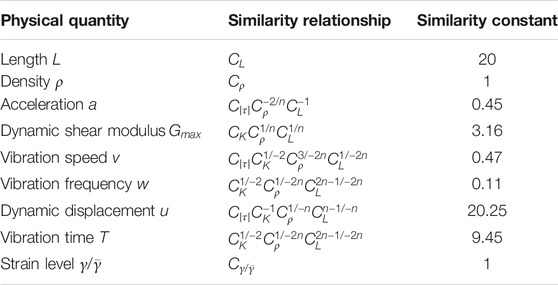
Considering the limitation of test conditions, it is impossible to simulate a full-scale model, so it is necessary to make a reduced-scale model for test based on the similarity law. According to the theory of similarity law, the dynamic similarity conditions of the prototype slope and model slope are shown as follows: similar values of various parameters should be used in the two dynamic physical processes, and similarity criteria composed of these values are equal. For the slope, the prototype and model are required to meet the similarity of single values under seismic action (Guo et al., 2003).
When building the model, the filling density and water content of the model should be controlled as consistent with the prototype as possible, that is, the dimensionless coefficients
In this test, the model box was made of steel plates and organic glass. The lateral boundary waves were absorbed by flexible clay materials on the inner wall of the model box to simulate the boundary of soil. Before piling up the sandy slope, to keep sand as uniform as possible, the sand was stirred repeatedly by using a spade. According to the similarity law, the slope height is 0.5 m and the slope angle is 45°, as shown in Figure 14. A water pipe was connected to one side of the slope for water injection so that the groundwater level was controlled at a fixed depth to simulate the groundwater level on one side. In this test, the case with an actual groundwater level Hw = 6 m in Figure 7 was selected for simulation and the groundwater level in the test was 0.3 m. A water tap at the lower part of the other side of the corresponding model box was turned on (the water tap was connected to a hose that was fixed at the same height as the slope toe to simulate the principle of a connector so that the groundwater water was always controlled at the height of the slope toe). After injecting water for a long time to form a stable seepage field in the slope, seismic excitation began to be applied.
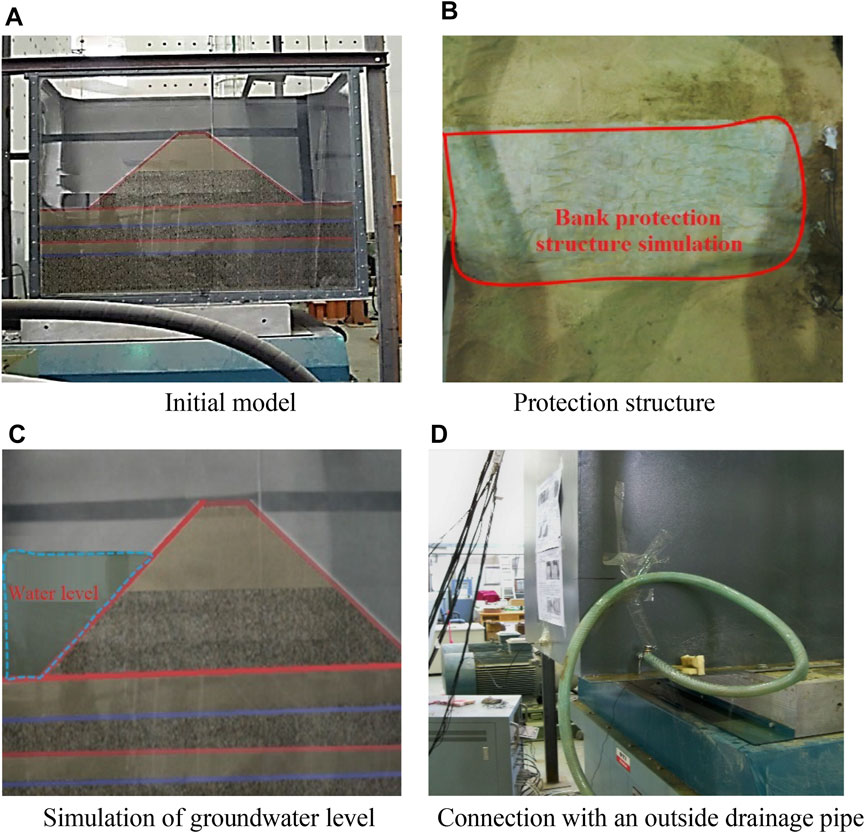
FIGURE 14. Test model of the slope. (A) Initial model. (B) Protection structure. (C) Simulation of the groundwater level. (D) Connection with an outside drainage pipe.
Comparative Analysis of Slip Surfaces
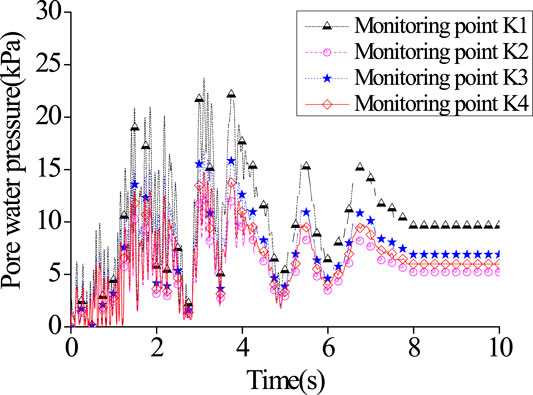
The seismic action further enhances the interaction between groundwater and soil so that the pore water pressure increases abruptly, which greatly affects the stability of the slope. At first, the dynamic pore water pressures at four monitoring points K1, K2, K3, and K4 of the slope were compared at the groundwater level of 0.3 m, as shown in Figure 15.
It can be seen from Figure 15 that the dynamic pore water pressure at the slope toe is obviously greater than that at other positions under the seismic action. Through analysis, the dynamic pore water pressure at the slope toe rises suddenly because of the joint effect of the seismic action and the seepage force inside the slope, and then it gradually stabilizes as the groundwater seeps out of the ground surface. On this basis, the formation process of the progressive slip surface in the slope under the seismic excitation in Miyagi Prefecture in the test was analyzed at first, as shown in Figure 16. The whole process was recorded in the test, while only some of the pictures are displayed.
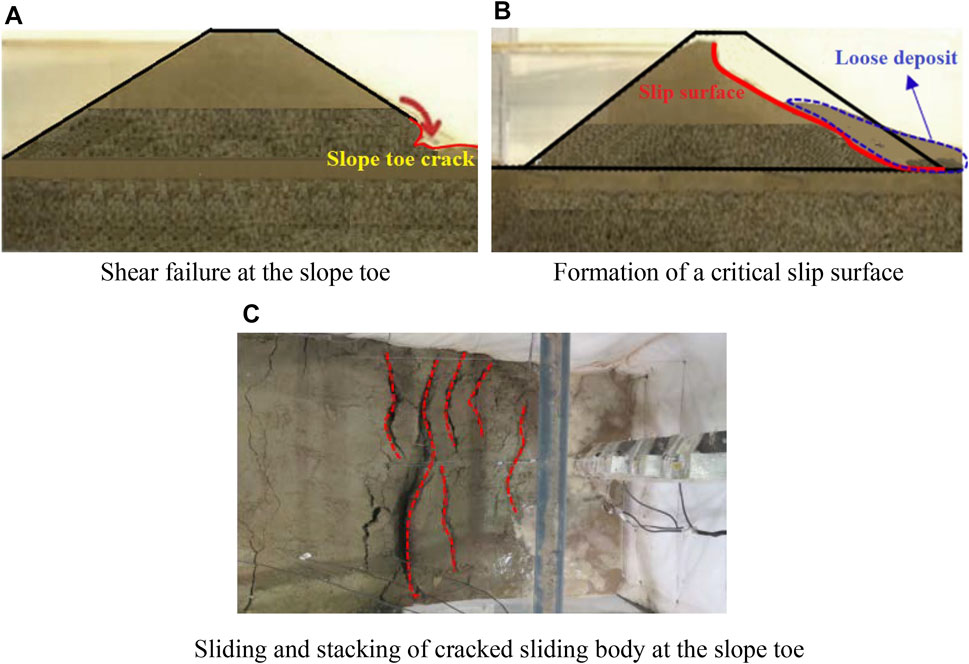
FIGURE 16. Formation process of the critical slip surface at the slope toe. (A) Shear failure at the slope toe. (B) Formation of a critical slip surface. (C) Sliding and stacking of a cracked sliding body at the slope toe.
As displayed in Figure 16, the pore water pressure inside the slope rises all of a sudden under the seismic action so that the effective stress of the slope reduces and cracks occur to the slope toe at first. Then, with the cumulative growth of the earthquake-induced excess pore water pressure, cracks at the slope toe further expand, accompanied by local slip, which is consistent with the abrupt increase in the pore water pressure at the slope toe in Figure 16. Afterward, the slope top is vibrated more intensely under the sustaining seismic action than the lower part due to the magnification effect of the ground motion acceleration, so the slope top is cracked. Because of numerous cracks at the slope toe, the support force at the bottom of the slope reduces gradually so that the landslide happens there finally under the joint effect of the earthquake and the gravitational force of the top soil. The shape of the slip surface can be clearly seen from Figure 16B after the slope slides, which matches well with that of the critical slip surface determined by the proposed method in Figure 8 on the whole, whereas certain discrepancy also exists. This is because the test model is a reduced-scale model, whose fabrication may incur certain errors so that certain discrepancy is present on the slip surface, which is however acceptable. Moreover, the failure law of the slope obtained in the research agrees with the practical failure law of the slope during the earthquake in Miyagi Prefecture. Even low slopes of bank may also be damaged by the earthquake-induced excess pore water pressure if the foundation or filling body is water-rich sand formation or weak viscous formation. This further verifies reasonability of the test model established in the research.
Comparative Analysis of Permanent Deformation
By arranging displacement transducers at different locations in the test, the cumulative permanent displacement of the slope in the earthquake process was well measured. In addition, the whole slip process of the slope was recorded by a camera. The permanent displacements of the slope at groundwater levels of 0.1, 0.2, 0.3, and 0.4 m were taken, as displayed in Figure 17.
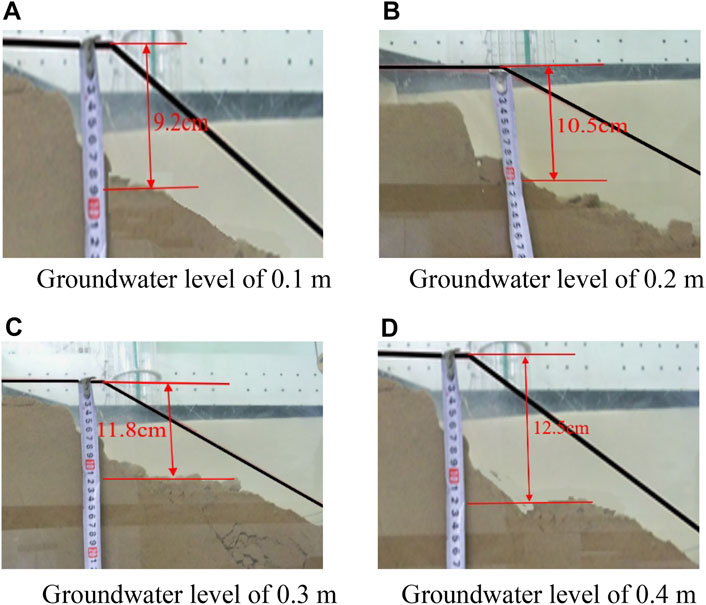
FIGURE 17. Permanent displacements of the slope. (A) Groundwater level of 0.1 m. (B) Groundwater level of 0.2 m. (C) Groundwater level of 0.3 m. (D) Groundwater level of 0.4 m.
As displayed in Figure 17, the permanent displacement of the slope constantly increases with the rise of the groundwater level, accompanied by an increase trend of the collapse and sliding scale. The failure mode of the slope remains basically consistent at different groundwater levels: that is, the slope toe collapses at first; then cracks occur at the slope top; the slope toe slides and shows shear failure under the sustaining seismic action. The permanent displacement of the slope is maximum (about 12.5 cm) at the groundwater level of 0.4 m.
To further verify reliability of the proposed method, the test model was taken as the computing object, whose permanent displacement was calculated using the proposed method. The calculation results were then compared with the results of the shaking table testing, as shown in Figure 18.
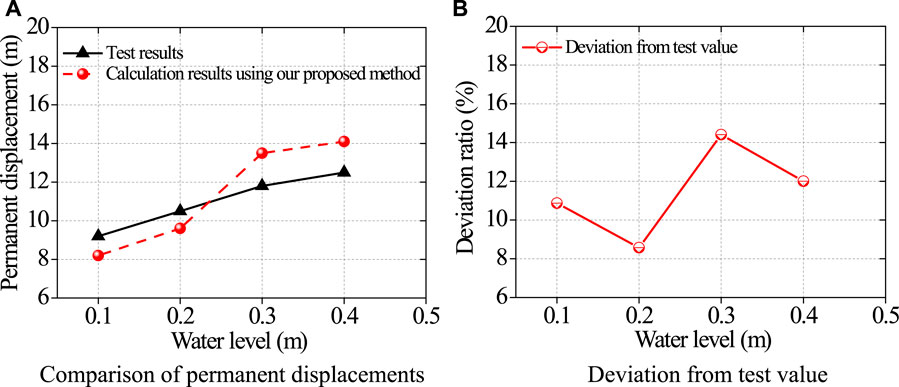
FIGURE 18. Comparison of the test value with the calculation results using the proposed method. (A) Comparison of permanent displacements. (B) Deviation from the test value.
It can be seen from Figure 18 that the permanent displacement of the slope calculated using the proposed method coincides well with the test results, with the maximum deviation of about 14%. The deviation occurs mainly because the slip surface in the multi-layer slope is simplified by the proposed method as the accumulation of multiple logarithmic spirals, which differs to some extent from the actual shape of the slip surface. However, the error of the permanent displacement calculated using the proposed method with the test results is within the engineering allowance range. Furthermore, the test also shows that a deposit is formed after the initial slip and collapse of the slope, which keeps a new equilibrium. The slope will be at a stable state if the sliding body is removed. The safety factor of the slope is lower than one at the initial slip and fluctuates up and down around one under the sustaining seismic action, while the permanent displacement accumulates constantly. Therefore, it is more reliable and economical to judge stability of the slope further according to the permanent displacement after the slip and then taking corresponding reinforcing measures.
In summary, the proposed method is applicable to evaluation of the stability and permanent deformation of multi-layer water-bearing slopes. By setting certain assumptions, the research proposed the calculation method for permanent deformation of the multi-layer slope under influences of earthquake-induced excess pore water pressure and used logarithmic spirals to consider collapse and slip forms of such slope. It means that it is very important to determine whether the slip and collapse mechanism of the slope is within the application scope of the proposed method to ensure the accurate prediction of the permanent deformation of the slope during an earthquake.
Conclusion
Based on the Newmark’s method, the analysis method for stability of the slope under seismic action considering influences of the excess pore water pressure was put forward. In addition, the influences of the excess pore water pressure on the seismic stability of the slope at different groundwater levels were analyzed. In this way, the following main conclusions are obtained:
1) The analytical method for the composite critical slip surface in the multi-layer water-bearing slope considering influences of the earthquake-induced excess pore water pressure was proposed based on the Newmark’s method. On this basis, the evaluation method for influences of the excess pore water pressure on the permanent displacement of the slope under the seismic action was established. Finally, the shape of the slip surface and permanent displacement of the test model attained in the shaking table testing match well with the calculation results of the proposed method. It indicates that the proposed method is applicable to the evaluation of the stability and permanent deformation of multi-layer slopes, and it provides a simple and convenient method for evaluating stability of water-bearing slopes for engineering technicians of slopes.
2) The slip surface at different groundwater levels is found to show a basically consistent shape by analyzing influences of the excess pore water pressure under the condition on the formation of the composite critical slip surface in multi-layer bank slopes using the proposed method. However, the slip surface of the soil mass above the seepage line extends to the interior of the slope less apparently compared with that below the line. It suggests that soil mass above the seepage line is not influenced by the excess pore water pressure as the groundwater level rises, and the sliding body there exhibits small changes in the sliding scale under the seismic action. The soil mass below the seepage line is affected by the excess pore water pressure, so the slip surface extends constantly toward the inside of the slope, leading to the increasing sliding scale.
3) Based on the shaking table testing of a reduced-scale model, the progressive slip process of the bank slope was reproduced, and the composite critical slip surface and the cumulative changes of the permanent displacement of the test model were determined. It reveals that the bank slope is influenced by the excess pore water pressure, showing tensile cracks at the slope toe at first and then slip and collapse of the upper soil layer under the joint effect of the earthquake and the dead weight. Because the slope toe is at a location under the coupling effect of the earthquake and groundwater, the excess pore water pressure there abruptly accumulates and rises. As a result, the slope toe is most likely to become the shear crack of slip and the failure mode of the bank slope at different groundwater levels is manifested as shear sliding at the toe and tensile fracture at the top as a whole.
Data Availability Statement
The original contributions presented in the study are included in the article/Supplementary Material; further inquiries can be directed to the corresponding author.
Author Contributions
Methodology and concepts, SH and SZ; supervision, YL; validation and testing, SH and CL; and manuscript editing, KG and BM.
Funding
This work was financially supported by research grants from the National Natural Science Foundation of China (Grant No. 51708516), the China Postdoctoral Science Foundation (2021M691391), and the Open Foundation of the United Laboratory of Numerical Earthquake Forecasting (Grant No. 2021LNEF04).
Conflict of Interest
The authors declare that the research was conducted in the absence of any commercial or financial relationships that could be construed as a potential conflict of interest.
Publisher’s Note
All claims expressed in this article are solely those of the authors and do not necessarily represent those of their affiliated organizations, or those of the publisher, the editors and the reviewers. Any product that may be evaluated in this article, or claim that may be made by its manufacturer, is not guaranteed or endorsed by the publisher.
References
American Society of Civil Engineers (2014). Seismic Design of Piers and Wharves. Reston, Virginia: ASCE/COPRI61-14.
Baker, R., and Garber, M. (1978). Theoretical Analysis of the Stability of Slopes. Géotechnique 28 (4), 395–411. doi:10.1680/geot.1978.28.4.395
Cao, L., Zhang, J., Wang, Z., Liu, F., Liu, Y., and Zhou, Y. (2019). Dynamic Response and Dynamic Failure Mode of the Slope Subjected to Earthquake and Rainfall. Landslides 16 (8), 1467–1482. doi:10.1007/s10346-019-01179-7
Carey, J. M., McSaveney, M. J., and Petley, D. N. (2017). Dynamic Liquefaction of Shear Zones in Intact Loess during Simulated Earthquake Loading. Landslides 14, 789–804. doi:10.1007/s10346-016-0746-y
Chiaradonna, A., Flora, A., d'Onofrio, A., and Bilotta, E. (2020). A Pore Water Pressure Model Calibration Based on In-Situ Test Results. Soils and Foundations 60 (2), 327–341. doi:10.1016/j.sandf.2019.12.010
Du, S., and Chian, S. C. (2018). Excess Pore Pressure Generation in Sand under Non-uniform Cyclic Strain Triaxial Testing. Soil Dyn. Earthquake Eng. 109, 119–131. doi:10.1016/j.soildyn.2018.03.016
Faccioli, E., Fardis, M. N., and Amr, A. (2005). Designers′ Guide to EN 1998-1and EN1998-5 Eurocode8: Design of Structures for Earthquake Resistance. London: Thomas Telford Limited.
Fattah, M. Y., Al-Mosawi, M. J., and Al-Ameri, A. F. I. (2016). Dynamic Response of Saturated Soil - Foundation System Acted upon by Vibration. J. Earthquake Eng. 21 (7), 1158–1188. doi:10.1080/13632469.2016.1210060
Gordan, B., Armaghani, D. J., Adnan, A. B., and Rashid, A. S. A. (2016). A New Model for Determining Slope Stability Based on Seismic Motion Performance. Soil Mech. Found. Eng. 53, 344–351. doi:10.1007/s11204-016-9409-1
Guo, Y., Maotian, L., Dong, X., and Wang, D. (2003). Experimental Study on Dynamic Modulus Characteristics of Sand under Different Stress Conditions. J. Hydraulic Eng. 5, 41–45. doi:10.1007/s11769-003-0044-1
Hidemasa, S., Tran Thanh, N., and Hiroshi, M. (2018). Earthquake-induced Settlement of a clay Layer. Soil Dyn. Earthquake Eng. 104, 418–431. doi:10.1016/j.soildyn.2017.11.006
Huang, F., Yin, K., Jiang, S., Huang, J., and Cao, Z. (2018). Landslide Susceptibility Assessment Based on Clustering Analysis and Support Vector Machine. Chin. J. Rock Mech. Eng. 37 (1), 156–167. doi:10.13722/j.cnki.jrme.2017.0824
Huang, F., Chen, J., Yao, C., Chang, Z., Jiang, Q., Li, S., et al. (2020). Susle: a Slope and Seasonal Rainfall-Based Rusle Model for Regional Quantitative Prediction of Soil Erosion. Bull. Eng. Geol. Environ. 79 (10), 5213–5228. doi:10.1007/s10064-020-01886-9
Huang, S., Song, B., Niu, L., Ye, Y., and Cai, D. (2014). Simple Calculation Method of Permanent Displacement of Slope Influenced by Dynamic Pore Water Pressure under Earthquake. J. Building Structures 35 (3), 215–221. doi:10.14006/j.jzjgxb.2014.03.001
Huang, S., Lyu, Y., Sha, H., and Xiu, L. (2021). Seismic Performance Assessment of Unsaturated Soil Slope in Different Groundwater Levels. Landslides 18, 2813–2833. doi:10.1007/s10346-021-01674-w
Ishii, Y., Ota, K., Kuraoka, S., and Tsunaki, R. (2012). Evaluation of Slope Stability by Finite Element Method Using Observed Displacement of Landslide. Landslides 9 (3), 335–348. doi:10.1007/s10346-011-0303-7
JTS146-2012 (2012). Code for Seismic Design of Water Transport Engineering. Beijing: People's transport press.
Leshchinsky, D., Baker, R., and Silver, M. L. (2016). Three Dimensional Analysis of Slope Stability. Int. J. Numer. Anal. Method Geomechanics 9, 199–223. doi:10.1002/nag.1610090302
Wang, G., and Sassa, K. (2009). Seismic Loading Impacts on Excess Pore-Water Pressure Maintain Landslide Triggered Flowslides. Earth Surf. Process. Landforms 34 (2), 232–241. doi:10.1002/esp.1708
Wang, S., He, G., Tang, Z., Wang, Z., and Zhao, L. (2016). Design Tables of Seismic Permanent Displacement for Soil Slope Considering the Vertical Earthquake Effect. J. Railway Sci. Eng. 13 (1), 55–62. doi:10.19713j.cnki.43-1423/u.2016.01.009
Keywords: multi-layer slope, composite critical slip surface, excess pore water pressure, permanent displacement, shaking table test
Citation: Huang S, Zhai S, Liu Y, Liu C, Goda K and Mou B (2021) Seismic Behavior Analysis of the Bank Slope Considering the Effect of Earthquake-Induced Excess Pore Water Pressure. Front. Earth Sci. 9:799612. doi: 10.3389/feart.2021.799612
Received: 21 October 2021; Accepted: 15 November 2021;
Published: 16 December 2021.
Edited by:
Faming Huang, Nanchang University, ChinaReviewed by:
Haitao Yu, Tongji University, ChinaYuanjun Jiang, Institute of Mountain Hazards and Environment (CAS), China
Li Yue, North China University of Technology, China
Copyright © 2021 Huang, Zhai, Liu, Liu, Goda and Mou. This is an open-access article distributed under the terms of the Creative Commons Attribution License (CC BY). The use, distribution or reproduction in other forums is permitted, provided the original author(s) and the copyright owner(s) are credited and that the original publication in this journal is cited, in accordance with accepted academic practice. No use, distribution or reproduction is permitted which does not comply with these terms.
*Correspondence: Yingjie Liu, eWluZ2ppZWxpdTQ1NkAxMjYuY29t
 Shuai Huang1
 Yingjie Liu