 Deyang Liang1,2,3
 Zhichuan Guan
- 1School of Petroleum Engineering, China University of Petroleum (East China), Qingdao, China
- 2Key Laboratory of Unconventional Oil and Gas Development, Ministry of Education, China University of Petroleum (East China), Qingdao, China
- 3Shandong Ultra-Deep Drilling Process Control Tech R&D Center, Qingdao, China
Using various tools to obtain downhole data to reach a precise pore pressure model is an important means to predict overpressure. Most downhole tools are connected to the lower end of drill string and move with it. It is necessary to understand the motion state and dynamic characteristics of drill string, which will affect the use of downhole tools. In this paper, a drilling process considering rock-breaking process in vertical wells is simulated using finite element method. In the simulation, gravity is applied to the whole drill string. The contact force between PDC bit and formation is the weight on bit (WOB). And a rotation speed is applied to the upper end of drill string. Analysis of the results shows that the vibration amplitude of bottom hole WOB (contact force between PDC bit and formation, which is the real WOB in drilling process) is bigger than the amplitude of wellhead WOB (acquired through conversion using Hook load, which is on behalf of the WOB obtained on drilling site). Both wellhead WOB and bottom hole WOB decline with a fluctuation in drilling process. In small initial WOB and low rotation speed conditions, the fluctuation of wellhead WOB focuses on low frequency, the fluctuation of bottom hole WOB focus on high frequency, and the phase of them are not identical. In large initial WOB and high rotation speed conditions, the fluctuation of wellhead WOB and bottom hole WOB both become more irregular. As for wellhead torque and bottom hole torque, the fluctuation of them mainly focuses on low frequency. And in high rotation speed conditions, wellhead torque may become negative. The research results are beneficial to the usage of downhole tools.
Introduction
Overpressure may cause various downhole accidents in oil industry. The precise pore pressure model can be obtained through the downhole data measured by various tools to predict overpressure. Most downhole tools are connected to the lower end of drill string and move with it. So understanding the movement and dynamic characteristics of drill string is necessary. The essence of drill string vibration is a structural dynamics problem under prescribed boundary conditions and exterior excitations when the whole drill string is regarded as the study object. A great number of theoretical and experimental studies have been done by many researchers (Guan et al., 2003; Li et al., 2004; Fan et al., 2013). In terms of the complexity of the model, most of the early models are uncoupled vibration models, like axial (Lubinski, 1988; Elsayed and Phung, 2005; Li et al., 2007), lateral (Beck and da Silva, 2010; Ghasemloonia et al., 2012) and torsional (Challamel et al., 2000; Besselink et al., 2011; Arjun Patil and Teodoriu, 2013a, Arjun Patil and Teodoriu, 2013b) vibration models. These simplified models allow researchers to understand how the single external excitations influence the vibration of drill string. And on this basis, more coupled vibration models, including coupled axial-torsional (Voronov et al., 2007; Germay et al., 2009), bending-torsional (Yigit and Christotorou, 1998, Yigit and Christotorou, 2000; Melakhessou et al., 2003; Richard et al., 2007; Liao et al., 2011), axial-lateral (Yigit and Christoforou, 1996; Hakimi and Moradi, 2009; Sahebkar et al., 2011; Ghasemloonia et al., 2013) and fully coupled (Khulief and Al-Naser, 2005; Khulief et al., 2008; Khulief and Al-Sulaiman, 2009; Tian et al., 2016) vibration models, are established. In most of the theoretical studies, the boundary condition at the lower end of drill string is hypothetical time-varying excitation force or displacement (Di et al., 2010; Wu and Ma, 2000; Wang et al., 2018). Sine excitation force, random excitation force, or excitation conditions established by separate models are mostly used (Liu et al., 2013; Zhu and Hu, 2013). In this way, the response of drill string, such as the force, torque, displacement, and angle can be obtained. Then the motion law and dynamic characteristics of drill string can be studied. In this respect, the theoretical research method of drill string vibration problem is mature, and a lot of meaningful results have been achieved.
In fact, during the drilling process, it is a discontinuous contact condition between the bit and the formation. There is a very complicated interaction between the bit and the formation. The vibration of drill string will affect the rock-breaking process, and the rock-breaking process will react to the bit and become a boundary condition of the vibration of drill string, thus affecting the vibration of drill string. Many scholars have done a lot of research on rock-breaking process of drill bit. The rock-breaking simulation (with single-tooth and drill bit) and experiment (with drill bit) (Kuang et al., 2015; Zhu and Li, 2015; Deng et al., 2014) have been carried out.
On the basis of the studies of drill string vibration and rock-breaking process, some researchers successfully combine the two to study the application of downhole tools and bottom hole assembly (BHA) (Dong and Chen, 2018a; Chen, et al., 2018). In these studies, the weight on bit (WOB) is applied to the upper end of drill string or the drill bit using an axial force, and the results are more interpretable.
However, some of the models above did not take into account the bit-formation interaction (Di et al., 2010; Wu and Ma, 2000; Liu et al., 2013), some models just used a section of drill string containing the bottom hole assembly (BHA) (Dong and Chen, 2018b; Chen, et al., 2018), and the WOB is usually applied with an axial force on the upper end of drill string or the bit. In fact, the drill string is a whole, and the motion between each section affects each other. Moreover, the drill string is subjected to gravity and hook load, so the axial force in different parts of drill string is different. All of these factors will affect the overall motion state of drill string.
In this paper, the nonlinear finite element software Abaqus is used to study the vibration problem of drill string. The WOB is exerted by applying gravity to the whole drill string, and the contact force between drill bit and formation is the real WOB. The rock-breaking process of drill bit is regarded as the bottom boundary condition of drill string. A three-dimensional PDC bit is connected to the lower end of drill string, and the entire drill string is located in the wellbore with a formation below the drill bit. During the simulation, gravity is applied to the drill string to bring the drill bit into contact with the formation, and the weight on bit is applied. Then, the rotation speed is applied to the upper end of drill string to drive the drill string, and the PDC bit is rotated to break the rock. The model transforms the drill string vibration from the response problem of a single drill string under external excitation to the discontinuous contact problem between drill string, wellbore, and formation, making the simulation results more interpretable.
Methods
Governing Equations
Equation of Motion
The movement of drill string and formation is a dynamic problem. The deformation of drill string and formation in the model satisfy the Lagrange equation:
where
Every element of the deformable body satisfies the Lagrange Eq. 1 in the finite element method. The element motion equation can be obtained by substituting the element node displacement vector into the Lagrange equation. And the whole motion equations of deformable body can be obtained through combing the motion equation of each element:
where
The equations are ordinary differential equations. In this paper, the central difference method is employed to solve the equations. The central difference method is an explicit algorithm, which solves the motion equations in the way of stress wave propagation. In the algorithm, node velocity vector and acceleration vector are respectively expressed as:
Contact Algorithm
In the model, there are contact and collisions between drill string and wellbore, the drill bit and the formation. Therefore, contact algorithm in the simulation is required. In this paper, the penalty function method is employed in the simulation.
In the penalty contact algorithm, the normal contact force acted by the spring element on the slave node is:
where
Rock Constitutive Model
Drucker-Prager model is an ideal elastoplastic model used in conjunction with linear elastic model and extended Drucker-Prager failure criterion. The model is widely used in numerical calculation of geotechnical mechanics. It is usually more accurate than Mohr-Coulomb model because it considers the intermediate principal stress and the hydrostatic pressure (Cai et al., 2013). Therefore, in this paper, Drucker-Prager model is used as the constitutive model of formation:
where
The cohesive force and friction angle of rock are the parameters of Mohr-Coulomb criterion. The model parameters of Drucker-Prager used in the simulation are converted by Mohr-Coulomb criterion. The conversion formulas are as follows:
where
Damage Initiation Criterion
Shear criterion is employed as the damage initiation criterion in this paper. The criterion is a phenomenological model for predicting the onset of damage due to shear localization. The model assumes that the equivalent plastic strain at the onset of damage,
where
Damage Evolution Criterion
Figure 1 illustrates the characteristic stress-strain behavior of a material undergoing damage. In the context of an elastic-plastic material with isotropic hardening, the damage manifests itself in two forms: softening of the yield stress and degradation of the elasticity. The solid curve in the figure represents the damaged stress-strain response, while the dashed curve is the response in the absence of damage.
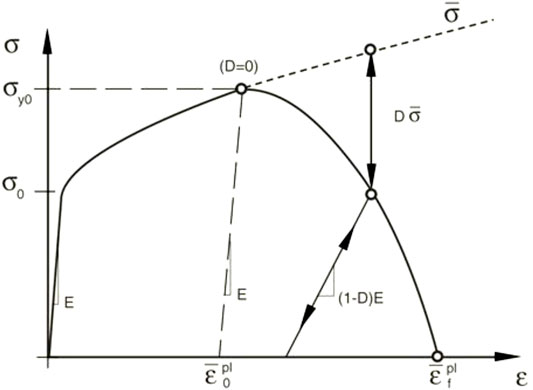
FIGURE 1. Stress-strain curve with progressive damage degradation.
In the figure
Establishment of Finite Element Model
The Composition of Geometric Model
As shown in Figure 2, the model consists of drill string, drill bit, wellbore, and a section of formation. The dimensions of each part of the model are as follows:
1) The outer diameter of the PDC bit is 0.2159 m.
2) The length of the drill string is 2000 m. The length of the drill pipe is 1800 m, and the outer diameter is 0.127 m. The length of the drill collar is 200 m, and the outer diameter is 0.1778 m.
3) The length of the wellbore is 2000.5 m, and the inner diameter is 0.216 m.
4) The thickness of the formation is 0.4 m, and the diameter is 2 m.
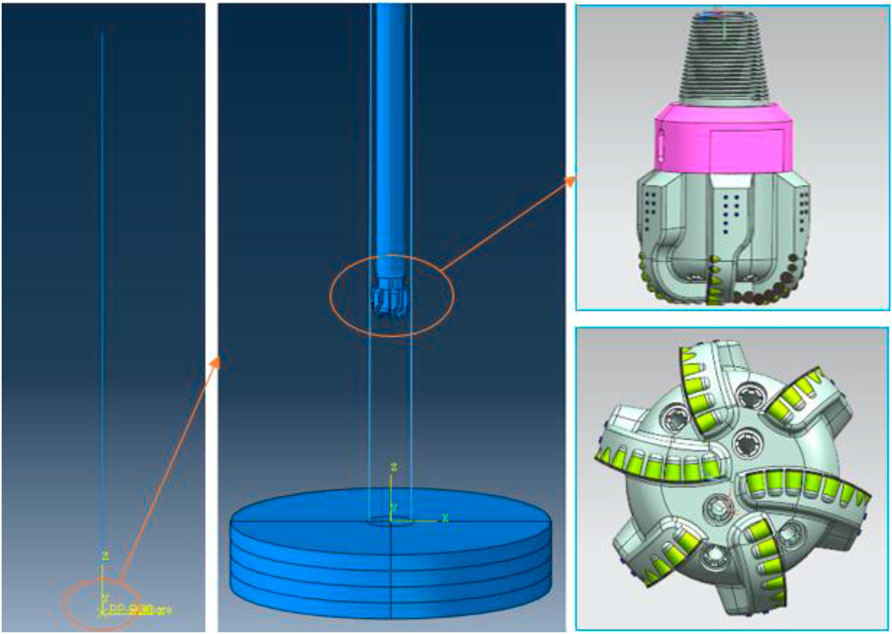
FIGURE 2. Geometric model of FEM.
In the model, some assumptions are as follows:
1) The axis of drill string coincides with the centerline of wellbore;
2) The drill string is linearly elastic, ignoring the influence of joints;
3) The effect of drilling fluid and the temperature and pressure in wellbore is not considered;
4) The wellbore and drill bit do not deform during the simulation.
Model Material Parameter Settings
The basic parameter settings of various materials in the model are shown in Table 1.
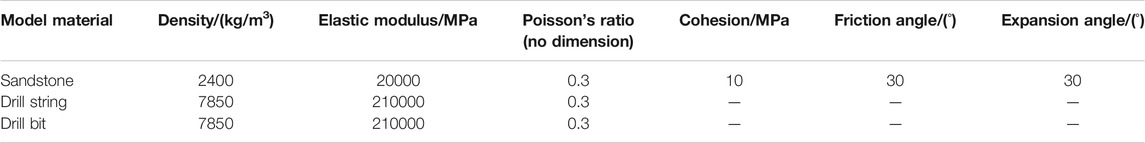
TABLE 1. Parameters of model materials.
Mesh Division
In the model, the wellbore is set to an analytical rigid body. The drill string, drill bit, and formation are meshed using three-dimensional first-order Timoshenko beam unit B31, four-node reduction integral shell unit S4R, and three-dimensional eight-node reduction integral solid unit C3D8R respectively. And hourglass control technique is performed on C3D8R element. The mesh division is shown in Figure 3.
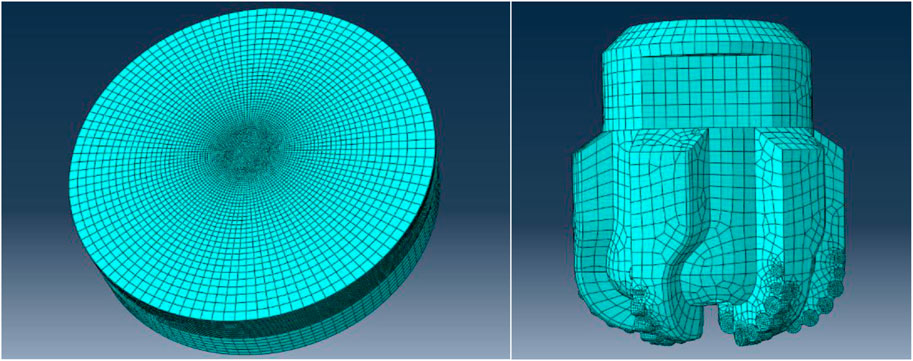
FIGURE 3. Mesh division of formation and PDC bit.
Analysis Steps, Boundary Conditions, and Contact Settings
This model simulates a drilling process between two bit-feed operations. It contains two explicit dynamic analysis steps. In the first step, the gravity is applied to the drill string. The interaction force between drill bit and formation at the end of the analysis step is just the initial WOB. This process is a quasi-static process, and the time length of the first analysis step is 23 s. In the second step, a constant rotation speed is applied to the upper end of drill string to drive the entire drill string to rotate, simulating the rotary drilling process. The time length of the second analysis step is 5 s.
Before the analysis begins, the freedom of the wellbore is completely constrained. The upper end of drill string constrains all the degrees of freedom except the axial rotation degree of freedom. A rigid body constraint is applied to the bit. The reference point and the lower end of the drill string are connected. The side face of the formation constrains the translational degree of freedom. The bottom face of the formation constrains the longitudinal degree of freedom.
A surface-to-surface contact is applied between the bit and formation. And a general contact is applied in the whole model so the drill string can collide with the well wall. The friction coefficient is 0.4.
Results and Discussion
Drill String’s Law of Motion
In the simulation, different initial WOB(60 kN, 80 kN, 100 kN, 120 kN) and rotation speed (60,90, 120 rpm) are applied.
The deformed shapes of the model in different analysis stages are shown in Figure 4. As can be seen from the figure, at the end of the first analysis step, the bit has penetrated the formation due to the WOB; at the end of the second analysis step, some drilling footage appears.
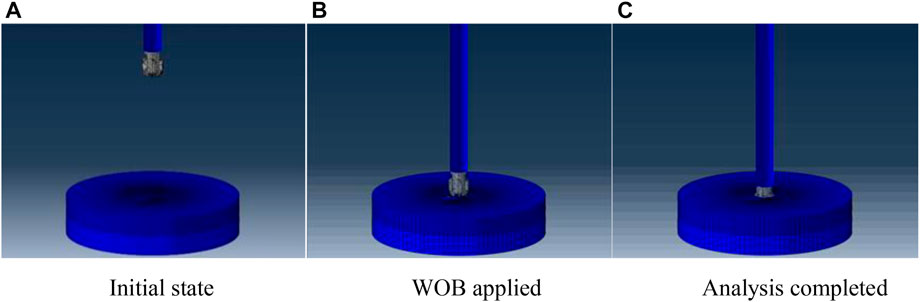
FIGURE 4. Deformed shapes in different stages.
The rotation speed at the upper end and the lower end of drill string during rotating drilling period while the initial WOB is 80 kN and the rotation speed is 90 rpm is shown in Figure 5. At the beginning of the simulation, the rotation speed at the upper end of drill string increases from 0 to 90 rpm, and then remains unchanged for the rest of the time.
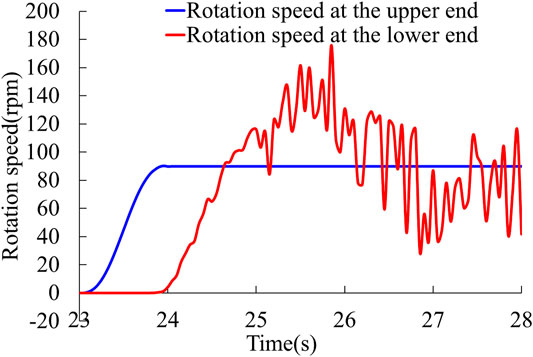
FIGURE 5. Rotation speed at the upper end and the lower end of drill string when the initial WOB is 80 kN and the Rotation speed at upper end is 90 rpm.
Through the Eq. 12 the shear modulus of drill string can be calculated to be 80 GPa.
The propagation velocity of torsional wave in the drill string is
Then the time it takes for the torsional wave to propagate from the upper end of drill string to the lower end is about 0.63 s. The lower end of drill string will not rotate at first when the torsional wave propagates to the lower end due to the resistance of the formation.
Figure 5 shows that the lower end of drill string begins to rotate at about 23.9 s. The rock-breaking process doesn’t begin in the first 1 s, so only the 4 s behind are selected to be analyzed in the following analysis process.
Rotation Speed Analysis
Time Domain Analysis of Rotation Speed
Figure 6 shows the rotation speed at the upper end and lower end of drill string under different drilling parameters.
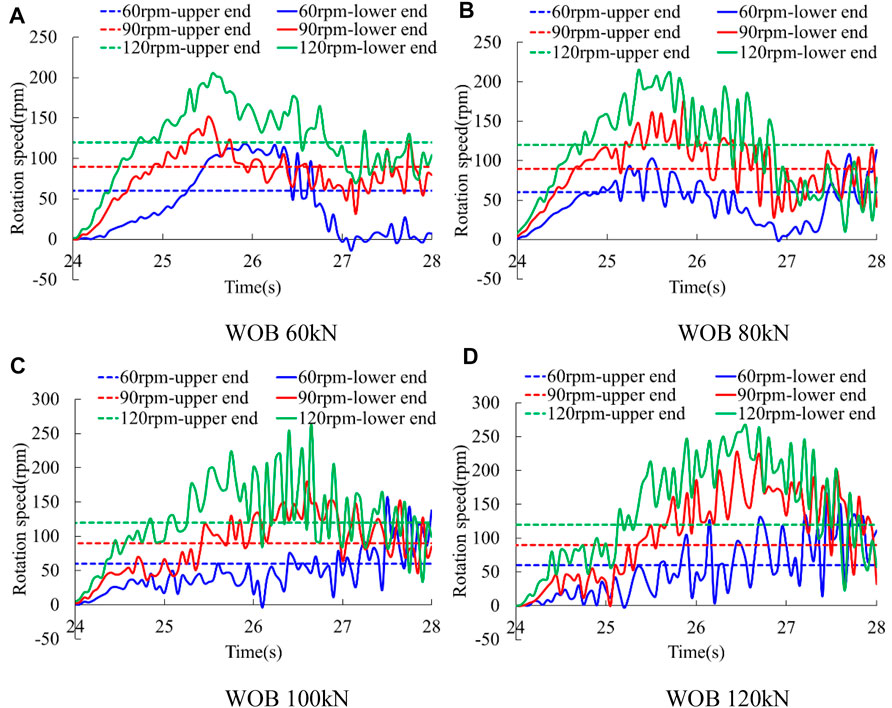
FIGURE 6. Rotation speed at the upper end and lower end of drill string in drilling process. (A) WOB 60 kN (B) WOB 80 kN (C) WOB 100 kN (D) WOB 120 kN.
When the initial WOB is 60 kN and the rotation speed at upper end is 60 rpm, as shown in Figure 6A, the rotation speed at the lower end of drill string increases at first and then decreases, proving that there is torsional vibration in drill string. The maximum rotation speed at the lower end can reach 117.8 rpm, which is 1.96 times of the rotation speed at the upper end, and the minimum rotation speed is −14.0 rpm, indicating that the stick-slip phenomenon occurs.
As can be seen from Figure 6A, the rotation speed at the lower end of drill string fluctuates around the rotation speed at the upper end all the time no matter how fast the upper end rotates. But the minimum rotation speed at the lower end no longer reduces to zero with the increase of rotation speed at the upper end.
In Figure 7, the blue bar shows the maximum rotation speed at the lower end of drill string, and the red bar shows the ratio of maximum rotation speed at the lower end to the rotation speed at the upper end.
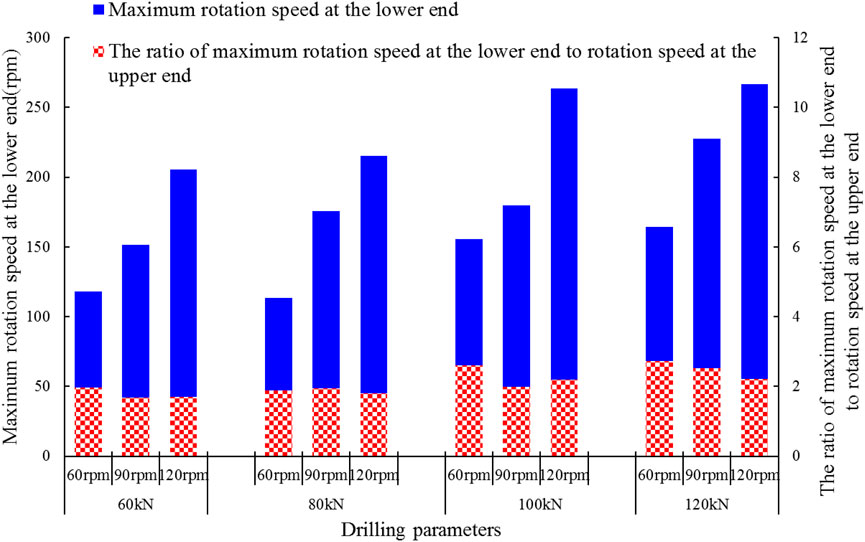
FIGURE 7. Maximum rotation speed at lower end of drill string and the ratio of maximum rotation speed at lower end and rotation speed at upper end.
It can be seen from the figure that the maximum rotation speed at the lower end of drill string increases obviously when the rotation speed at the upper end increases under the same initial WOB. And the maximum rotation speed at the lower end of drill string also increases in most cases when the initial WOB increases under the same rotation speed at the upper end. No matter how the initial WOB and rotation speed at the upper end change, the ratio of maximum rotation speed at the lower end to the rotation speed at the upper end does not change too much, it’s about 2.
Frequency Domain Analysis of Rotation Speed
Under the certain initial WOB and rotation speed at the upper end of drill string, the rotation speed at the lower end of drill string fluctuates around the rotation speed at the upper end, so there are constant term and trend term in the signal of rotation speed at the lower end, as the blue curve shown in Figure 8. Therefore, the constant item and trend item need to be eliminated before the frequency domain analysis.
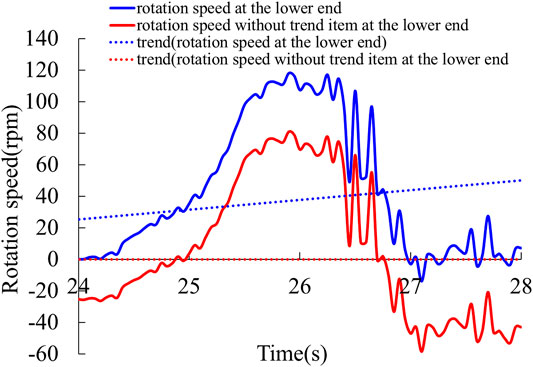
FIGURE 8. Original signal and signal without trend item of rotation speed at the lower end of drill string.
Figure 8 shows the original signal and signal without trend item of rotation speed at the lower end of drill string while the initial WOB is 60 kN and the rotation speed at the upper end is 60 rpm. It can be seen that the equilibrium point becomes zero after the constant item and trend item are eliminated, and no trend exists.
A fast Fourier transform (FFT) is performed on the signal without trend item of rotation speed at the lower end of drill string, and the frequency spectrums are extracted, as shown in Figure 9.
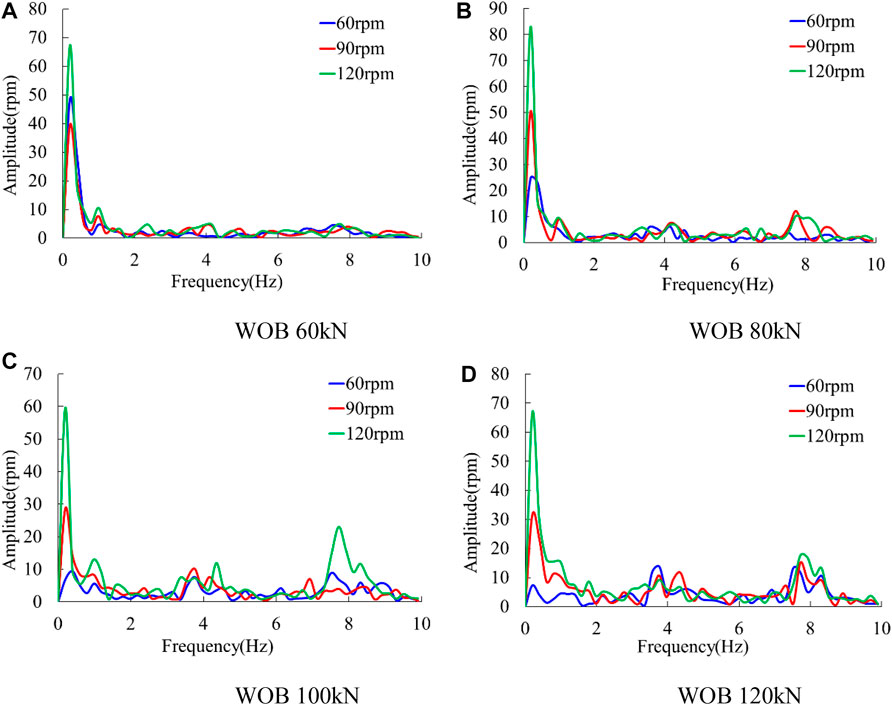
FIGURE 9. Frequency spectrums of rotation speed at the lower end of drill string.
It can be seen from Figure 9 that the low-frequency components are dominant in comparison with the high-frequency components, especially in high rotation speed conditions. This is because torsional vibration exists in the drill string, and low frequency is a typical feature of torsional vibration.
Rotation Angle Analysis
Figure 10 shows the rotation angle at the upper end and the lower end of drill string. As can be seen from the figure, the rotation angle at the upper end of drill string increases linearly with time due to the constant rotation speed at the upper end, but the rotation angle at the lower end of drill string increases nonlinearly because the rotation speed at the lower end of drill string is not constant.
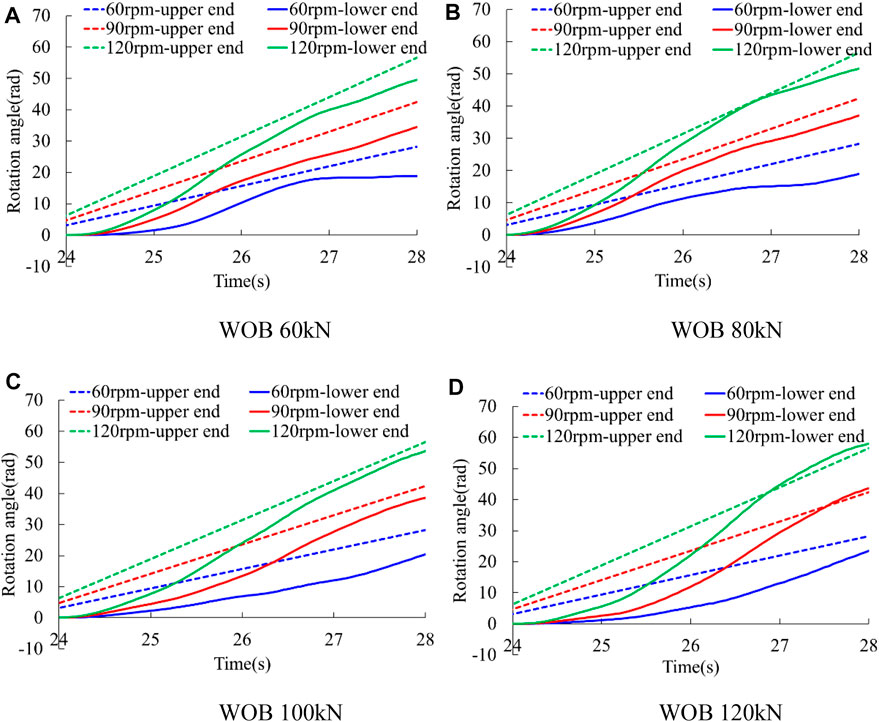
FIGURE 10. Rotation angle at the upper end and the lower end of drill string. (A) WOB 60 kN (B) WOB 80 kN (C) WOB 100 kN (D) WOB 120 kN.
Since the rotation of the lower end has a delay of nearly 1 s compared with the upper end, the rotation angle at the lower end is less than the rotation angle at the upper end at the beginning. As time goes on, the rotation angle of the lower end is always smaller than the rotation angle at the upper end, as shown in Figure 10A. However, in the case of large initial WOB and high rotation speed at the upper end, the rotation angle at the lower end may exceed the rotation angle at the upper end sometimes, as shown in Figure 10D.
Longitudinal Displacement (Drill Footage) Analysis of Bit
Figure 11 shows the drilling footage of bit with time.
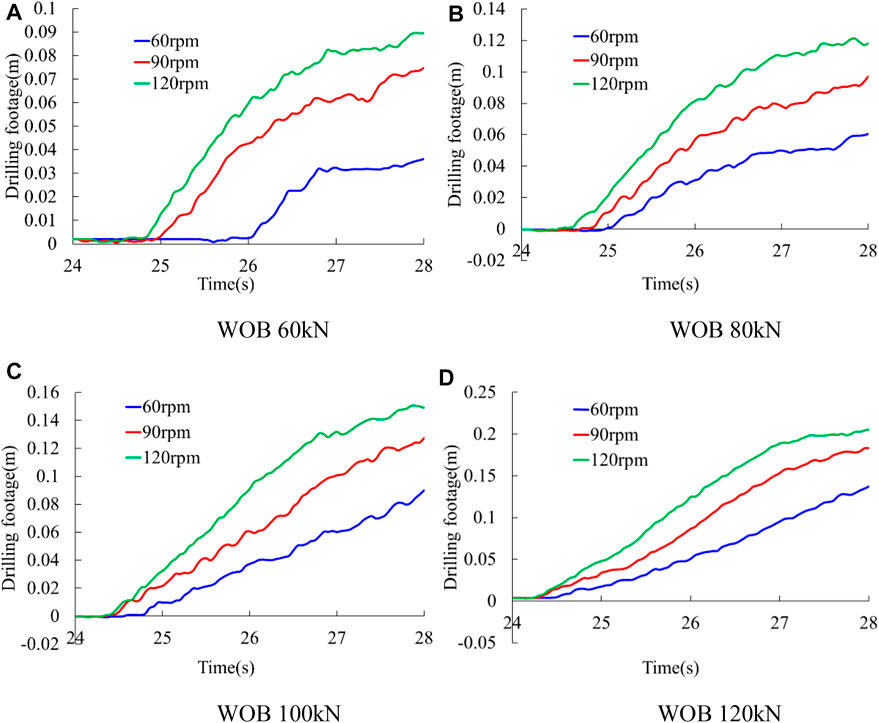
FIGURE 11. Drilling footage of drill bit.
It can be seen from the figure that in the 4 s time of drilling, the drilling footage increases with the increase of rotation speed under the same initial WOB, and the drilling footage increases with the increase of initial WOB under the same rotation speed. Moreover, under certain initial WOB and rotation speed, the drilling footage growth rate increases first and then decreases during the drilling process. The drilling footage is accompanied by a small fluctuation in the increase process, and this fluctuation becomes smaller in large initial WOB conditions.
Dynamic Characteristics of Drill String
WOB Analysis
Time Domain Analysis of WOB
In fact, in the oilfield drilling process, the time-varying contact force between drill bit and formation (hereinafter referred to as bottom hole WOB) is difficult to obtain directly. It is usually obtained by subtracting the hook load from the hanging weight at the wellhead (hereinafter referred to as wellhead WOB). However, both of the two WOB can be easily obtained in the simulation.
Figure 12 shows the variation of wellhead WOB and bottom hole WOB with time.
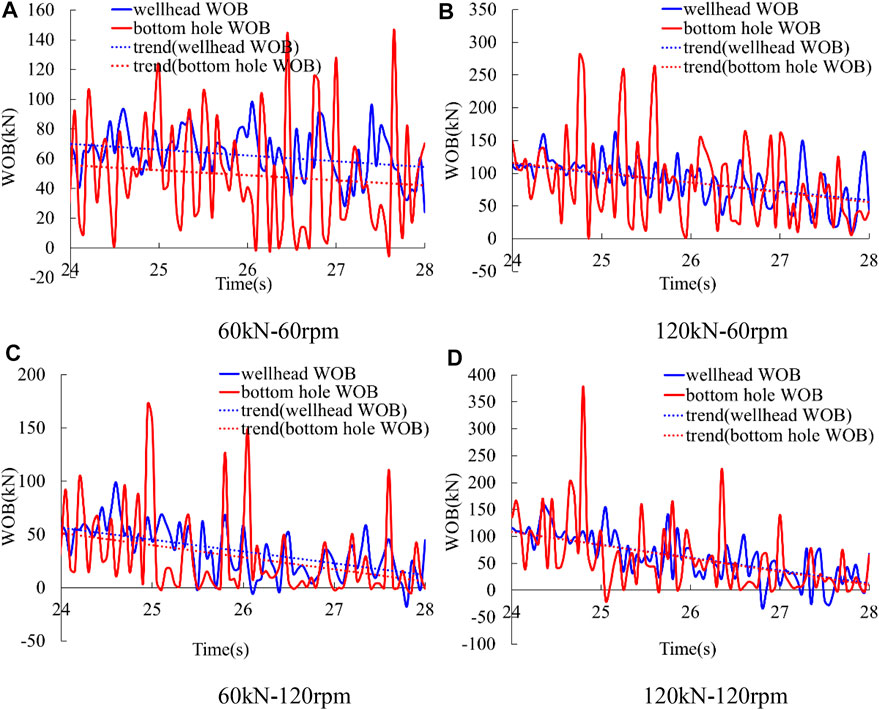
FIGURE 12. Wellhead WOB and bottom hole WOB.
The hanging weight can be obtained by performing a static analysis on the drill string separately. And the wellhead WOB is the difference between the hanging weight and the axial tension at the upper end of drill string.
It can be seen from the figure that during the drilling process between two bit-feed operations, both of the bottom hole WOB and the wellhead WOB become smaller with a fluctuation, and they don’t always fluctuate around an equilibrium point. This is because the upper end of drill string is axially fixed, and as the rock-breaking process proceeds, the axial displacement at the lower end gradually increases, so the contact force between drill bit and formation will gradually become smaller. This can also explain why the growth rate of drilling footage decreases later, as shown in Figure 11.
Moreover, Figure 12 shows that the bottom hole WOB fluctuates more severely than the wellhead WOB. While the initial WOB is 60 kN and the rotation speed at the upper end is 60 rpm, the maximum value of wellhead WOB is 98.4 kN, but the maximum value of bottom hole WOB is 146.4 kN. And the fluctuation of the two WOB is not completely synchronous. Sometimes the phases are the same, and sometimes the phases are opposite.
It can be seen from the trend line of each WOB that the wellhead WOB and bottom hole WOB decrease faster with the increase of the rotation speed under the same initial WOB, and they also decrease faster with the increase of initial WOB under the same rotation speed.
Figure 13 is a box diagram of wellhead WOB and bottom hole WOB while the initial WOB is 60 kN, 80 kN, 100 kN, 120 kN, and the rotation speed at upper end of drill string is 60, 90, 120 rpm.
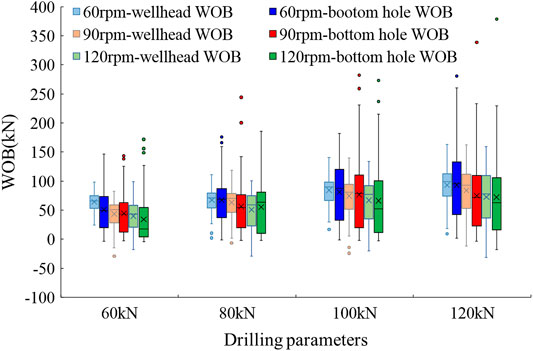
FIGURE 13. Distribution of wellhead WOB and bottom hole WOB.
Comparing the wellhead WOB and bottom hole WOB under the same initial WOB and rotation speed, it can be seen that the wellhead WOB distribution is more concentrated than the bottom hole WOB distribution, proving that the bottom hole WOB fluctuates more severely than the wellhead WOB. Moreover, the wellhead WOB tends to have an abnormal small value, but the bottom hole WOB tends to have an abnormal large value. And the abnormal large value of bottom hole WOB increases with the increase of initial WOB.
The analysis of Figures 12, 13 indicates that the wellhead WOB data can’t fully reflect the bottom hole WOB data. It is difficult to detect the abnormal large value of bottom hole WOB at the wellhead. The phase of the wellhead WOB and bottom hole WOB are not identical, and the increase and decrease of the two WOB are not completely synchronized.
Frequency Domain Analysis of WOB
Figure 14 shows the original signal and the signal without trend item and constant item of wellhead WOB and bottom hole WOB while the initial WOB is 60 kN and the rotation speed at upper end is 60 rpm. After the trend item is removed, the equilibrium point becomes 0, and there is no tendency to increase and decrease.
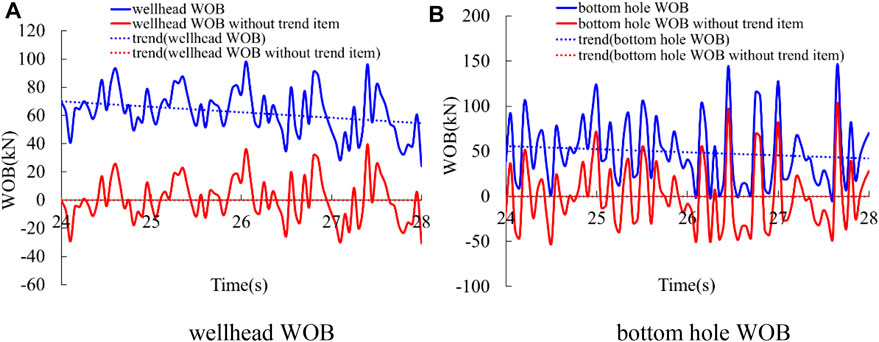
FIGURE 14. Original signal and signal without trend item of wellhead WOB and bottom hole WOB.
A fast Fourier transform is performed on the wellhead WOB without trend item and bottom bole WOB without trend item, and the spectrums of the WOB are extracted, as shown in Figure 15.
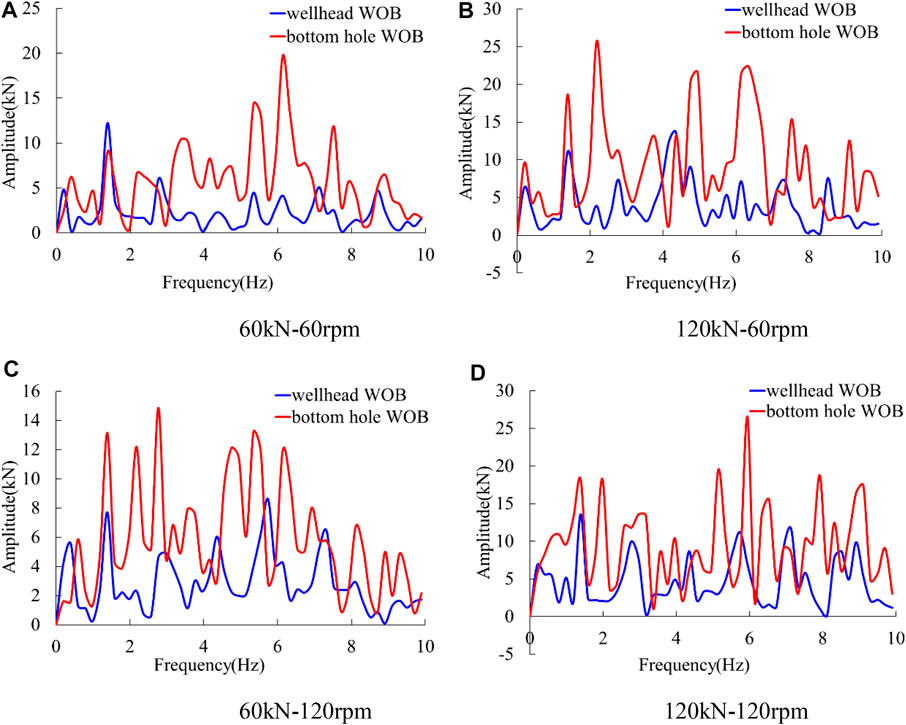
FIGURE 15. Frequency spectrums of wellhead WOB and bottom hole WOB. (A) 60 kN–60 rpm (B) 120 kN–60 rpm (C) 60 kN–120 rpm (D) 120 kN–120 rpm.
As can be seen from Figure 15A that while the initial WOB is 60 kN and the rotation speed at upper end is 60 rpm, the wellhead WOB has a dominant frequency of 1.4 Hz. In addition to the frequency of 1.4 Hz, the bottom hole WOB also contains many high-frequency components with larger amplitudes such as 3.4, 5.3, 6.1, and 7.5 Hz, etc. It indicates that in small initial WOB and low rotation speed conditions, the fluctuation of wellhead WOB focuses on low frequency, and the fluctuation of the bottom hole WOB focuses on high frequency. During the drilling process, the vibration of drill string is greatly attenuated from the bottom of the well to the wellhead due to the material damping of drill string and the frictional collision between drill string and the wellbore, etc. This relationship between wellhead WOB and bottom hole WOB also exists in the other three conditions in Figures 15B–D.
For the wellhead WOB, Figure 15 shows that when the initial WOB or rotation speed increases, the various frequencies tend to be even, and no frequency has an absolute advantage, indicating that the fluctuation of wellhead WOB becomes more irregular with the increase of initial WOB and rotation speed.
For the bottom hole WOB, Figure 15 shows that when the initial WOB or rotation speed increases, the signal still contains various frequencies, and no one frequency has an absolute advantage, indicating that the fluctuation of bottom hole WOB is very complicated regardless of the initial WOB and rotation speed.
Torque Analysis
Time Domain Analysis of Torque
Figure 16 shows the torque at the upper end of drill string (hereinafter referred to as wellhead torque) and at the lower end of drill string (hereinafter referred to as bottom hole torque).
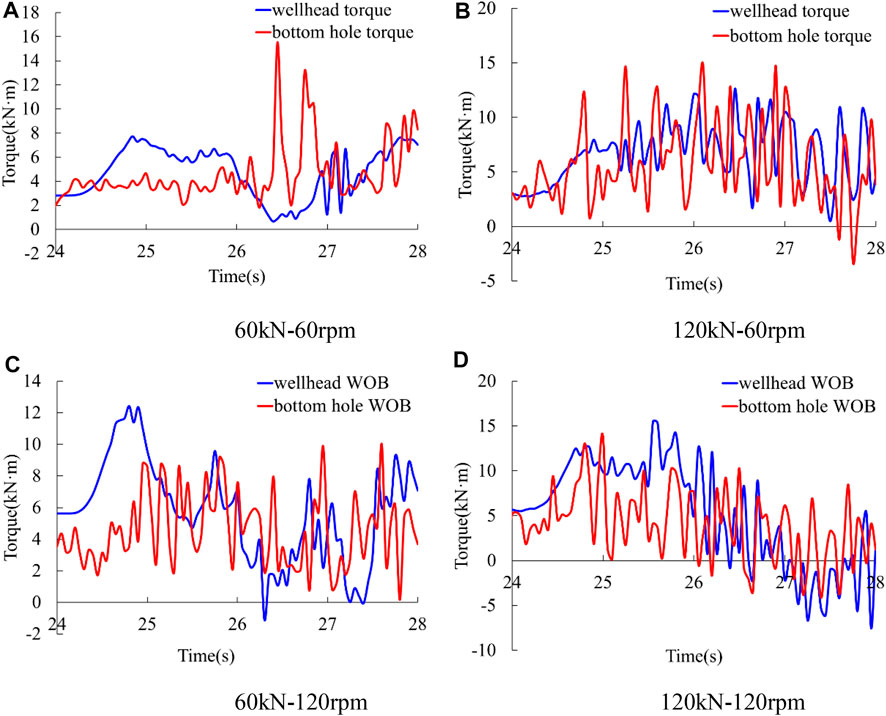
FIGURE 16. Wellhead torque and bottom hole torque. (A) 60 kN–60 rpm (B) 120 kN–60 rpm (C) 60 kN–120 rpm (D) 120 kN–120 rpm.
The average value of wellhead torque in the four conditions are 4.1, 5.7, 5.2, and 4.8 kNm. The average value of bottom hole torque in the four conditions are 3.7, 4.6, 3.8, and 3.3 kNm. It proves that the average value of bottom hole torque is smaller than that of wellhead torque. Figures 16A,B show that when the rotation speed at upper end is low, the fluctuation range of bottom hole torque is larger than that of wellhead torque. Figures 16C,D show that when the rotation speed at upper end is high, the fluctuation range of bottom hole torque is smaller than that of wellhead torque. In the condition of large initial WOB and high rotation speed, wellhead torque and bottom hole torque can become negative, as shown in Figure 16D.
Frequency Domain Analysis of Torque
Figure 17 shows the variation of the original signal and the signal without trend item of wellhead torque and bottom hole torque with time while the initial WOB is 60 kN and the rotation speed at upper end is 60 rpm. The equilibrium point of torque becomes zero after the trend item is removed, and no trend of increase and decrease exists.
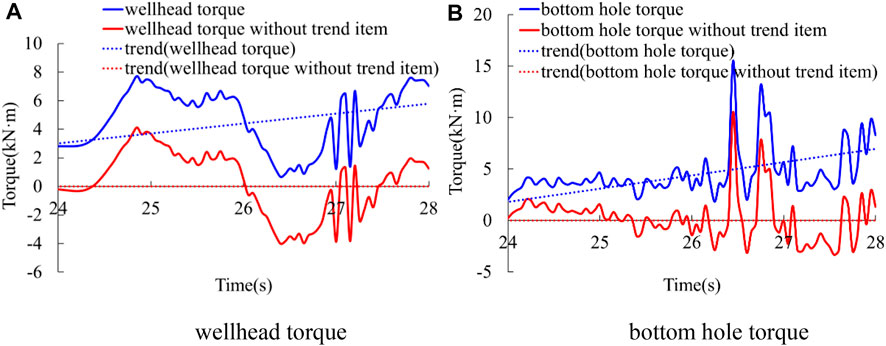
FIGURE 17. Original signal and signal without trend item of wellhead torque and bottom hole torque.
A fast Fourier transform is performed on the signal without trend item of wellhead torque and bottom bole torque signal, and the spectrums of the torque are extracted, as shown in Figure 18.
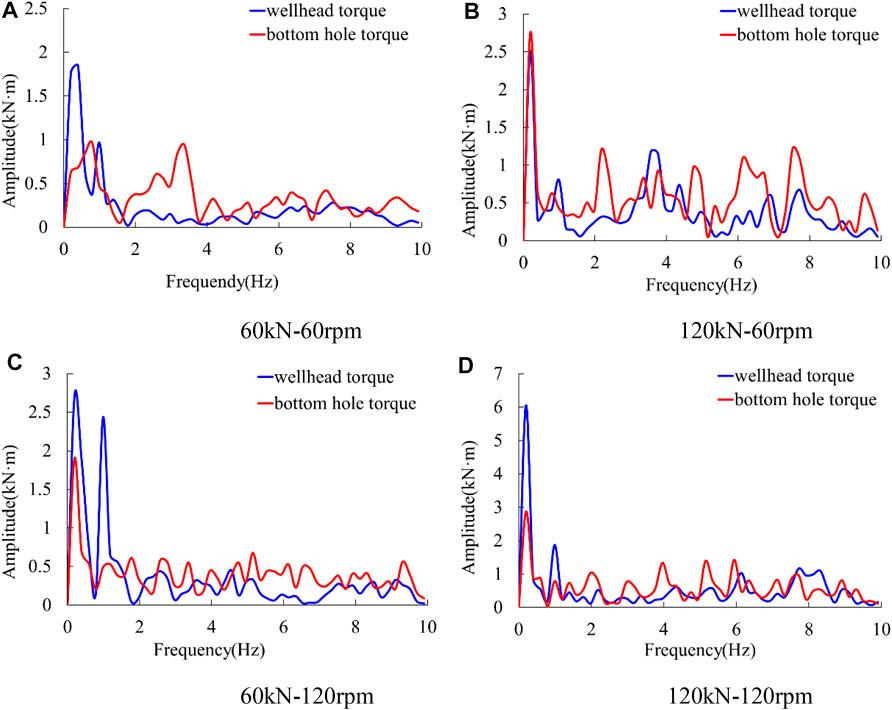
FIGURE 18. Frequency spectrums of torque.
Figure 18 shows that the fluctuation of wellhead torque and bottom hole torque mainly focus on low frequency. The low-frequency component of wellhead torque is dominant, but the bottom hole torque contains more high-frequency component, indicating that the fluctuation of bottom hole torque is more complex.
Conclusion
1) During the drilling process, the torsional vibration of drill string exists. The rotation speed at the lower end of drill string fluctuates around the rotation speed at the upper end, and the maximum rotation speed at the lower end of drill string is about twice the rotation speed at the upper end. The torsional vibration of drill string is mainly low-frequency vibration.
2) Since the rotation speed at the lower end of drill string is not constant, the rotation angle at the lower end of drill string does not increase linearly with time. When the rotation speed at the upper end is low, the rotation angle at the lower end is always smaller than the rotation angle at the upper end. When the rotation speed at the upper end is large, the rotation angle at the lower end sometimes exceeds the rotation angle at the upper end.
3) The wellhead WOB and bottom hole WOB both decrease with a fluctuation, but their phases are not completely synchronized. The bottom hole WOB fluctuates more severely than the wellhead WOB, contains more high-frequency components, and has a larger fluctuation amplitude range. The wellhead WOB becomes more irregular with the increase of WOB and rotation speed, but the fluctuation of bottom hole WOB is very complicated no matter how large the WOB and rotation speed are.
4) The average value of bottom hole torque is smaller than the average value of wellhead torque. When the rotation speed at upper end is low, the fluctuation range of bottom hole torque is larger than that of wellhead torque. When the rotation speed at upper end is high, the fluctuation range of bottom hole torque is smaller than that of wellhead torque. In the condition of large WOB and high rotation speed, wellhead torque and bottom hole torque can become negative, so this condition needs to be avoided. Both wellhead torque and bottom hole torque are dominated by low-frequency components, but the amplitude of high-frequency components of bottom hole torque is larger than the wellhead torque.
5) During the drilling process, the movement of the lower end of drill string is much more complicated than that observed at the wellhead. The data obtained at the wellhead does not fully reflect the situation at the bottom hole. The simulation results are helpful for understanding the real situation of the bottom hole during the drilling process.
Data Availability Statement
The raw data supporting the conclusion of this article will be made available by the authors, without undue reservation.
Author Contributions
DL performed the data analyses and wrote the manuscript; ZG contributed to the conception of the study; YX and YL helped perform the analysis with constructive discussions.
Funding
This paper is supported by the Major Science and Technology Project of CNPC “Research on Efficient Exploration and Development Theory and Key Technologies of Deep Oil and Gas in Tarim Basin” (No. ZD2019-183-005).
Conflict of Interest
The authors declare that the research was conducted in the absence of any commercial or financial relationships that could be construed as a potential conflict of interest.
Publisher’s Note
All claims expressed in this article are solely those of the authors and do not necessarily represent those of their affiliated organizations, or those of the publisher, the editors and the reviewers. Any product that may be evaluated in this article, or claim that may be made by its manufacturer, is not guaranteed or endorsed by the publisher.
Acknowledgments
The authors would like to acknowledge the academic and technical support of China University of Petroleum (East China).
References
Arjun Patil, P., and Teodoriu, C. (2013a). Model Development of Torsional Drillstring and Investigating Parametrically the Stick-Slips Influencing Factors. J. Energ. Resour. Techn. 135, 013103 1–013103 7. doi:10.1115/1.4007915
Beck, A. T., and da Silva, C. R. A. (2010). Timoshenko versus Euler Beam Theory: Pitfalls of a Deterministic Approach. Struct. Saf. 33 (1), 19–25.
Besselink, B., van de Wouw, N., and Nijmeijer, H. (2011). A Semi-analytical Study of Stick-Slip Oscillations in Drilling Systems. J. Comput. Nonlinear Dyn. 6 (2), 021006 1–021006 9. doi:10.1115/1.4002386
Cai, M. F., He, M. C., and Liu, D. Y. (2013). Rock Mechanics and Engineering. 2nd Edition. Beijing: Science Press, 218.
Challamel, N., Sellamim, H., and Cheneves, E. (2000). “A Stick-Slip Analysis Based on Rock/bit Interaction: Theoretical and Experimental Contribution,” in Proceedings of the IADC/SPE#59230, SPE/IADC Conference, New Orleans, Louisiana. doi:10.2118/59230-ms
Chen, Y. J., Fu, J. H., Ma, T. S., Tong, A., Guo, Z., and Wang, X. (2018). Numerical Modeling of Dynamic Behavior and Steering Ability of a Bottom Hole Assembly with a Bent-Housing Positive Displacement Motor under Rotary Drilling Conditions. Energies 11 (10), 2568. doi:10.3390/en11102568
Deng, M. K., Wu, K. S., and Hu, W. (2014). Rock-breaking Simulation and Experimental Analysis of PDC Bit Cutter. China Pet. Machinery 42 (1), 10–13.
Di, Q. F., Wang, W. C., and Yao, Y. H. (2010). Dynamics Model and Whirl Features’ Simulation of Bottom Hole Assembly. J. China Univ. Pet. 34 (3), 53–56.
Dong, G., and Chen, P. (2018a2018). The Vibration Characteristics of Drillstring with Positive Displacement Motor in Compound Drilling Part1: Dynamical Modelling and Monitoring Validation. Int. J. Hydrogen Energ. 43, 2890–2902. doi:10.1016/j.ijhydene.2017.12.161
Dong, G. J., and Chen, P., 2018b. The Vibration Characteristics of Drillstring with Positive Displacement Motor in Compound Drilling Part2: Transient Dynamics and Bit Control Force Analysis☆. Int. J. Hydrogen Energ., 43:12189–12199.doi:10.1016/j.ijhydene.2018.02.198
Elsayed, M. A., and Phung, C. C. (2005). “Modeling of Drillstrings,” in Proceedings of the 24th ASME International Conference on Offshore Mechanics and Arctic Engineering(OMAE), Halkidiki, Greece (IEEE). doi:10.1115/omae2005-67008
Fan, Y. T., Gao, D. L., and Zhang, H. (2013). Simulation and Experimental Research on Mechanical Properties of Bottom Hole Assembly. Pet. Drilling Tech. 41 (3), 80–84.
Germay, C., Van de Wouw, N., Nijmeijer, H., and Sepulchre, R. (2009). Nonlinear Drillstring Dynamics Analysis. SIAM J. Appl. Dyn. Syst. 8 (2), 527–553. doi:10.1137/060675848
Ghasemloonia, A., Rideout, D. G., and Butt, S. D. (2012). Coupled Transverse Vibration Modeling of Drillstrings Subjected to Torque and Spatially Varying Axial Load. Proc. Inst. Mech. Eng. C: J. Mech. Eng. Sci. 227 (5), 946–960. doi:10.1177/0954406212455126
Ghasemloonia, A., Rideout, D. G., and Butt, S. D. (2013). Vibration Analysis of a Drillstring in Vibration-Assisted Rotary Drilling: Finite Element Modeling with Analytical Validation. J. Energ. Resour. Techn. 135 (3), 032902 1–032902 18. doi:10.1115/1.4023333
Guan, Z. C., Jin, Y. X., and Wang, Y. F. (2003). Experimental Research on Motion Behavior of Bottom Drill String in Straight Hole. Acta Petrolei Sinica 24 (6), 102–106.
Hakimi, H., and Moradi, S. (2009). Drillstring Vibration Analysis Using Differential Quadrature Method. J. Pet. Sci. Eng. 70, 235–242. doi:10.1016/j.petrol.2009.11.016
Hillerborg, A., Modéer, M., and Petersson, P.-E. (1976). Analysis of Crack Formation and Crack Growth in concrete by Means of Fracture Mechanics and Finite Elements. Cement Concrete Res. 6 (6), 773–781. doi:10.1016/0008-8846(76)90007-7
Hooputra, H., Gese, H., Dell, H., and Werner, H. (2004). A Comprehensive Failure Model for Crashworthiness Simulation of Aluminium Extrusions. Int. J. Crashworthiness 9 (5), 449–464. doi:10.1533/ijcr.2004.0289
Khulief, Y. A., and Al-Naser, H. (2005). Finite Element Dynamic Analysis of Drillstrings. Finite Elem. Anal. Des. 41, 1270–1288. doi:10.1016/j.finel.2005.02.003
Khulief, Y. A., Al-Sulaiman, F. A., and Bashmal, S. (2008). Vibration Analysis of Drillstrings with String-Borehole Interaction. Proc. Inst. Mech. Eng. Part C: J. Mech. Eng. Sci. 222, 2099–2110. doi:10.1243/09544062jmes968
Khulief, Y. A., and Al-Sulaiman, F. A. (2009). Laboratory Investigation of Drillstring Vibrations. Proc. Inst. Mech. Eng. Part C: J. Mech. Eng. Sci. 223 (10), 2249–2262. doi:10.1243/09544062jmes1550
Kuang, Y. C., Peng, Y. Z., and Zhang, Y. T. (2015). Numerical Simulation and Experiment on Rock-Breaking of PDC Bits. China Pet. Machinery 43 (9), 10–13.
Li, Z. F., Zhang, Y. G., and Hou, X. T. (2004). Analysis of Longitudinal and Torsion Vibration of Drillstring. Eng. Mech. 21 (6), 203–209.
Li, Z., Yanshan, U., and Guo, B. (2007). “Analysis of Longitudinal Vibration of Drillstring in Air and Gas Drilling,” in Proceedings of the SPE#107697, SPE Rocky Mountain Oil and Gas Technology Symposium, Denver, Colorado, April 2007 (IEEE). doi:10.2118/107697-ms
Liao, C., Balachandran, B., Karkoub, M., and Abdel-Magid, Y. L. (2011). Drill-string Dynamics: Reduced-Order Models and Experimental Studies. J. Vibration Acoust. 133 (4), 041008 1–041008 8. doi:10.1115/1.4003406
Liu, X., Vlajic, N., Long, X. H., Meng, G., and Balachandran, B. (2013). Nonlinear Motions of a Flexible Rotor with a Drill Bit: Stick-Slip and Delay Effects. Nonlinear Dyn. 72 (1-2), 61–77. doi:10.1007/s11071-012-0690-x
Lubinski, A. (1988). Dynamic Loading of Drillpipe during Tripping. J. Pet. Techn. 40 (8), 975–983. doi:10.2118/17211-pa
Melakhessou, H., Berlioz, A., and Ferraris, G. (2003). A Nonlinear Well-Drillstring Interaction Model. J. Vibration Acoust. 125, 46–52. doi:10.1115/1.1523071
Patil, P. A., and Teodoriu, C. (2013b). A Comparative Review of Modelling and Controlling Torsional Vibrations and Experimentation Using Laboratory Setups. J. Pet. Sci. Eng. 112, 227–238. doi:10.1016/j.petrol.2013.11.008
Richard, T., Germay, C., and Detournay, E. (2007). A Simplified Model to Explore the Root Cause of Stick-Slip Vibrations in Drilling Systems with Drag Bits. J. Sound Vibration 305 (3), 432–456. doi:10.1016/j.jsv.2007.04.015
Sahebkar, S. M., Ghazavi, M. R., Khadem, S. E., and Ghayesh, M. H. (2011). Nonlinear Vibration Analysis of an Axially Moving Drillstring System with Time Dependent Axial Load and Axial Velocity in Inclined Well. Mechanism Machine Theor. 46 (5), 743–760. doi:10.1016/j.mechmachtheory.2010.12.003
Tian, J., Wu, C., Yang, L., Yang, Z., Liu, G., and Yuan, C. (2016). Mathematical Modeling and Analysis of Drill String Longitudinal Vibration with Lateral Inertia Effect. Shock and Vibration 2016, 1–8. doi:10.1155/2016/6281264
Voronov, S. A., Gouskov, A. M., Kvashnin, A. S., Butcher, E. A., and Sinha, S. C. (2007). Influence of Torsional Motion on the Axial Vibrations of a Drilling Tool. J. Comput. Nonlinear Dyn. 2, 58–64. doi:10.1115/1.2389212
Wang, H., Guan, Z.-c., Shi, Y.-c., Chen, W.-q., Liu, Y.-w., Zhang, B., et al. (2018). Modeling and Analyzing the Motion State of Bottom Hole Assembly in Highly Deviated wells. J. Pet. Sci. Eng. 170, 763–771. doi:10.1016/j.petrol.2018.07.005
Wu, Z. B., and Ma, D. K. (2000). Simulation of Drill String’s Longitudinal Vibration. Acta Petrolei Sinica 21 (3), 73–76.
Yigit, A. S., and Christoforou, A. P. (1996). Coupled Axial and Transverse Vibrations of Oilwell Drillstrings. J. Sound Vibration 195 (4), 617–627. doi:10.1006/jsvi.1996.0450
Yigit, A. S., and Christoforou, A. P. (2000). Coupled Torsional and Bending Vibrations of Actively Controlled Drillstrings. J. Sound Vibration 234 (1), 67–83. doi:10.1006/jsvi.1999.2854
Yigit, A. S., and Christoforou, A. P. (1998). Coupled Torsional and Bending Vibrations of Drillstrings Subject to Impact with Friction. J. Sound Vibration 215 (1), 167–181. doi:10.1006/jsvi.1998.1617
Zhu, X. H., and Hu, Z. Q. (2013). Influence of Shock Absorber on Down-Hole Drilling Tools’ Vibration Characteristics. J. Vibration Shock 32 (17), 144–148.
Zhu, X. H., and Li, H. (2015). Numerical Simulation on Mechanical Special Energy of PDC Cutter Rock-Cutting. J. Basic Sci. Eng. 23 (1), 182–191.
Nomenclature
Keywords: pore pressure, vertical well, drill string vibration, finite element method, rock-breaking process
Citation: Liang D, Guan Z, Xu Y and Liu Y (2021) Study on Dynamic Characteristics of Drill String Considering Rock-Breaking Process. Front. Earth Sci. 9:799061. doi: 10.3389/feart.2021.799061
Received: 21 October 2021; Accepted: 09 November 2021;
Published: 29 November 2021.
Edited by:
Meng Meng, Los Alamos National Laboratory (DOE), United StatesReviewed by:
Weicheng Zhang, Missouri University of Science and Technology, United StatesYanan Ding, University of Regina, Canada
Copyright © 2021 Liang, Guan, Xu and Liu. This is an open-access article distributed under the terms of the Creative Commons Attribution License (CC BY). The use, distribution or reproduction in other forums is permitted, provided the original author(s) and the copyright owner(s) are credited and that the original publication in this journal is cited, in accordance with accepted academic practice. No use, distribution or reproduction is permitted which does not comply with these terms.
*Correspondence: Zhichuan Guan, Z3VhbnpoY2hAdXBjLmVkdS5jbg==