 Zhiwei Zhang
 Chuntao Liang1*
 Min Zhao
- 1Key Laboratory of Earth Exploration and Information Technology of Ministry of Education (Chengdu Universtiy of Technology), Chengdu, China
- 2Sichuan Earthquake Administration, Chengdu, China
The June 17, 2019, MS 6.0 Changning earthquake is the largest recorded event in the Sichuan basin, spatiotemporal variations of stress field may shed light on the seismogenic mechanism of the earthquake. We determined the focal mechanism solutions (FMSs) of 124 earthquakes with MS ≥ 3.0 occurring in the Changning area from April 1, 2007, to February 29, 2020, and analyzed changes of FMSs and stress field before and after Changning earthquake. The Changning aftershocks were predominantly thrust fault earthquakes, followed by strike slip. The P-axis azimuths of the aftershock FMSs were oriented predominantly in the NEE direction, notably differing from the NWW-oriented P-axis azimuths of pre-earthquake FMSs; it shows the rotation of local stress field before and after the Changning earthquake, it is speculated that the change of stress field in Changning area may be caused by long-term water injection and salt mining activities. From the southeast to the northwest of the aftershock zone, the azimuths of principal compressive stress (S1) change from NEE to near-EW in both horizontal and vertical planes. Significant changes occurred in the FMS types and stress field of the aftershock zone following the Changning earthquake, the FMSs became diverse, the S1 azimuth of the Changning area changed from NWW to NEE, and then EW, the plunge and stress tensor variances increased, it reflects that the stress field of the Changning area adjusts continually with time.
Introduction
The Changning Ms 6.0 earthquake is the largest recorded earthquake in the Sichuan Basin. It occurred at 22:55:43.3 on June 17, 2019 in the Changning County of Yibin City in Sichuan Province according to the China Earthquake Networks Center. The epicenter was located at 28.34°N 104.90°E, with a focal depth of 16 km. The source parameters were computed by scientists worldwide shortly after the earthquake. The FMSs of the main shock show a set of nodal planes with the strike of (102°–135°) which is similar to that of the axis of the Changning anticline. The dip angles are 45°–61°. The azimuth/dip angles of P-axis are 70°–76° and 7°–10°, respectively. The dislocation type of the main shock is thrust and strike-slip, and the focal depths are relatively shallow (only 3 km). The reported moment magnitude is of 5.68–5.79 (Lei et al., 2019; Yi et al., 2019; Liang et al., 2020; Liu & Zahradník, 2020; Hu et al., 2021).
The relocated Changning earthquake sequence showed that the aftershocks followed the NW–SE striking axis of the Changning anticline. The aftershocks started at the Shuanghe anticline (in the middle of the Changning anticline) and ended at the Baixiangyan–Shizitan anticline (in the northernmost part of the Changning anticline). The ruptures unilaterally occurred along the NW direction and the focal depths become deeper progressively to the NW (Lei et al., 2019; Yi et al., 2019; Sun et al., 2021). The seismic location and FMSs of the aftershocks indicate that they were probably related to the Baixiangyan–Shizitan segment and the Shuanghe segment of the Changning anticline and their associated fault activities (Yi et al., 2019). He et al. (2019) determined that the earthquakes of the Changning anticline usually occur on its southern wing. These moderate earthquakes are associated with the activities in the footwall ramp of the basement fault.
To a certain degree, FMSs in different stages reflect variations of stress field in the process of strong earthquake preparation, the FMSs of earthquake sequence can provide important clues about the seismogenic process and stress state (Zheng et al., 2009; Luo et al., 2010; Diao et al., 2011). Previous studies focus on focal mechanism of main shock and several larger aftershocks (Yi et al., 2019; Liang et al., 2020; Hu et al., 2021), owing to data limitations, the varying characteristics of stress field before and after the Changning earthquake have not yet been analyzed. To fill this gap, Base on the FMSs of 124 earthquakes with MS ≥ 3.0 in the Changning area from April 1, 2007, to February 29, 2020, we analyze the spatiotemporal variation of FMSs and stress field before and after the Changning earthquake. Our findings enable a thorough understanding of the seismogenic process and seismogenic mechanism of the Changning earthquake.
Data and Methods
Data
The study area is located at the junction between the Sichuan basin and the Loushan fold belt (Figure 1A: Red box), the tectonic structure is the result of multiple tectonic movements, which include the Caledonian, Haixi, Indosinian, Yanshanian, and Himalayan movements. The structure of its surface comprises an alternating series of gentle anticlines and synclines with a few surface faults (Li and Zeng, 1994; Wang, 2014). The NW–SE striking Changning anticline is the major geological structure in the region where the Changning earthquake occurred. This anticline passes through the Shuanghe town to Gao County in the northwest and extends to Xuyong County in the southeast. The anticline is wider in the southeast and narrower in the northwest, and its outcrops comprise Cambrian rocks at the core, followed by Ordovician, Silurian, Permian, Triassic, and Jurassic rocks toward the periphery. The main faults in the aftershock zone include the NEE-trending Wafangtou and Dadiwan faults and the near-EW-striking Dafenba fault (Figure 1A). The mean stress field of the Sichuan–Yunnan region indicates that the principal compressive stress axis of the Sichuan Basinis oriented in a NWW direction (Cheng et al., 2003; Zhong and Cheng, 2006).
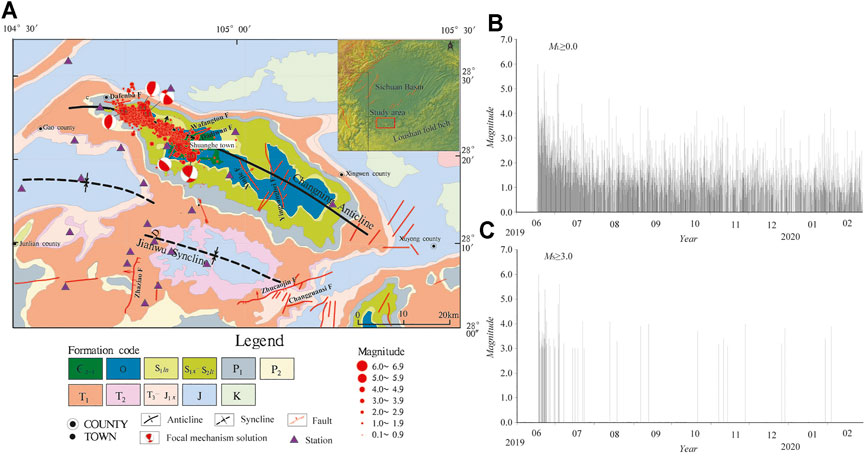
FIGURE 1. Tectonic map of the Changning earthquake source area and its aftershock sequence. (A) Tectonic map and distribution of aftershocks. The upper right insert map shows the structural background of the study area in the red box. Beach ball is the FMSs of the Changning main shock and four MS ≥ 5.0 aftershocks. The red dots represent aftershocks. The aperture of the seismic array (The purple triangle) is approximately 10 km. (B) M–t graph of ML ≥ 0.0 aftershocks; and (C) M–t graph of MS ≥ 3.0 aftershocks.
Up to February 29, 2020, a total of 9,861 aftershocks with ML ≥ 0.0 have been recorded after the Changning earthquake, including 67 events of MS 3.0–3.9, ten of MS 4.0–4.9, and four of MS 5.0–5.9. The MS ≥ 5.0 aftershocks include the MS 5.1 earthquake in Gong County on June 17, 2019, the MS 5.3 event in Changning on June 18, 2019, the MS 5.4 event in Gong County on June 22, 2019, and the MS 5.6 event in Gong County on July 4, 2019. The aftershock activity follows the axis of the Changning anticline (i.e., in a NW–SE direction), and they cover an area of approximately 25 km × 5 km (Figure 1A). The aftershock swarm is characterized by strong and frequent aftershocks (Figure 1B). Most of the MS ≥ 3.0 aftershocks occurred between June 17, 2019, and July 4, 2019, after which the aftershock sequence decayed rapidly (Figure 1C).
Method to Invert for FMS and Stress Field
Among the various methods to compute FMS, Compared with the P-wave first-motion method (Chen et al., 2001), the inversion of body waves (Fan and Wallace, 1991; Dreger and Helmerger, 1993) and the inversion of surface waves (Patton, 1980; Thio and Kanamori, 1995), the “cut and paste” (CAP) method (Zhao and Helmberger, 1994; Zhu and Helmberger, 1996) can be regarded as a full waveform inversion method. It has the advantages of requiring fewer stations, and the inversion results are relatively independent of the selected velocity model and the lateral variations in the crustal structure (Tan et al., 2006; Zheng et al., 2009; Luo et al., 2015; Zhang et al., 2015a; Zhao et al., 2021). The CAP method can also constrain the focal depth using the surface wave amplitudes in the waveforms, thereby yielding a reliable focal centroid depth (Luo et al., 2015).
Estimating stress field based on FMSs is useful for investigating crustal dynamics and earthquake physics. In most methods, it is assumed that the stress field is spatially uniform (Angelier, 1979; Gephart and Forsyth, 1984; Michael, 1984; Cui and Xie, 1999; Yang et al., 2017; Yang et al., 2018). However, to determine the stress field characteristics of spatially heterogeneous, Michael (1991) proposed the superposition stress inversion (SSI) method. In this method, the distribution of heterogeneous stress fields is approximated by superimposing perturbations onto homogeneous stress fields to obtain the orientations of S1 (most compressive principal stress), S2 (intermediate principal stress), and S3 (tensile principal stress) and inversion variance. The variance is a quantitative metric for the consistency between the focal stress field of an earthquake and the tectonic stress field of the region (Michael, 1987; Michael, 1991). A variance lower than 0.1 implies that the observed FMS can be explained by a single stress tensor and that the stress field of the region is homogeneous. In contrast, a variance greater than 0.2 suggests that the stress field of the region is spatially and temporally heterogeneous or that there are complex focal mechanisms (Lu et al., 1997). The stress field obtained using this approach has been demonstrated experimentally to be reliable, and the method has been employed in many studies worldwide (Michael, 1991; Wiemer et al., 2002).
Results
Based on the one-dimensional velocity model in Changning area (Yi et al., 2019), the FMSs and focal centroid depth of MS≥3.0 events in the Changning earthquake sequence were inverted by selecting high signal-to-noise ratio and broadband waveform records of stations within 250 km from the epicenter (Figure 1). In the calculation, the source function duration of the Changning MS 6.0 earthquake was set as 5 s, and that of the other events were set as 1 s. The length of the body wave and surface wave window was set as 30 and 60 s, respectively, and the corresponding bandpass filter bandwidth was 0.05–0.2 Hz and 0.05–0.1 Hz, respectively. The search step for fault plane parameters (strike, dip angle and slip angle) was 5°, and the depth step was 1 km. The optimal FMS is the solution that minimizes the error function, with a depth corresponding to the centroid depth.
Focal mechanism solutions and waveform fitting for the Changning MS 6.0 main shock and MS 3.9 aftershock are shown in Figure 2. The fitting errors of the FMSs at different focal depths are shown in Figures 2A,C, the fitting errors are minimized at a focal depth of 3 and 8 km, the corresponding FMSs are optimal solutions. Figures 2B,D show the fitting results between the synthetic (red line) and observed (black line) seismic waveforms of the data used for CAP inversion. The figure indicates that the phases and amplitudes of the observed and synthetic waveforms of both the Changning MS 6.0 main shock and MS 3.9 aftershock are in good agreement. The FMS of main shock shows that the strike, dip, and rake angles of the fault are 124°, 60°, and 22°, respectively, which implies that the dislocation is a thrust and strike-slip fault, it was consistent with that of other studies (Lei et al., 2019; Yi et al., 2019; Liang et al., 2020).
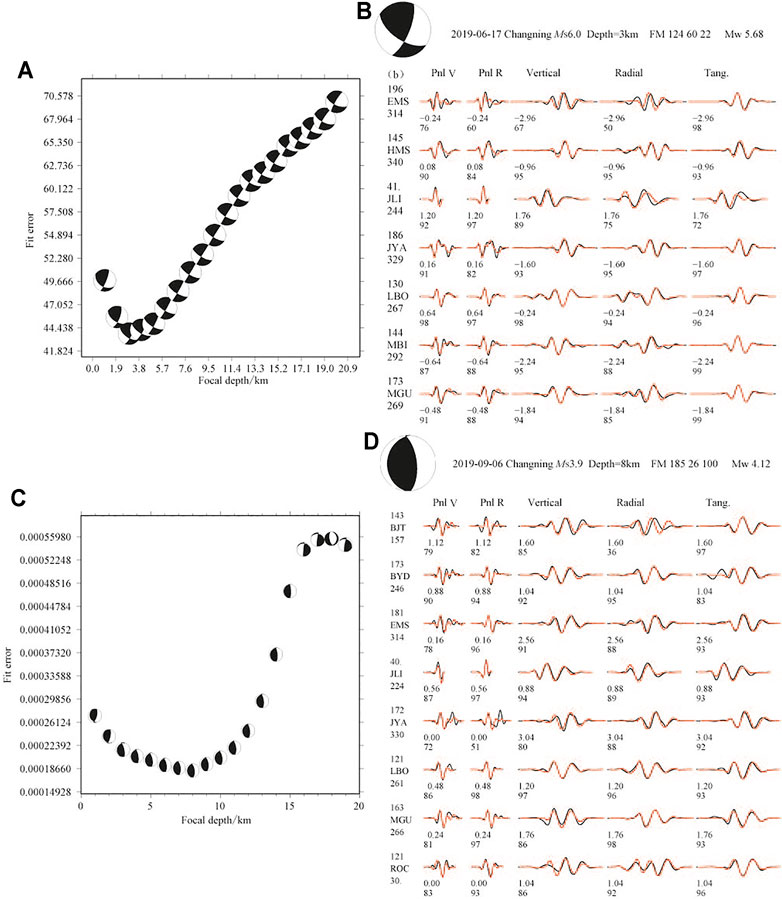
FIGURE 2. FMSs of the Changning MS 6.0 main shock (up) and MS 3.9 aftershock (down). (A) and (C) The fitting error versus depth. (B) and (D) The fitting results between synthetic (red line) and observed (black line) waveforms. The station names are given on the left, the numbers above and below the names are epicentral distance (in km) and azimuth (in degree). Numbers below the traces are the time shifts (in second) of the synthetic relative to the observations and the corresponding cross-correlation coefficients (in percentage).
The Focal Mechanism Characteristics of Changning Aftershocks
The FMSs of 81 aftershocks with MS ≥ 3.0 in Changning sequence from June 17, 2019 to February 29, 2020 were obtained by using CAP method, including 15 earthquakes with MS ≥ 4.0 and 66 earthquakes with 3.0 ≤ MS ≤ 3.9. The FMSs of the Changning aftershocks were classified by comparing the plunge of three principal axes using the classification criteria by Zoback (1992) (Table 1). The FMSs (or stress regime) can be divided into five types, namely normal fault type (NF), normal and strike-slip type (NS), strike-slip type (SS), thrust and strike-slip type (TS) and thrust fault type (TF). Considering the dominant type of an earthquake, this study only divides into three types: normal fault, strike-slip and thrust fault. The NS type dominated by normal fault is classified into normal fault type, and the TS type dominated by thrust fault is classified into thrust fault type for analysis.
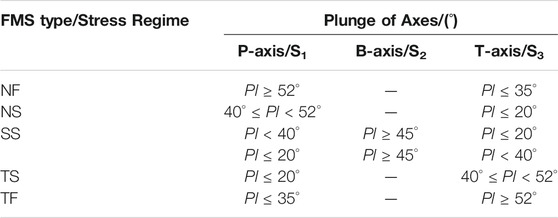
TABLE 1. Classification criteria of focal mechanism solutions and stress regime.
Figure 3A shows the spatial distribution of the FMS types and the overall stress field. A summary of the analysis results is presented in Table 2. The MS ≥ 3.0 aftershocks are predominantly thrust fault earthquakes (TF:48), followed by strike-slip earthquakes (SS:24), and then normal fault earthquakes (NF:9). These types of earthquakes account for 59, 30, and 11% of the aftershocks, respectively (Table 2), and they show distinct differences in spatial distribution. The thrust fault earthquakes are mainly located on the southern and northern parts of the aftershock zone, whereas the strike-slip earthquakes mostly occurred in the central-northern part of the aftershock zone. Normal fault earthquakes are scattered across the zone. The stress field of the Changning aftershock zone shows that, the azimuth/plunge of the S1, S2, and S3 axes were 83°/7.4°, 175°/15.7°, and 329°/72.5°, respectively. Therefore, the aftershock zone had a thrust stress regime with low S1 and S2 plunge (Pl ≤ 35°) and a high S3 plunge (Pl ≥ 52°).
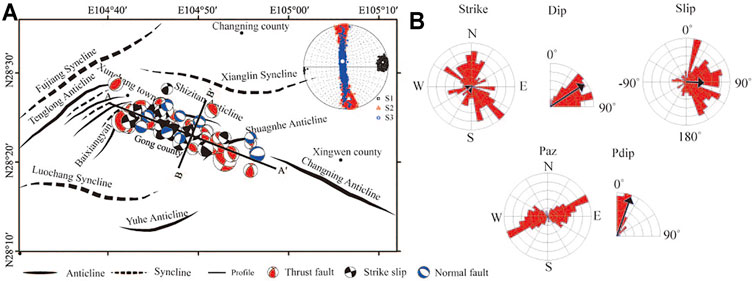
FIGURE 3. (A) FMS distribution of the Changning aftershocks. Beach ball are FMSs, different colors represent different focal mechanism types, among which red beach ball is thrust fault type, black beach ball is strike slip type, blue beach ball is normal fault type. The circular is spherical projection of principal stress axis, the small black squares, red triangles, and blue circles in the ball diagrams represent the projections of S1, S2, and S3, respectively, while the larger square, triangle, and circle represent their mean values. (B) The rose diagram of FMS nodal plane and stress axis parameters, including the strike, dip angle and slip angle of the nodal planes, and the azimuth and dip angle of the P-axis.
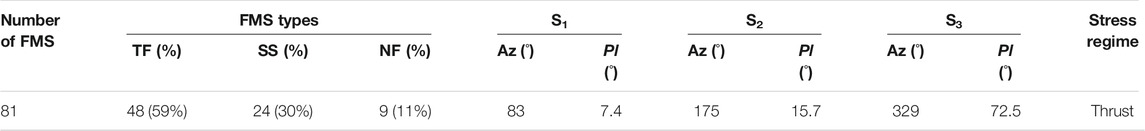
TABLE 2. FMS types of the Changning aftershocks and the stress field of the aftershock zone.
To a certain extent, medium and small earthquakes occur randomly. Therefore, to ensure that the conclusions drawn from our data are reasonable and objective, a large number of medium and small earthquakes FMSs were analyzed statistically to obtain the average nodal plane, stress axis, and dislocation types. A rose diagram of the nodal plane and stress axis parameters of the aftershock FMSs are shown in Figure 3B.
The strikes of the nodal planes were relatively scattered, there are not only strikes in NW which are consistent with the direction of Changning anticline, but also strikes nearly in NS direction which deviates from the striking of the anticline. The dip angles of nodal plane ranged from 40° to 90°, and this wide range may be indicative of spatial complexity for fault planes. The slip angle indicated that the aftershocks were dominantly thrust earthquakes. Based on the FMSs of 16 Changning MS ≥ 3.6 aftershocks, Yi et al. (2019) also found that the strikes of nodal planes are scattering. Thus, the Changning earthquake sequence is complicated by the seismicity of with various faults associated with the Changning anticline. The azimuths of P-axis (Paz) of the FMSs are consistently oriented in the NEE direction, and this is similar to the P-axis azimuth of the main shock (75°) and the S1 azimuth of the aftershock zone. However, this direction differs somewhat from the orientation of the Sichuan basin’s stress field (NW–NWW), and the dip angle of the P-axis (Pdip) is close to horizontal (generally within 20°). Therefore, it can be concluded that the Changning aftershocks were controlled by a local near-horizontal NEE-oriented stress field.
The Stress Field Characteristics of Aftershock Zone.
Based on the FMSs of 81 aftershocks with MS ≥ 3.0, the region with a relatively high density of aftershock FMSs was divided into 0.005°× 0.005°grids. Subsequently, we employed the SSI method (Michael, 1991) to obtain the stress tensor of every node, using minimum of eight FMSs at and around each node. ZMAP software (Wiemer, 2001) was adopted to compute the S1 azimuth of each node in the aftershock zone. Based on these results, a consistency parameter of FMSs was computed at each node in the aftershock zone, and using the variance of the stress tensor to show the heterogeneity of the stress field (Figure 4).
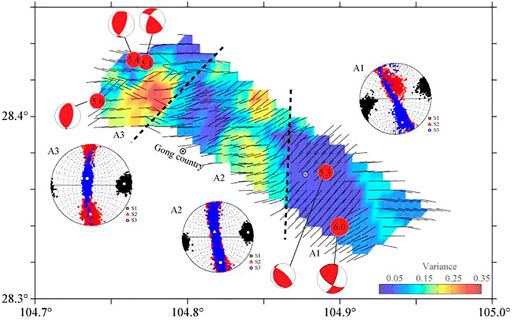
FIGURE 4. The distribution of S1 and stress tensor variance in the Changning aftershock zone. The black dotted lines divide the aftershock zone into A1, A2, and A3 segments, and the black solid lines represent the S1 azimuths. Beach ball are FMSs, the circular is spherical projection of principal stress axis, the details are shown in Figure 3.
To depict the spatial distribution of stress field in the aftershock zone, three segments (A1–A3) were divided along the Changning anticline from the southeast to the northwest. The projection of the principal stress axis in each of these segments from their FMSs, the detailed parameters such as azimuth and plunge of three principal stress axes, variance and stress regime are listed in Table 3. The S1 azimuths of the aftershock zone were found to vary significantly in different sub-zones. In A1 segment (the southern part of the aftershock zone and the initial rupture area of the Changning earthquake), the average S1 was oriented in a NEE direction with an azimuth of 254°, according to classification criteria of stress regime (Zoback, 1992), the plunge of S1 is less than 20°, the plunge of S2 is more than 45°, and the plunge of S3 is less than 40°, it is indicative of a strike-slip stress regime. The A2 segment is located in the middle of the aftershock zone. The S1 azimuth is dominantly oriented in NEE direction with some EW distributed in local area. The average azimuth of S1 in A2 segment is 81°, the plunge of S1 is less than 20°, the plunge of S2 is more than 45°, and the plunge of S3 is less than 40°, the sub-zone is controlled by a strike-slip stress regime. The A3 segment is located in the northern part of the aftershock zone, and a near-EW was noted in this sub-zone. The azimuth of S1 is 88°, the plunge of S1 is less than 35°, the plunge of S3 is more than 52°, indicating a thrust-fault stress regime in this sub-zone.
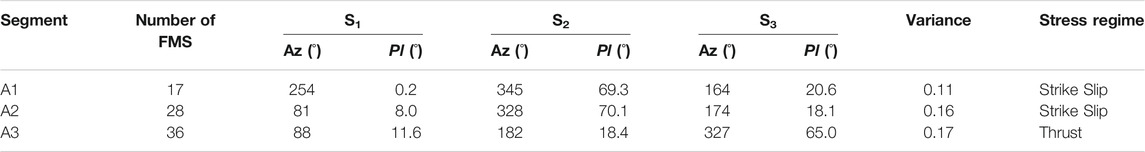
TABLE 3. Stress field in the different segments of the Changning aftershock zone.
In summary, local variations of stress field were found in the Changning aftershock zone. From the southeast to the northwest, the S1 azimuths change from NEE (254°) to near-EW azimuths (88°), whereas the plunge of S1 gradually increases from 0.2° to 11.6°. Based on changning coseismic slip distribution (Li et al., 2021), the relationship between coseismic slip and stress regime is analyzed. The results show the strike-slip stress regime is in region with a large amount of slip, the thrust stress regime is in a small amount of slip.
Together with the distribution of Changning MS≥5.0 aftershock, this study analyzes the relationship between strong aftershocks and the spatial distribution of stress tensor variance (background color in Figure 4). The results showed that the stress tensor variance of the aftershock zone was relatively small, but they differed between segments. For example, the lowest stress tensor variance (0.11) was found in the A1 segment, this indicated that the stress field of the initial rupture area was relatively homogeneous, and the June 18 MS 5.3 aftershock occurred in this area with a low stress tensor variance. The stress tensor variance in A2 segment was found to be significantly lower on its western side than its eastern side, which indicated that the stress field was more homogeneous on the western side than the eastern side. However, the stress tensor variance of A3 segment was significantly lower at the northern end than at the southern end. The June 17 MS 5.1 and June 22 MS 5.4 Gong county earthquakes both occurred at the northern end of A3 segment. These findings are consistent with studies of the Wenchuan and Lushan earthquakes (Zhang et al., 2015a), where it was also observed that strong aftershocks generally occur at or near areas with low stress tensor variances.
Depth Cross-Sectional Characteristics of FMS and Stress Field
The depth cross-sectional characteristics of FMS and the stress field were analyzed along the long A-A′ and short B-B′ axes of the region (Figure 3A). Figure 5 shows the depth distributions of the FMSs corresponding to MS ≥ 3.0 and MS ≥ 4.0 aftershocks, which were projected onto the A-A′ and B-B′ cross-sections. It is worth noting that the focal depths of earthquakes were obtained by using CAP method, the spatial locations of the earthquakes were determined by double-difference earthquake location algorithm (Waldhauser and Ellsworth, 2000). To probe the stress states, the stress tensors of the A-A′ cross-section were inverted from the FMSs, and the trend of S1 axis was projected onto the cross-section. Owing to the symmetry of the stress axes, the angle between the trend of S1 axis and the cross-section was limited to 0°–180°. The depth distributions of the FMSs for the MS ≥ 3.0 and MS ≥ 4.0 aftershocks along the A-A′ cross-section are shown in Figures 5A,C, respectively. These results show that the compressive stress in each segment of the aftershock zone also exist depthwise-variation. For instance, the depths of earthquakes in the central-southern segment are generally less than 5 km, the angle between the S1 azimuths and the strike of Changning anticline varies between 30° and 60° in the southern segment and 60°–90° in the central segment. In the northern segment, the focal depths become gradually deeper, even exceeding 10 km, and the angle between the S1 azimuth and the strike of the Changning anticline varies from 90° up to 120°. From southeast to northwest, the angles between the S1 azimuths and the strike of the Changning anticline become gradually larger with depth. And the shallow, NE-oriented compressive stress changes to deep, NW-oriented compressive stress (Figure 5A). The angle between the strike of Changning anticline and the P-axis orientations of the MS ≥ 4.0 aftershock FMSs also varies from one segment to another (Figure 5C). The phenomenon differs to those of the Lushan earthquake, where the P-axis orientations of the MS ≥ 4.0 aftershocks were all perpendicular to the trend of the Longmenshan fault (Zhang et al., 2015b). Again, this shows the complexity of the stress field of the Changning aftershock zone.
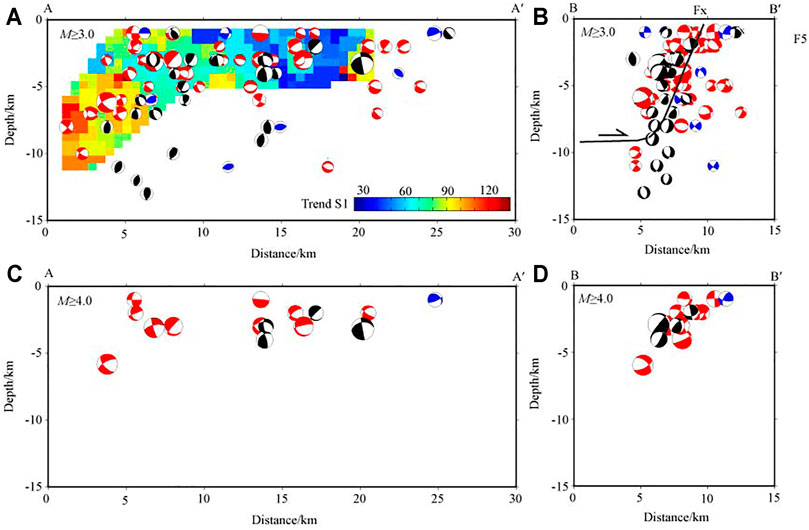
FIGURE 5. The focal mechanism projection along the A-A′ and B-B′ cross-sections. (A, B) are the depth distribution of the FMSs of the MS ≥ 3.0 aftershocks along the A-A′ and B-B′ cross-section respectively. (C) and (D) are the depth distribution of the FMSs of the MS ≥ 4.0 aftershocks along the A-A′ and B-B′ cross-section respectively. The different colors represent the angles between S1 azimuths and the cross-sections in (A). The black line is the inferred fault (Fx) in (B).
The depth distribution of the FMSs of the MS ≥ 3.0 and MS ≥ 4.0 aftershocks along the B-B′ cross-section is shown in Figures 5B,D, respectively. The black line (Figure 5B)is the inferred fault (Fx), which were identified by the seismic relocation and focal mechanism solutions. It is speculated that the tendency of fault plane is SW, the dip angle is steep, the inferred fault is consistent with the results of Yi et al. (2019), we think the activation of the basement fault in the depth of ∼10 km in Changning anticline driven by regional stress field.
Discussion
To probe the seismogenic mechanisms of the Changning earthquake, a comparison of the FMSs before and after the Changning earthquake was conducted. The CAP method was used to invert the FMSs of 43MS ≥ 3.0 earthquakes from April 1, 2007 to June 16, 2019. In accordance with the method used previously, the FMS types and the parameters of the nodal planes and stress axes were computed, and the pre-earthquake stress field was also inverted (Figure 6). The results are summarized in Table 4.
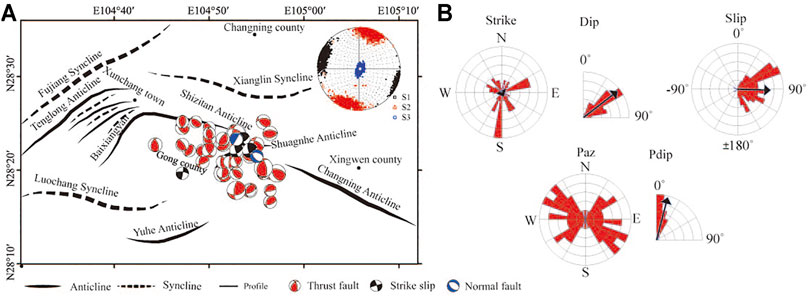
FIGURE 6. (A) FMS distribution of the pre-earthquake and the spherical projection of principal stress axis. The details of FMSs and principal stress axis are shown in Figure 3. (B) The rose diagram of FMSs nodal plane and stress axis parameters, including the strike, dip angle and slip angle of the nodal planes, and the azimuth and dip angle of the P-axis.

TABLE 4. FMS types and stress field after the Changning earthquake.
The spatial distribution of the pre-earthquake FMSs is shown in Figure 6A. Among the 43 earthquakes included in this analysis, there are 37 thrust fault earthquakes, four strike-slip earthquakes, and two normal fault earthquakes, accounting for 86, 9, and 5% of the total, respectively (see Table 4). The pre-earthquake stress field shows that the azimuths/plunge of S1, S2, and S3 were 280°/3.2°, 190°/0.8°, and 86°/86.6°, respectively. The pre-earthquake and post-earthquake stress regimes were all thrust fault, with low S1 and S2 plunge (Pl ≤ 35°) and a high S3 plunge (Pl ≥ 52°). However, the S1 azimuth rotated 17° anticlockwise after the Changning earthquake. Figure 6B shows that the nodal plane strikes of the pre-earthquake FMSs are quite scattered, mostly in the NS direction, deviating from the strike of the Changning anticline. The dip angles of the nodal planes were 40–60°, which were smaller than the post-earthquake dip angles. The P-axis azimuths of the pre-earthquake FMSs were oriented predominantly in the NWW direction, notably differing from the NEE-oriented P-axis azimuths of the aftershock FMSs; but similar to the orientation of the Sichuan basin’s stress field (NW–NWW). The dip angles of P-axis ranged between 0° and 20°, which is consistent with the horizontal stress field of southwestern China (Kan et al., 1977). These results indicate that the seismicity of this region was controlled mainly by the near-horizontal stress field of the Sichuan Basin before the Changning earthquake.
The temporal evolution of the FMSs before and after the Changning earthquake was analyzed by dividing the research period into three time periods. Including the pre-earthquake period (I: April 1, 2007, to June 16, 2019), the active post-earthquake period (II: June 17, 2019, to July 4, 2019), and the decaying post-earthquake period (III: July 5, 2019, to February 29, 2020). The numbers and percentages of earthquake types during these periods were shown in Figure 7. The 43 earthquakes occurred in Period I, of which thrust earthquakes accounted for 86% and strike-slip earthquakes and normal fault earthquakes accounted for only 9 and 5%, respectively. This result showed that the FMS types in this region were highly consistent before the Changning earthquake. According to Diao et al. (2011), stress accumulation prior to an earthquake in a source area with a thrust regime may induce similar transformations in the local stress field. Moreover, after the stress field has transformed into a stress state identical to that of the main shock, the stress near the source area are extremely high. In Period II, the 60 earthquakes were still dominated by thrust earthquakes (64%); the number of thrust earthquakes declined by 22%, whereas the strike-slip earthquakes increased by 24% (up to 33%) compared with those in Period I. Significant change was not detected in the number of normal fault earthquakes. The FMS types of the aftershocks that occurred shortly after the Changning earthquake were similar to those of the main shock with thrust fault type. Afterward, the number of strike slip earthquakes increased significantly, whereas the number of thrust fault earthquakes decreased gradually over time. This finding indicates a significant adjustment of the stress field during the active post-earthquake period. In Period III, 21 earthquakes were detected, and their FMS types were significantly different from those of Period II. Thrust fault and strike slip earthquakes decreased by 16 and 14%, respectively, whereas normal fault earthquakes increased by 30%. The evolution of FMS types in the Changning earthquake resembled that of the MS 7.0 Lushan earthquake (Zhang et al., 2015b). For both events, the FMS types were consistent prior to the earthquake but became more diverse following it. The changes in the FMS types can be interpreted as perturbation of the stress field of the source area induced by the main shock (Diao et al., 2011).
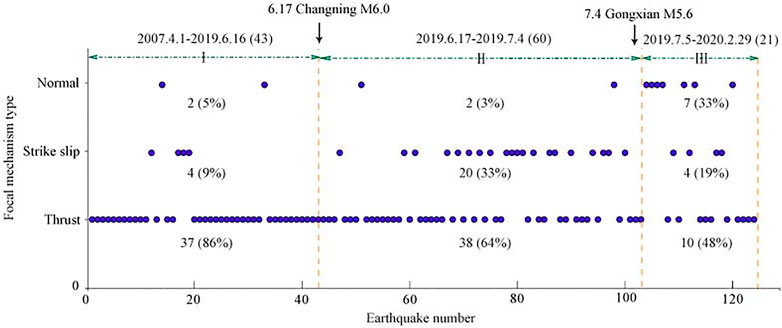
FIGURE 7. The change characteristic of focal mechanism type with time.
The stress fields of the source area during each period were inverted, as shown in Figure 8. The detailed parameters of stress field are listed in Table 5. It is evident that the parameters of the stress field changed significantly over time. The S1 azimuths/plunges in periods I, II, and III were 280°/3.2°, 81°/8.5°, and 274°/9.1°, respectively. Therefore, the S1 azimuth changed from NWW in Period I to NEE in Period II, and then to EW in Period III, with the plunges gradually increasing over time. The stress tensor variance is a quantitative metric of the stress field homogeneity of the study area (Wan, 2011). The variances were 0.14, 0.12, and 0.24 in periods I, II and III, respectively. The gradual increase in variance over time is the result of the increasing diversity of the FMSs and the increasing heterogeneity of the local stress field. In periods I and II, the plunge of S1 is less than 35°, the plunge of S3 is more than52°. In periods III, the plunge of S1 is less than 20°, the plunge of S2 is more than 45°, and the plunge of S3 is less than 40°, the stress regime of the source area during periods I and II indicated a thrust regime, which changed dramatically into a strike-slip regime in Period III. Previous studies have suggested that industrial production activities associated with salt mining, hydraulic fracturing, or geothermal exploitation can induce pore pressure and stress field changes (Li, et al., 2021). Earlier studies reported that large-scale human activities like wastewater reinjection and salt mining have been ongoing for a long time in the Zigong-Longchang and Changning areas (Ruan et al., 2008; Zhang et al., 2012; Sun et al., 2017; Lei et al., 2019). The stress fields in these two areas have similar characteristics, and the analysis shows that the local stress fields in these areas have been altered by wastewater reinjection and salt mining activities. In other regions around the world, rotations of principal stress axes have also been observed in geothermal reservoirs, correlated with large fluid injections (e.g., Martínez-Garzón et al., 2013; Dreger et al., 2017). For two injection episodes in the Geysers geothermal field in California, Martínez-Garzón et al. (2013) found that the usually vertical S1 axis rotated to a shallower plunge by 15–20°, while the usually horizontal S2 and S3 axes plunged more steeply. They also observed a horizontal rotation of ∼20° during one injection interval. All of these rotations were followed by back rotations to the initial stress state when the injection subsided. During another injection episode at the Geysers, Dreger et al. (2017) observed a ∼15° horizontal rotation, accompanied by a transition from a pure strike slip to a transtensional stress state.
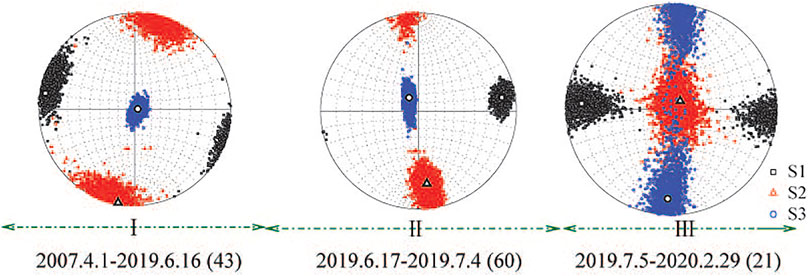
FIGURE 8. The stress field with time in Changning source area The detail of principal stress axis is shown in Figure 3.
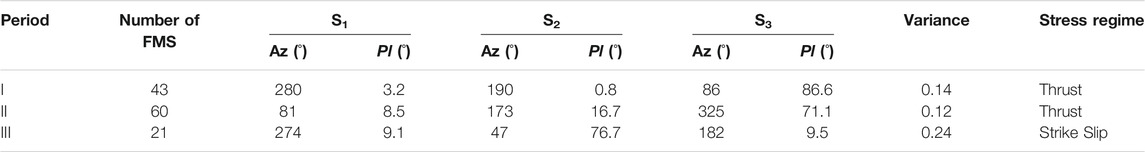
TABLE 5. The stress field in different periods in the Changning source area.
Conclusion
Based on the FMSs of 124 earthquakes with MS ≥ 3.0 occurring in the Changning area from April 1, 2007 to February 29, 2020, the spatiotemporal variations of FMSs and stress field before and after the Changning MS 6.0 earthquake were analyzed.
The Changning MS 6.0 earthquake is a thrust and strike-slip dislocation type with a focal depth of 3km, which is controlled by a NEE near-horizontal local stress. The Changning aftershocks were predominantly thrust fault earthquakes, followed by strike slip earthquakes and then normal fault earthquakes. The P-axis azimuths (NEE) of the aftershocks were different from the NWW orientations of the pre-earthquake.
The principal compressive stress (S1) and stress tensor variances of the Changning aftershock zone varied significantly with space. Tracing the aftershock zone from its southeastern end to its northwestern, the S1 azimuths change from NEE to near-EW in the horizontal plane, and plunges had also gradually increased. Furthermore, the stress regime has changed from a strike-slip regime into a thrust regime. The stress tensor variance in the southern segment was significantly lower than the central and northern segment; strong aftershocks generally occur at or near areas with small stress tensor variances.
The principal compressive stress (S1) of the aftershock zone also varied in the depth dimension. The angle between the S1 azimuths and the strike of Changning anticline varies between 30° and 60° in the southern segment, 60°–90° in the central segment and 90°–120° in the northern segment. The angles gradually transformed from the shallow, NEE-oriented to deep, NWW-oriented.
Significant changes occurred in the FMS types and stress field of the aftershock zone following the Changning earthquake. The FMS types were highly consistent before the Changning earthquake, and became increasingly diverse after the earthquake. The S1 azimuth also changed from NWW to NEE, and EW. The plunge and stress tensor variances increased over time. Furthermore, the pre-earthquake stress field of the aftershock zone transformed from a homogeneous stress field into a heterogenous stress field following the Changning earthquake.
The stress field of a large regional block is usually stable and uniform, although it is possible for anomalies to appear in small localized areas (Zhang et al., 2012). According to Seeber and Armbruster (2000), earthquakes can be signs of stress change, and their spatial and temporal distribution is very sensitive to stress changes. Crustal stress states can be affected by a variety of processes, which include natural processes such as fault creep or magma injection, or human activities such as dam impoundment, salt mining and hydraulic fracturing. It is speculated that the change of stress field in Changning area may be caused by long-term water injection and salt mining activities.
Author’s Note
ZZ, Master, associate professor, mainly engaged in seismicity and digital seismology research
Data Availability Statement
The original contributions presented in the study are included in the article; further inquiries can be directed to the corresponding authors.
Author Contributions
ZZ mainly completed the writing of the manuscript. CL mainly formed the idea of the manuscript and supported the completion of the manuscript. FL mainly completed the data processing. MZ and DW participated worked for the manuscript. All authors contributed to the article and approved the submitted version.
Funding
The research was supported by the Special Project of Central Government Guiding Local Development (2020ZYD026) and Sichuan-Yunnan national Earthquake Monitoring and Prediction Experimental Site Project (2016CESE0101, 20150115).
Conflict of Interest
The authors declare that the research was conducted in the absence of any commercial or financial relationships that could be construed as a potential conflict of interest.
Publisher’s Note
All claims expressed in this article are solely those of the authors and do not necessarily represent those of their affiliated organizations, or those of the publisher, the editors and the reviewers. Any product that may be evaluated in this article, or claim that may be made by its manufacturer, is not guaranteed or endorsed by the publisher.
Acknowledgments
We acknowledge the Sichuan seismic station for providing earthquake observation data. We thank Prof. Zhu lupei of San Luis University of the United States for providing the CAP program. Some figures are generated using the Generic Mapping Tools (GMT) software (Wessel and Smith, 1998). We are very grateful to the editors and reviewers for their constructive comments and thoughtful suggestions.
References
Angelier, J. (1979). Determination of the Mean Principal Directions of Stresses for a Given Fault Population. Tectonophysics 56 (3–4), T17–T26. doi:10.1016/0040-1951(79)90081-7
Chen, T. C., Horiuchi, S., and Zheng, S. H. (2001). Earthquake Focal Mechanisms and Stress Field in Sichuan-Yunnan Area Determined Using P Wave Polarity and Short Period P and S Wave Form Data. Acta Seismologica Sinica 23 (4), 436–440. doi:10.1007/s11589-001-0125-0
Cheng, W. Z., Diao, G. L., Lü, Y. P., Zhang, Y. J., Li, G. F., and Chen, T. C. (2003). Focal Mechanisms, Displacement Rate and Mode of Motion of the Sichuan-Yunnan Block. Seismology Geology. 25 (1), 71–87. doi:10.3969/j.issn.0253-4967.2003.01.008
Cui, X. F., and Xie, F. R. (1999). Preliminary Research to Determine Stress Districts from Focal Mechanism Solutions in Southwest China and its Adjacent Area. Acta Seismologica Sinica 21 (5), 513–522. doi:10.1007/s11589-999-0056-8
Diao, G. L., Xu, X. W., Chen, Y. G., Huang, B. S., Wang, X. S., Feng, X. D., et al. (2011). The Precursory Significance of Tectonic Stress Field Transformation before the Wenchuan Mw7.9 Earthquake and the Chi-Chi Mw7.6 Earthquake. Chin. J Geophys 54 (1), 128–136. doi:10.3969/j.issn.0001-5733.2011.01.014
Dreger, D. S., Boyd, O. S., and Gritto, R. (2017). “Automatic Moment Tensor Analyses, In-Situ Stress Estimation and Temporal Stress Changes at the Geysers EGS Demonstration Project,” in Proc. 42nd Workshop Geotherm, Stanford, Calif, Feb. 13-15 2017 (Reserv. Eng., Stanford Univ).
Dreger, D. S., and Helmberger, D. V. (1993). Determination of Source Parameters at Regional Distances with Three-Component Sparse Network Data. J. Geophys. Res. 98 (B5), 8107–8125. doi:10.1029/93jb00023
Fan, G., and Wallace, T. (1991). The Determination of Source Parameters for Small Earthquakes from a Single, Very Broadband Seismic Station. Geophys. Res. Lett. 18 (8), 1385–1388. doi:10.1029/91gl01804
Gephart, J. W., and Forsyth, D. W. (1984). An Improved Method for Determining the Regional Stress Tensor Using Earthquake Focal Mechanism Data: Application to the San Fernando Earthquake Sequence. J. Geophys. Res. 89 (B11), 9305–9320. doi:10.1029/jb089ib11p09305
He, D. F., Lu, R. Q., Huang, H. Y., Wang, X. S., Jiang, H., and Zhang, W. K. (2019). Tectonic and Geological Background of the Earthquake Hazards in Changning Shale Gas Development Zone. Pet. Exploration Develop. 46 (5), 993–1006. doi:10.11698/PED.2019.05.00
Hu, X. P., Cui, X. F., Zhang, G. W., Wang, G. J., Zang, A., Shi, B. X., et al. (2021). Analysis on the Mechanical Causes of the Complex Seismicity in Changning Area, China. Chin. J Geophys 64 (1), 1–17. doi:10.6038/cjp2021O0232
Kan, R. J., Zhang, S. C., Yan, F. T., and Yu, L. S. (1977). Present Tectonic Stress Field and its Relation to the Characteristics of Recent Tectonic Activity in Southwestern China. ACTA GEOPHUSICA SINICA 20 (2), 96–109.
Lei, X., Wang, Z. W., Wang, Z., and Su, J. (2019). Possible Link between Long-Term and Short-Term Water Injections and Earthquakes in Salt Mine and Shale Gas Site in Changning, South Sichuan Basin, China. Earth Planet. Phys. 3, 510–525. doi:10.26464/epp2019052
Li, T., Sun, J., Bao, Y., Zhan, Y., Shen, Z.-K., Xu, X., et al. (20212021). The 2019 Mw 5.8 Changning, China Earthquake: A cascade Rupture of Fold-Accommodation Faults Induced by Fluid Injection. Tectonophysics 801, 228721. doi:10.1016/j.tecto.2021.228721
Li, Y., and Zeng, Y. F. (1994). On the Sedimentary Response to Thrusting of Longmenshan Thrust belt in Chengdu basin. J. Mineralogy Petrol. 14 (1), 58–66.
Liang, S. S., Xu, Z. G., Sheng, S. Z., Zhang, G. W., Zhao, B., and Zou, L. H. (2020). Focal Mechanism Soltions and Strress Field of the 2019 Changning, Sichuan Mainshock and its Moderate-strong aftershocks(Ms≥4.0). Seismology Geology. 42 (3), 547–561. doi:10.3969/j.issn.0253-4967.2020.03.001
Liu, J., and Zahradník, J. (2020). The 2019 M W 5.7 Changning Earthquake, Sichuan Basin, China: A Shallow Doublet with Different Faulting Styles. Geophys. Res. Lett. 47, e2019GL085408. doi:10.1029/2019GL085408
Lu, Z., Wyss, M., and Pulpan, H. (1997). Details of Stress Directions in the Alaska Subduction Zone from Fault Plane Solutions. J. Geophys. Res. 102 (B3), 5385–5402. doi:10.1029/96jb03666
Luo, Y., Ni, S., Zeng, X., Zheng, Y., Chen, Q., and Chen, Y. (2010). A Shallow Aftershock Sequence in the north-eastern End of the Wenchuan Earthquake Aftershock Zone. Sci. China Earth Sci. 53 (6), 1655–1664. doi:10.1007/s11430-010-4026-8
Luo, Y., Zhao, L., Zeng, X., and Gao, Y. (2015). Focal Mechanisms of the Lushan Earthquake Sequence and Spatial Variation of the Stress Field. Sci. China Earth Sci. 58, 1148–1158. doi:10.1007/s11430-014-5017-y
Martínez-Garzón, P., Bohnhoff, M., Kwiatek, G., and Dresen, G. (2013). Stress Tensor Changes Related to Fluid Injection at the Geysers Geothermal Field, California. Geophys. Res. Lett. 40, 2596–2601. doi:10.1002/grl.50438
Michael, A. J. (1984). Determination of Stress from Slip Data: Faults and Folds. J. Geophys. Res. 89 (B13), 11517–11526. doi:10.1029/jb089ib13p11517
Michael, A. J. (1991). Spatial Variations in Stress within the 1987 Whittier Narrows, California, Aftershock Sequence: New Techniques and Results. J. Geophys. Res. 96 (B4), 6303–6319. doi:10.1029/91jb00195
Michael, A. J. (1987). Use of Focal Mechanisms to Determine Stress: A Control Study. J. Geophys. Res. 92 (B1), 357–368. doi:10.1029/jb092ib01p00357
Patton, H. (1980). Reference point Equalization Method for Determining the Source and Path Effects of Surface Waves. J. Geophys. Res. 85, 821–848. doi:10.1029/jb085ib02p00821
Ruan, X., Cheng, W. Z., Zhang, Y. J., Li, J., and Chen, Y. (2008). Research of the Earthquake Induced by Water Injections in Salt Mines in Changning, Sichuan. Earthquake Res. China 24 (3), 226–234. doi:10.3969/j.issn.1001-4683.2008.03.004
Seeber, L., and Armbruster, J. G. (2000). Earthquakes as Beacons of Stress Change. Nature 407 (6800), 69–72. doi:10.1038/35024055
Sun, Q., Pei, S. P., Su, J. R., Liu, Y. B., Xue, X. T., Li, J. W., et al. (2021). Three-dimensional Seismic Velocity Structure across the 17 June 2019 Changning Ms6.0 Earthquake, Sichuan, China. Chin. J Geophys 64 (1), 36–53. doi:10.6038/cjg2021O0246
Sun, X., Yang, P., and Zhang, Z. (2017). A Study of Earthquakes Induced by Water Injection in the Changning Salt Mine Area, SW China. J. Asian Earth Sci. 136, 102–109. doi:10.1016/j.jseaes.2017.01.030
Tan, Y., Zhu, L., Helmberger, D. V., and Saikia, C. K. (2006). Locating and Modeling Regional Earthquakes with Two Stations. J. Geophys. Res. 111, B11. doi:10.1029/2005JB003775
Thio, H. K., and Kanamori, H. (1995). Moment-tensor Inversions for Local Earthquakes Using Surface Waves Recorded at TERRAscope. Bull. Seis Soc. Amer 85 (4), 1021–1038. 10.1785/BSSA0850041021.
Waldhauser, F., and Ellsworth, W. L. (2000). A Double-Difference Earthquake Location Algorithm: Method and Application to the Northern Hayward Fault, California. Bull. Seismological Soc. America 90 (6), 1353–1368. doi:10.1785/0120000006
Wan, Y. G. (2011). Contemporary Tectonic Stress Field in China. Translated World Seismology 3, 18–29.
Wang, S. Z. (2014). The Tectonic Characteristics of Changning Area, South of Sichuan and Crack Characteristics of Longmaxi Formation of Silurian System. Chengdu: Chengdu University of Technology.
Wessel, P., and Smith, W. H. F. (1998). New, Improved Version of Generic Mapping Tools Released. Eos Trans. AGU 79, 579. doi:10.1029/98EO00426
Wiemer, S. (2001). A Software Package to Analyze Seismicity: ZMAP. Seismological Res. Lett. 72 (2), 373–382. doi:10.1785/gssrl.72.3.373
Wiemer, S., Gerstenberger, M., and Hauksson, E. (2002). Properties of the Aftershock Sequence of the 1999 Mw 7.1 Hector Mine Earthquake: Implications for Aftershock Hazard. Bull. Seismological Soc. America 92 (4), 1227–1240. doi:10.1785/0120000914
Yang, Y., Liang, C., Fang, L., Su, J., and Hua, Q. (2018). A Comprehensive Analysis on the Stress Field and Seismic Anisotropy in Eastern Tibet. Tectonics 37, 1648–1657. doi:10.1029/2018TC005011
Yang, Y., Liang, C., Li, Z., Su, J., Zhou, L., and He, F. (2017). Stress Distribution Near the Seismic gap between Wenchuan and Lushan Earthquakes. Pure Appl. Geophys. 174, 2257–2267. doi:10.1007/s00024-016-1360-6
Yi, G. X., Long, F., Liang, M. J., Zhao, M., Wang, S. W., Gong, Y., et al. (2019). Focal Mechanism Solutions and Seismogenic Structure of the 17 June 2019 Ms6.0 Sichuan Changning Earthquake Sequence. Chin. J Geophys 62 (9), 3432–3447. doi:10.6038/cjg2019N0297
Zhang, Z. W., Cheng, W. Z., Liang, M. J., Wang, X. S., Long, F., Xu, Y., et al. (2012). Study on Earthquakes Induced by Water Injection in Zigong-Longchang Area, Sichuan. Chines J. Geophys. 55 (5), 1635–1645. doi:10.6038/j.issn.0001-5733.2012.05.021
Zhang, Z. W., Zhou, L. Q., Cheng, W. Z., Ruan, X., and Liang, M. J. (2015b). Focal Mechanism Solutions of Lushan Mw6.6 Earthquake Sequence and Stress Field for Aftershock Zone. Earth Science-Journal China Univ. Geosciences 40 (10), 1710–1722. doi:10.3799/dqkx.2015.154
Zhang, Z. W., Zhou, L. Q., Long, F., and Ruan, X. (2015a). Spatial and Temporal Characteristic of Stress Field for Wenchuan Ms8.0 and Lushan Ms7.0 Earthquake Sequence. Seismology Geology. 37 (3), 804–817. doi:10.3969/j.issn.0253-4967.2015.03.011
Zhao, L. S., and Helmberger, D. V. (1994). Source Estimation from Broadband Regional Seismograms. Bull. Seismol Soc. Amer 84 (1), 91–104.
Zhao, M., Long, F., Yi, G., Liang, M., Xie, J., and Wang, S. (2021). Focal Mechanism and Seismogenic Structure of the MS 5.1 Qingbaijiang Earthquake on February 3, 2020, Southwestern China. Front. Earth Sci. 9, 644142. doi:10.3389/feart.2021.644142
Zheng, Y., Ma, H. S., Lü, J., Ni, S. D., Li, Y. C., and Wei, S. J. (2009). Source Mechanism of Strong Aftershocks (MS≥5.6) of the 2008/05/12 Wenchuan Earthquake and the Implication for Seismotectonics. Sci. China (Series D) 39 (4), 413–426. doi:10.1360/zd2009-39-4-413
Zhong, J. M., and Cheng, W. Z. (2006). Determination of Directions of the Mean Stress Field in Sichuan-Yunnan Region from a Number of Focal Mechanism Solutions. Acta Seismologica Sinia 28 (4), 337–346. doi:10.1007/s11589-004-0359-y
Zhu, L., and Helmberger, D. V. (1996). Advancement in Source Estimation Techniques Using Broadband Regional Seismograms. Bull. Seismol Soc. Amer 86 (5), 1634–1641. doi:10.1785/bssa0860051634
Keywords: the MS 6.0 changning earthquake, focal mechanism solution, stress field, principal compressive stress, spatiotemporal variation
Citation: Zhang Z, Liang C, Long F, Zhao M and Wang D (2022) Spatiotemporal Variations of Focal Mechanism Solutions and Stress Field of the 2019 Changning Ms 6.0 Earthquake Sequence. Front. Earth Sci. 9:797907. doi: 10.3389/feart.2021.797907
Received: 19 October 2021; Accepted: 14 December 2021;
Published: 07 January 2022.
Edited by:
Ying Li, China Earthquake Administration, ChinaReviewed by:
Bin Zhou, Earthquake Bureau of the Guangxi Zhuang Autonomous Region, ChinaLibo Han, China Earthquake Administration, China
Copyright © 2022 Zhang, Liang, Long, Zhao and Wang. This is an open-access article distributed under the terms of the Creative Commons Attribution License (CC BY). The use, distribution or reproduction in other forums is permitted, provided the original author(s) and the copyright owner(s) are credited and that the original publication in this journal is cited, in accordance with accepted academic practice. No use, distribution or reproduction is permitted which does not comply with these terms.
*Correspondence: Zhiwei Zhang, enp3MTk4MzEwN0AxNjMuY29t; Chuntao Liang, bGlhbmdjaHVudGFvMTJAY2R1dC5jbg==