 Lihua Liu
 Tianyao Hao
 Chuanchuan Lü4
 Kwanghee Kim
 Hanjoon Kim
- 1Key Laboratory of Petroleum Resources Research, Institute of Geology and Geophysics, Chinese Academy of Sciences, Beijing, China
- 2Institutions of Earth Science, Chinese Academy of Sciences, Beijing, China
- 3College of Earth and Planetary Sciences, University of Chinese Academy of Sciences, Beijing, China
- 4Bullard Laboratories, Department of Earth Sciences, University of Cambridge, Cambridge, United Kingdom
- 5Qingdao Institute of Marine Geology, Qingdao, China
- 6Department of Geological Sciences, Pusan National University, Busan, South Korea
- 7Korea Institute of Ocean Science and Technology, Busan, South Korea
Unlike stable cratons elsewhere in the world, the lithosphere is strongly thinned in the east of both the North China Craton (NCC) and the Yangtze Craton (YZC) compared with the west. We deployed four active-source onshore-offshore wide-angle seismic survey lines in the eastern NCC and YZC from 2010 to 2016 with the aim of revealing the mechanism of lithospheric thinning and the process of the collision between the NCC and YZC. We obtained high-resolution crustal P-wave velocity models for the eastern NCC and YZC based on seismic forward modeling, travel-time tomography, and finite-difference wave-field modeling. Based on our integrated geophysical study and previous work, we propose a five-stage model for the collision between the YZC and NCC, with different dominant geodynamic mechanisms in each stage. Our collision model shows that lithospheric thinning in the eastern NCC and YZC is a consequence of the NCC-YZC collision and subduction of the Pacific plate.
Introduction
North China (Figure 1) was formed by the convergence of the North China Craton (NCC) and the Yangtze Craton (YZC) during the Triassic (Wan, 2012). The collision between the NCC and YZC formed the world’s largest ultra-high-pressure metamorphism (UHPM) tectonic unit (Zheng, 2008), the Qingling-Dabie-Sulu Orogenic Belt (QDSOB), characterized by the presence of coesite and diamond inclusions (Wang et al., 1989; Xu et al., 1992). These minerals indicate that the shallow layers of the cratonic crust were subducted to a depth >80 km (Harley and Carswell, 1995) and then exhumed to the surface after a period of UHPM. The UHPM provides a rich source of information about the deep lithosphere and therefore the QDSOB has become a natural laboratory for studying the dynamics of continent-continent collision, subduction, and exhumation (Chopin, 2003; Zheng et al., 2003; Zhang et al., 2009).
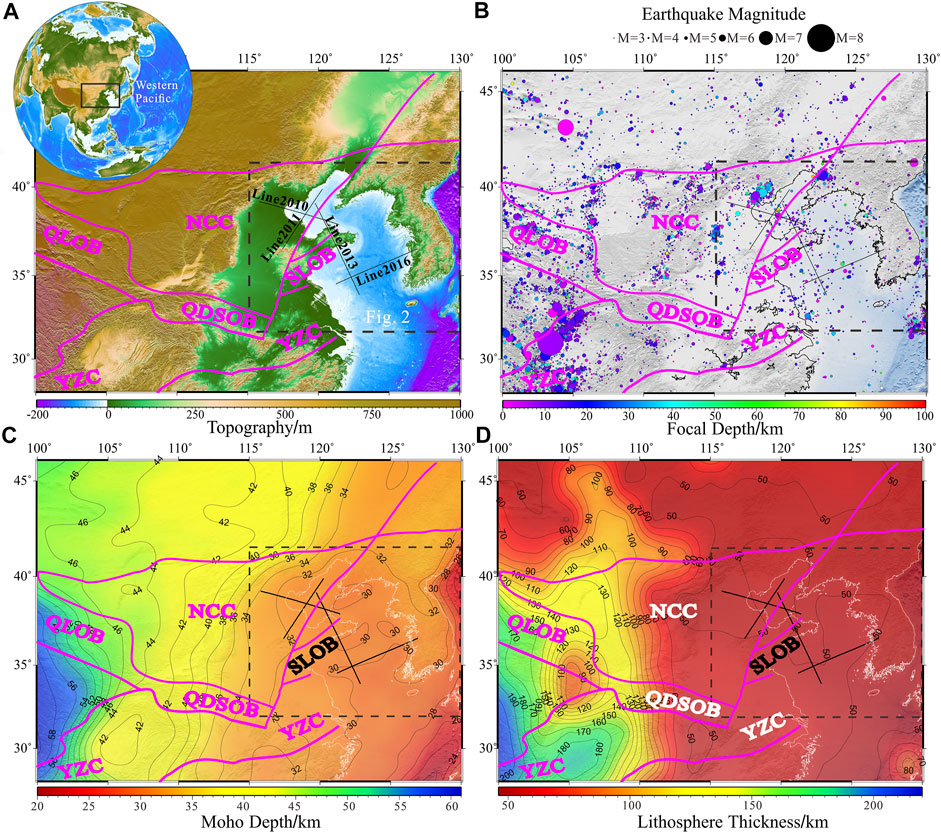
FIGURE 1. (A) Topography of North China locating in the black box in the upper left insert map. (B) Seismicity with magnitude larger than 3 in North China from 1960s to 2021 (the earthquake events catalog was downloaded from IRIS: https://ds.iris.edu/ds/nodes/dmc/data/types/events/). (C) Moho depth of North China (after Hao et al., 2014). (D) Lithosphere thickness of North China (after Sun et al., 2021). The tectonic units are annotated in Figure (A–D), the study area (Figure 2) of this paper is located in the black dashed boxes of Figure (A–D). The black solid lines are active-source wide-angle seismic survey lines deployed by us from 2010 to 2016 in the study area (Liu et al., 2015; Liu et al., 2021). QLOB, qilian orogenic belt; QDSOB, qinglin-dabie-sulu orogenic belt; SLOB, sulu orogenic belt.
Figure 1 shows that both the crust and lithosphere of the NCC and YZC are thinner in eastern China than in western China, especially in the offshore domains of the Bohai Sea and the South Yellow Sea (SYS). Irrespective of how the rocks affected by UHPM were exhumed to the surface of the Sulu Orogenic Belt (SLOB), the exhumation process is clearly inseparable from the collision between the NCC and YZC and lithospheric thinning. The changes in the deep structure along the NCC, YZC, and SLOB are important in determining the mechanisms of lithospheric thinning and exhumation of the UHPM rocks, but previous studies have been limited to the onshore domains (Zhang et al., 2009; Choi et al., 2015; Li et al., 2018) and the deep structures of the offshore extensions of the NCC, YZC, and SLOB have only been inferred from the onshore results. As yet, there has been no geophysical study of the deep structures in the Bohai Sea and SYS, only shallow seismic profiles and regional-scale geophysical studies (Wan and Hao, 2009; Li et al., 2012).
We deployed four active-source onshore-offshore wide-angle seismic survey lines in the Bohai Sea and SYS from 2010 to 2016 and extended these results to the adjacent onshore regions (Figure 1). We obtained high-resolution crustal models in the offshore domains using seismic forward modeling, travel-time tomography, and finite-difference wave-field modeling. By integrating P-wave, gravity, and magnetic anomaly analyses, we revealed the differences in the deep structure and crustal deformation between the NCC and YZC and the offshore extension of the SLOB, in addition to the deep dynamics of lithospheric thinning and exhumation of the UHPM rocks in eastern China.
Our work provides information about the deep structures offshore and provides new geophysical data for quantitative research on lithospheric thinning in the NCC and YZC. Our results can be used to modify reference models for northern China and provide a solid foundation for understanding the evolution and tectonic effects of continent-continent collision, subduction, and exhumation.
Geological Backgrounds
The northern part of the study area is in the eastern NCC (Figure 2), which was formed before 1.8 Ga (Zhu et al., 2011; Zhu et al., 2012). The NCC records major tectonic processes during the early evolution of the Earth, but is different from other cratons in that it experiences frequent seismic activity (Figure 1B) and has undergone extensive crustal and lithospheric thinning (Figures 1C,D) and destruction (Wu et al., 2008; Zhu et al., 2011; Zhu et al., 2012). The NCC can be divided into three parts based on the thickness of the lithosphere (Zhu et al., 2011; Zhu et al., 2012): the stable western region (>200 km thick), the transitional central region (80–200 km thick), and the severely thinned eastern region (<80 km thick). The thickest lithosphere of 215 km is found in the Ordos Massif in the western part of the NCC and the thinnest is located in the Bohai Sea in the eastern NCC with a thickness of <60 km (Chen et al., 2009; Zhu et al., 2012). The dynamic destruction of the NCC and the large spatial extent of lithospheric thinning are well studied in craton research (Gao et al., 2004; Wu et al., 2008). Many studies have shown that there may be an important relationship between the thinning of the lithosphere in the NCC and the collision between the NCC and YZC (Gao et al., 2008; Wu et al., 2008; Liu et al., 2015).
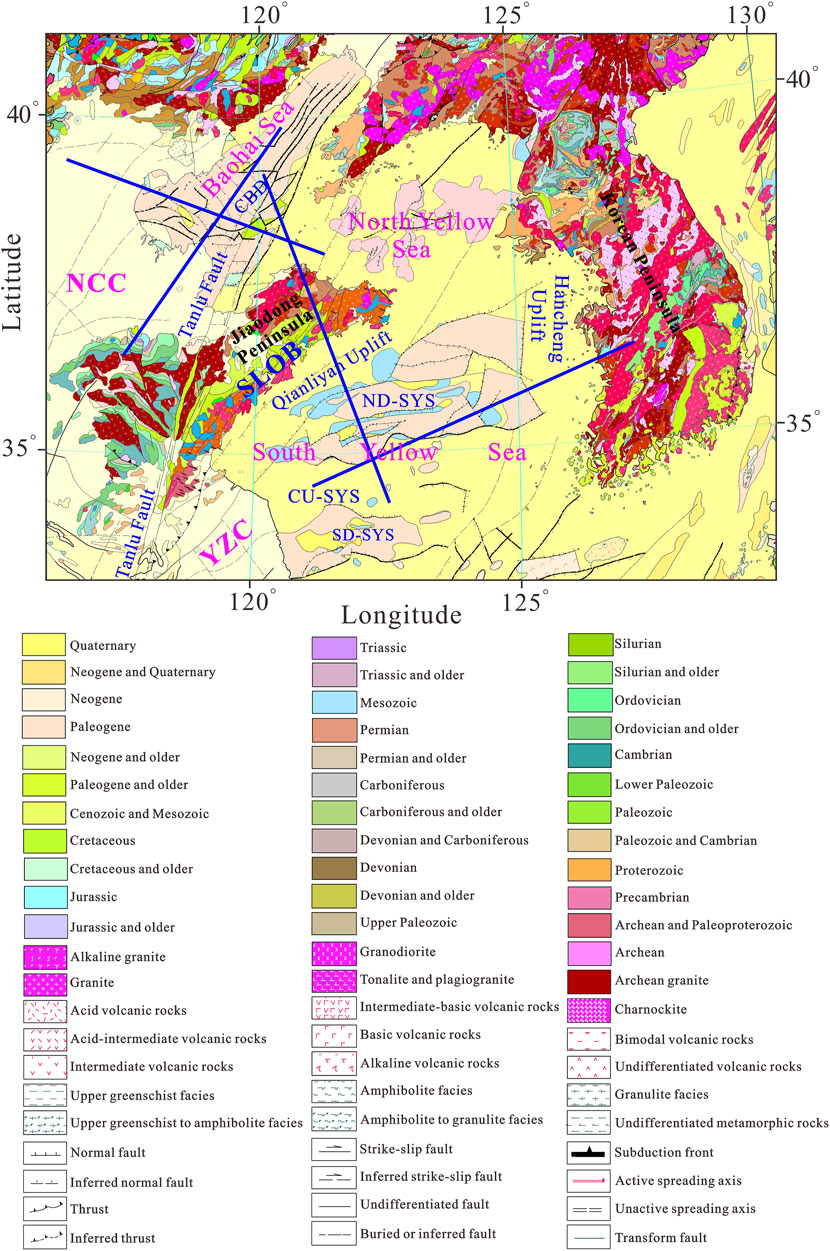
FIGURE 2. Geological map of the study area (after Wang et al. (2017), and has the same legend as their results). The blue lines are the locations of wide-angle seismic profiles as shown in Figure 1. The offshore tectonic units involved include: Central Bohai Depression (CBD), Qianliyan Uplift, Northern Depression of SYS (ND-SYS), Central Uplift of SYS (CU-SYS), and Southern Depression of SYS (SD-SYS). The geological map can be accessed via: http://dcc.ngac.org.cn/geologicalData/rest/geologicalData/geologicalDataDetail/402881f75d9bbbed015d9bbbfa280000.
The SLOB is located on the southern Jiaodong Peninsula and in the northern SYS (Figure 2) and retains a large number of structural traces generated during the collision between the NCC and YZC (Hao et al., 2010). As the eastern extension of the QDSOB, the SLOB is an important region for studying the dynamics of continent-continent collision, subduction, and re-entry (Liu et al., 2021). Based on petrological chronology research, geochemical analysis, and deep structural geophysical observations around the SLOB, early research constrained the exhumation time of the UHPM to about 120 Ma in the Cretaceous (Li et al., 2009). Various mechanisms and models have been proposed to explain the exhumation of the UHPM rocks, including buoyancy forces and extension (Platt, 1993), lower crustal delamination (Gao et al., 1998; Kern et al., 1999), the buoyancy-driven exhumation of upper crustal slices (Chemenda et al., 1995; Chemenda et al., 1996), and forced flow in a subduction channel (Gerya and Stockhert, 2002). On the basis of multi-disciplinary research, Xu et al. (2009) proposed a polyphase exhumation mode for the continental crust in which the Sulu UHPM zone is composed of several exhumed tectonic slices of the subducted continental YZC crust.
The SYS in the southern part of the study area is an important component of the YZC (Figure 2). Like the NCC, the YZC is divided into three parts from west to east: the upper, middle, and lower YZC. Based on magnetotelluric sounding (Xiao et al., 2014), active-source seismic sounding (Xu et al., 2014; Lü et al., 2015; Liu et al., 2021), earthquake tomography (Jiang et al., 2013; Ouyang et al., 2014; Bao et al., 2015), and receiver function analysis (Shi et al., 2013; Zheng et al., 2014), previous studies reached a consensus that the lithosphere of the YZC has undergone significant thinning from west to east (Figure 1D) and that the thinning reaches a maximum in the eastern YZC, with a lithospheric thickness of <80 km (An and Shi, 2006) and a crustal thickness <35 km (Zhang et al., 2009).
Because both the NCC and YZC have experienced significant lithospheric thinning in eastern China, it is natural to ask the following questions. Did the lithosphere thin gradually or suddenly in these cratons? Did the lithosphere of one craton thin first, or did they both thin at the same time? Did lithosphere thinning occur before or after the collision between the YZC and NCC? Did the crust and lithosphere of the NCC and YZC thin at the same time? Did the crust or the lithospheric mantle have a more important role in lithospheric thinning, or did they have the same level of thinning?
Radioisotope dating indicates that the UHPM rocks in the QDSOB were formed between 245 and 210 Ma (Xu et al., 2006; Zheng, 2008), which is also the time period of the collision between the YZC and NCC. The time at which the lithosphere of the NCC began to thin has not yet been determined (Wu et al., 2008), but it is thought that the upper limit is in the Mesozoic and the lower limit is in the Cenozoic (Wu et al., 2008), with the peak time of lithospheric thinning in the NCC at 130–120 Ma (Wu et al., 2008; Zhu et al., 2012). Sudden magmatic activity during the J3 period in the lower Yangtze area (Deng and Wu, 2001) indicates that the peak time of lithospheric thinning here was about 140 Ma (Late Jurassic). Based on petrological chronology, geochemical analyses, and geophysical observations of the deep structure around the QDSOB, early research (Li et al., 2005) constrained the exhumation time of the UHPM to about 120 Ma (Cretaceous). By summarizing the time relationships among the tectonic events, we see that lithospheric thinning of both the NCC and YZC occurred after their collision, close to the time at which the UHPM rocks were exhumed. This indicates that the collision of these two blocks played an important part in both lithospheric thinning and the exhumation of the UHPM rocks.
Regional Gravity and Magnetic Anomaly Analyses
The overall variations of the Bouguer gravity anomalies and the reduction to pole magnetic anomalies change mildly in the Bohai Sea (Figure 3). Taking the NE-striking Tanlu Fault, which corresponds to the zero-value contour of the gravity and magnetic anomalies, as the boundary, the Bouguer gravity anomaly is low in the NW and high in the SE. By contrast, the reduction to pole magnetic anomaly is high in the NW and low in the SE. East of the Tanlu Fault, the gravity anomaly is mainly characterized by a large area with a small negative anomaly (−20 to 0 mGal) and a NE-striking negative anomaly trap is formed in the Central Bohai Depression (Figure 3A). The reduction to pole magnetic anomaly (Figure 3B) mainly has a low positive value (0–200 nT) and the main strike is also NE. By contrast, the western side of the Tanlu Fault is dominated by a NE-striking small positive gravity anomaly (0–30 mGal) and a negative magnetic anomaly (−100 to 0 nT).
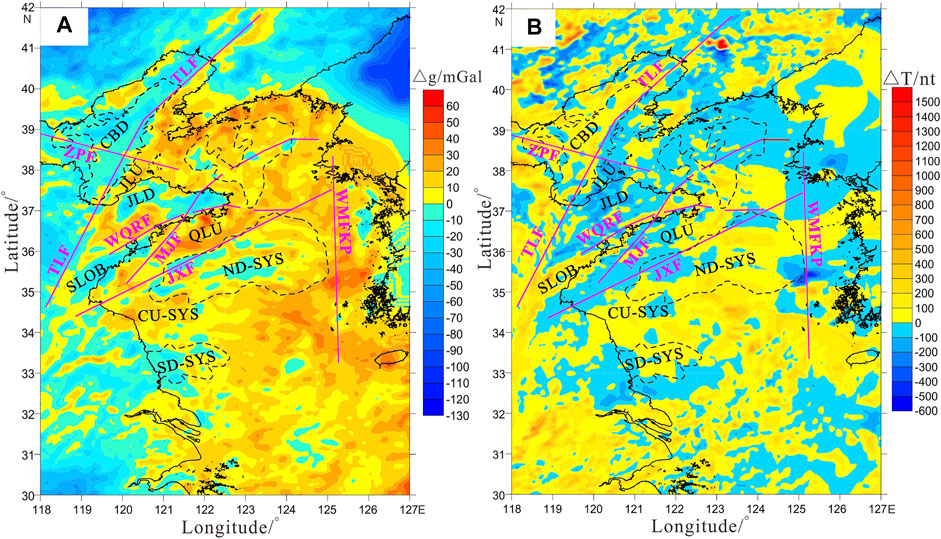
FIGURE 3. The Bouguer gravity anomaly (A) and the reduction to pole magnetic anomaly (B) of the study area (after Hao et al., 2010). The black dashed boxes indicate the depressions in the sea area. The pink solid lines are the main great faults in the study area, including: ZPF, Zhangjiakou-Penglai Fault; TLF, Tanlu Fault; LYF, Lianyan Fault; WQRF, Wulian-Qingdao-Rongcheng Fault; MJF, Muping-Jimo Fault; JXF, Jianshan-Xiangshui Fault; WMFKP, Western Marginal Fault of Korean Peninsula. The main tectonic units include: CBD, Central Bohai Depression; JLU, Jiaoliao Uplift; JLD, Jiaolai Depression; SLOB, Sulu Orogenic Belt; QLU, Qianliyan Uplift; ND-SYS, Northern Depression of SYS; CU-SYS, Central Uplift of SYS; SD-SYS, Sourthern Depression of SYS.
The gravity and magnetic anomalies of the onshore domain of the Jiaodong Peninsula are clearly different from those in the offshore domain of the Bohai Sea and the Yellow Sea (Figure 3). The Bouguer gravity anomalies onshore are generally low in the NE and high in the SW. A pair of negative gravity anomalies with amplitudes of −30 mGal are oriented diagonally in a northeasterly direction between the Wulian-Qingdao-Rongcheng and Muping-Jimo faults (Figure 3A). The reduction to pole magnetic anomaly in this region is dominated by a large range of negative anomalies and a pair of positive magnetic anomalies with an anomaly of about 200 nT is oriented diagonally in a northeasterly direction between the Wulian-Qingdao-Rongcheng and the Muping-Jimo faults (Figure 3B). The Wulian-Qingdao-Rongcheng and Muping-Jimo faults clearly had a role in controlling the distribution of the tectonic units and the intrusion of magmatic rocks on the Jiaodong Peninsula.
The gravity and magnetic anomalies in the SYS also show that the structural uplifts correspond to positive gravity anomalies and negative magnetic anomalies, whereas the structural depressions correspond to negative gravity anomalies and positive magnetic anomalies (Figure 3). In contrast with the large-scale, low-value negative Bouguer anomalies in the Bohai Sea, the gravity anomalies in the SYS are dominated by large-scale positive anomalies, with a maximum (about 60 mGal) at the Qianliyan Uplift (Figure 3A).
Methodology and Results
Data Acquisitions
We deployed four active-source onshore-offshore wide-angle seismic survey lines (Line 2010, Line 2011, Line 2013, and Line 2016) in the Bohai Sea and SYS from 2010 to 2016 and extended these lines onshore in the adjacent areas (Figure 1 and Table 1). Line 2010 had a total length of 517 km, 160 land stations, and 52 ocean bottom seismometers (OBSs) were deployed. There were 98% of the deployed OBSs recovered, and 39 of them could provide useful seismic records. Although three kinds of air-gun arrays were designed for Line 2010, we mainly used the 1576 shots of the air gun in volume of 9300 in3 in the modeling of this paper. Line 2011 had a total length of 450 km, 200 land stations, and 40 OBSs were deployed. All the OBSs were recovered, and only 4 of them failed to record valid signals. Two kinds of air-gun arrays were designed for Line 2011, and both had 1,118 shots, we only used the datasets of air-gun array with volume of 9000 in3. Line 2013 was 645-km long, and extends from the central Bohai Sea through the Jiaodong Peninsula to the South Yellow Sea, 130 land stations were deployed onshore area, and 52 OBSs were deployed offshore area. All the deployed OBSs were recovered, and 45 of them could provide useful traveltimes of seismic phases produced by a 6060-in3 air-gun array. Line 2016 was 565-km long in total, 100 land stations, and 31 OBSs were deployed. All the OBSs were successfully recovered, and only one of them failed. The offshore source of Line 2016 was a 6640-in3 air gun, and 4502 shots were fired. In summary, we deployed four dense active source wide-angle seismic survey profiles in East China, the recovery rates of OBSs were very good for all these four lines (>98%) and only a few of the recovered OBSs did not record the air-gun signals (Table 1).
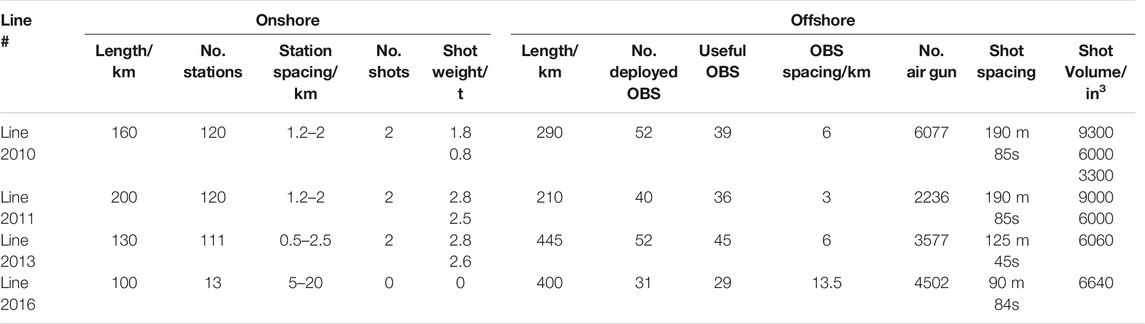
TABLE 1. Observation parameters of the wide-angle seismic survey profiles
Methodology
After pre-processing the data, including linear time drift correction, OBS relocation, denoising, and deconvolution (Figure 4), we picked the travel-times of the refraction and reflection seismic phases from all the useful OBSs and land stations (Liu et al., 2015; Liu et al., 2021). We found that most of the OBS stations provided useful data at offsets of up to 100 km (Figure 5), although a few OBS stations only provided effective observations within 60 km offsets. All the land stations had high signal-to-noise ratio land explosion records and some also had high-quality air-gun signals. The main seismic phases included in the modeling were: the direct water wave (Pw), refraction within the sediments (Ps), the reflection from the sediment basement (P1), refraction within the upper crust (Pg1), reflection from the base of the upper crust (P2), refraction within the mid-crust (Pg2), reflection from base of the mid-crust (PcP), reflection from the Moho (PmP), and refraction within the top of the upper mantle (Pn). Most of the phases in the Bohai Sea and SYS had the same distribution, but the refractions within the upper crust of the northern SYS had lower travel times and larger apparent velocities than those in the Bohai Sea from offset 0 km to about 120 km, indicating a roughly 120-km scale high-velocity anomaly in the upper crust of the northern SYS. The high-velocity anomaly was linked to the exhumation of the UHPM rocks in the SLOB (Liu et al., 2021).
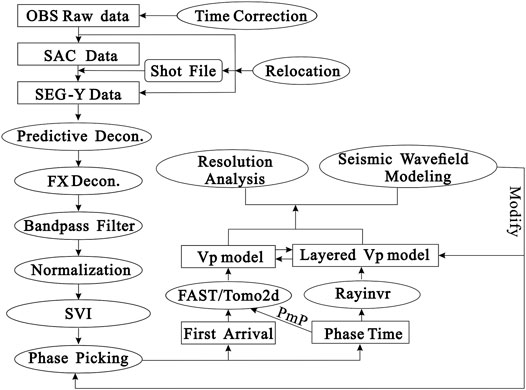
FIGURE 4. The main flowchart of onshore-offshore wide-angle seismic data processing. The abbreviations include Decon.: Deconvolution, SVI, Super Virtual Interferometry. FAST, Tomo2d and Rayinvr are three different modeling software packages developed by Zelt and Barton (1998), Korenaga et al. (2000), and Zelt and Smith (1992), respectively.
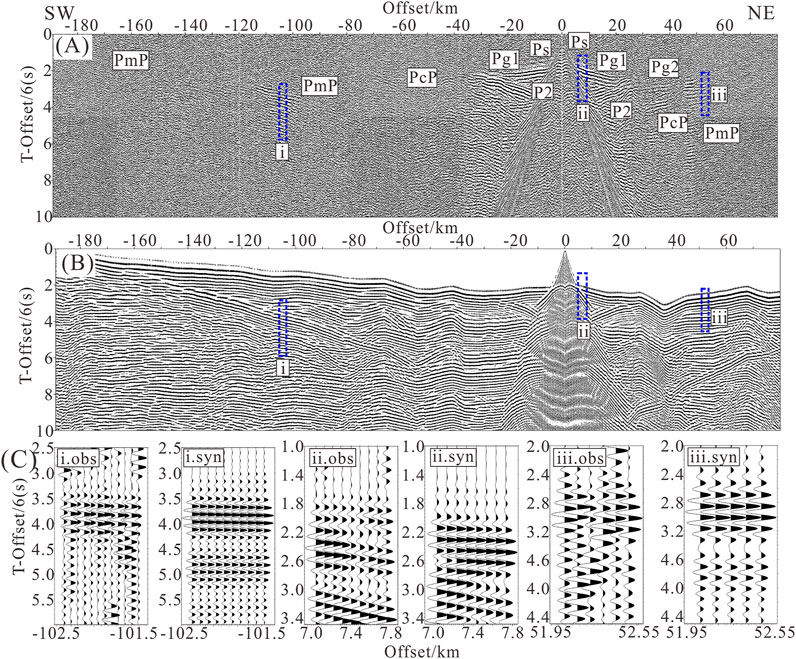
FIGURE 5. (A) Observed seismograms after pre-processing from the hydrophone of OBS C15 located in the middle of ND-SYS on Line 2016. The blue dashed squares (i, ii, iii) that have relatively higher SNR, are displayed in Figure 5C as a close-up of the observed seismograms. (B) Corresponding synthetic seismograms calculated from the Vp model of Line 2016 by using the finite difference modeling code from the Seismic Unix package (Stockwell, 1999). The trace spacing was 100 m, the frequency of the source wavelet centered around 5 Hz. A free boundary condition was given to the top of the model, and the other three boundaries were set as absorbing boundary conditions. No noise was added to the synthetic seismograms. The blue dashed squares (i, ii, iii) are located at the same position as Figure 5(A) and are displayed in Figure 5(C) as a close-up of the synthetic seismograms. (C) The close-up image of the squares i, ii, iii in Figure 5(A,B), and they are displayed with a gain and filter proportional to offset. All figures have the same reduced velocity (6 km/s).
The shallow structures constrained by previous studies (Cho et al., 2006; Bai et al., 2007; Wei et al., 2007; Shinn et al., 2010; Cho et al., 2013; Kim et al., 2019) were used as the shallow constraints. The average structure of the crust around the study area was used as a reference and the deep layers were set as horizontal layers, with the velocity increasing with depth, to build the initial models for these four lines. All the initial models had a depth of 50 km and six layers, including the water layer (constant velocity 1.5 km/s), the sedimentary layer (1.8–3.5 km/s), the upper crust (4.0–6.2 km/s), the mid-crust (6.3–6.6 km/s), the lower crust (6.7–7.0 km/s), and the top of the upper mantle (8.0–8.4 km/s). The initial models were continuously adjusted to gradually improve the fit of the calculated and measured travel-times (Figure 6) using the forward modeling software Rayinvr (Zelt and Smith, 1992), based on “trial-and-error” and “layer-stripping.” The reflections were mainly used to constrain the depth of the interfaces, while the refractions were mainly used to constrain the velocity of the layers. The value of the root-mean-square travel-time (Trms) and the normalized χ2 were used as the basis for the fitting error (Zelt and Smith, 1992). Trms and χ2 were continuously modified by adjusting the initial model until the optimum model was found—that is, the model that had a converged travel-time residual distribution, the smallest Trms, and the χ2 value closest to 1.0 (Figure 6 and Table 2).
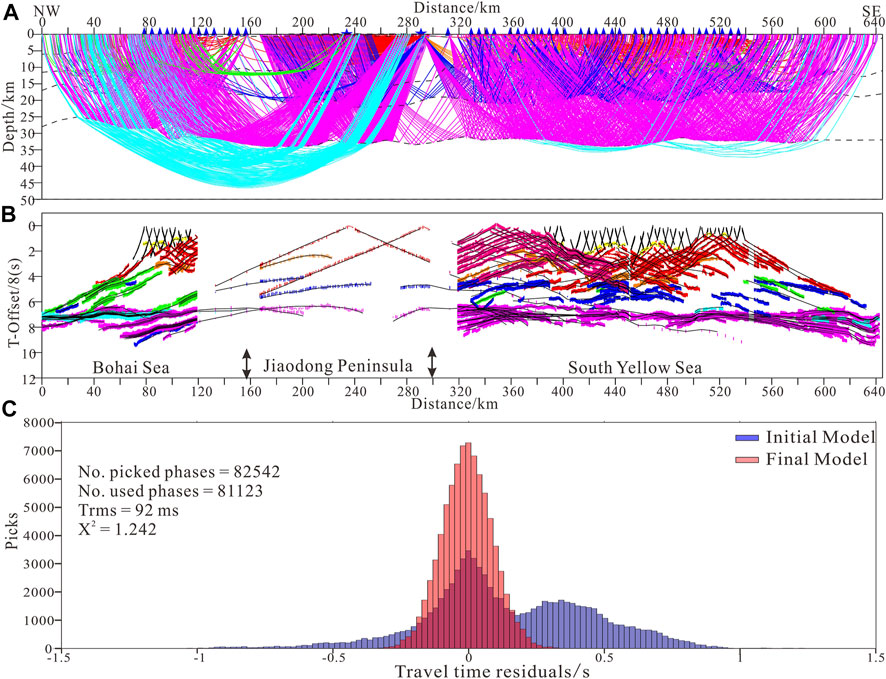
FIGURE 6. (A) Ray paths of all phases from the sources to the receivers of Line 2013. The blue triangles on the top are useful OBSs and land stations, and only 1/50 of the air gun ray paths are displayed. (B) Observed traveltimes (colored short vertical lines, whose length are corresponding to picking uncertainties) and calculated traveltimes (black solid lines) for all stations of Line 2013. (C) Traveltime residual distribution of the initial model (blue histogram in the rear) and the finial forward model (red histogram in the front).
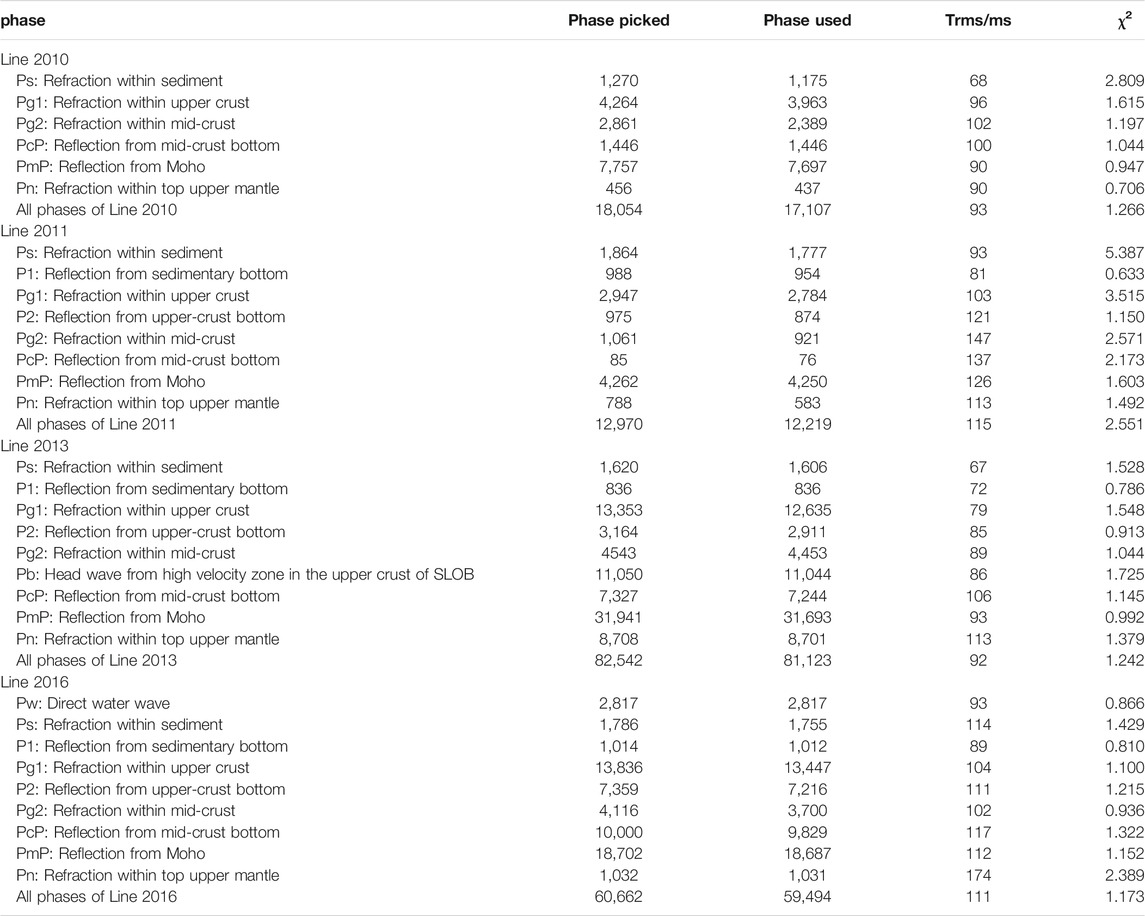
TABLE 2. Number of picked and used phases in the forward modeling, and main uncertainties for the forward model
We obtained the ray coverage (Figure 7) of the velocity models during the forward modeling by Rayinvr package (Zelt and Smith, 1992). We can see that most of the crustal structure has good ray coverage (>200 ray hits) for these four wide-angle seismic profiles, and the common feature is that the offshore domains are better resolved than the onshore domains due to the denser stations and smaller source spacing in the offshore areas. Since the Pn phases were picked only at far offsets (>100 km) from a few stations, the ray density within the uppermost mantle is less than that within the crust. Moreover, the forward models were double checked with seismic traveltime tomography using the FAST package developed by Zelt and Barton (1998) and the Tomo2d package developed by Korenaga et al. (2000), because the forward modes usually tend to give smooth velocity structures. The smoothed forward models were taken as the initial models, and the traveltimes of first arrivals and Moho reflections used in the forward modeling were selected to inversion the Vp models by traveltime tomography methods.
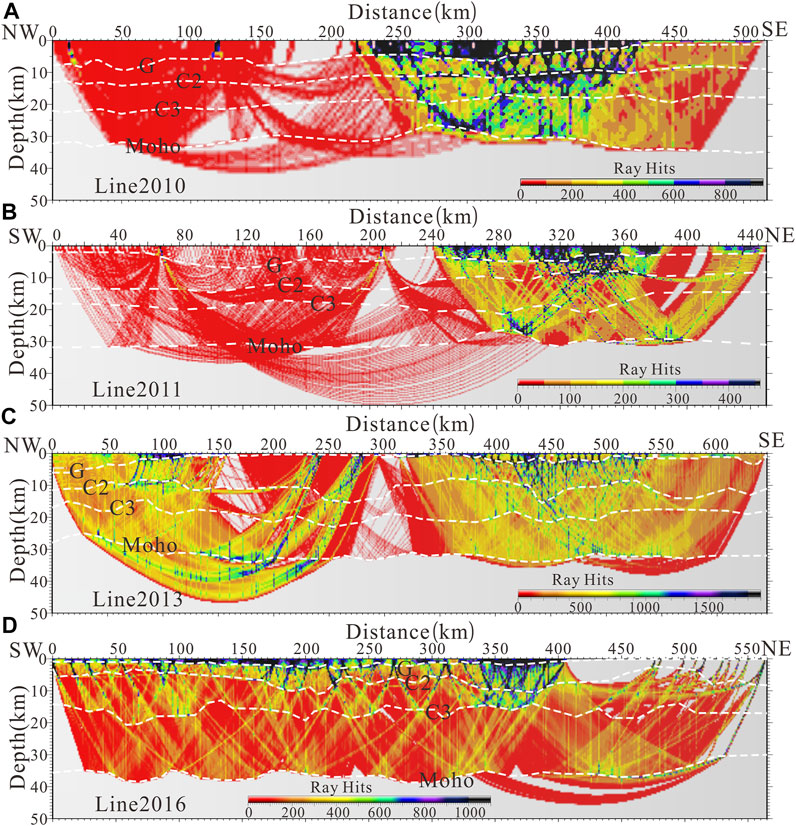
FIGURE 7. (A) Ray hits of Line 2010 (A), Line 2011 (B), Line 2013 (C), and Line 2016 (D), respectively. The regions without ray paths are shown in gray. The white dashed lines indicate the main interfaces (G, C2, C3, and Moho) in the Vp models.
Finite-difference wave-field modeling was applied to further constrain the Vp structure and the phase identification with the Seismic Unix package (Stockwell 1999). We obtained the corresponding synthetic seismograms at the locations of the stations (Figures 5B,C) and the land explosions. The synthetic seismograms reproduced the reflection/refraction seismic phase travel-times and apparent velocities well at different offsets, indicating that the established Vp model took most of the picked phases into account.
We estimated the resolution of the models for the four lines by applying differently sized checkerboard tests (Figure 8) for the inversion models and perturbation analysis and the F-test for the forward models (Liu et al., 2015; Liu et al., 2021). In general, the uncertainty in the velocity was between −0.3 and 0.3 km/s, the uncertainty in the depth of the Moho was <1 km, and our models were able to effectively recover checkerboard patterns larger than (30 km × 10 km) throughout the crust.
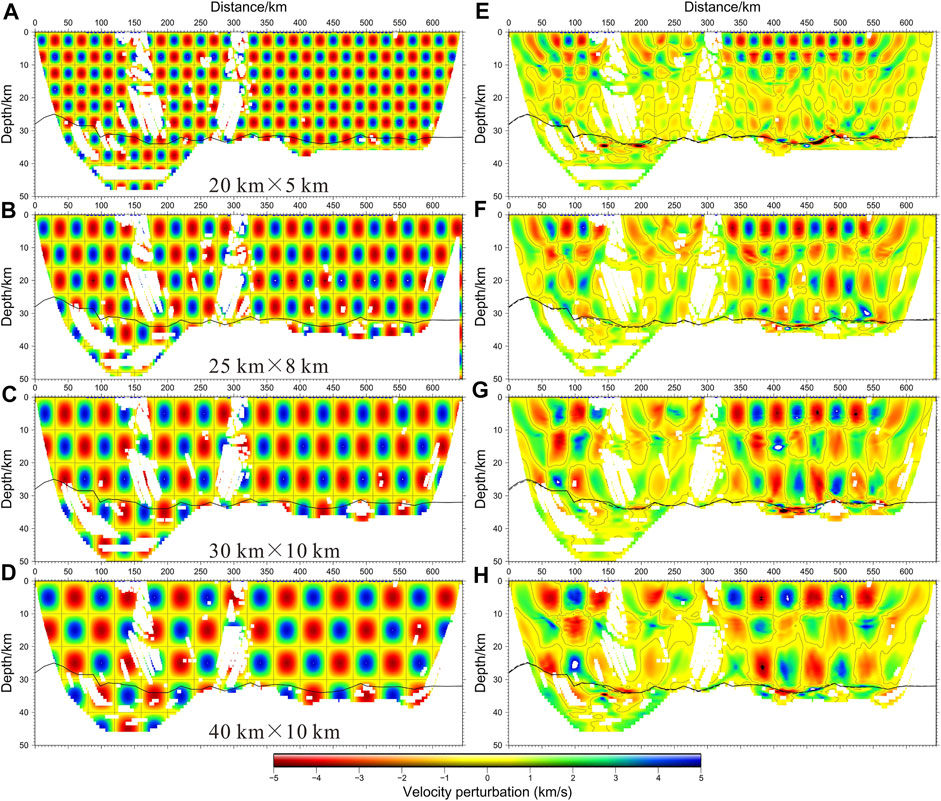
FIGURE 8. Checkerboard tests for the tomography model of Line 2013. The input checkerboard patterns (left) and the corresponding output results (right) have the checkerboard sizes of 20 × 5 km (A,E), 25 × 8 km (B,F), 30 × 10 km (C,G), and 40 × 10 km (D,H), respectively. Regions without ray coverage are shown in white.
Results
We obtained high-resolution crustal models (Figure 9) in the eastern NCC, eastern YZC, and across the collision belt between the two cratons in the offshore domains using forward modeling and seismic travel-time tomography. The final 2D Vp models of the four lines were divided into five layers by four interfaces: the sedimentary basement G, constained by reflections P1; the bottom of upper crust C2, constained by reflections P2; the bottom of mid-crust C3, constained by reflections PcP; and the Moho, constrained by reflections PmP. The seafloor was constrained by the echosounder and each of the models contained a water layer with a constant velocity of 1.5 km/s, although this was too shallow to distinguish in the Vp models. The resolution and uncertainty analyses showed that the top of the upper mantle was poorly resolved because there were few ray paths across this layer. We therefore do not discuss the water layer and the top upper mantle here.
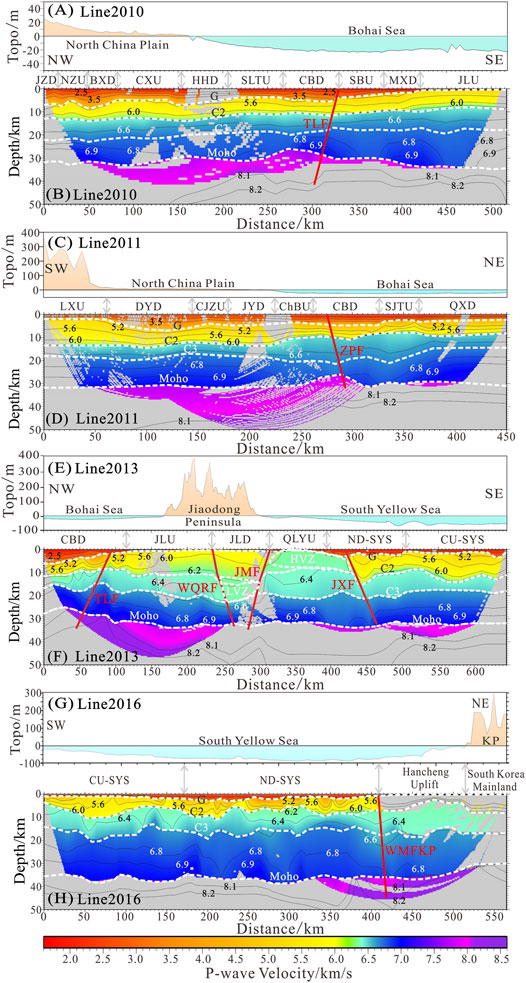
FIGURE 9. Topography and Vp model of Line 2010 (A,B), Line 2011 (C,D), Line 2013 (E,F), and Line 2016 (G,H), respectively. Model regions without ray coverage are shown in gray. The main tectonic units, with boundaries shown in gray arrows, are annotated between the maps of topography and Vp model. The abbreviations of the names of tectonic units are listed next. JZD, Jizhong Depression; NZU, Niutuozhen Uplift; BXD, Baxian Depression; CXU, Cangxian Uplift; HHD, Huanghua Depression; SLTU, Shaleitian Uplift; CBD, Central Bohai Depression; SBU, Southern Bohai Uplift; MXD, Miaoxi Depression; JLU, Jiaoliao Uplift; LXU, Luxi Uplift; DYD, Dongying Depression; CJZU, Chenjiazhuang Uplift; JYD, Jiyang Depression; ChBU, Chenbei Uplift; SJTU, Shijiutuo Uplift; QXD, Qinxi Depression; JLD, Jiaolai Depression; QLYU, Qianliyan Uplift; ND-SYS, Northern Depression of SYS; CU-SYS, Central Uplift of SYS. The white dashed lines indicate the main interfaces (G, C2, C3, and Moho) in the Vp model, with velocity contours in black solid lines. The red lines are locations of the main great faults, which can be found in and have the same abbreviations as Figure 3.
The sedimentary layer lies between the seafloor and the sedimentary basement G (Figure 9). The velocity of the sedimentary layer increases rapidly with depth from 1.8 km/s at the top to 4.5 km/s at the base. The fluctuations in the G interface correspond well with the Cenozoic structural uplifts and depressions. The thickness of the sedimentary layer gradually decreases from the North China Plain and Bohai Sea (about 6 km) to the Jiaodong Peninsula (<1 km) and then increases to the SYS (about 3 km).
The layer between the G and C2 interfaces is the upper crust. The thickness of the upper crust is generally thicker in the SYS (average about 10 km) than in the Bohai Sea (average about 5 km). The upper crustal velocity ranges from 5.0 to 6.2 km/s in the offshore domain of both the Bohai Sea and the SYS. A roughly 120-km wide southward-dipping high-velocity zone (HVZ), controlled by the Muping-Jimo and Jiashan-Xiangshui faults, lies in the upper crust near the Qianliyan Uplift. The velocity range (6.2–6.4 km/s) of the HVZ is the closest to that of the mid-crust in the SYS (6.2–6.5 km/s), suggesting that they have a similar composition.
The layer sandwiched between interfaces C2 and C3 is the mid-crust, which shows large differences in thickness in the Bohai Sea, the Jiaodong Peninsula, and the SYS (Figure 9). The depth of the C3 interface increases from about 15 km in the Bohai Sea to about 21 km in the onshore domain of both the North China Plain and Jiaodong Peninsula, but does not change significantly in the SYS (about 18 km). A roughly 50-km wide southward-dipping low velocity zone (LVZ) is seen in the mid-crust between the Lianyan and Muping-Jimo faults (Figure 9F). The velocity range (6.2–6.4 km/s) of the LVZ is close to that of the lower part of the upper crust (6.2–6.3 km/s) that lies above it, suggesting that the collision of the blocks may have caused the upper crust to fold downward to the position of the mid-crust (Liu et al., 2021).
The lower crust lies between the C3 interface and the Moho. The lateral velocity of the lower crust changes very little from the Bohai Sea to the SYS, with only the velocity contours bending downward near the great faults (Figure 9). The velocity is about 6.6 km/s at the top of the lower crust and about 7.0 km/s at the base. The depth of the Moho in the offshore domains of the Bohai Sea and the onshore domains of the North China Plain and Jiaodong Peninsula is about 31 km and there is an uplift in the Central Bohai Depression near the Tanlu and Zhangjiakou-Penglai faults (Figures 8D,F, 9B), with the shallowest part at a depth of about 25 km. The depth of the Moho in the offshore domain of the SYS (about 33 km) is deeper than that in the North China Plain and Bohai Sea.
Discussion
Lithospheric Thinning of the NCC
The NCC can be divided into three parts based on the thickness of the lithosphere: the stable western NCC (>200 km); the transitional middle NCC (200–80 km); and the severely thinned eastern NCC (<80 km). The thickest lithosphere (215 km) is found under the Ordos Massif in the western NCC and the thinnest (<65 km) under the Bohai Sea in the eastern NCC (Chen et al., 2009; Zhu et al., 2012), indicating that the Bohai Sea is the core area of lithospheric thinning in the NCC.
Gao et al. (1998), Gao et al., (2004) summarized the crustal thickness, the velocity structure in the crust, and the chemical composition of the different tectonic units by combining deep seismic sounding and geochemical data from different continental regions in China. Their results showed that the average crustal thickness of the NCC is 35.59 km, which is similar to the average crustal thickness (37.10 km) of the global continent. Wang et al. (2014) obtained an average thickness of the crust under the Ordos Massif of 41.3 km via a comprehensive analysis of H-k stacking and the teleseismic receiver function seismic sounding results. Our results from Line 2010, Line 2011, and Line 2013 all showed that the thinnest crust (25 km) in the eastern NCC lies in the Central Bohai Depression.
We took the lithospheric (215 km) and crustal (41.3 km) thickness of the Ordos Massif as the standard thicknesses in the NCC. The thickness of the lithosphere in the eastern NCC (about 65 km) has therefore been reduced by 150 km and is 69.8% thinner than the standard lithosphere in the NCC. However, the crustal thickness in the eastern NCC (25 km in the thinnest region) has been reduced by 16.3 km from the standard crustal thickness of the NCC (41.3 km), accounting for 10.9% of the total thinning of the lithosphere. By contrast, if calculated at the average Moho depth of 31 km in the Bohai Sea (where it is 24.9% thinner than the standard crust), the crustal thinning only accounts for 6.8% of the lithospheric thinning—that is, the remaining 93.2% of lithospheric thinning took place in the lithospheric mantle. This shows that thinning of the NCC was caused by the removal of the lower lithospheric mantle, with only a minor contribution from the thinning of the crust (Gao et al., 2008). This suggests that extensional thinning of the lithosphere may not be the main mechanism for lithospheric thinning in the eastern NCC because extension would cause the same degree of thinning in both the lithospheric mantle and crust.
By contrast, the results from Line 2010, Line 2011 and Line 2013 all show that the Moho is uplifted near the Tanlu and Zhangjiakou-Penglai fault beneath the Central Bohai Depression. The velocity of the lower crust and upper mantle is anomalous near these fault zones, indicating that the crust of the eastern NCC has been subjected to intrusion and reconstruction and that the deep faults are channels for the upwelling of deep material. This upwelling is related to the intrusion of basalts along the fault zone caused by the subduction of the Pacific plate during the Jurassic and Cretaceous, indicating that lithospheric thinning in the eastern NCC is related to the remote effects of the subduction of the Pacific plate (Liu et al., 2015).
Collision Between the NCC and YZC and Mechanism of Craton Lithospheric Thinning
Based on the regional gravity (Figure 3A), and magnetic (Figure 3B) and crustal velocity structures (Figure 9) in the different tectonic units, we can determine the boundary between the NCC and YZC and delineate the spatial distribution of the SLOB (Liu et al., 2021). Our results imaged a roughly 120-km wide, southward-dipping HVZ in the upper crust of the southern SLOB and a roughly 50-km wide, northward-dipping LVZ in the mid-crust of the northern SLOB. Based on the location and velocity range of the HVZ, we linked the HVZ with the mid-crust of the YZC, which was decoupled from the lower crust during the collision between the NCC and YZC. The LVZ in the mid-crust of the SLOB has the same velocity range as the upper crust above, indicating that the crust of the NCC has been wedged into the detached crust of the YZC. The mid-crust of the YZC was uplifted by this wedging of the NCC and, after later denudation, remained in the position of the upper crust in the southern SLOB, forming the HVZ. By contrast, the wedged crust of the NCC in the collision belt bent downward to the position of the lower crust as a result of extrusion stress, forming the LVZ in the lower crust of the northern SLOB (Liu et al., 2021).
Based on our crustal models in the offshore domain of eastern China and other geological, geophysical, and geochemical evidences (Li, 1994; Zhai et al., 2007; Chang and Zhao, 2012), and with reference to the proposed mechanisms for the exhumation of the UHPM, we propose that the collision between the YZC and the NCC and lithosphere thinning of the cratons in eastern China took place in five main stages (Figure 10).
(1) The subduction stage (>200 Ma) during Indosinian movement. During the Triassic, the NCC collided with the YZC and the YZC was subducted below the NCC as a result of the subduction of the oceanic plate between them (Figure 10A). The lithosphere of the orogenic belt began to accrete and the subducted YZC crust underwent UHPM/HPM with burial. UHPM was triggered at depths >80 km and HPM at shallower depths.
(2) The lithospheric detachment stage (200–140 Ma) during Yanshanian movement. SE China was strongly compressed during the Indosinian movement, and this compression spread to northern China, including the Yellow Sea area, and formed deep faults (Lianyan Fault, Wulian-Qingdao-Rongcheng Fault, Muping-Jimo Fault) around the orogenic belt. This resulted in decoupling of the mid-crust of the YZC along the decoupling fault (Figure 10B). Dehydration of the subducted oceanic plate and the western Pacific plate during the Yanshanian movement weakened the lithosphere in eastern China (Figure 10B). The weakened lithosphere around the SLOB broke off along the deep fault zones formed by the collision between the NCC and YZC and the subduction of the western Pacific plate. The weakened and broken lithosphere of the northern orogenic belt delaminated from the crust as a result of negative buoyancy and the decoupled mid-crust of the YZC was exhumed to the upper crust by positive buoyancy. The lithosphere of the eastern NCC was strongly thinned during this stage.
(3) The UHPM/HPM exhumation stage (140–110 Ma). The mantle flow in the collision belt domains was intensified under the combined action of the detachment and subsidence of the lithosphere and the subduction of the western Pacific plate. This, in turn, promoted large-scale lithospheric delamination and regenerated the accreted lithosphere beneath the crust (Figure 10C). The accreted lithosphere and mantle flow assisted the detachment of the lithosphere of the southern SLOB and YZC. The mid-crust of the YZC that had undergone UHPM/HPM was exhumed to the surface by delamination of the YZC lithosphere, resulting in a southward-dipping HVZ in the upper crust of the collision belt (Figure 10C). Because the accreted lithosphere is much thinner than the delaminated paleo-lithosphere, the lithospheric thickness of the NCC and YZC were both strongly thinned during this stage.
(4) The extension and rifting stage (110–40 Ma) between late Yanshanian movement and early Himalayan movement. During this stage, back-arc extension caused by the activity of the western Pacific tectonic domain began to gradually intensify and preceded the development of rifting in the SYS area. From the Late Cretaceous to early Cenozoic, the tectonic stress in the SYS and adjacent areas turned to NNW-oriented extension and the continental faulted depressions began to overlap with the Mesozoic and Paleozoic residual marine basins (Pang et al., 2017). Under both tensile stress and gravity, the upper wall of the early thrust fault began to slide back along the fault plane and gradually changed from a reverse fault to a normal fault. The decoupling fault developed again under tensile stress as a result of the relatively fragile surrounding environment and formed a lithospheric fault (Jiashan-Xiangshui fault). As a result of tectonic subsidence, the exhumed UHPM/HPM was partly retained at the surface after long-term denudation (Figure 10D). The lithosphere and crust also thinned as a result of extension, but the lithospheric thinning was much less than that caused by previous lithospheric delamination.
(5) The uplifting and denudation stage (<40 Ma) of the late Himalayan. The regional sedimentary discontinuities, the widespread absence of parallel unconformities in the Oligocene-Lower Miocene and the parallel unconformities on the seismic profiles represent the overall uplift of the NCC and the YZC as a result of the westward subduction of the western Pacific plate and the collision between the Indian and Eurasian plates (Ji et al., 2018). The NCC and the YZC began to undergo strong denudation, resulting in significant thinning of the sedimentary layer in the SLOB region (Figure 10E).
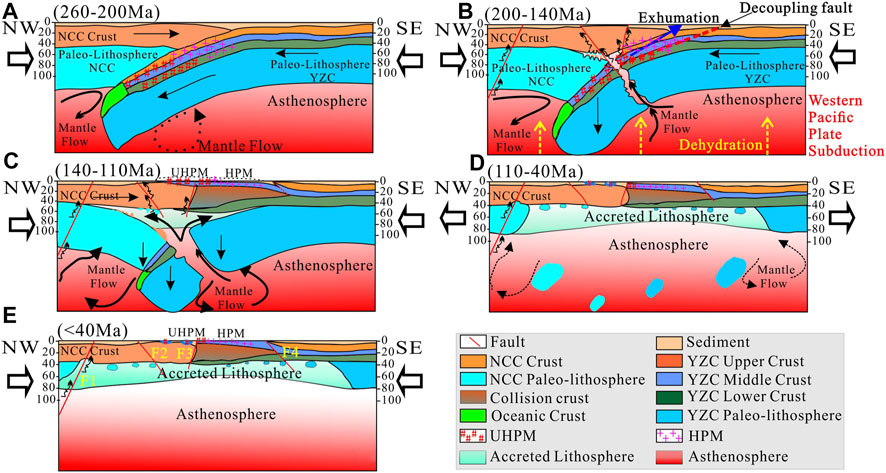
FIGURE 10. The sketch map of the collision process between the YZC and the NCC. (A) 260–200 Ma, (B) 200–140 Ma, (C) 140–110 Ma, (D) 110–40 Ma, (E) < 40 Ma, respectively. The arrows outside orient the direction of the principal stress field, the arrows inside are directions of mantle flow and upwelling of the deep materials, red lines are the great faults with names in yellow texts, including F1: Tanlu Fault, F2: Lianyan fault; F3: Muping-Jimo fault; and F4, Jiashan-Xiangshui fault. In Figure 10B, the blue arrow indicates the exhumation of deep material, and the yellow dashed arrows indicate the dehydration of the subducted Pacific plate.
Conclusion
We addressed the boundaries between the NCC, SLOB, and YZC based on the general crustal structures in our high-resolution Vp models along wide-angle seismic profiles and the regional gravity and magnetic anomalies. After calculating the degree of thinning of the crust and lithosphere in the eastern NCC, we found that there was extensive lithospheric thinning in the eastern NCC, with an overall lithospheric thinning of 69.8%. However, crustal thinning only accounted for 6.8–10.9% of the lithospheric thinning. The remaining 89.1–93.2% of lithospheric thinning occurred in the lithospheric mantle, indicating that the eastern NCC has a relatively thinned crust and a clearly thinned lithospheric upper mantle. Extension therefore only had a limited role on lithospheric thinning of the eastern NCC.
Based on our results and early research on the UHPM belt between the NCC and YZC, we suggest that the exhumation of the UHPM rocks in the SLOB is a result of the combined effect of various factors, including lithospheric delamination, buoyancy, lower crust detachment, extension, mantle flow, and the subduction of the western Pacific plate. These factors played different parts during the different stages of exhumation.
Our results show that the Moho interface was uplifted near the fault zones, including the Tanlu and Zhangjiakou-Penglai fault, which may be channels for the upwelling of deep materials. The upwelled deep materials may be related to the intrusion of basalts along the fault zone caused by the subduction of the Pacific plate during the Jurassic and Cretaceous. By contrast, the lithosphere of the eastern NCC was strongly thinned during the lithospheric delamination stage after the collision between the NCC and YZC, suggesting that lithospheric thinning in the eastern NCC was the result of the collision of the NCC with the YZC and subduction of the Pacific plate.
Data Availability Statement
The raw data supporting the conclusion of this article will be made available by the authors, without undue reservation.
Author Contributions
LL: Data acquisition, data processing, methodology, interpretation, and editing. TH: Leading of the surveys and investigations, gravity and magnetic data analyses, interpretation, and review. CL, ZW, KK, HK, and YX: Data acquisition, interpretation, and review.
Funding
This work was supported by the National Natural Science Foundation of China (Grant Numbers 42006070, 91858212, 42076068, and 41210005). KK was supported by The KMA Research Development Program under Grant KMI 2018-02810.
Conflict of Interest
The authors declare that the research was conducted in the absence of any commercial or financial relationships that could be construed as a potential conflict of interest.
Publisher’s Note
All claims expressed in this article are solely those of the authors and do not necessarily represent those of their affiliated organizations, or those of the publisher, the editors, and the reviewers. Any product that may be evaluated in this article, or claim that may be made by its manufacturer, is not guaranteed or endorsed by the publisher.
Acknowledgments
The wide-angle seismic data of Line 2010, Line 2011, and Line 2013 used here was acquired by Institute of Geology and Geophysics (CAS) (http://www.igg.cas.cn/), Qingdao Institute of Marine Geology (http://www.qimg.cgs.gov.cn/), First Institute of Oceanography, SOA (http://www.fio.org.cn/), and Geophysical Prospecting Center, CEA (http://www.gec.ac.cn/). Line 2016 was acquired by Institute of Geology and Geophysics (CAS), Qingdao Institute of Marine Geology, Pusan National University (https://www.pusan.ac.kr/eng/Main.do), and Korea Institute of Ocean Science and Technology (https://www.kiost.ac.kr/eng.do). The SEG-Y format data would be available upon request to these institutions and corresponding authors of this paper. The authors expressed special thanks to all the scientists and crews involved in the field work. The open source softwares Seismic Unix, SAC, Rayinvr, and GMT were used to process the data and produce the figures in the preparation of this paper. We would like to thank Associate Editor Alexander Cruden for processing our manuscript, and thank two reviewers for their constructive comments and suggestions.
References
An, M., and Shi, Y. (2006). Lithospheric Thickness of the Chinese Continent. Phys. Earth Planet. Interiors 159 (3-4), 257–266. doi:10.1016/j.pepi.2006.08.002
Bai, Z., Zhang, Z., and Wang, Y. (2007). Crustal Structure across the Dabie-Sulu Orogenic belt Revealed by Seismic Velocity Profiles. J. Geophys. Eng. 4, 436–442. doi:10.1088/1742-2132/4/4/009
Bao, X., Song, X., and Li, J. (2015). High-resolution Lithospheric Structure beneath Mainland China from Ambient Noise and Earthquake Surface-Wave Tomography. Earth Planet. Sci. Lett. 417, 132–141. doi:10.1016/j.epsl.2015.02.024
Chang, K.-H., and Zhao, X. (2012). North and South China Suturing in the East End: What Happened in Korean Peninsula? Gondwana Res. 22, 493–506. doi:10.1016/j.gr.2011.12.010
Chemenda, A. I., Mattauer, M., and Bokun, A. N. (1996). Continental Subduction and a Mechanism for Exhumation of High-Pressure Metamorphic Rocks: New Modelling and Field Data from Oman. Earth Planet. Sci. Lett. 143, 173–182. doi:10.1016/0012-821x(96)00123-9
Chemenda, A. I., Mattauer, M., Malavieille, J., and Bokun, A. N. (1995). A Mechanism for Syn-Collisional Rock Exhumation and Associated normal Faulting: Results from Physical Modelling. Earth Planet. Sci. Lett. 132, 225–232. doi:10.1016/0012-821x(95)00042-b
Chen, L., Cheng, C., and Wei, Z. (2009). Seismic Evidence for Significant Lateral Variations in Lithospheric Thickness beneath the central and Western North China Craton. Earth Planet. Sci. Lett. 286, 171–183. doi:10.1016/j.epsl.2009.06.022
Cho, H.-M., Baag, C.-E., Lee, J. M., Moon, W. M., Jung, H., Kim, K. Y., et al. (2006). Crustal Velocity Structure across the Southern Korean Peninsula from Seismic Refraction Survey. Geophys. Res. Lett. 33 (6), L06307. doi:10.1029/2005GL025145
Cho, H.-M., Baag, C.-E., Lee, J. M., Moon, W. M., Jung, H., and Kim, K. Y. (2013). P- and S-Wave Velocity Model along Crustal Scale Refraction and Wide-Angle Reflection Profile in the Southern Korean peninsula. Tectonophysics 582, 84–100. doi:10.1016/j.tecto.2012.09.025
Choi, S., Ryu, I.-C., and Götze, H. J. (2015). Depth Distribution of the Sedimentary basin and Moho Undulation in the Yellow Sea, NE Asia Interpreted by Using Satellite-Derived Gravity Field. Geophys. J. Int. 202, 41–53. doi:10.1093/gji/ggv108
Chopin, C. (2003). Ultrahigh-pressure Metamorphism: Tracing continental Crust into the Mantle. Earth Planet. Sci. Lett. 212, 1–14. doi:10.1016/S0012-821X(03)00261-9
Deng, J., and Wu, Z. (2001). Lithospheric Thinning Event in the Lower Yangtze Craton and Cu-Fe Metallogenic belt in the Middle and Lower Yangtze River Reaches. Gelogy of Anhui 11 (2), 86–91.
Gao, S., Rudnick, R. L., Xu, W.-L., Yuan, H.-L., Liu, Y.-S., Walker, R. J., et al. (2008). Recycling Deep Cratonic Lithosphere and Generation of Intraplate Magmatism in the North China Craton. Earth Planet. Sci. Lett. 270, 41–53. doi:10.1016/j.epsl.2008.03.008
Gao, S., Rudnick, R. L., Yuan, H.-L., Liu, X.-M., Liu, Y.-S., Xu, W.-L., et al. (2004). Recycling Lower continental Crust in the North China Craton. Nature 432, 892–897. doi:10.1038/nature03162
Gao, S., Zhang, B.-R., Jin, Z.-M., Kern, H., Ting-Chuan Luo, T., and Zhao, Z.-D. (1998). How Mafic Is the Lower continental Crust? Earth Planet. Sci. Lett. 161, 101–117. doi:10.1016/s0012-821x(98)00140-x
Gerya, T. V., and Stöckhert, B. (2002). Exhumation Rates of High Pressure Metamorphic Rocks in Subduction Channels: the Effect of Rheology. Geophys. Res. Lett. 29 (8), 102–114. doi:10.1029/2001gl014307
Hao, T., Hu, W., Xing, J., Hu, L., Xu, Y., Qin, J., et al. (2014). The Moho Depth Map (1:5000000) in the Land and Seas of China and Adjacent Areas and its Geological Implications. Chin. J. Geophys. 57 (12), 3869–3883. doi:10.6038/cjg20141202
Hao, T., Huang, S., Xu, Y., Li, Z., Zhang, L., Wang, J., et al. (2010). Geophysical Understanding on Deep Structure in Yellow Sea. Chin. J. Geophys. 53 (6), 1315–1326.
Harley, S. L., and Carswell, D. A. (1995). Ultradeep Crustal Metamorphism: A Prospective View. J. Geophys. Res. 100, 8367–8380. doi:10.1029/94jb02421
Ji, W., Chen, Y., Chen, K., Wei, W., Faure, M., and Lin, W. (2018). Multiple Emplacement and Exhumation History of the Late Mesozoic Dayunshan-Mufushan Batholith in Southeast China and its Tectonic Significance: 2. Magnetic Fabrics and Gravity Survey. J. Geophys. Res. Solid Earth 123, 711–731. doi:10.1002/2017jb014598
Jiang, G., Zhang, G., Lü, Q., Shi, D., and Xu, Y. (2013). 3-D Velocity Model beneath the Middle-Lower Yangtze River and its Implication to the Deep Geodynamics. Tectonophysics 606, 36–47. doi:10.1016/j.tecto.2013.03.026
Kern, H., Gao, S., Jin, Z., Popp, T., and Jin, S. (1999). Petrophysical Studies on Rocks from the Dabie Ultrahigh-Pressure (UHP) Metamorphic belt, Central China: Implications for the Composition and Delamination of the Lower Crust. Tectonophysics 301, 191–215. doi:10.1016/s0040-1951(98)00268-6
Kim, H.-J., Kim, C.-H., Hao, T., Liu, L., Kim, K.-H., Jun, H., et al. (2019). Crustal Structure of the Gunsan Basin in the SE Yellow Sea from Ocean Bottom Seismometer (OBS) Data and its Linkage to the South China Block. J. Asian Earth Sci. 180, 103881. doi:10.1016/j.jseaes.2019.103881
Korenaga, J., Holbrook, W. S., Kent, G. M., Kelemen, P. B., Detrick, R. S., Larsen, H.-C., et al. (2000). Crustal Structure of the Southeast Greenland Margin from Joint Refraction and Reflection Seismic Tomography. J. Geophys. Res. 105, 21,21591–21614,614. doi:10.1029/2000JB900188
Li, H.-Y., Chen, R.-X., Zheng, Y.-F., Hu, Z., and Xu, L. (2018). Crustal Metasomatism at the Slab-Mantle Interface in a continental Subduction Channel: Geochemical Evidence from Orogenic Peridotite in the Sulu Orogen. J. Geophys. Res. Solid Earth 123, 2174–2198. doi:10.1002/2017jb014015
Li, S., Li, Q., Hou, Z., Yang, W., and Wang, Y. (2005). Cooling History and Exhumation Mechanism of the Ultrahigh-Pressure Metamorphic Rocks in the Dabie Mountains, central China. Acta Petrologica Sinica 21 (4), 1117–1124.
Li, S., Zhao, G., Dai, L., Zhou, L., Liu, X., Suo, Y., et al. (2012). Cenozoic Faulting of the Bohai Bay Basin and its Bearing on the Destruction of the Eastern North China Craton. J. Asian Earth Sci. 47, 80–93. doi:10.1016/j.jseaes.2011.06.011
Li, Z.-X. (1994). Collision between the North and South China Blocks: A Crustal-Detachment Model for Suturing in the Region East of the Tanlu Fault. Geol 22, 739–742. doi:10.1130/0091-7613(1994)022<0739:cbtnas>2.3.co;2
Li, Z., Peng, S. T., Xu, C. W., Han, Y. X., and Zhai, M. G. (2009). U-pb Ages of the Paleozoic sandstone Detrital Zircons and Their Tectonic Implications in the Tabeaksan basin, Korea. Acta Petrologica Sinica 25 (1), 183–192. (in chinese).
Liu, L., Hao, T., Lu, C., Wu, Z., Zheng, Y., Wang, F., et al. (2021). Crustal Deformation and Detachment in the Sulu Orogenic Belt: New Constraints from Onshore‐Offshore Wide‐Angle Seismic Data. Geophys. Res. Lett. 48, e2021GL095248. doi:10.1029/2021GL095248
Liu, L., Hao, T., Lü, C., You, Q., Pan, J., Wang, F., et al. (2015). Crustal Structure of Bohai Sea and Adjacent Area (North China) from Two Onshore-Offshore Wide-Angle Seismic Survey Lines. J. Asian Earth Sci. 98, 457–469. doi:10.1016/j.jseaes.2014.11.034
Lü, Q., Shi, D., Liu, Z., Zhang, Y., Dong, S., and Zhao, J. (2015). Crustal Structure and Geodynamics of the Middle and Lower Reaches of Yangtze Metallogenic belt and Neighboring Areas: Insights from Deep Seismic Reflection Profiling. J. Asian Earth Sci. 114, 704–716.
Ouyang, L., Li, H., Lü, Q., Yang, Y., Li, X., Jiang, G., et al. (2014). Crustal and Uppermost Mantle Velocity Structure and its Relationship with the Formation of Ore Districts in the Middle-Lower Yangtze River Region. Earth Planet. Sci. Lett. 408, 378–389. doi:10.1016/j.epsl.2014.10.017
Pang, Y., Zhang, X., Guo, X., Xiao, G., and Zhu, X. (2017). Mesozoic and Cenozoic Tectono-thermal Evolution Modeling in the Northern South Yellow Sea Basin. Chin. J. Geophys. 60 (8), 3177–3190.
Platt, J. P. (1993). Exhumation of High-Pressure Rocks: a Review of Concepts and Processes. Terra Nova 5, 119–133. doi:10.1111/j.1365-3121.1993.tb00237.x
Shi, D., Lü, Q., Xu, W., Yan, J., Zhao, J., Dong, S., et al. (2013). Crustal Structure beneath the Middle-Lower Yangtze Metallogenic belt in East China: Constraints from Passive Source Seismic experiment on the Mesozoic Intra-continental Mineralization. Tectonophysics 606, 48–59. doi:10.1016/j.tecto.2013.01.012
Shinn, Y. J., Chough, S. K., and Hwang, I. G. (2010). Structural Development and Tectonic Evolution of Gunsan Basin (Cretaceous-Tertiary) in the central Yellow Sea. Mar. Pet. Geology. 27, 500–514. doi:10.1016/j.marpetgeo.2009.11.001
Stockwell, J. W. (1999). The CWP/SU: Seismic Un∗x Package,. Comput. Geosciences 25 (4), 415–419. doi:10.1016/s0098-3004(98)00145-9
Sun, P., Guo, P., and Niu, Y. (2021). Eastern China continental Lithosphere Thinning Is a Consequence of Paleo-Pacific Plate Subduction: A Review and New Perspectives. Earth-Science Rev. 218, 103680. doi:10.1016/j.earscirev.2021.103680
Wan, T., and Hao, T. (2009). Cenozoic Tectonoics of the Yellow Sea and its Oil-Gas Exploration. Geoscience 23 (3), 385–393. (in Chinese).
Wan, T. (2012). The Tectonics of China: Data, Maps and Evolution. Berlin, Heidelberg: Springer-Verlag. 978-3-642-11866-1,978-3-642-11868-5.
Wang, C.-Y., Sandvol, E., Zhu, L., Lou, H., Yao, Z., and Luo, X. (2014). Lateral Variation of Crustal Structure in the Ordos Block and Surrounding Regions, North China, and its Tectonic Implications. Earth Planet. Sci. Lett. 387, 198–211. doi:10.1016/j.epsl.2013.11.033
Wang, J., Jiang, L., Niu, B. G., Ren, J. S., He, Z. J., Jin, X. C., et al. (2017). Spatial Database of 1:5 Million International Geological Map of Asia. Geoscientific Dara. doi:10.23650/data.H.2017.NGA128804.T1.1.1
Wang, X., Liou, J. G., and Mao, H. K. (1989). Coesite-bearing Eclogite from the Dabie Mountains in central China. Geol 17, 1085–1088. doi:10.1130/0091-7613(1989)017<1085:cbeftd>2.3.co;2
Wei, W., Ye, G., Jin, S., Deng, M., and Jing, J. (2007). Three Dimensional P-Wave Velocity Structure of the Crust of North China. Earth Sci.-J. China Univ. Geosci. 32 (4), 441–452.
Wu, F., Xu, Y., Gao, S., and Zheng, J. (2008). Lithospheric Thinning and Destruction of the North China Craton. Acta Petrologica Sinica 6, 1145–1174.
Xiao, X., Wang, X., Tang, J., Zhou, C., Wang, Y., Chen, X., et al. (2014). Conductivity Structure of the Lujiang-Zongyang Ore Concentrated Area, Anhui Province: Constraints from Magnetotelluric Data. Acta Geol. Sinica 88 (4), 478–495. doi:10.1111/1755-6724.12379_57
Xu, S., Su, W., Liu, Y., Jiang, L., Ji, S., Okay, A. I., et al. (1992). Diamond from the Dabie Shan Metamorphic Rocks and its Implication for Tectonic Setting. Science 256, 80–82.
Xu, T., Zhang, Z., Tian, X., Liu, B., Bai, Z., Lv, Q., et al. (2014). Crustal Structure beneath the Middle-Lower Yangtze Metallogenic belt and its Surrounding Areas: Constraints from Active Source Seismic experiment along the Lixin to Yixing Profile in East China. Acta Petrologica Sinica 30 (4), 918–930.
Xu, W., Gao, S., Wang, Q., Wang, D., and Liu, Y. (2006). Mesozoic Crustal Thickening of the Eastern North China Craton: Evidence from Eclogite Xenoliths and Petrologic Implications. Geol 34 (9), 721–724. doi:10.1130/g22551.1
Xu, Z., Liang, F., Yang, J., Zhang, Z., and Tang, Z. (2009). Continental Deep Subduction and Exhumation Dynamics: Constraints from Holes of the Chinese Continental Scientific Drilling and the Sulu HP-UHP Metamorphic Terrane. Acta Petrol. Sin. 25, 1561–1574.
Zelt, C. A., and Barton, P. J. (1998). Three-dimensional Seismic Refraction Tomography: A Comparison of Two Methods Applied to Data from the Faeroe Basin. J. Geophys. Res. 103, 7187–7210. doi:10.1029/97jb03536
Zelt, C. A., and Smith, R. B. (1992). Seismic Traveltime Inversion for 2-D Crustal Velocity Structure. Geophys. J. Int. 108 (1), 16–34. doi:10.1111/j.1365-246x.1992.tb00836.x
Zhai, M., Guo, J., Li, Z., Chen, D., Peng, P., Li, F., et al. (2007). Linking the Sulu UHP belt to the Korean Peninsula: Evidence from Eclogite, Precambrian Basement, and Paleozoic Sedimentary Basins. Gondwana Res. 12, 388–403. doi:10.1016/j.gr.2007.02.003
Zhang, R. Y., Liou, J. G., and Ernst, W. G. (2009). The Dabie-Sulu continental Collision Zone: A Comprehensive Review. Gondwana Res. 16, 1–26. doi:10.1016/j.gr.2009.03.008
Zheng, T.-Y., Zhao, L., He, Y.-M., and Zhu, R.-X. (2014). Seismic Imaging of Crustal Reworking and Lithospheric Modification in Eastern China. Geophys. J. Int. 196 (2), 656–670. doi:10.1093/gji/ggt420
Zheng, Y.-F., Fu, B., Gong, B., and Li, L. (2003). Stable Isotope Geochemistry of Ultrahigh Pressure Metamorphic Rocks from the Dabie-Sulu Orogen in China: Implications for Geodynamics and Fluid Regime. Earth-Science Rev. 62, 105–161. doi:10.1016/S0012-8252(02)00133-2
Zheng, Y. (2008). A Perspective View on Ultrahigh-Pressure Metamorphism and continental Collision in the Dabie-Sulu Orogenic belt. Sci. Bull. 53 (20), 3081–3104. doi:10.1007/s11434-008-0388-0
Zhu, R., Chen, L., Wu, F., and Liu, J. (2011). Timing, Scale and Mechanism of the Destruction of the North China Craton. Sci. China Earth Sci. 54, 789–797. doi:10.1007/s11430-011-4203-4
Keywords: North China Craton, Yangtze Craton, sulu orogenic belt, crustal structure, lithospheric thinning, wide-angle seismic survey
Citation: Liu L, Hao T, Lü C, Wu Z, Kim K, Kim H and Xu Y (2022) Integrated Geophysical Study of the Collision Between the North China Craton and the Yangtze Craton and Its Links With Craton Lithospheric Thinning. Front. Earth Sci. 9:796783. doi: 10.3389/feart.2021.796783
Received: 28 October 2021; Accepted: 17 December 2021;
Published: 31 January 2022.
Edited by:
Alexander Cruden, Monash University, AustraliaReviewed by:
Xiongwei Niu, Ministry of Natural Resources, ChinaJiazheng Zhang, South China Sea Institute of Oceanology (CAS), China
Copyright © 2022 Liu, Hao, Lü, Wu, Kim, Kim and Xu. This is an open-access article distributed under the terms of the Creative Commons Attribution License (CC BY). The use, distribution or reproduction in other forums is permitted, provided the original author(s) and the copyright owner(s) are credited and that the original publication in this journal is cited, in accordance with accepted academic practice. No use, distribution or reproduction is permitted which does not comply with these terms.
*Correspondence: Lihua Liu, bGl1bGlodWFAbWFpbC5pZ2djYXMuYWMuY24=; Tianyao Hao, dHloYW9AbWFpbC5pZ2djYXMuYWMuY24=