
94% of researchers rate our articles as excellent or good
Learn more about the work of our research integrity team to safeguard the quality of each article we publish.
Find out more
ORIGINAL RESEARCH article
Front. Earth Sci., 08 December 2021
Sec. Quaternary Science, Geomorphology and Paleoenvironment
Volume 9 - 2021 | https://doi.org/10.3389/feart.2021.796610
This article is part of the Research TopicContinental Basin and Orogenic Processes: Tectonic Deformation and Associated Landscape and Environmental EvolutionView all 15 articles
Drainage basins are fundamental elements of the earth’s surface, and quantifying their geomorphic features is essential to understand the interaction between tectonics, climatic, and surface processes. In this study, 40 basins of the Greater Khingan Mountains were selected for hypsometric analysis using a 90-m Shuttle Radar Topography Mission digital elevation model. The hypsometric integral values range from 0.13 to 0.44, with an average value of 0.30, and most hypsometric curves exhibit remarkable downward concave shapes. This feature indicates that most drainage basins and the landscape of the Greater Khingan Mountains are approaching the old-age development stage, consistent with the present moderately stable tectonic activity. The spatial distribution of the χ values is characterized by unambiguously higher values on the western flank than those on the eastern flank in the middle and southern segments of the Greater Khingan Mountains. We interpret this as an indicator of the disequilibrium across the main divide. The interpolation of the erosion rates and channel steepness for the catchments on both sides of the Greater Khingan Mountains revealed westward divide migration, which is consistent with the lower χ values, a higher slope, and local relief observed along the eastern flanks. Considering the long-term tectonic evolution pattern between the Greater Khingan Mountains and Songliao Basin, the landscape decay and slow westward divide migration were mostly driven by the inherited Cenozoic tectonics and precipitation gradient across East Asia.
Rivers and drainage basins are the most basic components of geomorphic systems, and the tectonic, climatic and surface processes collaborate to shape their landscape. (Molnar and England, 1990; Willett et al., 2006; Liu-Zeng et al., 2018). Common factors influencing geomorphic features include bedrock type, tectonics, climate, and individual geomorphic events such as river capture (He et al., 2019; Johnson, 2020). Tectonic uplift can increase the terrain slope and provide more potential energy for river erosion. The precipitation change caused by climate change since the Cenozoic can also affect the river erosion efficiency. Furthermore, due to the different lithologies of bedrock, the erosion coefficient and slope index associated with the bedrock river erosion model will be different, affecting the landform of rivers and basins (Chen et al., 2014; Su et al., 2016). Therefore, distinct features will develop under the same tectonic and climatic conditions. Since the 1990s, with the development of space earth observation and new dating technology, analyzing the relationship among climate, topography, denudation, deposition, and rock deformation in active orogenic belts by quantitatively studying topographic and geomorphic evolution has gradually become one of the frontiers and hot fields in earth sciences (Lv et al., 2014; Liu-Zeng et al., 2018). Digital elevation model (DEM) data and geomorphic parameters were usually utilized to quantitatively reveal the morphology feature, such as extracting the stage of geomorphological evolution within the tectonic active area, especially in the peripheral region of Tibetan Plateau (Zhang et al., 2008, 2011; Hu et al., 2010; Yang et al., 2015; Yang J. et al., 2020; Yang R. et al., 2020; Su, et al., 2015, 2017, Li et al., 2019; Ma et al., 2019). But such studies are still lacking to understand the landscape evolution across different regions rather than the Tibetan Plateau. However, recent researches on geometric indexes (such as channel steepness index and χ plots) were reported on postorogenic landscapes, including the Appalachian Mountains, the Ozark dome of the North American Craton, and the Cape Mountains of South Africa. And these studies have explained how knickpoint migration and channel–hillslope coupling, strong rocks, and asymmetric drainage divides as an important factor in tectonically-inactive (i.e., post-orogenic) orogens for the maintenance of transient landscapes (Gallen et al., 2011; Miller et al., 2013; Beeson et al., 2017; Scharf et al., 2013), which is significant for us to extend our knowledge aside from the actively-uplifting Tibet. In Northeast Asia, the Greater Khingan Mountains are located in the Xing’an East Mongolia block (Figure 1). Previous studies indicate that the Greater Khingan Mountains are stable in tectonic activity and the Quaternary tectonic deformation has been relatively weak (Deng et al., 2002,2003; Zhang et al., 2002,2003). What are the features of geomorphic development in a region with a stable tectonic setting and what geomorphic parameters can be used to express geomorphic features of tectonically stable areas? What are the main factors affecting the developmental characteristics? The answers to these questions will be helpful to understand the process and trend of long-term geomorphic evolution in tectonically stable areas. Based on the river system of the Greater Khingan Mountains as the breakthrough point, 40 river basins were selected as research objects using the spatial resolution of a 90-m Shuttle Radar Topography Mission (SRTM)-3 DEM, we have gone through some quantitative calculations, such as slope, hypsometric integral values, χ plots, and a typical swath profile analysis to reveal the watershed geomorphic characteristics of the Greater Khingan Mountains, a relatively tectonically stable region in the mainland. Based on tectonic evolution, lithology, and precipitation, the main controlling factors of this geomorphic development are analyzed and discussed.
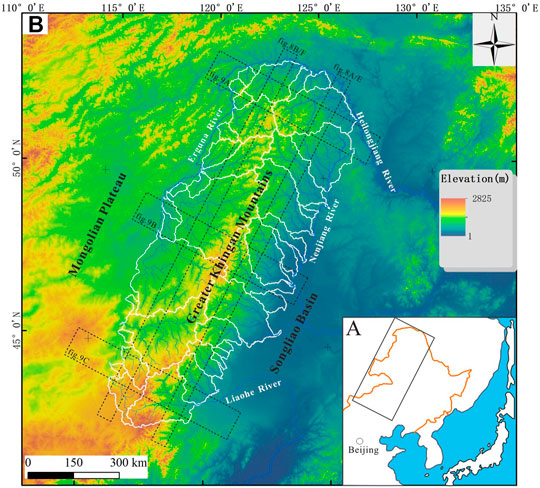
FIGURE 1. (A) Location of the study area in East Asia; (B) Hillshade of 90 m digital elevation model produced from the Shuttle Radar Topography Mission, blue lines show major rivers, white lines show major drainage divides.
The NNE–SSW-trending Great Khingan Mountains is located in the western Frontier of Northeast China. It is bounded by the North China Platform North Margin fault in the south, the Mongolian-Okhotsk fold system in the north, and the Nenjiang fault and the Songliao Basin in the east, which determines the small width and steep topography of the eastern flank of the Great Khingan Mountains. However, the western boundary of the Great Khingan Mountains is fuzzy, because the Great Khingan Mountains belongs to the eastern segment of the Tianshan-Xingmeng fold system extending from east to west tectonically, and there is no distinct tectonic boundary to the west. Therefore, the western flank of the Great Khingan Mountains is much wider and slower than the eastern flank topographically (Liu et al., 2004; Fang et al., 2008).
Tectonically, the mountains lie on the junction of the Siberian and North China Plates and are Meso–Cenozoic mountains developed on the Caledonian, Early Hercynian, and Late Hercynian fold belts (Liu et al., 2004; Fang et al., 2008; Qian et al., 2013; Xiang, 2014). In the Paleozoic, the Paleo–Asiatic tectonic domain controlled it, and after Mesozoic, the Pacific and Tethys tectonic domains mostly influenced it (Fang et al., 2008; Wu, 2013). Since the Mesozoic era, the magmatic activity in the area has been intense and Jurassic continental intermediate-acid volcanic rocks and Yanshanian intermediate-acid intrusive rocks have been exposed in large areas. Since the Late Mesozoic era, a tectonic pattern dominated by NW- and NE-trending faults has been formed and the volcanic rocks are distributed along the NE-trending fault. The Cenozoic tectonic activities mostly inherited the Mesozoic faults and developed multiple Cenozoic faults along the NE direction. These inherited faults controlled the distribution of Cenozoic volcanoes and volcanic rocks in the Great Khingan Mountains (Wu, 2013; Yin et al., 1980; Li et al., 2012).
We analyzed topographic features from SRTM DEM. Two types of data, namely, SRTM-1 with a 30 m spatial resolution and SRTM-3 with a 90 m spatial resolution, have been widely used in the study of tectonic geomorphology (Liu et al., 2006; Wang et al., 2013; Su et al., 2015,2016). Considering the large selection scope of this study, SRTM-3 data can fully meet the study of macrogeomorphic characteristics in the Greater Khingan Mountains with a resolution of 90 m.
Slope and local topographic relief are macroindices of regional topographic features. The slope is constructed by calculating the steepest slope of each DEM pixel. That is, for each pixel, the pixel with the greatest elevation difference near it is searched. The slope angle can be determined according to the elevation difference and horizontal distance between two pixels. Local topographic relief is the elevation difference between the highest peak and valley bottom in a specific area and represents a river or glacier erosive capacity (Deffontains et al., 1994, 1997; Kühni and Pfiffner, 2001). In this study, a square statistical window of 1 × 1 km was selected for statistical study and the highest elevation matrix was subtracted from the minimum elevation matrix using the grid calculation tool of the geographic information system software (Zhang et al., 2011). We will obtain the distribution characteristics of slope and topographic relief in the Greater Khingan Mountains using DEM data.
Hypsometric analysis constructed by Strahler in 1952 is considered an effective tool for understanding the stages of geomorphic evolution and geological development of river catchment. Using Davis’ erosion cycle theory, Strahler proposed that the drainage basins were in different geomorphic evolution stages have different hypsometric curve and hypsometric integral (HI) value: youth stage which had a high hypsometric integral value (where HI > 0.6), and a convex upward hypsometric curve; equilibrium or mature stage which had a secondary hypsometric integral value (where 0.35 < HI < 0.6), and an s-shaped hypsometric curve; pereplain (old) or monadnock stage which had a low hypsometric integral value (where HI < 0.35), and a concave upward curve (Davis, 1899; Strahler, 1952; Farhan et al., 2016).
A hypsometric curve is the curve obtained by taking the relative area ratio (a/A) of a basin as the horizontal axis and the relative height ratio (h/H) as the vertical axis. It is a geomorphologic parameter used to describe the three-dimensional volume residual rate of the surface with a two-dimensional curve, where h is the elevation difference between a certain elevation and the lowest elevation in the basin, H is the maximum elevation difference, A is the cross-sectional area of the lowest elevation of the basin (the total area of the basin projected on the horizontal plane), and a is the cross-sectional area of a certain elevation of the basin (Chen, 2008; Su et al., 2015,2016). The area under the hypsometric curve is the hypsometric integral value. In this study, the hydrological analysis module of ArcGIS10.3 was used to extract the water network. We selected 20 basins on the eastern flank and 20 basins on the western flank of the Greater Khingan Mountains. The hypsometric curve and hypsometric integral value was acquired using CalHypso Tools, an ArcGIS add in developed by Pérez-Peña et al. (2009).
During geomorphic evolution, tectonic activity or climate change can change the channel gradient or the river’s cross-section area, changing the river’s erosion capacity, adjusting the river’s hydraulic power, changing the river basin’s erosion and transport capacity, and, finally, making the whole basin system gradually tend to equilibrium. For bedrock channels, the downstream erosion capacity of rivers is related to the boundary shear stress of bedrock channels induced by flowing water (Whipple & Tucker, 1999). The downstream erosion rate of rivers, E, can be expressed as a function of basin area A and channel gradient S; channel gradient S can be written in a differential form of elevation and distance, and Formula 1 can be obtained as follows:
In Formula 1, K is the erosion coefficient, m is the area index, n is the gradient index, Z is the river elevation, A is drainage area, and x is the river’s traceability distance (i.e., the direction from the outlet to the watershed). Elevation changes at any point of the bedrock channel with time can be expressed as the difference between uplift rate U and river erosion rate E, and Formula 2 can be obtained (Flint, 1974; Howard et al., 1983).
When the bedrock channel is in equilibrium (i.e., ∂z/∂t = 0) and uplift rate U and erosion coefficient K remain unchanged in space, the channel gradient can be expressed as Formula 3.
By integrating Formula 3 from the outlet x0 to x along both sides of the river, Formula 4 can be obtained. To make the integral term in Formula 4 have the same dimension as the river-tracing distance, the reference watershed area A0 is introduced, which can take any value (Perron and Royden, 2013).
By replacing the integral on the right side of Formula 4 with χ and assigning the elevation Z (x0) at the outlet of the basin to 0, the formula can be rewritten as Formula 6.
In the stream power model the channel steepness index is defined as
From Formula 6, the elevation value of each point on the river can be expressed as a function of χ, which only depends on the upstream basin’s distribution area, thus avoiding the data deviation caused by elevation noise. Using elevation Z as the ordinate and χ as the abscissa, the plot is called the chi plot (Figure 2). When A0 is 1, the elevation change in the chi plot (slope in chi plot) represents the same meaning as the normalized steepness index obtained in the slope–area log–log plot. Furthermore, Willett et al. proposed in 2014 that the χ difference between the two sides of the divide can be used to analyze the dynamic migration process of the divide, explain the large-scale river capture event, and describe the drainage system’s evolution process. River capture changes the watershed area, causing abnormal changes in the χ value. Therefore, the abnormal changes in the χ value can reflect river capture and divide migration. When the water system on both sides of the divide is unbalanced, the χ values of the two sides are different. The divide will migrate from the side with the lower χ value to the side with the higher χ value. Finally, the χ value difference between the two sides of the divide decreases and the drainage system evolution reaches equilibrium (Figure 2) (Willett et al., 2014).
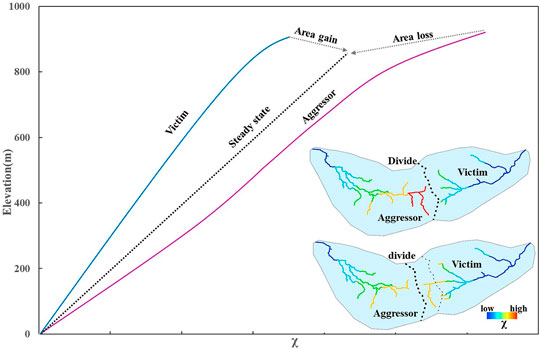
FIGURE 2. River basins and river profiles in equilibrium and disequilibrium. The parameter χ predicts the steady-state elevation for a given point on a channel. The basin on the left (aggressor) has lower steady-state elevation at channel heads and therefore drives the drainage divide toward the basin on the right (victim) (modified from Willett et al., 2014).
In this study, ChiProfiler (Gallen and Wegmann, 2017) was used to calculate the χ values. The parameters were set as follows: m/n = 0.45, Acr = 10 km2 (the minimum catchment area at the river source was 10 km2). To ensure that the outlet possesses the same elevation of all basins, we selected a base plane of 300 m. According to the analysis methods and steps developed by Snyder et al. (2000) and Kirby et al. (2003), we extracted the river elevation and watershed area (A) from DEM, selected a 1 km moving window for smoothing, and calculated the river gradient (S) every 20 m vertical elevation difference at first. Then we obtained the normalized steepness index (ksn) (the y-axis intercept) and the channel concave index(θ) (the slope of the straight line) by inversion and regression according to the formula logs = − θ Loga + logks. In order to compare different river channels in the region, We determined θref = 0.45 (Snyder et al., 2000; Kirby et al., 2003). Finally, the average normalized steepness index of each sampling basin is calculated.
To reveal the spatial distribution characteristics of erosion rates in the structurally relatively stable region of the Greater Khingan Mountains, we selected 12 rivers on both sides of the north–central section of the Greater Khingan Mountains in July 2018. We collected modern river sand samples with diameters of 0.25–0.75 mm at their outlets. Preparations of the samples and 10Be/9Be ratios were measured at the Xi’an Accelerator Mass Spectrometry (AMS) Center, China. First, the quartz minerals were extracted using an acid solution and the heavy liquid method and treated with 1% HF and 1% HNO3 4–5 times to extract pure quartz. After purification, the 9Be carrier was added to quartz particles. HF and HNO3 digestions were used, and HClO4 was used to remove fluoride. Be was separated by an anion exchange resin and added to ammonia to obtain Be(OH)2 precipitation, which was transferred to a quartz crucible and burned in a muffle furnace at 900°C to generate BeO, and mixed with Niobium powder to press the target sample. Finally, AMS was used to measure the 10Be concentration (Zhang et al., 2012a, 2012b; Corbett et al., 2016; Dong et al., 2016; Dong et al., 2017).
After obtaining the 10Be concentration, we used Formula 8 to calculate the basin-averaged erosion rates (Granger and Schaller, 2014; Hu et al., 2021).
where C is the 10Be concentration measured (atoms/g), P is the average 10Be generation rate in the sampling basin (atoms/g/yr), λ is the decay constant of 10Be (4.997 × 10⁻⁷/a) (Chmeleff et al., 2010), Λ is the decay length of cosmic rays in rocks (∼160 g/cm2) (Gosse and Phillips, 2001; Marrero et al., 2016), and ε is the basin-averaged erosion rates we must obtain. To obtain the basin-averaged erosion rates using the above formula, we must first calculate the average 10Be generation rate of the sampling basin. We calculate the 10Be generation rate of each point in the basin through the standard generation rate of 4.0 atoms/g/yr at high latitude and low altitude (Borchers et al., 2016) and altitudinal scale effect (Lal, 1991; Stone, 2000) and then obtain the generation rate of the entire basin through average processing (Vermeesch, 2007). The topographic self-correcting regularity within the basin was obtained using previous tools (Codilean, 2006).
To quantitatively explore the stages of geomorphic evolution in the Greater Khingan Mountains, we acquired the hypsometric curve (Figure 3A) and HI index (Figures 3B,C) of 40 basins. The HI values range from 0.13 to 0.44, with an average of 0.30. From Figure 3, the HI values of most basins are less than 0.35. Only some basins on the southeastern and northwestern flanks approach 0.4, and the basins’ hypsometry curves are concave, with only some basins being s-shaped.
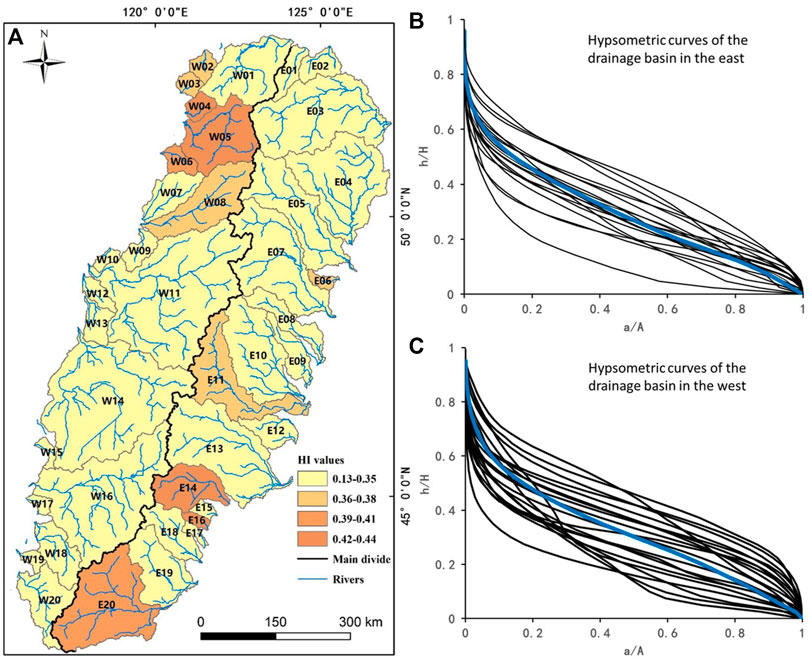
FIGURE3. Hypsometric curves and hypsometric integral (HI) values. (A) Map-view of the HI values. (B) Hypsometric curves of 20 drainage basins in the east. (C) Hypsometric curves of 20 drainage basins in the west. Hypsometric curves and HI values were obtained using the CalHypso Tools, an ArcGIS add in developed by Pérez-Peña et al. (2009).
We analyzed the average topographic development characteristics in the Greater Khingan Mountains following the definition of the hypsometry curve (Figure 4). As shown in Figure 4 the hypsometry curve of the Greater Khingan Mountains is a concave upward curve, it is similar to the hypsometry curve of most basins. The average HI value of both flanks in the Greater Khingan Mountains is 0.30. HI values indicate the volume residual rate of the basin under the joint influence of tectonism and denudation. So we proposed that the geomorphic evolution stage of the Greater Khingan Mountains is in a pereplain (old) stage. Because the Greater Khingan Mountains are in the inland, affected by West Pacific tectonic domain in the Cenozoic; however, because it is far away from the subduction zone, it has a weak tectonic movement response. In addition, the surface water system is developed with strong weathering.
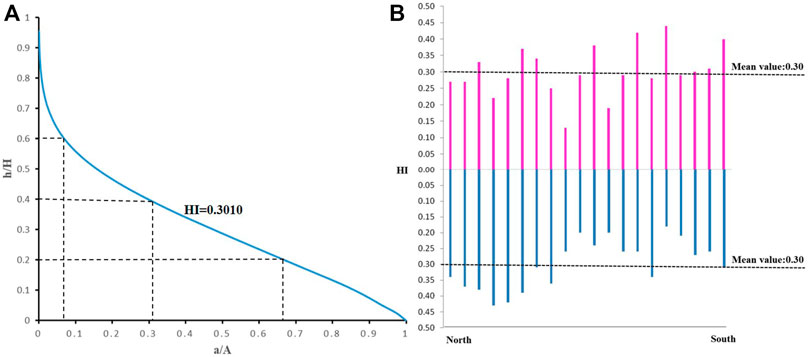
FIGURE 4. Hypsometric curves of the average topographic development curve in the Greater Khingan Mountains (A); hypsometric integral (HI) and mean values in the Greater Khingan Mountains (B).
The spatial distribution of the χ value in the Greater Khingan Mountains (the solid black line for the main divide) was shown in Figure 5A. No obvious change in the χ value occurs from the north to the south in the eastern flank, but the χ value in the western flank is lower in the north and higher in the south. Across the main divide, the χ values are higher in the western flank than in the eastern flank and the difference in the two flanks increases gradually from the north to the south. The difference in the χ values across the main divide indicates that the river system is in a state of disequilibrium and divide migration and river capture must reorganize the river system to achieve a state of equilibrium.
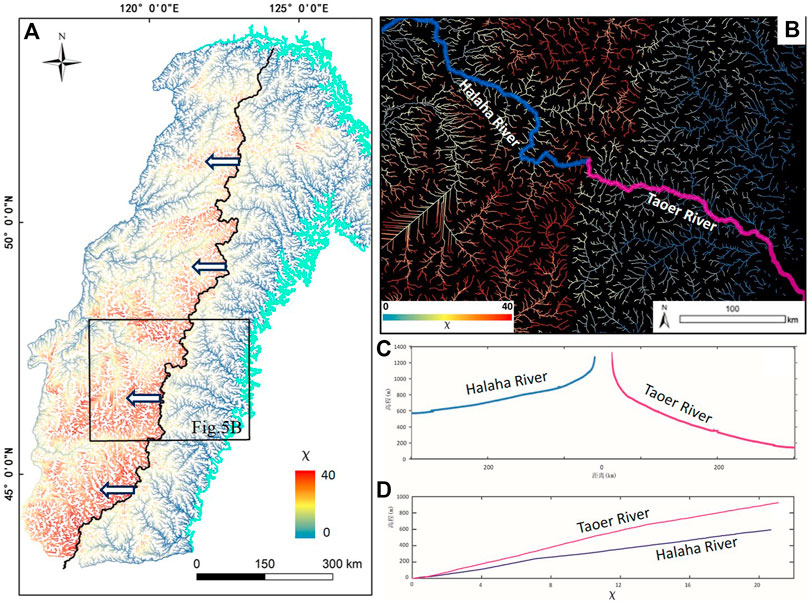
FIGURE 5. χ map of the Greater Khingan Mountains (A). The typical area with enormous differences in χ values (B). Elevation profile of the main rivers in the typical area (C). Chi plot of the main rivers in the typical area (D).
In the chi plot (plotted with elevation Z as the ordinate and χ as the abscissa), the longitudinal profile of equilibrium river channels displays a straight line passing through the origin (Figure 2). Due to local structural and climatic disturbances, such changes can be identified from the chi plot to observe whether the river longitudinal profile deviates from the steady linear state (Willet tal. 2014). We selected a typical area in the southern Greater Khingan Mountains, with a maximum difference in χ values across the main divide. We then made a chi plot of the Taoer River and Halaha River (Figure 5D). As seen in the graph, the Taoer River and Halaha River channels present near-linear profiles, indicating that the two rivers are in a quasiequilibrium state, coinciding with the hypsometric analysis results. The HI value of the Taoer River is 0.29 and that of the Halaha River is 0.26. However, the χ value of the Taoer River is less than that of the Halaha River on the same elevation. According to Willett et al (2014), channel χ values can predict divide migration. When there is a difference in χ values on both sides of a divide, a difference in erosion occurs on both sides, and the side with a small value has a high erosion rate, forcing the divide migrate to the other side (Willett et al., 2014; Yang et al., 2015; Beeson et al., 2017; Mudd, 2017). Therefore, the main divide in the middle and south sections of the Greater Khingan Mountains is unstable and will migrate westward.
Basin-averaged erosion rates calculated based on 10Be concentrations in our study are from 8.48 ± 0.78 to 16.90 ± 2.31 mm/kyr, with a slight difference between basins (Table 1; Figure 6). The 12 basins are mostly distributed in the middle and to the north of the Greater Khingan Mountains, including 8 basins in the western flank, with an average erosion rate of 13.33 mm/kyr, and 4 basins in the eastern flank, with an average erosion rate of 15.63 mm/kyr. Our results revealed that the basin-averaged erosion rates of the eastern flank of the Greater Khingan Mountains are slightly higher than that of the western flank.
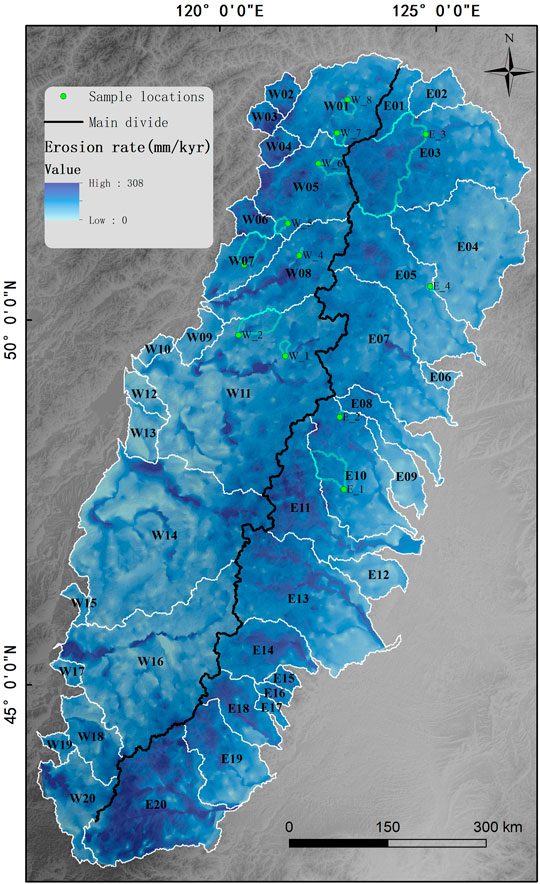
FIGURE 6. Erosion rate of the Greater Khingan Mountains, basin colors show erosion rates calculated from channel steepness, green lines are basin boundaries and dots are sample locations. Black lines are the main drainage divides.
We interpolated the erosion rates and channel steepness for the catchments on both sides of the Greater Khingan Mountains. Figure 7 shows a positive correlation between the erosion rates and channel steepness.
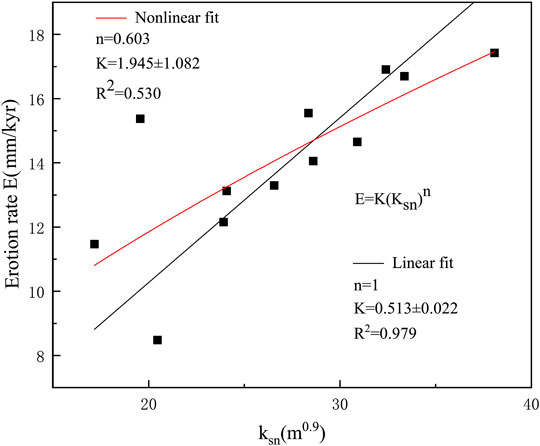
FIGURE 7. Linear and nonlinear fitting between catchment-averaged erosion rates (y-axis) and steepness indices (x-axis). The results of fitting indicate a better relevance in linear fitting than nonlinear fitting.
The present geomorphic form is the result of the interaction of internal and external geological forces in various geological historical periods. Two phases of topographic evolution in the Greater Khingan Mountains existed since the Cenozoic, especially the early period of the Late Pleistocene and the late period of the Early Pleistocene tectonic uplift shape the main landform of the Greater Khingan Mountains today. (Geology and Mineral Resources Bureau of Inner Mongolia, 1991). During geomorphic evolution, climate and surface erosion cannot be ignored and have the same significance as tectonic movements in both intensity and quantity. In this study, the geomorphic evolution stage of the Greater Khingan Mountains is in a pereplain (old) stage according to the result of the hypsometry analysis. However, from the spatial distribution of the χ values, the main divide of the southern Greater Khingan Mountains is unsteady and will migrate westward. However, the models applied to tectonic research using these geomorphic parameters are imperfect. They cannot integrate tectonic activity, climate precipitation, lithologic characteristics, and many other factors and cannot distinguish the influence of varied factors on divide migration only from the current geomorphology finally formed (Chen et al., 2014). Therefore, based on topographic factors extracted from the Greater Khingan Mountains, this study comprehensively analyzed regional topographic characteristics, precipitation conditions, and lithologic characteristics to obtain the driving factors of the Greater Khingan Mountains divide migration.
To achieve regional terrain information in this study, based on DEM data to calculate the slope and local topographic relief (Figures 8A,B), the results showed no obvious change in the spatial distribution of the slope and local topographic relief in the eastern flank, slightly higher in the middle. The slope and local topographic relief of the western flank are high in the north and low in the south.
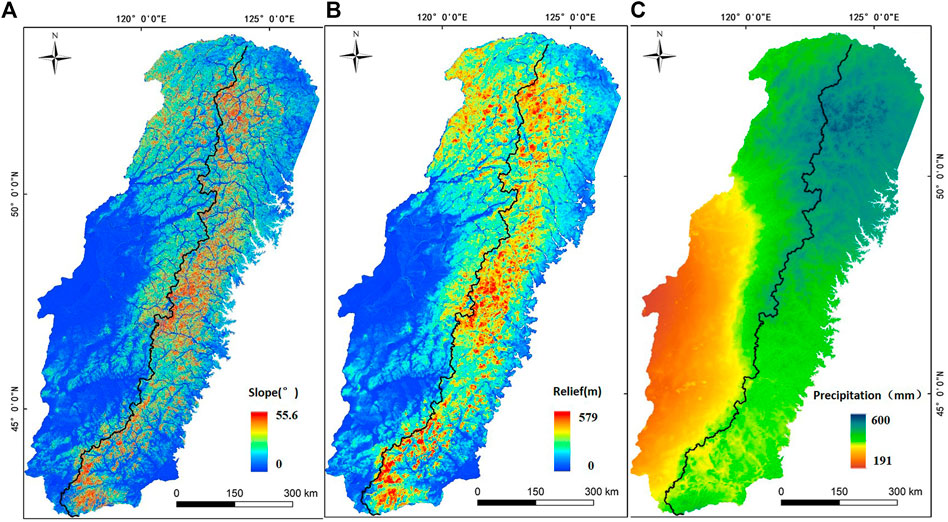
FIGURE 8. Slope map of the Greater Khingan Mountains (A). Local topographic relief map of the Greater Khingan Mountains (B). Average annual rainfall map of the Greater Khingan Mountains (C).
To further describe and compare the general topographic feature differences between the eastern and western flanks of the Greater Khingan Mountains as well as the northern, middle, and southern sections, two longitudinal swath profiles (50 km wide and 1,350 km long) and three transverse swath profiles (100 km wide and 600 km long) were established (Figure 1). For each swath profile, the minimum, mean, and maximum elevations were extracted in a 50 km-wide rectangular swath and projection in a vertical plane in the midline around the rectangular section (Figures 9A,B). Similarly, along the transverse swath profiles, within a 100-km-wide corridor with profile extraction minimum and average and maximum elevation (Figure 10). In the swath profile, the maximum elevation information represents the highest mountain summit of river erosion residue in the rectangular area, whereas the minimum elevation information represents the lowest river erosion residue in the rectangular area (Li et al., 2006; Zhang, 2006). The river cutting depth is the height difference between the highest peak elevation and the lowest riverbed left in the river erosion. The results showed that the three transverse swath profiles display a small topographic difference in the eastern flank in the northern section and no significant difference can be observed with respect to the depth of the river cutting between the two flanks. The topographic relief and river cutting depth of the eastern flank in the middle and southern sections are larger than those of the western flank. A quantitative comparison of the slope and local relief of the eastern and western flanks is presented in Figures 9C,D. The results showed that the slope of the eastern flank of the Greater Khingan Mountains ranges from 6° to 10°; the northern part is lower, whereas the southern part is slightly higher. The slope of the western flank is between 1° and 6°; the northern section is higher, whereas the southern section is significantly lower. The local topographic relief of the eastern flank of the Greater Khingan Mountains is approximately 600 m, the northern section is lower, and the middle and southern sections are slightly higher. The local topographic relief of the western flank is between 100 and 550 m, the northern section is higher, and the middle and southern sections are significantly lower.
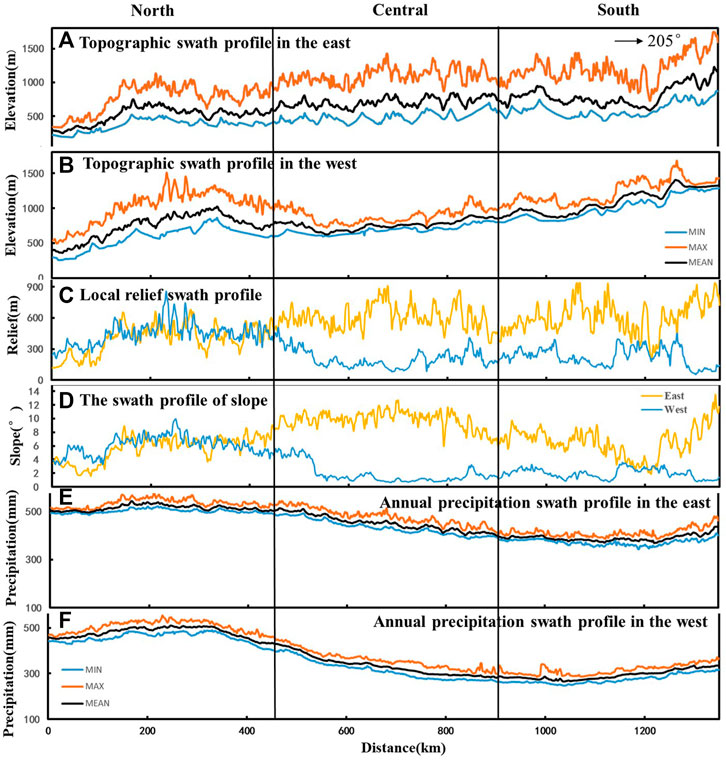
FIGURE 9. The swath profile in the east of the Greater Khingan Mountains (A). The swath profile in the west of the Greater Khingan Mountains (B). The swath profile of local topographic relief in the Greater Khingan Mountains (C). The swath profile of the slope in the Greater Khingan Mountains (D). The swath profile of average annual rainfall in the east of the Greater Khingan Mountains (E). The swath profile of average annual rainfall in the west of the Greater Khingan Mountains (F).
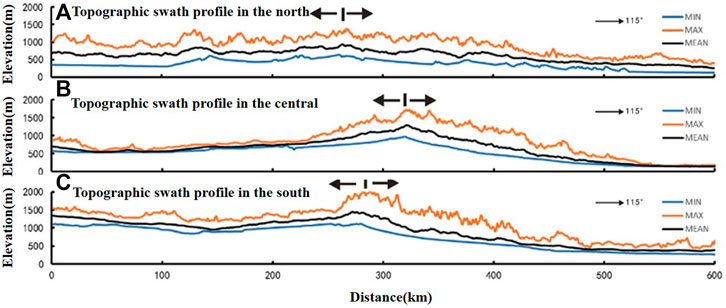
FIGURE10. Transverse swath profiles across different segments of the Greater Khingan Mountains. The swath is 100 km wide and 600 km long. See Figure 1 for locations. (A) North swath profile; (B) central swath profile; (C) south swath profile.
Studies have shown that the average slope and local topographic relief predict the erosion rate in midlatitude basins. The mean slope, local topographic relief, and erosion rate have a linear relationship. Therefore, a higher local topographic relief and steeper slope might result in higher erosion (Ahnert, 1970; Safran et al., 2005; Pan et al., 2010). Although the basin erosion rate measured using cosmogenesis nuclide 10Be did not cover the entire study area, the correlation analysis between the average erosion rate of the 12 basins obtained and the average channel steepness index displayed a strong linear correlation (Figure 7). Therefore, the erosion rate of the 40 basins in the study area can be calculated according to the average channel steepness index of the basin (Figure 6). The spatial differences in the slope, topographic relief, and erosion rates of the Greater Khingan Mountains are consistent. The slope, topographic relief, and erosion rates in the middle and southern parts of the Greater Khingan Mountains are higher in the east and lower in the west. Furthermore, from the swath profiles, the southern river in the eastern flank has a lower local erosion base level (the river in the eastern flank from the north to the south into the Heilongjiang, Nenjiang, and Liaohe rivers). However, all rivers in the western flank into the Erguna River, the upstream of the Heilongjiang River. Nenjiang River, and Liaohe River flow from north to south, whereas the Erguna River flows in the opposite direction. Therefore, obvious differences are observed in the elevation of the rivers flowing into the main river from the eastern and western flanks of the same divide, causing higher erosion of the eastern flank in the middle and south sections.
Rivers are the most active geological external forces shaping the landform and changing the appearance of the earth. Precipitation conditions are related to the runoff of rivers, which can change the hydrological conditions and sediment supply of river basins and, therefore, the strength of river erosion capacity (Whipple, 2009; Chen et al., 2014). In this study, WorldClim2 data were used to characterize rainfall characteristics in the Greater Khingan Mountains and discuss its impact on divide migration. WorldClim2 is based on data from 9,000 to 60,000 weather stations from 1970 to 2000 using thin-plate splines. High-precision global precipitation and temperature data are interpolated using elevation, distance to the coast, and three covariables (maximum and minimum table temperatures and cloud cover) derived from satellites as variables, the highest spatial resolution meteorological data in the Greater Khingan Mountains currently (https://worldclim.org/; Ficka and Hijmans, 2017).
From Figures 8C, 9E, 8F, the average annual precipitation is high in the north and low in the south. No significant difference occurs in the average annual precipitation on the eastern and western flanks of the northern section, and the average precipitation is 450–600 mm/a. The average annual precipitation on the western flank of the middle and southern sections is significantly lower than that on the eastern flank. The average precipitation on the western flank of the middle and southern sections is 200–400 mm/a. The annual precipitation on the western flank of the southern section is 200–300 mm/a. The average precipitation on the eastern flank of the south–central section is 400–550 mm/a. Therefore, the main divide of the south–central section of the Greater Khingan Mountains coincides with the equal precipitation line of 400 mm. To the east of the divide is a semihumid monsoon climate zone, and to the west is a semiarid continental climate zone. This is consistent with the spatial distribution of the χ value. The annual average precipitation gradually reduced from the north to the south. The χ value gradually increased from the north to the south, and the average annual precipitation and χ value differences also increase gradually from the north to the south. The average annual precipitation is the dominant factor of different erosions across the divide in the middle and southern Greater Khingan Mountains. However, studies have highlighted that the change in precipitation in mountainous areas is positively correlated with river channel concavity, that is, channels with high erosion rates caused by different rates of precipitation often have high concavity (Bookhagen and Burbank, 2006; Zaprowski et al., 2005; Schlunegger et al., 2011). Our results show that the channel concave values on the eastern and western flanks of the Greater Khingan Mountains are similar without significant differences (Figure 11). Although there are significant differences in the precipitation on the eastern and western flanks of the Greater Khingan Mountains, the maximum precipitation on both flanks is no more than 600 mm/a, which is much smaller than the average annual precipitation observed in previous studies, such as in the Southern Himalayas, the Eastern Cordillera, and the eastern American high plains (Bookhagen & Burbank, 2006; Zaprowski et al., 2005; Schlunegger et al., 2011). We propose that the prerequisite for a positive correlation between channel concavity and precipitation is that precipitation in this region reaches above a threshold, although there is no exact value of this threshold in existing studies. Therefore, more abundant precipitation on the eastern flank of the middle and southern sections of the Greater Khingan Mountains promotes the westward migration. Because the Greater Khingan Mountains are in a tectonically stable region, tectonic may be the main factors influence the erosion, relief, and divide migration in early time, and precipitation has gradually become the main factor. In addition, precipitation is the current state, and it is difficult to recover the past climate conditions quantitatively, so the contribution of precipitation in a long time scale is not excluded.
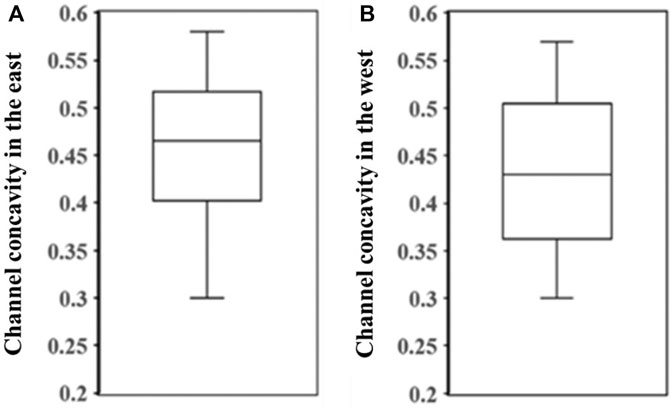
FIGURE 11. Channel concavity index in the east of the Greater Khingan Mountains (A). Channel concavity index in the west of the Greater Khingan Mountains (B).
Under the same tectonic background and precipitation conditions, rocks with different mineral compositions have different erosion resistances. Due to the lack of measurements of the strength of various rock types in the field, we used rock types formed in different ages to discuss their influence on erosion rates. The strata in this study area include Precambrian metamorphic basal layers dominated by gneiss, granulite, and schist; Paleozoic shallow micrometamorphic volcanic sedimentary rock dominated by schist, sand-slate, marble, and andesite; and Mesozoic, Jurassic, and Cretaceous strata dominated by continental intermediate-acidic volcanic rocks and continental clastic rocks. Jurassic strata of the Mesozoic are the most widely outcropped, mainly distributed on both sides of the main ridge of the northern and the eastern flanks of the middle and southern sections of the Greater Khingan Mountains. The Cenozoic Neogene strata are mainly exposed in the western flank of the middle and southern sections, such as the Hailar Basin, and are scattered in other areas with semicemented clastic and basic volcanic rocks. The Quaternary strata are well developed in the region, mainly distributed in Xing’an, Zhelimu, and Hulunbuir. The lithology is dark clay, moraine–glacial sediments, and lacustrine strata dominated by red clay and subclay (Liu, 2004; Geology and Mineral Resources Bureau of Inner Mongolia, 1991; Li, 1996). Furthermore, strong magmatic activities occur in this study area, including the out outings of Xingkai, Caledonian, Varician, and Yanshanian rocks. Yanshanian and Hercynian granitic rocks are mainly distributed on the eastern and western flanks of the northern section, and the corresponding ultramafic rocks are scattered in the area (Figure 12).
To discuss the influence of lithologic characteristics on divide migration, we focused on analyzing the lithologic characteristics of the area using the largest χ difference between the two sides of the middle and southern divides (Figure 5A). In this region, no significant spatial change occurs in the χ values of the eastern flank but the lithology changes. For example, the E13 basin is mainly Jurassic medium acidic volcanic rocks, whereas the E10 and E11 basins are not only Jurassic medium acidic volcanic rocks but also pre-Mesozoic strata and granites. In the E13 and W16 basins on both sides of the divide, the χ value of the E13 basin on the east side is significantly lower than that of the W16 basin on the west side; however, the lithology of the W16 basin is not only Jurassic medium acidic volcanic rocks but also Neozoic semicemented clastic and basic volcanic rocks. From the analysis of mineral stability, the erosion resistance of basic volcanic rocks is weaker than that of medium acidic volcanic rocks. However, the semicemented clastic rocks have a young sedimentary age, loose rock cementation, and low erosion resistance. If the lithologic characteristics of the region are the main factors affecting the erosion rate, the χ value of the eastern basin should be significantly higher than that of the western basin; however, it is the opposite. This phenomenon indicates that lithology is not the main factor controlling the χ values but other factors control the migration of the divide in the middle and southern sections of the Greater Khingan Mountains.
In conclusion, the divide migration in the middle and southern Greater Khingan Mountains is mainly controlled by topography, especially slope and local topographic relief, whereas precipitation conditions push and promote the divide migration. No obvious evidence that bedrock lithology significantly affects the divide migration exists. The terrain is mainly formed by tectonic uplift, although, based on the results of the hypsometric curve and HI index, the Greater Khingan Mountains of today’s structure is relatively stable. However, the development of a river terrace series and an uplifting amplitude survey study shows that the eastern flank of the Greater Khingan Mountains in the southern uplift earlier and at a greater rate than the western flank in the Pleistocene (Chen, 2012; Wu, 2013). This is due to the different response times of different elements in the basin to the change in the uplift rate; furthermore, the channel profile is the most sensitive, which is used to detect the impact of tectonic uplifts on geomorphology at the Holocene scale. Slope, divide, and the watershed area are the next factors most sensitive to the uplift rate (Duvall et al., 2004; Whipple et al., 2007; Burbank&Anderson, 2011; Beeson et al., 2017; Pan, 2019). Therefore, although the geomorphic evolution stage of the Greater Khingan Mountains is in a pereplain (old) stage, the divide of the midsouthern sections will continue to migrate westward until it reaches equilibrium (Figure 13).
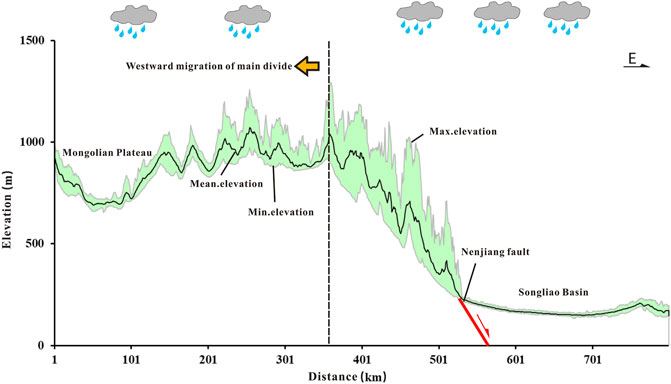
FIGURE 13. The swath profile across the southern sections of the Greater Khingan Mountains demonstrate that the main divide migrated westward.
Based on the DEM-based topographic analysis and 10Be basin-averaged erosion rate measurement results of the Greater Khingan Mountains, we have reached the following conclusions.
i) The geomorphic evolution stage of the Greater Khingan Mountains is in a pereplain (old) stage. The tectonic activity of this area is stable, and there is no obvious difference between the eastern and western flanks.
ii) The spatial distribution of χ values is generally higher in the west flank and low in the east flank and high in the south and low in the north in case of the western flank, indicating that the river system in the Greater Khingan Mountains has not been adjusted to achieve equilibrium; further, the main divide in the middle and south sections will migrate westward slowly.
iii) The slow westward divide migration is probably in response to the faster uplift rate at the eastern flank during the Pleistocene, and plentiful rainfall is a contributing factor now.
The original contributions presented in the study are included in the article/Supplementary Material, further inquiries can be directed to the corresponding author.
All authors listed have made a substantial, direct, and intellectual contribution to the work and approved it for publication.
This work was jointly supported by National Natural Science Foundation of China (No. 41888101), the Second Tibetan Plateau Scientific Expeditionand Research (STEP) (2019QZKK0704), Fundamental Research Funds for the Central Universities (ZY20215147).
The authors declare that the research was conducted in the absence of any commercial or financial relationships that could be construed as a potential conflict of interest.
All claims expressed in this article are solely those of the authors and do not necessarily represent those of their affiliated organizations, or those of the publisher, the editors and the reviewers. Any product that may be evaluated in this article, or claim that may be made by its manufacturer, is not guaranteed or endorsed by the publisher.
We gratefully acknowledge the guidance of Doctor Li Zhang and Jiangying Wu for 10Be experiment at the Xi’an Accelerator Mass Spectrometry (AMS) Center, China. We gratefully acknowledge editors and two reviewers provide many valuable advices for our paper.
Ahnert, F. (1970). Functional Relationships between Denudation, Relief, and Uplift in Large, Mid-latitude Drainage Basins. Am. J. Sci. 268 (3), 243–263. doi:10.2475/ajs.268.3.243
Beeson, H. W., McCoy, S. W., and Keen-Zebert, A. (2017). Geometric Disequilibrium of River Basins Produces Long-Lived Transient Landscapes. Earth Planet. Sci. Lett. 475, 34–43. doi:10.1016/j.epsl.2017.07.010
Bookhagen, B., and Burbank, D. W. (2006). Correction to "Topography, Relief, and TRMM-Derived Rainfall Variations along the Himalaya". Geophys. Res. Lett. 33 (8), 153–172. doi:10.1029/2006GL026944
Borchers, B., Marrero, S., Balco, G., Caffee, M., Goehring, B., Lifton, N., et al. (2016). Geological Calibration of Spallation Production Rates in the Cronus-Earth Project. Quat. Geochronol. 31 (4), 188–198. doi:10.1016/j.quageo.2015.01.009
Burbank, D. W., and Anderson, R. S. (2011). Tectonic Geomorphology. Second Edition. Hoboken, New Jersey: A John Wiley & Sons, Ltd., Publication.
Chen, L. Z. (2012). Neotectonism in Solon-Ulanhot Area. Beijing: China University of Geosciences, 1–60. (in Chinese).
Chen, T., Zhang, H. P., and Wang, W. T. (2014). Topographic Variation along the Minddle-East Segment of Haiyuan Fault Zone and its Implications. Seismology Geology. 36 (2), 449–463. doi:10.3969/j.issn.0253-4967.2014.02.014
Chen, Y. (2008).Morphotectonic Features of Taiwan Mountain Belt Based on Hypsometric Integral, Topographic Fractals and SL Index. Tainan: The Doctor''s Degree Thesis of National Cheng Kung University, 1–84.
Chmeleff, J., von Blanckenburg, F., Kossert, K., and Jakob, D. (2010). Determination of the 10be Half-Life by Multicollector Icp-Ms and Liquid Scintillation Counting. Nucl. Instr. Methods Phys. Res. Section B: Beam Interactions Mater. Atoms 268 (2), 192–199. doi:10.1016/j.nimb.2009.09.012
Codilean, A. T. (2006). Calculation of the Cosmogenic Nuclide Production Topographic Shielding Scaling Factor for Large Areas Using Dems. Earth Surf. Process. Landforms 31 (6), 785–794. doi:10.1002/esp.1336
Corbett, L. B., Bierman, P. R., and Rood, D. H. (2016). An Approach for Optimizing In Situ Cosmogenic 10be Sample Preparation. Quat. Geochronol. 33, 24–34. doi:10.1016/j.quageo.2016.02.001
Deffontaines, B., Lee, J.-C., Angelier, J., Carvalho, J., and Rudant, J.-P. (1994). New Geomorphic Data on the Active Taiwan Orogen: a Multisource Approach. J. Geophys. Res. 99, 20243–20266. doi:10.1029/94JB00733
Deffontains, B., Lacombe, O., Angelier, J., Chu, H. T., Mouthereau, F., Lee, J. C., et al. (1997). Quaternary Transfer Faulting in the Taiwan Foothills: Evidence from a Multisource Approach. Tectonophysics 274, 61–82. doi:10.1016/S0040-1951(96)00298-3
Deng, Q. D., Zhang, P. Z., Ren, Y. K., Yang, X. P., Min, W., and Chen, L. C. (2003). Active Tectonics and Earthquake Activities in china. Earth Sci. Front. 10 (U08), 66–73.
Deng, Q. D., Zhang, P. Z., Ren, Y. K., Yang, X. P., Min, W., and Chu, J. Z. (2002). Basic Features of Active Structure in China. Sci. China Ser. D-Earth 32 (012), 1020–1030. (in Chinese). doi:10.3321/j.issn:1006-9267.2002.12.007
Dong, G., Huang, F., Yi, C., Liu, X., Zhou, W., and Caffee, M. W. (20162016). Mid-late Pleistocene Glacial Evolution in the Grove Mountains, East Antarctica, Constraints from Cosmogenic 10Be Surface Exposure Dating of Glacial Erratic Cobbles. Quat. Sci. Rev. 145, 71–81. doi:10.1016/j.quascirev.2016.05.030
Dong, G., Zhou, W., Yi, C., Zhang, L., Li, M., Fu, Y., et al. (2017). Cosmogenic 10Be Surface Exposure Dating of 'Little Ice Age' Glacial Events in the Mount Jaggang Area, central Tibet. The Holocene 27 (10), 1516–1525. doi:10.1177/0959683617693895
Duvall, A., Kirby, E., and Burbank, D. (2004). Tectonic and Lithologic Controls on Bedrock Channel Profiles and Processes in Coastal California. J. Geophys. Res. 109 (F3), F03002. doi:10.1029/2003JF000086
Fang, S., Liu, Z. J., Huang, X. T., Guo, W., and Liu, Z. Q. (2008). Uplift and Topography Evolution Research at FT in Cenozoic of South-Eastern Slope of Daxing’anling Mountains. J. Jinlin University(Earth Sci. Edition) (05), 771–776. doi:10.3969/j.issn.1671-5888.2008.05.009
Farhan, Y., Elgaziri, A., Elmaji, I., and Ali, I. (2016). Hypsometric Analysis of Wadi Mujib-Wala Watershed (Southern jordan) Using Remote Sensing and Gis Techniques. Ijg 07 (2), 158–176. doi:10.4236/ijg.2016.72013
Fick, S. E., and Hijmans, R. J. (2017). WorldClim 2: New 1‐km Spatial Resolution Climate Surfaces for Global Land Areas. Int. J. Climatol 37, 4302–4315. doi:10.1002/joc.5086
Flint, J. J. (1974). Stream Gradient as a Function of Order, Magnitude, and Discharge. Water Resour. Res. 10 (5), 969–973. doi:10.1029/WR010i005p00969
Gallen, S. F., Wegmann, K. W., Frankel, K. L., Hughes, S., Lewis, R. Q., Lyons, N., et al. (2011). Hillslope Response to Knickpoint Migration in the Southern Appalachians: Implications for the Evolution of post-orogenic Landscapes. Earth Surf. Process. Landforms 36 (9), 1254–1267. doi:10.1002/esp.2150
Gallen, S. F., and Wegmann, K. W. (2017). River Profile Response to normal Fault Growth and Linkage: an Example from the Hellenic Forearc of South-central crete, greece. Earth Surf. Dynam. 5, 161–186. doi:10.5194/esurf-5-161-2017
Geology and Mineral Resources Bureau of Inner Mongolia (1991). Regional Geology of Inner Mongolia. Beijing: Geological Publishing House, 189–223. (in Chinese).
Gosse, J. C., and Phillips, F. M. (2001). Terrestrial In Situ Cosmogenic Nuclides: Theory and Application. Quat. Sci. Rev. 20 (14), 1475–1560. doi:10.1016/S0277-3791(00)00171-2
Granger, D. E., and Schaller, M. (2014). Cosmogenic Nuclides and Erosion at the Watershed Scale. Elements 10 (5), 369–373. doi:10.2113/gselements.10.5.369
He, C., Rao, G., Yang, R., Hu, J., Yao, Q., and Yang, C.-J. (2019). Divide Migration in Response to Asymmetric Uplift: Insights from the Wula Shan Horst, north china. Geomorphology 339 (AUG.15), 44–57. doi:10.1016/j.geomorph.2019.04.024
Howard, A. D., and Kerby, G. (1983). Channel Changes in Badlands. Geol. Soc. America Bull. 94 (6), 739–752. doi:10.1130/0016-7606(1983)94<739:ccib>2.0.co;2
Hu, K., Fang, X., Ferrier, K. L., Granger, D. E., Zhao, Z., and Ruetenik, G. A. (2021). Covariation of Cross-divide Differences in Denudation Rate and χ: Implications for Drainage basin Reorganization in the Qilian Shan, Northeast Tibet. Earth Planet. Sci. Lett. 562, 116812. doi:10.1016/j.epsl.2021.116812
Hu, X. F., Pan, B. T., Kirby, E., Li, Q. Y., Geng, H. P., and Chen, J. F. (2010). Spatial Differences in Rock Uplift Rates Inferred from Channel Steepness Indices along the Northern Flank of the Qilian Mountain, Northeast Tibetan Plateau. Chin. Sci. Bull. (23), 2329–2338. doi:10.1007/s11434-010-4024-4
Johnson, B. (2020). Stream Capture and the Geomorphic Evolution of the Linville Gorge in the Southern Appalachians, USA. Geomorphology 368, 107360. doi:10.1016/j.geomorph.2020.107360
Kirby, E., Whipple, K. X., Tang, W., and Chen, Z. (2003). Distribution of Active Rock Uplift along the Eastern Margin of the Tibetan Plateau: Inferences from Bedrock Channel Longitudinal Profiles. J. Geophys. Res. 108 (B4), 2217. doi:10.1029/2001JB000861
Kühni, A., and Pfiffner, O. (2001). The Relief of the Swiss Alps and Adjacent Areas and its Relation to Lithology and Structure: Topographic Analysis from a 250-m DEM. Geomorphology 41 (4), 285–307. doi:10.1016/S0169-555X(01)00060-5
Lal, D. (1991). Cosmic ray Labeling of Erosion Surfaces: In Situ Nuclide Production Rates and Erosion Models. Earth Planet. Sci. Lett. 104 (91), 424–439. doi:10.1016/0012-821X(91)90220-CLi
Li, S. C. (2012). Study on the Triassic-Jurassic Tectonic Evolution of the Middle Great Xing’an Range. Beijing: Chinese Academy of Geological Science, 1–112.
Li, W. G. (1996). Rock Strata in Inner Mongolia. Beijing: China University of Geosciences Press, 1–344.
Li, Y., Densmore, A. L., Zhou, R. J., Ellis, M. A., Zhang, Y., and Li, B. (2006). Profiles of Digital Elevation Models(DEM) Crossing the Eastern Margin of the Tibetan Plateau and the Irconstra Intson Dissection Depths and Incision Rates of Late Cenizoic Ricers. Quat. Sci. 026 (002), 236–243. doi:10.3321/j.issn:1001-7410.2006.02.011
Liu, J., Ding, L., Zeng, L. S., Tapponnier, P., and Gaudemer, Y. (2006). Large-scale Terrain Analysis of Selected Regions of the Tibetan plateau:Discussion on the Origin of Plateau Planation Surface. Earth Sci. Front. 13 (5), 285–299. doi:10.3321/j.issn:1005-2321.2006.05.002
Liu, J. M., Zhang, R., and Zhang, Q. Z. (2004). The regional metallogeny of da hinggan ling,china. Earth Sci. Front. (01), 269–277. doi:10.3321/j.issn:1005-2321.2004.01.024
Liu-zeng, J., Zhang, J., Ge, Y., Wang, W., Zeng, L., Gen, L., et al. (2018). Tectonic Geomorphology: An Interdisciplinary Study of the Interaction Among Tectonic Climatic and Surface Processes. Chin. Sci. Bull. 63 (30), 3070–3088. doi:10.1360/N972018-00498
Lv, H. H., Zhang, T. Q., Chang, Y. C., Wang, W., Zhou, Z. Y., and Zhang, X. M. (2014). Timing of Paleotopogarphic and Geomorphologic Evolution and Paleotopogarphic Recinstruction by Low-Temperature Thernochronologic Approaches. Mar. Geology&Quaternary Geology. 34 (03), 175–183. doi:10.3724/SP.J.1140.2014.03175
Ma, Z., Peng, T., Feng, Z., Li, M., Li, X., Guo, B., et al. (2019). Asymmetrical River Valleys and Their Tectonic Significance in the Maxianshan Area, Ne Tibetan Plateau. Geomorphology 329 (MAR.15), 70–80. doi:10.1016/j.geomorph.2019.01.001
Marrero, S. M., Phillips, F. M., Borchers, B., Lifton, N., Aumer, R., and Balco, G. (2016). Cosmogenic Nuclide Systematics and the Cronuscalc Program. Quat. Geochronol. 31, 160–187. doi:10.1016/j.quageo.2015.09.005
Miller, S. R., Sak, P. B., Kirby, E., and Bierman, P. R. (2013). Neogene Rejuvenation of central Appalachian Topography: Evidence for Differential Rock Uplift from Stream Profiles and Erosion Rates. Earth Planet. Sci. Lett. 369-370, 1–12. doi:10.1016/j.epsl.2013.04.007
Molnar, P., and England, P. (1990). Late Cenozoic Uplift of Mountain Ranges and Global Climate Change: Chicken or Egg? Nature 346, 29–34. doi:10.1038/346029a0
Mudd, S. M. (2017). Detection of Transience in Eroding Landscapes. Earth Surf. Process. Landforms 42, 24–41. doi:10.1002/esp.3923
Norton, K. P., Norton, K. P., and Zeilinger, G. (2011). Climatic Forcing on Channel Profiles in the Eastern Cordillera of the Coroico Region, Bolivia. J. Geology. 119, 97–107. doi:10.1086/657407
Pan, B.-t., Geng, H.-p., Hu, X.-f., Sun, R.-h., and Wang, C. (2010). The Topographic Controls on the Decadal-Scale Erosion Rates in Qilian Shan Mountains, N.W. China. Earth Planet. Sci. Lett. 292 (1-2), 148–157. doi:10.1016/j.epsl.2010.01.030
Pan, X. M. (2019). The River Reorganization Based on the Topographic Metrics and Modeling in the central Northern Qilian Mountain. Lanzhou: Lan zhou Univesity, 1–52.
Pérez-Peña, J. V., Azañón, J. M., and Azor, A. (2009). CalHypso: An ArcGIS Extension to Calculate Hypsometric Curves and Their Statistical Moments. Applications to Drainage basin Analysis in SE Spain. Comput. Geosciences 35 (6), 1214–1223. doi:10.1016/j.cageo.2008.06.006
Perron, J. T., and Royden, L. (2013). An Integral Approach to Bedrock River Profile Analysis. Earth Surf. Process. Landforms 38 (6), 570–576. doi:10.1002/esp.3302
Qian, C., Cui, T. R., Li, L. C., Chen, H. T., Qin, T., and Lu, L. (2013). Application of Aster-GDEM Data in the Geomorphic Characteristics Analysis of Northern Great Hinggnan Ling Mountains. J. Geomechanics 19 (01), 82–92. doi:10.3969/j.issn.1006-6616.2013.01.009
Safran, E. B., Bierman, P. R., Aalto, R., Dunne, T., Whipple, K. X., and Caffee, M. (2005). Erosion Rates Driven by Channel Network Incision in the Bolivian andes. Earth Surf. Process. Landforms 30 (8), 1007–1024. doi:10.1002/esp.1259
Scharf, T. E., Codilean, A. T., de Wit, M., Jansen, J. D., and Kubik, P. W. (2013). Strong Rocks Sustain Ancient Postorogenic Topography in Southern Africa. Geology 41 (3), 331–334. doi:10.1130/G33806.1
Snyder, N. P., and Whipple, K. X. (2000). Landscape Response to Tectonic Forcing: Digital Elevation Model Analysis of Stream Profiles in the mendocino Triple junction Region, Northern california. Geol. Soc. America Bull. 112 (8). doi:10.1130/0016-7606(2000)112<1250:lrttfd>2.0.co;2
Stone, J. O., and John, O. (2000). Air Pressure and Cosmogenic Isotope Production. J. Geophys. Res. 105 (B10), 23753–23759. doi:10.1029/2000JB900181
Strahler, A. N. (1952). Hypsometric (Area-Altitude) Analysis of Erosional Topography. Geol. Soc. America Bull. 63 (11), 1117. doi:10.1130/0016-7606(1952)63[1117:haaoet]2.0.co;2
Su, Q., Xie, H., Yuan, D.-Y., and Zhang, H.-P. (2017). Along-strike Topographic Variation of Qinghai Nanshan and its Significance for Landscape Evolution in the Northeastern Tibetan Plateau. J. Asian Earth Sci. 147 (oct.1), 226–239. doi:10.1016/j.jseaes.2017.07.019
Su, Q., Yuan, D. Y., and Xie, H. (2016). Geomorphic Features of the Heihe River Drainage basin in Western Qilian Shan-Hexi Corridor and its Tectonic Implications. Seismology Geology. 38 (2), 560–581. doi:10.3969/j.issn.0253-4967.2016.03.005
Su, Q., Yuan, D. Y., Xie, H., and Shao, Y. X. (2015). Geomorphic Features of the Danghe River Drainage basin in Western Qilian Shan Mountain and its Tectonic Implications. Quat. Sci. 35 (1), 48–59. doi:10.11928/j.issn.1001-7410.2015.01.05
Vermeesch, P. (2007). CosmoCalc: An Excel Add-In for Cosmogenic Nuclide Calculations. Geochem. Geophys. Geosyst. 8, Q08003. doi:10.1029/2006GC001530
Wang, Q., Wang, R., Zhang, B., Zhang, S., Zheng, Y., and Wang, Z. (2013). Small Organic Molecules Targeting PCAF Bromodomain as Potent Inhibitors of HIV-1 Replication. Med. Chem. Commun. 4 (4), 737–745. doi:10.1039/c3md20376j
Whipple, K. X. (2009). The Influence of Climate on the Tectonic Evolution of Mountain Belts. Nat. Geosci 2, 97–104. doi:10.1038/ngeo413
Whipple, K. X., and Tucker, G. E. (1999). Dynamics of the Stream-Power River Incision Model: Implications for Height Limits of Mountain Ranges, Landscape Response Timescales, and Research Needs. J. Geophys. Res. 104 (B8), 17661–17674. doi:10.1029/1999JB900120
Whipple, K. X., Wobus, C., Crosby, B., Kirby, E., and Sheehan, D. (2007). New Tools for Quantitative Geomorphology: Extraction and Interpretation of Stream Profiles from Digital Topographic Data. Boulder, CO: Geological Society of America, Annual Meeting, Short Course Guide. Available at: http://www.geomorphtools.org.
Willett, S. D., Hovius, N., Brandon, M. T., and Fisher, D. (2006). Tectonics, Climate, and Landscape Evolution. Boulder, USA: Geological Society of America, 398. doi:10.1130/SPE398
Willett, S. D., Mccoy, S. W., Perron, J. T., Goren, L., and Chen, C.-Y. (2014). Dynamic Reorganization of River Basins. Science 343 (6175), 1248765. doi:10.1126/science.1248765
Wu, X. M. (2013). The Sdudy on Neotactonism and Uplift Mechanism of the Weaern Slope in the Middle South Segment of the Daxinganling. Beijing: China University of Geosciences, 1–60.
Xiang, T. T. (2014). Studying on Process of Erosion-Deposition on Eastern Slope of Great Khingan and its Indicative Significance. Changchun: Jilin Univesity, 1–48.
Yang, J., Zheng, W., Wang, Y., Bi, H., Zhang, D., Zhang, P., et al. (2020). Quantitative Geomorphological Constraints on the Landform Evolution of the Current Active Boundary of the Northeastern Tibetan Plateau. Geomorphology 358, 107120. doi:10.1016/j.geomorph.2020.107120
Yang, R., Suhail, H. A., Gourbet, L., Willett, S. D., Fellin, M. G., Lin, X., et al. (2020). Early Pleistocene Drainage Pattern Changes in Eastern Tibet: Constraints from Provenance Analysis, Thermochronometry, and Numerical Modeling. Earth Planet. Sci. Lett. 531, 115955. doi:10.1016/j.epsl.2019.115955
Yang, R., Willett, S. D., and Goren, L. (2015). In Situ low-relief Landscape Formation as a Result of River Network Disruption. Nature 520 (7548), 526–529. doi:10.1038/nature14354
Yin, X. H., Shi, Z. H., Liu, Z. B., and Zhang, Y. M. (1980). The Basic Features of Reginal Gravity Field in Chinese Continent[J]. Seismology Geology. (04), 69–75. doi:10.3724/SP.J.1246.2011.00001
Zaprowski, B. J., Pazzaglia, F. J., and Evenson, E. B. (2005). Climatic Influences on Profile Concavity and River Incision. J. Geophys. Res. 110 (F3). doi:10.1029/2004JF000138
Zhang, H.-p., Zhang, P.-z., Kirby, E., Yin, J.-h., Liu, C.-r., and Yu, G.-h. (2011). Along-strike Topographic Variation of the Longmen Shan and its Significance for Landscape Evolution along the Eastern Tibetan Plateau. J. Asian Earth Sci. 40 (4), 855–864. doi:10.1016/j.jseaes.2010.05.015
Zhang, H. P. (2006). Study on the Cenozoic Geomorphic Processes of Typical Regions along the Eastern and Northeastern Tibetan Margins. Beijing: China University of Geosciences, 1–71.
Zhang, H. P., Zhang, P. Z., Wu, Q. L., and Chen, Z. L. (2008). Characteristics of the Huanghe River Longitudinal Profiles Around Xunhua-Guide Area(NE Tibet)and Their Tectonic Significance. Quat. Sci. 28 (2), 299–309. doi:10.3321/j.issn:1001-7410.2008.02.012
Zhang, L., Wu, Z. K., Song, S. H., Chang, H., and Zhao, G. Q. (2012). Extraction and Purification of Quartz for In Situ Cosmogenic Nuclide Exposure Dating. Rock Mineral. Anal. 31 (5), 780–787. doi:10.3969/j.issn.0254-5357.2012.05.005
Zhang, L., Zhou, W. J., Chang, H., Zhao, G. Q., Song, S. H., and Wu, Z. K. (2012). Extraction of In-Situ 10 Be and 26 Al from Rock Sample and Accelerator Mass Spectrometric Measurements. Rock Miner. Anal. 31 (1), 83–89. doi:10.15898/j.cnki.11-2131/td.2012.01.001
Zhang, P. Z., Deng, Q. D., Zhang, G. M., Ma, J., Gan, W. J., and Min, W. (2003). Strong Earthquake Activities and Active Blocks in Mainland China. Sci. China Ser. D-Earth (S1), 12–20. doi:10.3321/j.issn:1006-9267.2003.z1.002
Keywords: Greater Khingan Mountains, geomorphology, hypsometric integral, χ analysis, erosion rates, divide migration
Citation: Lin L, Li X and Ma Z (2021) Quantifying the Geomorphology of the Drainage Basins Along the Greater Khingan Mountains in NE China. Front. Earth Sci. 9:796610. doi: 10.3389/feart.2021.796610
Received: 17 October 2021; Accepted: 22 November 2021;
Published: 08 December 2021.
Edited by:
Xuhua Shi, Zhejiang University, ChinaCopyright © 2021 Lin, Li and Ma. This is an open-access article distributed under the terms of the Creative Commons Attribution License (CC BY). The use, distribution or reproduction in other forums is permitted, provided the original author(s) and the copyright owner(s) are credited and that the original publication in this journal is cited, in accordance with accepted academic practice. No use, distribution or reproduction is permitted which does not comply with these terms.
*Correspondence: Lingling Lin, bGlubGluZ2xpbmdAY2lkcC5lZHUuY24=
Disclaimer: All claims expressed in this article are solely those of the authors and do not necessarily represent those of their affiliated organizations, or those of the publisher, the editors and the reviewers. Any product that may be evaluated in this article or claim that may be made by its manufacturer is not guaranteed or endorsed by the publisher.
Research integrity at Frontiers

Learn more about the work of our research integrity team to safeguard the quality of each article we publish.