
94% of researchers rate our articles as excellent or good
Learn more about the work of our research integrity team to safeguard the quality of each article we publish.
Find out more
ORIGINAL RESEARCH article
Front. Earth Sci., 22 December 2021
Sec. Economic Geology
Volume 9 - 2021 | https://doi.org/10.3389/feart.2021.795842
This article is part of the Research TopicAdvances in Multi-scale Multi-physics Geophysical Modelling and Fluid Transport in Unconventional Oil and Gas ReservoirView all 15 articles
Understanding different fluids flow behavior confined in microscales has tremendous significance in the development of tight oil reservoirs. In this article, a novel semiempirical model for different confined fluid flow based on the concept of boundary layer thickness, caused by the fluid–solid interaction, is proposed. Micro-tube experiments are carried out to verify the novel model. After the validation, the viscosity effect on the flow rate and Poiseuille number considering the fluid–solid interaction is investigated. Furthermore, the novel model is incorporated into unstructured networks with anisotropy to study the viscosity effect on pore-scale flow in tight formations under the conditions of different displacement pressure gradients, different aspect ratios (ratio of the pore radius to the connecting throat radius), and different coordination numbers. Results show that the viscosity effect on the flow rate and Poiseuille number after considering the fluid–solid interaction induces a great deviation from that in conventional fluid flow. The absolute permeability is not only a parameter related to pore structures but also depends on fluid viscosity. The study provides an effective model for modeling different confined fluid flow in microscales and lays a good foundation for studying fluid flow in tight formations.
Tight oil reservoirs have played a dominant role in the development of the petroleum industry (Cui et al., 2020; Cui et al., 2021aCui et al., 2021b; Zhao et al., 2021). However, the flow regularity in tight formations differs a lot from that in conventional reservoirs due to large numbers of microscale or even smaller pore throats (Lyu et al., 2018a). Understanding different fluid flow behavior in microscale is of great significance for a better prediction and development of tight oil reservoirs. Recently, a practical investigation of confined fluid flow has been carried out due to the availability of new tools (Nie et al., 2004; Ren and E, 2005; Zhao and Yang, 2012; Zhao et al., 2018; Zhao et al., 2020a), and advances in micro-electromechanical systems have triggered the study of microscale fluid flow (Kumar et al., 2016; Yang et al., 2016).
Many investigations have indicated that properties of confined fluids in microscales differ dramatically from those of bulk fluids (Heuberger et al., 2001; Levinger, 2002; Scatena et al., 2001), owing to the varying structures and dynamics of confined fluids induced by the fluid–solid interaction (Wu K. et al., 2017). Some novel flow phenomena have been discovered (Fei et al., 2009; Li, 2001; Ling et al., 2002; Xiangan et al., 2010), which are helpful for theoretical investigations of the dynamics of confined fluids (Li and He, 2005; Liu et al., 2005; Wu et al., 2017c; Xu et al., 2007; Zhi, 2003). The flow rates measured by Pfahler et al. (1990) and Qu et al. (2000) for water flow through micro-tubes were found smaller than those calculated by the classic Hagen–Poiseuille equation. In addition, the relationship of the Reynolds number vs displacement pressure gradient no longer obeys the traditionally theoretical calculation in micro-confined fluid flow (Makihara et al., 1993).
The aforementioned huge differences may rise from the significantly different strengths of the fluid–solid interaction. With the decreased flow scale, the fluid–solid interaction effect on confined fluid flow becomes more severe (Gad-El-Hak, 1999; Sandeep Arya et al., 2013; Zhang et al., 2014). The fluid in the interface region is forced to stick on the wall surface due to the strong interaction and cannot move at a certain displacement pressure gradient. Jiang et al. (2006) carried out the deionized water flow experiment in micro-tubes made of quartz at high pressure under steady flow conditions and found that the deionized water cannot flow when the radius decreases to 2.32 μm, which validated the existence of the immovable layer. Mapxacin (1987) and Huang (1998) refer to this immovable fluid layer caused by the fluid–solid interaction as the boundary layer. Unlike the concept of the conventional boundary layer theory of hydromechanics (Schlichting and Gersten, 2003), the boundary layer here further shrinks the effective flow space of confined fluids and depends on the original throat radius, displacement pressure gradient, and fluid viscosity (Liu et al., 2005; Li, 2010). The emerging novel phenomena of the boundary layer should be included in order to accurately characterize confined fluid flow in microscale. Although many empirical correlations have been developed to represent boundary layer thickness (Li and He, 2005; Xu et al., 2007; Li et al., 2011; Liu et al., 2011; Cao et al., 2016; Wu et al., 2017a), most of them just take the displacement pressure gradient and original throat radius into account, while the factor of fluid viscosity is ignored, causing extreme limitation of their application when studying different fluid flow. Since multiphase flow usually occurs in tight formations (Lyu et al., 2018a), it is of great significance to take fluid viscosity into account to develop a novel model to represent the boundary layer thickness.
In this work, we first propose a novel model to represent the boundary layer thickness, which not only takes the displacement pressure gradient and throat radius into account but also the fluid viscosity. Then micro-tube experiments are used to validate the novel model. Subsequently, the viscosity effect on confined fluid flow in microscales is discussed in detail, including the flow rate and Poiseuille number. Furthermore, the novel model representing the boundary layer thickness is incorporated into unstructured networks with anisotropy to study the viscosity effect on pore-scale flow in tight formations, respectively, under the conditions of different displacement pressure gradients, different aspect ratios, and different coordination numbers. This study provides an effective model for modeling different micro-confined fluid flow and lays a good foundation for investigating fluid flow in tight formations.
The confined fluids in microscales possess different structural and dynamical properties from those of bulk fluids. Fluids in the inner region are attached on the wall surface and form an immovable layer due to a strong fluid–solid interaction. Since the boundary layer shrinks the flow space, the classic Hagen–Poiseuille equation is modified as Eq. 1 according to the physical meaning (Chen et al., 2018):
where Q is the flow rate, 10−9 cm3/s; r and h are, respectively, the radius of micro-tubes and boundary layer thickness, μm; μb is the bulk fluid viscosity, mPas; and ▽P is the displacement pressure gradient, MPa/m.
To characterize confined fluid flow in microscales, the boundary layer thickness needs to be accurately represented in advance. As summarized from previous literature on the boundary layer effect (Mazzoco and Jr, 1999; Pertsin and Grunze, 2004; Liu et al., 2005; Zhang et al., 2008; Cui et al., 2010; Zhu et al., 2013), the boundary layer thickness is affected not only by the micro-tube radius and displacement pressure gradient but also by the fluid viscosity. To obtain the relationship among them, the variable-by-variable analysis method is adopted here.
First, the relationship of the boundary layer thickness vs displacement pressure gradient needs to be obtained. It is clear that the flow rate is zero when no displacement pressure gradient is exerted on the fluid, which can be reckoned that the boundary layer thickness is equal to the original micro-tube radius (ratio of the boundary layer thickness h/r equals to 1). At the same time, the boundary layer thickness decreases with an increased displacement pressure gradient due to the novel equilibrium of shear force and the displacement pressure gradient (Wu et al., 2017b). Based on the experimental data of confined fluid flow in micro-tubes (Figure 1) (Li, 2010), it can be seen that ratio of the boundary layer thickness decreases exponentially with an increased displacement pressure gradient.
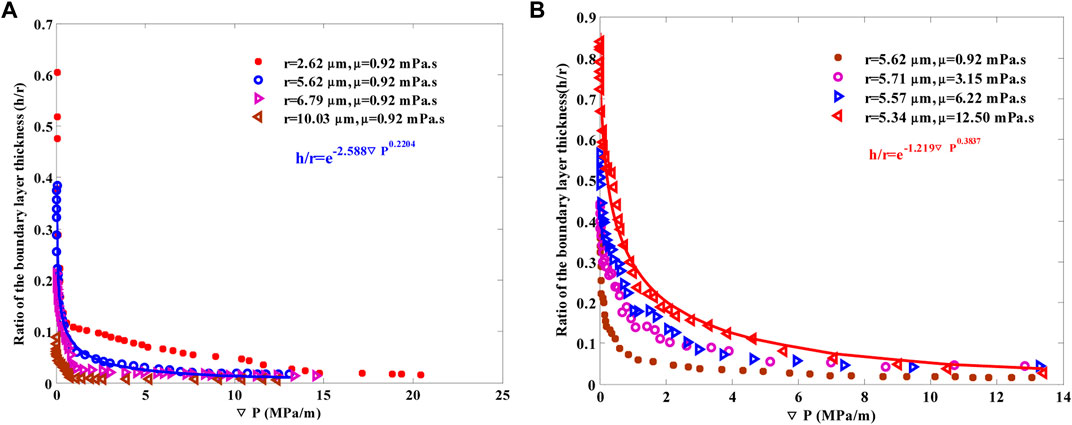
FIGURE 1. Relationship of the ratio of boundary layer thickness at (A) different micro-tube radii and (B) fluid viscosities.
Therefore, the relationship between the boundary layer thickness and displacement pressure gradient can be expressed as Eq. 2:
where b and c are related to tube radius and fluid viscosity, respectively, and their values are always positive.
Second, values of b and c at different micro-tube radii but with a fixed fluid viscosity (0.92 mPa s) are obtained based on Li’s micro-tube experiments (Figure 1A) (Li, 2010), which are shown in Figure 2.
To guarantee that b and c are always positive, exponential functions are used to obtain the relationship of b and c vs micro-tube radii at a fixed fluid viscosity, as given in Eq. 3:
where m, n, k, g, and p are related to the fluid viscosity.
Finally, relationships of parameters m, n, k, g, and p vs fluid viscosities are, respectively, obtained based on Li’s confined fluid flow experiments in microscales with different viscosities (Figure 1B) (Li, 2010), using Eq. 1, Eq. 2, and Eq. 3. The results are relatively shown in Figure 3.
As can be seen from Figure 3, the relationships of m, n, k, g, and p vs fluid viscosities can be expressed as follows:
Using the aforementioned variable-by-variable analysis method, the novel model to represent the boundary layer thickness with the consideration of displacement pressure gradient, micro-tube radius, and fluid viscosity is proposed. To validate the accuracy and reliability of the earlier novel model, Wu’s (Wu et al., 2017b) experimental data of deionized water flow in different radial micro-tubes are used. Comparison results are shown in Figure 4. It can be seen that the calculated flow rates agree well with the experimental values, indicating the accuracy of the novel model.
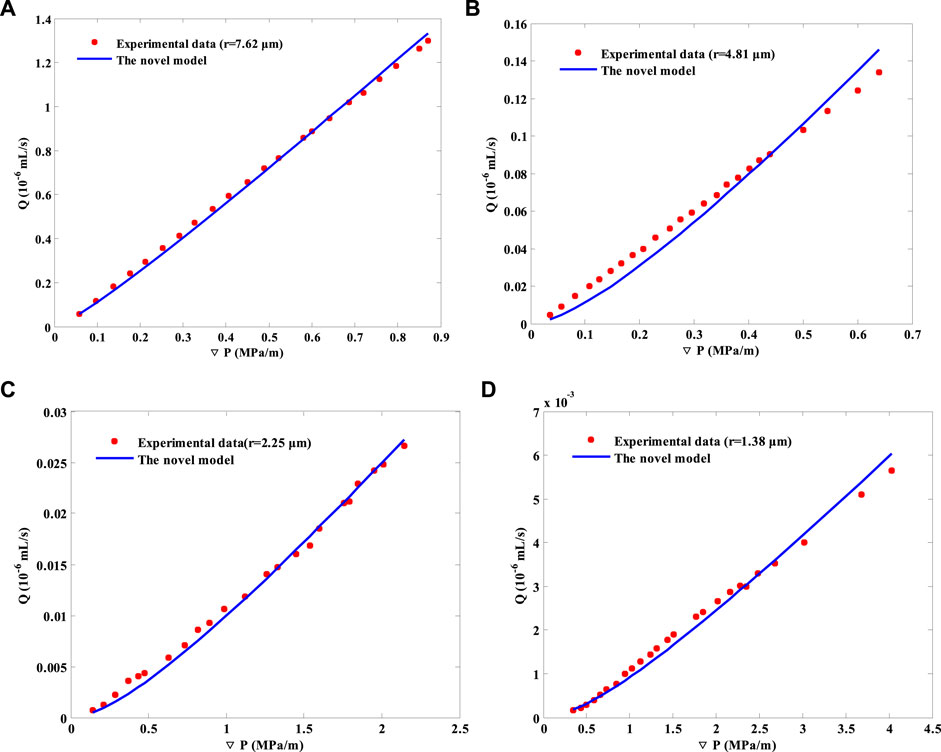
FIGURE 4. Comparison of the flow rate calculated by the novel model and experimental data (Wu et al., 2017b).
Compared with other empirical correlations, the novel model not only involves more factors but also considers the variations of parameters along with the micro-tube radius and fluid viscosity. In addition, the calculated boundary layer thickness by the novel model will never exceed the original radii of micro-tubes, which greatly broadens its application range. Since microscale and smaller scale pore throats possess similar flow mechanisms (Striolo, 2006; Thomas and Mcgaughey, 2009), the novel model may also be valid for modeling confined fluid flow in smaller scales. Furthermore, tight formations feature abundant micro-pore throats of different sizes, and the novel model lays a good foundation for studying fluid flow in tight formations. In the following sections, the viscosity effect on confined fluid flow from the perspective of flow rate and Poiseuille number in micro-tubes will be studied at first. Then the novel model will be incorporated into unstructured networks with anisotropy to investigate the viscosity effect on pore-scale flow in tight formations.
To study the effect of fluid viscosity on the flow rate due to the fluid–solid interaction, the decreasing factor, analogous to the enhancement one indicated by Mainak et al. (2005) and Holt et al. (2006), is defined as the ratio of the measured flow rate Qexp–Qn, predicted by the classic Hagen–Poiseuille equation. Since the measured flow rate can be well-predicted by our proposed novel model, it can be modeled by Eq. 1. Then, the decreasing factor can be expressed as follows:
Figure 5 shows the relationship of the decreasing factor vs the displacement pressure gradient at different radii and fluid viscosities, respectively, with and without considering the fluid–solid interaction. It is indicated that the decreasing factor keeps a constant (with its value 1) at any given displacement pressure gradient, pore throat radius, and fluid viscosity when the fluid–solid interaction is not included. However, great deviation occurs when the fluid–solid interaction is taken into consideration. The decreasing factor is no longer a constant, which gradually increases with the increased displacement pressure gradient. This phenomenon can be accounted for by the variation of the effective flow space. Due to the strong fluid–solid interaction, the fluid in the interface region is attached to the wall surface and cannot move, compressing the effective flow space, resulting in the smaller flow rate. With the increase in the displacement pressure gradient, the fluid–solid interaction gradually weakens, which enlarges the effective flow space. Therefore, the decreasing factor starts to increase and become more and more close to the one without considering the fluid–solid interaction.
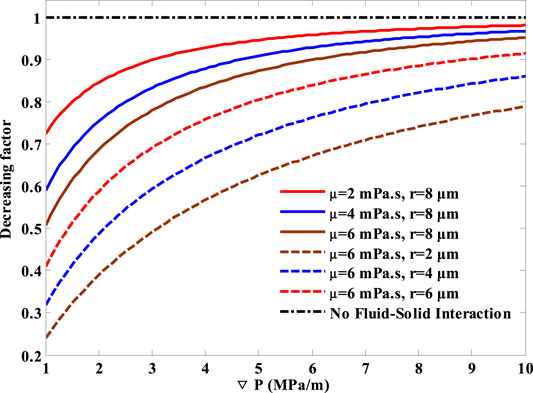
FIGURE 5. Relationship of the decreasing factor vs displacement pressure gradient at different radii and fluid viscosities.
In addition, the decreasing factor varies a lot at different fluid viscosities, which is quite different from its changing regularity without considering the fluid–solid interaction. The decreasing factor decreases with the increased fluid viscosity with its value being always smaller than 1. This phenomenon results from the fluid–solid interaction. With the increase in fluid viscosity, the fluid–solid interaction grows more intense, resulting in more and more fluids attached to the wall surface. Eventually, the effective flow space is further compressed as the fluid viscosity increases, resulting in the smaller flow rate and decreasing factor. Meanwhile, the smaller the original radius, the stronger will be the fluid–solid interaction. Therefore, the fluid viscosity effect on confined fluid flow will be more serious in the smaller flow space. As a result, the fluid viscosity effect is needed to be considered in tight formations, which captures large numbers of micro-/nano-pore throats.
The Poiseuille number is an important parameter to characterize fluid flow, and it has been studied for many years (Damean and Regtien., 2001; Dutkowski, 2008; Hong et al., 2008; John et al., 2009; Park et al., 2002) (Krishnamoorthy and Ghajar, 2007). Churchill (Churchill, 1988) pointed out that the Reynolds number Re is unsuitable for non-accelerating and viscous flow since density does not play a part. He suggested that the Poiseuille number Po should be used, instead of Re. Meanwhile, most of the initial work performed in determining Po in microscales reported a variation from the classical theory. Several studies reported a higher value of Po, while few reported a lower one (Krishnamoorthy and Ghajar, 2007). Even though enormous research has been performed on Po, a complete understanding of it is still unavailable. In this part, Po for the confined fluid flow in micro-tubes will be investigated.
Based on our proposed model, the expressions of the friction factor f and Re in micro-tubes can be, respectively, obtained in Eq. 6 and Eq. 7:
Since the Poiseuille number Po is the product of the friction factor and Reynolds number f×Re (Churchill, 1988), it can be expressed as follows:
Figure 6 illustrates the relationship of Po vs displacement pressure gradient at different fluid viscosities, with and without considering the fluid–solid interaction. It is noted that Po induces a significantly different changing rule from that in conventional fluid flow when the fluid–solid interaction is taken into consideration. Po in consideration of the fluid–solid interaction is always larger than the one ignoring the interaction and decreases with the increased displacement pressure gradient. This deviation can be due to the variation of the effective flow space caused by the fluid–solid interaction. As a result of the strong interaction, fluid in the inner region sticks to the wall surface and cannot move at a certain displacement pressure gradient, compressing the effective flow space. However, the effective flow space enlarges gradually with the increasing displacement pressure gradient, making Po more and more close to the value without considering the fluid–solid interaction.
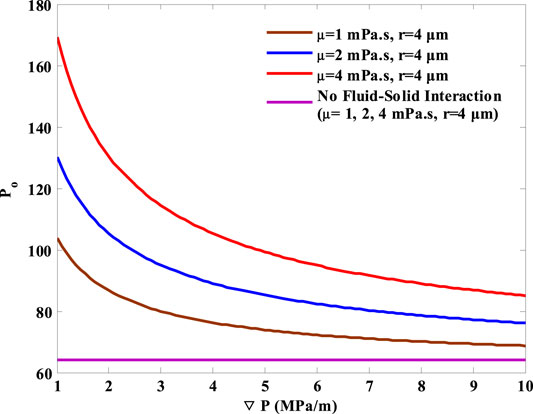
FIGURE 6. Relationship between Po and ▽P with and without considering the fluid–solid interaction at different fluid viscosities.
At the same time, it can be seen that Po also shows different values at different fluid viscosities. Po stays at a constant value of 64 when no fluid–solid interaction is considered, indicating that the fluid viscosity has no effect on it. In contrast, Po is no longer a constant after considering the fluid–solid interaction. With the increasing fluid viscosity, more and more fluid will be attached to the wall surface, reducing the effective flow space and resulting in larger flow resistance. Therefore, Po at large fluid viscosity is always higher than that at small one when the fluid–solid interaction is involved.
Fluid flow not only occurs in single tubes but also in tight formations with different pore throat radii and complex topologies (Lyu et al., 2019; Lyu et al., 2018c). In order to improve the recovery of tight oil reservoirs, fluid flow in tight formations should be studied correctly. In this section, the fluid viscosity effect on pore-scale flow in tight formations will be investigated.
For investigation, a platform which can represent the complex structures of tight formations is required to establish (Dong et al., 2017; Huaimin et al., 2019; Raeini et al., 2018; Wang and Sheng, 2018; Zhao et al., 2020b). Here, an unstructured stochastic network model with anisotropy is first constructed. The anisotropy here means that not all pores in the pore network possess the same coordination number. Each pore is assigned a coordination number based on the distribution of coordination numbers. Compared with other generation methods (Idowu, 2009; Raoof and Hassanizadeh, 2010), the method developed here can be applied to any coordination number distribution and is more flexible (Chalendar et al., 2018; Chen et al., 2019; Wang and Sheng, 2019). The detailed construction process is shown as follows:
1) An overall physical size of the network Lx×Ly×Lz and resolution Res are given. Based on the parameters, numbers of lattices [Lx/Res]×[Ly/Res]×[Lz/Res] are determined. Then the pore body of the network is randomly assigned on these lattices. Subsequently, the pore body radius is assigned based on the pore radius distribution. The following pore bodies are assigned on the remaining lattices, and the pore body radii are given one by one if the throat lengths between the pore body to be incorporated and incorporated pore bodies are all larger than the minimal pore radius of the pore radius distribution. The aforementioned operations are repeated until the overall porosity reaches the target (it is 0.12 in our study).
2) Coordination numbers are sampled from the probability distribution. We assume that the closer the distance of the pores, the easier they will be connected. Based on this assumption, we rank the pore bodies by their distances to the ninth most adjacent pores (since the largest coordination number in our study is 9) and assign the coordination number correspondingly.
3) For every pore body, we connect its nearest pores one by one until the connectivity reaches the assigned coordination number in step (2).
4) We sample the throat radii from the input probability distribution and rank them in ascending order. Then we assign the ranked throat radii to the throats by ranking the mean radii of their connecting pore bodies.
The input data here are based on the extracted pore network of Berea 3D digital rock data by Dong and Blunt (Hu and Blunt, 2009). We reduce the throat radius distribution by a factor of 10 to make the pore throat radius in the range of tight formations. Visualization of the stochastic network along with its distributions of pore radii, throat radii, and coordination number is presented in Figure 7. It can be seen that generated distributions of the pore radii, throat radii, and coordination number agree well with the target data, illustrating the reliability of the aforementioned generation method.
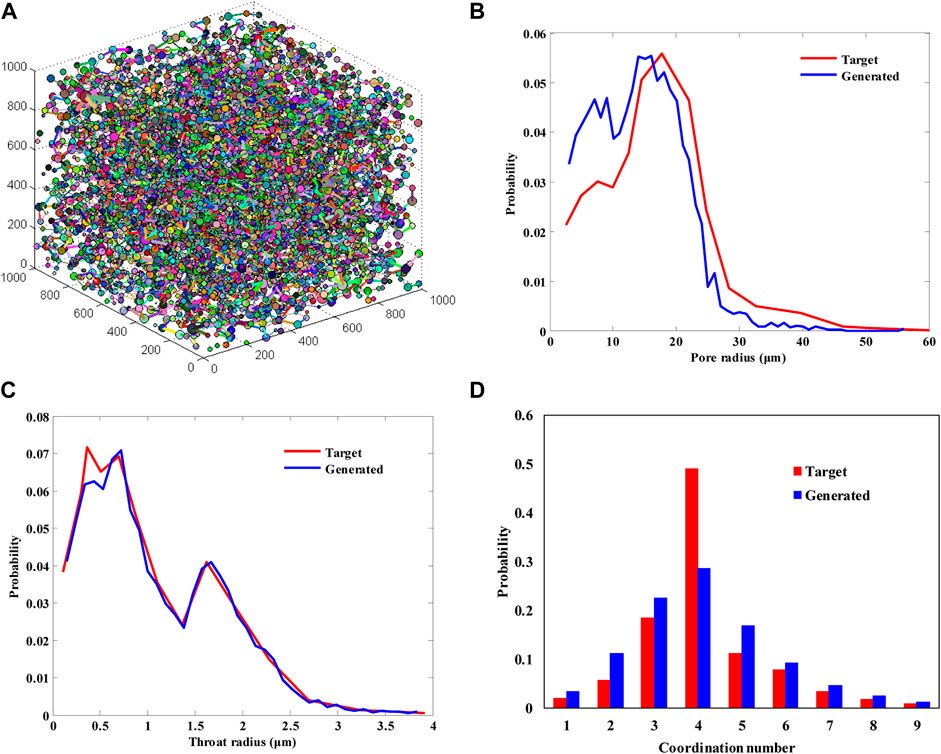
FIGURE 7. (A) Visualization of the network (1 mm × 1 mm × 1 mm) and (B) distributions of pore radii, (C) throat radii, and (D) coordination number.
When the network is fully saturated with a single-phase p, its flow rate at every pore satisfies the mass conservation as follows:
where j runs over all the throats connected to the pore i.
The flow rate between two pores i and j is given as follows:
where gp,ij and▽PP,ij are, respectively, the conductance and displacement pressure gradient between the pore bodies i and j.
The conductance between two pore bodies gp,ij is taken to be the harmonic mean of each individual conductance as follows:
where t indicates the connecting throat. The pore body lengths, Li and Lj, are the lengths from the pore–throat interface to the pore center.
Since the aspect ratio is large in tight formations (Zhao et al., 2015), the fluid–solid interaction in the pores is much smaller compared to that in the throats. Hence, the fluid–solid interaction will only be considered in the throats. Fluid conductance g of the pore and throat in single-phase laminar flow can be expressed as follows:
where gt and rt are, respectively, the throat conductance and radius.
Then a non-linear set of equations can be formed by combining Eq. 9 and Eq. 10, which has to be solved in terms of pore pressures through repeated iterations. The absolute permeability K of the network is found from Darcy’s law:
where K is the absolute permeability, um2; qt is the flow rate, cm3/s; Pin and Pout are respectively inlet and outlet pressures, 0.1 MPa; A and L are the cross-sectional area and length of the network, cm2 and cm.
Based on the aforementioned constructed network and fluid flow calculation process, the viscosity effect on pore-scale flow in tight formations can be realized. In the following part, the viscosity effect on pore-scale flow in tight formations will be studied under three different conditions, which are, respectively, different displacement pressure gradients, different aspect ratios, and coordination numbers.
Figure 8 shows the fluid viscosity effect on the effective throat radius and absolute permeability at different displacement pressure gradients, with and without considering the fluid–solid interaction.
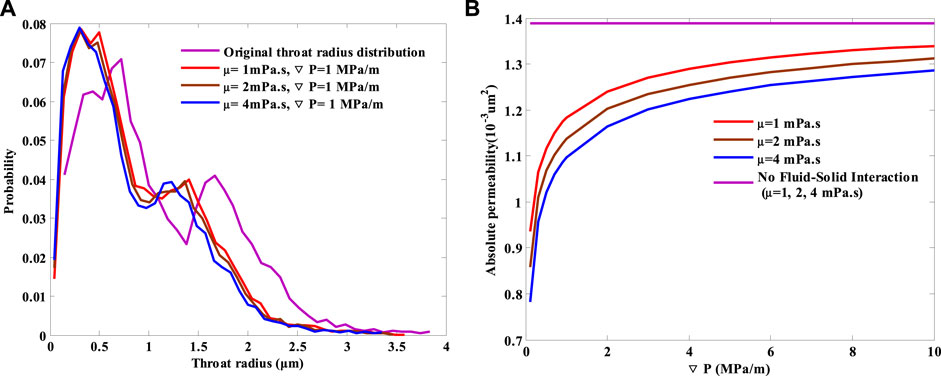
FIGURE 8. (A) Viscosity effect on the effective throat radius and (B) absolute permeability at different displacement pressure gradients with and without considering the fluid–solid interaction.
It can be seen that the absolute permeability keeps a constant with the same value at a series of different displacement pressure gradients and fluid viscosities when the fluid–solid interaction is ignored. This phenomenon indicates that displacement pressure gradients and fluid viscosities have nothing to do with the absolute permeability which is in agreement with our common sense. However, the effective flow structures of tight formations are influenced when the fluid–solid interaction is taken into consideration, which results in a significantly different changing rule of the absolute permeability from that in conventional fluid flow. The absolute permeability no longer keeps the same constant and changes with the variation of displacement pressure gradient and fluid viscosity. As displacement pressure gradient decreases, part of the boundary fluid that can originally participate in pore-scale flow is attached on the wall surface and cannot move, reducing the effective flow space. As a result, the absolute permeability is smaller than that ignoring the fluid–solid interaction. With the displacement pressure gradient continuing to decrease, the effective flow space grows smaller and smaller, and the deviation of the absolute permeability with and without considering the fluid–solid interaction turns larger and larger. Meanwhile, with the increase in fluid viscosity, the number of molecules in the fluid becomes large, resulting in a larger fluid–solid interaction. More and more fluid is attached on the pore wall and increases the boundary layer thickness. The effective flow space becomes smaller, which results in larger flow resistance. As a result, the absolute permeability decreases with increased fluid viscosity. The larger the fluid viscosity, the smaller will be the absolute permeability.
So as to investigate the fluid viscosity effect on pore-scale flow at different aspect ratios, we scale down the original throat radius distribution (Figure 7C) to a series of different values from 0.6 to 1 with the interval of 0.05, five of which are shown in Figure 9A in particular. Meanwhile, the other parameters in the aforementioned network (Figure 7) such as the distributions of the pore radii and coordination number, positions of the pore bodies and the physical size stay unchanged.
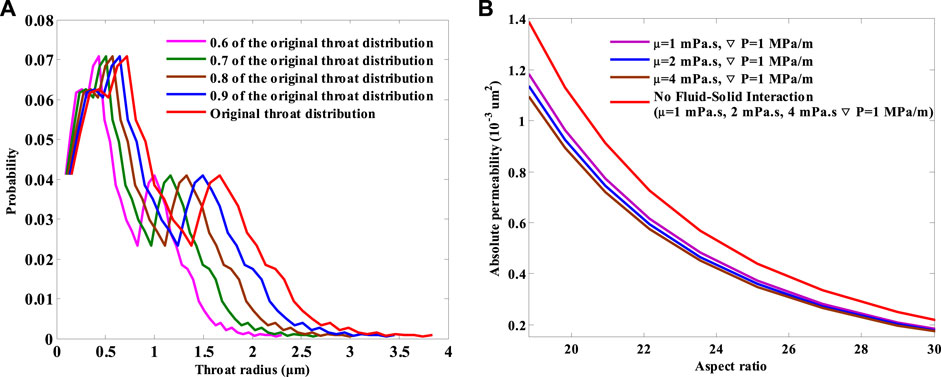
FIGURE 9. (A) Different distributions of original throat radius and (B) viscosity effect on the absolute permeability with and without considering fluid–solid interaction based on these different aspect ratios.
Figure 9B shows the fluid viscosity effect on the absolute permeability at a series of the above different aspect ratios, with and without considering the fluid–solid interaction.
It is noted from Figure 9B that the effect of fluid viscosity on the absolute permeability considering the fluid–solid interaction differs significantly from that ignoring the interaction. The absolute permeability curves at different fluid viscosities overlap when the fluid–solid interaction is excluded, indicating that the fluid viscosity has no effect on the absolute permeability. This is in accordance with the common sense that the absolute permeability is only the function of pore structures, which has nothing to do with fluid properties. However, the absolute permeability curves separate with each other when the fluid–solid interaction is involved. The absolute permeability decreases with increased fluid viscosity at a certain aspect ratio. This special behavior can be accounted for from the perspective of the fluid–solid interaction. As the fluid viscosity increases, the number of molecules in the fluid increases, resulting in larger surface microscopic forces. More and more fluid which can be driven at smaller fluid viscosity are attached on the wall surface due to the strong interaction, further compressing the effective flow space and resulting in larger flow resistance. Therefore, the absolute permeability decreases with the increased fluid viscosity at a constant aspect ratio.
For the sake of studying the fluid viscosity effect on pore-scale flow at different coordination numbers, the following process is developed to keep other structural parameters such as the distributions of the pore and throat radii, the positions of the pore bodies, and the physical size unchanged, except the coordination numbers.
1) We first generate the pore bodies including the radii and positions until the overall porosity reaches the target 0.12, as mentioned in the first step of constructing a stochastic network in section 3.2.
2) Based on the established pore bodies, we, respectively, set the coordination number as 4, 6, 8, and 10 and assign them to each pore correspondingly as the rule indicated in the second step in section 3.2
3) The remaining steps are the same as the ones (steps 3) and 4) of constructing the network) listed in section 3.2.
Through the aforementioned construction process, four stochastic networks with different coordination numbers but the same positions and radii distributions of pore bodies and the physical size are established. The generated distributions of throat radii with four different coordination numbers are shown in Figure 10A. It can be seen that the generated distributions of throat radii agree well with each other, guaranteeing the reliability of studying the viscosity effect on pore-scale flow at different coordination numbers.
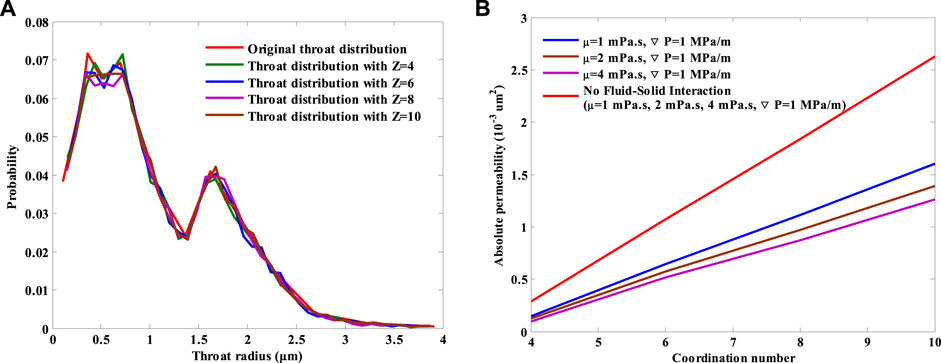
FIGURE 10. (A) Distribution of throat radius and (B) viscosity effect on the absolute permeability at different coordination numbers with and without considering fluid–solid interaction.
Figure 10B shows the fluid viscosity effect on the absolute permeability at different coordination numbers. It is clear that the viscosity effect on the absolute permeability differs a lot with and without considering the fluid–solid interaction. The absolute permeability curves overlap at different fluid viscosities when no fluid–solid interaction is taken into account, implying that the absolute permeability is independent of the fluid viscosity. However, the absolute permeability curves separate with each other when the fluid–solid interaction is involved. The larger the fluid viscosity, the smaller is the absolute permeability. This difference can also be due to the fluid–solid interaction. At a constant coordination number, the fluid–solid interaction grows more and more intense with the increased fluid viscosity. More and more fluid is attached on the wall surface, resulting in larger flow resistance and smaller absolute permeability.
In this work, a novel model considering the fluid–solid interaction is developed to characterize the confined fluid flow in microscales based on the concept of boundary layer. Micro-tube experiments with different scales are used to verify the accuracy and reliability of the novel model. Subsequently, the fluid viscosity effect on confined fluid flow in micro-tubes and pore-scale flow in tight formations are, respectively, studied. The following conclusions are arrived:
1) The viscosity effect on confined fluid flow in micro-tubes induces significant differences from that in conventional flow. With the increased fluid viscosity, the molecular density of the fluid increases which greatly strengthens the fluid–solid interaction. More and more boundary fluid is attached to the wall surface and cannot be driven at a certain displacement pressure gradient. Therefore, the effective flow space is narrowed and the flow resistance is magnified, which results in the smaller decreasing factor and larger Poiseuille number.
2) The absolute permeability is no longer a constant when considering the fluid–solid interaction into pore-scale flow in tight formations. The absolute permeability is not only related to pore structures of the porous media but also affected by the fluid viscosity, which is unlike our previous common sense.
3) The fluid–solid interaction grows with the increase in fluid viscosity, which compresses the efficient flow space. As a result, the absolute permeability decreases with increased fluid viscosity, respectively, under the conditions of different displacement pressure gradient, different aspect ratios, and different coordination numbers.
The original contributions presented in the study are included in the article/supplementary material, and further inquiries can be directed to the corresponding author.
MC is responsible for the main work and writing of the manuscript; QL and LC are responsible for the guidance and modifications of the manuscript; XW provides the thoughts of constructing networks and modifications of the manuscript; and CL and QF helps to improve English grammar of the manuscript.
Exploration on accumulation regularity and prospecting criteria of seepage gas hydrate in Lingshui 18 sea area; Science Foundation of China University of Petroleum, Beijing (Grant No. 2462021XKBH007). Exploration on accumulation regularity and prospecting criteria of seepage gas hydrate in Lingshui 18 sea area; Science Foundation of China University of Petroleum, Beijing (Grant No. 2462021XKBH007). The National Basic Research Program of China (U19B2005), the National Science and Technology Major Project of China (No.2017ZX05069003), and the sponsorship of China Scholarship Council (2019-2020).
MC, QF, and QL are employed by the China National Offshore Oil Corporation (China).
The remaining authors declare that the research was conducted in absence of any commercial or financial relationships that could be construed as a potential conflict of interest.
All claims expressed in this article are solely those of the authors and do not necessarily represent those of their affiliated organizations, or those of the publisher, the editors, and the reviewers. Any product that may be evaluated in this article, or claim that may be made by its manufacturer, is not guaranteed or endorsed by the publisher.
Arya, Sandeep., Khan, Saleem., Vaid, Akhil., Kour, Harneet., and Lehana, P. (2013). Microfluidic Mechanics and Applications: a Review. J. nano- Electron. Phys. 5 (4), 04047–04112.
Cao, R., Wang, Y., Cheng, L., Ma, Y. Z., Tian, X., and An, N. (2016). A New Model for Determining the Effective Permeability of Tight Formation. Transp Porous Med. 112 (1), 21–37. doi:10.1007/s11242-016-0623-0
Chen, M., Cheng, L., Cao, R., and Lyu, C. (2018). A Study to Investigate Fluid-Solid Interaction Effects on Fluid Flow in Micro Scales. Energies 11 (9), 2197–2217. doi:10.3390/en11092197
Chen, M., Cheng, L., Wang, X., Lyu, C., and Cao, R. (2019). Pore Network Modelling of Fluid Flow in Tight Formations Considering Boundary Layer Effect and media Deformation. J. Pet. Sci. Eng. 180, 643–659. doi:10.1016/j.petrol.2019.05.072
Churchill, S. W. (1988). Viscous Flows : the Practical Use of Theory. Harv. Educ. Rev. 67 (1), 105–106.
Cui, D. S., Xiang, W., Cao, L. J., and Liu, Q. B. (2010). Experimental Study on Reducing Thickness of Adsorbed Water Layer for Red clay Particles Treated by Ionic Soil Stabilizer. Chin. J. Geotechnical Eng. 32 (6), 944–949.
Cui, G., Ning, F., Dou, B., Li, T., and Zhou, Q. (2021b). Particle Migration and Formation Damage During Geothermal Exploitation From Weakly Consolidated Sandstone Reservoirs via water and CO2 Recycling. Energy 2022, 122507. doi:10.1016/j.energy.2021.122507
Cui, G., Ren, S., Dou, B., and Ninga, F. (2020). Whole Process Analysis of Geothermal Exploitation and Power Generation from a Depleted High-Temperature Gas Reservoir by Recycling CO 2.
Cui, G., Ren, S., Dou, B., and Ning, F. (2021a). Geothermal Energy Exploitation from Depleted High-Temperature Gas Reservoirs by Recycling CO2: The Superiority and Existing Problems. Geosci. Front. 12 (6), 101078. doi:10.1016/j.gsf.2020.08.014
Damean, N., and Regtien, P. P. L. (2001). Poiseuille Number for the Fully Developed Laminar Flow through Hexagonal Ducts Etched in (1 0 0) Silicone. Sensors Actuators A Phys. 90 (1), 96–101. doi:10.1016/s0924-4247(01)00457-5
de Chalendar, J. A., Garing, C., and Benson, S. M. (2018). Pore-scale Modelling of Ostwald Ripening. J. Fluid Mech. 835, 363–392. doi:10.1017/jfm.2017.720
Dong, H., Sun, J., Li, Y., Cui, L., Yan, W., and Zhang, J. (2017). Verification of the Carbonate Double-Porosity Conductivity Model Based on Digital Cores. Interpretation 5 (2), T173–T183. doi:10.1190/int-2016-0071.1
Dutkowski, K. (2008). Experimental Investigations of Poiseuille Number Laminar Flow of Water and Air in Minichannels. Int. J. Heat Mass Transfer 51 (25), 5983–5990. doi:10.1016/j.ijheatmasstransfer.2008.04.070
Fei, W., Xiangan, Y., Shaoliang, X., Li juan, Z., and Renbao, Z. (2009). Influence of Wettability on Flow Characteristics of Water through Microtubes and Cores. Chin. Sci. Bull. 54 (13), 2256–2262.
Gad-El-Hak, M. (1999). The Fluid Mechanics of Microdevices-The Freeman Scholar Lecture. Asme J. Fluids Eng. 121 (1), 5–33. doi:10.1115/1.2822013
Heuberger, M., Zach, M., and Spencer, N. D. (2001). Density Fluctuations under Confinement: when Is a Fluid Not a Fluid. Science 292 (5518), 905–908. doi:10.1126/science.1058573
Holt, J. K., Park, H. G., Wang, Y., Stadermann, M., Artyukhin, A. B., Grigoropoulos, C. P., et al. (2006). Fast Mass Transport through Sub-2-nanometer Carbon Nanotubes. Science 312 (5776), 1034–1037. doi:10.1126/science.1126298
Hong, C., Asako, Y., and Lee, J.-H. (2008). Poiseuille Number Correlation for High Speed Micro-flows. J. Phys. D: Appl. Phys. 41, 105111–105121. doi:10.1088/0022-3727/41/10/105111
Hu, D., and Blunt, M. J. (2009). Pore-network Extraction from Micro-computerized-tomography Images. Phys. Rev. E Stat. Nonlin Soft Matter Phys. 80 (2), 036307.
Huaimin, D., Jianmeng, S., Likai, C., Naser, G., and Weichao, Y. (2019). Characteristics of the Pore Structure of Natural Gas Hydrate Reservoir in the Qilian Mountain Permafrost, Northwest China. J. Appl. Geophys. 164, 153–159. doi:10.1016/j.jappgeo.2019.03.005
Huang, Y. Z. (1998). Percolation Mechanism of Low Permeability Reservoir. Beijing: Petroleum Industry Press.
Idowu, N. A. (2009). “Pore-Scale Modeling: Stochastic Network Generation and Modeling of Rate Effects in Waterflooding,”. Doctor of Philosophy Thesis, Imperial College London, London, 156
Jiang, R. J., Song, F. Q., and Li, H. M. (2006). Flow Characteristics of Deionized Water in Microtubes. Chin. Phys. Lett. 23 (12), 3305–3308.
John, T. J., Mathew, B., and Hegab, H. (2009). “Experimental Analysis of Poiseuille Number in Square Microchannels,” in Proceedings of the ASME 2009 International Mechanical Engineering Congress and Exposition, Lake Buena Vista, Florida, USA, November 13–19, 2009, 7. doi:10.1115/imece2009-11810
Krishnamoorthy, C., and Ghajar, A. (2007). “Single-Phase Friction Factor in Micro-tubes: A Critical Review of Measurement, Instrumentation and Data Reduction Techniques from 1991-2006,” in Proceedings of ASME ICNMM2007, 5th International Conference on Nanochannels, Microchannels and Minichannels Puebla, Mexico, 13. doi:10.1115/icnmm2007-30022
Kumar, R., Islam, M., and Hasan, M. M. (2016). Recent Trends, Challenges and Scope in Single-phase Liquid Flow Heat Transfer in Microchannels-A Review. Glob. Sci-te. 8 (2), 113–120. doi:10.5958/2455-7110.2016.00014.8
Levinger, N. E. (2002). Water in Confinement. Science 298 (5599), 1722–1723. doi:10.1126/science.1079322
Li, Y., Lei, Q., Liu, X. G., and Xiao, H. M. (2011). Non-linear Seepage Flow Characteristics under Micro Scale. Pet. Exploration Dev. 38 (3), 336–340. doi:10.1016/s1876-3804(11)60025-6
Li, Y. (2010). “Study of Microscale Nonlinear Flow Characteristics and Flow Resistance Reducing Methods,”. Doctor of Philosophy Thesis (Beijing, China: Institute of Porous Flow and Fluid Mechanics, Chinese Academy of Sciences).
Li, Z. F., and He, S. L. (2005). Influence of Boundary Layers upon Filtration Law in Low-Permeability Oil Reservoirs. Pet. Geology. Oilfield Dev. Daqing 24 (2), 57–59.
Ling, Z. Y., Ding, J. N., Yang, J. C., Fan, Z., and Li, C. S. (2002). Research Advance in Microfluid and its Influencing Factors. J. Jiangsu Univ. (Natural Science) 23 (6), 1–5.
Liu, D. X., Yue, X. A., Hou, J. R., Cao, J. B., and Wang, L. M. (2005). Experimental Study of Adsorbed Water Layer on Solid Particle Surface. Acta Mineralogica Sinica 25 (1), 15–19.
Liu, W. D., Liu, J., Sun, L. H., and Li, Y. (2011). Influence of Fluid Boundary Layer on Fluid Flow in Low Permeability Oilfields. Sci. Tech. Rev. 29 (22), 42–44.
Lyu, C., Ning, Z., Chen, M., and Wang, Q. (2019). Experimental Study of Boundary Condition Effects on Spontaneous Imbibition in Tight Sandstones. Fuel 235, 374–383. doi:10.1016/j.fuel.2018.07.119
Lyu, C., Ning, Z., Wang, Q., and Chen, M. (2018a). Application of NMR T2 to Pore Size Distribution and Movable Fluid Distribution in Tight Sandstones. Energy Fuels 32 (2), 1395–1405. doi:10.1021/acs.energyfuels.7b03431
Lyu, C., Wang, Q., Ning, Z., Chen, M., Li, M., Chen, Z., et al. (2018c). Investigation on the Application of NMR to Spontaneous Imbibition Recovery of Tight Sandstones: An Experimental Study. Energies 11 (9), 2359–2371. doi:10.3390/en11092359
Mainak, M., Nitin, C., Rodney, A., and Hinds, B. J. (2005). Nanoscale Hydrodynamics: Enhanced Flow in Carbon Nanotubes. Nature 438 (7064), 44.
Makihara, M., Sasakura, K., and Nagayama, A. (1993). The Flow of Liquids in Micro-capillary Tubes. Consideration to Application of the Navier-Stokes Equations. J. Jpn. Soc. Precision Eng. 59 (3), 399–404. doi:10.2493/jjspe.59.399
Mapxacin (1987). Physical and Chemical Mechanism of Reservoir. Beijing, China: Petroleum Industry Press.
Mazzoco, R. R., and Wayner, P. C. (1999). Aqueous Wetting Films on Fused Quartz. J. Colloid Interf. Sci. 214 (2), 156–169. doi:10.1006/jcis.1999.6212
Nie, X. B., Chen, S. Y., and E, M. O. (2004). A Continuum and Molecular Dynamics Hybrid Method for Micro- and Nano-Fluid Flow. J. Fluid Mech. 500 (500), 55–64. doi:10.1017/s0022112003007225
Park, S. J., Chung, S., Bang, H- W., Chung, C., Han, D- C., and Chang, J- K. (2002). “Modeling and Designing of Microfluidic System Using Poiseuille Number,” in 2nd Annual International IEEE-EMBS Special Topic Conference on Microtechnologies in Medicine and Biology, Madison, Wisconsin USA, 2-4 May 2002 (IEEE). doi:10.1109/MMB.2002.1002413
Pertsin, A., and Grunze, M. (2004). Water−Graphite Interaction and Behavior of Water Near the Graphite Surface. J. Phys. Chem. B 108 (4), 1357–1364. doi:10.1021/jp0356968
Pfahler, J., Harley, J., Bau, H., and Zemel, J. (1990). Liquid Transport in Micron and Submicron Channels. Sensors & Actuators 21 (89), 159–169. doi:10.1016/0924-4247(89)80008-1
Qu, W. L., Mala, G. M., and Li, D. Q. (2000). Pressure-driven Water Flows in Trapezoidal Silicon Microchannels. Int. J. Heat Mass Transfer 43 (3), 353–364. doi:10.1016/s0017-9310(00)00045-4
Raeini, A. Q., Bijeljic, B., and Blunt, M. J. (2018). Generalized Network Modeling of Capillary-Dominated Two-phase Flow. Phys. Rev. E 97 (2), 1–20. doi:10.1103/PhysRevE.97.023308
Raoof, A., and Hassanizadeh, S. M. (2010). A New Method for Generating Pore-Network Models of Porous Media. Transp Porous Med. 81 (3), 391–407. doi:10.1007/s11242-009-9412-3
Ren, W., and E, W. (2005). Heterogeneous Multiscale Method for the Modeling of Complex Fluids and Micro-fluidics. J. Comput. Phys. 204 (1), 1–26. doi:10.1016/j.jcp.2004.10.001
Scatena, L. F., Brown, M. G., and Richmond, G. L. (2001). Water at Hydrophobic Surfaces: Weak Hydrogen Bonding and strong Orientation Effects. Science 292 (5518), 908–912. doi:10.1126/science.1059514
Schlichting, H., and Gersten, K. (2003). Boundary-Layer Theory. New York: Springer Science & Business Media.
Striolo, A. (2006). The Mechanism of Water Diffusion in Narrow Carbon Nanotubes. Nano Lett. 6 (4), 633–639. doi:10.1021/nl052254u
Thomas, J. A., and Mcgaughey, A. J. H. (2009). Water Flow in Carbon Nanotubes: Transition to Subcontinuum Transport. Phys. Rev. Lett. 102 (18), 184502–184514. doi:10.1103/physrevlett.102.184502
Wang, X., and Sheng, J. J. (2019). Multi-scaled Pore Network Modeling of Gas-Water Flow in Shale Formations. J. Pet. Sci. Eng. 177, 899–908. doi:10.1016/j.petrol.2019.03.005
Wang, X., and Sheng, J. J. (2018). Pore Network Modeling of the Non-darcy Flows in Shale and Tight Formations. J. Pet. Sci. Eng. 163, 511–518. doi:10.1016/j.petrol.2018.01.021
Wu, J., Cheng, L., Li, C., Cao, R., Chen, C., Cao, M., et al. (2017b). Experimental Study of Nonlinear Flow in Micropores under Low Pressure Gradient. Transp Porous Med. 119 (1), 247–265. doi:10.1007/s11242-017-0882-4
Wu, J. Z., Cheng, L. S., Li, C. L., Cao, R. Y., Chen, C. C., Xu, Z. Y., et al. (2017a). “A Novel Characterization of Effective Permeability of Tight Reservoir - Based on the Flow Experiments in Microtubes,” in 19th European Symposium on Improved Oil Recovery (Norway: Stavanger), 16. doi:10.3997/2214-4609.201700299
Wu, J. Z., Cheng, S. L., Li, C., Cao, R., Chen, C., and Xu, Z. (2017c). Flow of Newtonian Fluids with Different Polarity in Micro Scale. Chin. Sci. Bull. 62 (25), 2988–2996.
Wu, K., Chen, Z., Li, J., Li, X., Xu, J., and Dong, X. (2017d). Wettability Effect on Nanoconfined Water Flow. Proc. Natl. Acad. Sci. USA 114 (13), 3358–3363. doi:10.1073/pnas.1612608114
Xiangan, Y., Nan, W., Zhang, L. J., and Fei, W. (2010). Flow Experiments of HPAM Solution in Quartz Micro-tubes. Mech. Eng. 21 (3), 81–84.
Xu, S., Yue, X., and Hou, J. (2007). Experimental Investigation on Flow Characteristics of Deionized Water in Microtubes. Chin. Sci Bull 52 (6), 849–854. doi:10.1007/s11434-007-0118-z
Yang, R. -J., Hou, H. -H., Wang, Y. -N., and Fu, L. -M. (2016). Micro-magnetofluidics in Microfluidic Systems: A Review. Sensors Actuators B: Chem. 224, 1–15. doi:10.1016/j.snb.2015.10.053
Zhang, P., Zhang, L. Z., Li, W. Y., and Wang, Y. F. (2008). Experiment on the Influence of Boundary Layer on the Non-darcy Seepage Law. J. Hebei Univ. Eng. 25 (3), 70–72.
Zhang, X. L., Zhu, W. Y., Cai, Q., and Liu, Q. P. (2014). Analysis of Weakly Compressible Fluid Flow in Nano/micro-Size Circular Tubes Considering Solid wall Force. Beijing Keji Daxue Xuebao/Journal Univ. Sci. Tech. Beijing 36, 569–575.
Zhao, C., and Yang, C. (2012). Advances in Electrokinetics and Their Applications in Micro/nano Fluidics. Microfluid Nanofluid 13 (2), 179–203. doi:10.1007/s10404-012-0971-1
Zhao, E., Hou, J., Du, Q., Liu, Y., Ji, Y., and Bai, Y. (2021). Numerical Modeling of Gas Production from Methane Hydrate Deposits Using Low-Frequency Electrical Heating Assisted Depressurization Method. Fuel 290, 120075. doi:10.1016/j.fuel.2020.120075
Zhao, H., Ning, Z., Wang, Q., Zhang, R., Zhao, T., Niu, T., et al. (2015). Petrophysical Characterization of Tight Oil Reservoirs Using Pressure-Controlled Porosimetry Combined with Rate-Controlled Porosimetry. Fuel 154, 233–242. doi:10.1016/j.fuel.2015.03.085
Zhao, J., Kang, Q., Yao, J., Zhang, L., Li, Z., Yang, Y., et al. (2018). Lattice Boltzmann Simulation of Liquid Flow in Nanoporous media. Int. J. Heat Mass Transfer 125, 1131–1143. doi:10.1016/j.ijheatmasstransfer.2018.04.123
Zhao, J., Qin, F., Derome, D., and Carmeliet, J. (2020a). Simulation of Quasi-Static Drainage Displacement in Porous media on Pore-Scale: Coupling Lattice Boltzmann Method and Pore Network Model. J. Hydrol. 588, 125080. doi:10.1016/j.jhydrol.2020.125080
Zhao, J., Qin, F., Derome, D., Kang, Q., and Carmeliet, J. (2020b). Improved Pore Network Models to Simulate Single-phase Flow in Porous media by Coupling with Lattice Boltzmann Method. Adv. Water Resour. 145, 103738. doi:10.1016/j.advwatres.2020.103738
Zhi, X. L. (2003). Experimental Study on Flow Characteristics of Liquid in Circular Microtubes. Microscale Thermophysical Eng. 7 (3), 253–265.
Keywords: flow rate, Poiseuille number, unstructured network, absolute permeability, aspect ratio, coordination number
Citation: Chen M, Li Q, Cheng L, Wang X, Lyu C and Fan Q (2021) A Study to Investigate the Viscosity Effect on Micro-Confined Fluids Flow in Tight Formations Considering Fluid–Solid Interaction. Front. Earth Sci. 9:795842. doi: 10.3389/feart.2021.795842
Received: 15 October 2021; Accepted: 10 November 2021;
Published: 22 December 2021.
Edited by:
Wenhui Song, China University of Petroleum (Huadong), ChinaReviewed by:
Jianlin Zhao, ETH Zürich, SwitzerlandCopyright © 2021 Chen, Li, Cheng, Wang, Lyu and Fan. This is an open-access article distributed under the terms of the Creative Commons Attribution License (CC BY). The use, distribution or reproduction in other forums is permitted, provided the original author(s) and the copyright owner(s) are credited and that the original publication in this journal is cited, in accordance with accepted academic practice. No use, distribution or reproduction is permitted which does not comply with these terms.
*Correspondence: Mingqiang Chen, NTQ5MTM1NDQ5QHFxLmNvbQ==
Disclaimer: All claims expressed in this article are solely those of the authors and do not necessarily represent those of their affiliated organizations, or those of the publisher, the editors and the reviewers. Any product that may be evaluated in this article or claim that may be made by its manufacturer is not guaranteed or endorsed by the publisher.
Research integrity at Frontiers

Learn more about the work of our research integrity team to safeguard the quality of each article we publish.