 Runwei Qiao1
 Fei Wang
 Tong Zhou
94% of researchers rate our articles as excellent or good
Learn more about the work of our research integrity team to safeguard the quality of each article we publish.
Find out more
ORIGINAL RESEARCH article
Front. Earth Sci., 03 January 2022
Sec. Economic Geology
Volume 9 - 2021 | https://doi.org/10.3389/feart.2021.794534
This article is part of the Research TopicAdvancements of Phase Behavior and Fluid Transport in Petroleum ReservoirsView all 10 articles
CO2-based fracturing is widely introduced to stimulate shale oil reservoirs for its multiple advantages. However, the range of CO2 entering the matrix around fractures and CO2-oil replacement capacity between matrix and fractures cannot be fully explained. To address this issue, a radial constant volume diffusion experiment on shale cores was designed in this study, and the pressure drop curve history was matched through numerical model to determine the composition effective diffusion coefficient. A field-scale numerical model was established, in which a series of certain grids were used to explicitly characterize fracture and quantify the prosess of CO2 mass transfer and oil replacement. Based on the field-scale numerical model, the process of shut-in, flow back, and oil production was simulated. The distribution of CO2 in fractured shale oil formation and its impact on crude oil during shut-in stage and flow back stage were investigated. This study concludes that CO2 gradually exchanges the oil in matrix into fractures and improve the fluidity of oil in matrix until the component concentrations of the whole reservoir reaches equilibrium during the shut-in process. Finally, about 30∼35 mole % of CO2 in fractures exchanges for oil in matrix. The range of CO2 entering the matrix around fractures is only 1.5 m, and oil in matrix beyond this distance will not be affected by CO2. During the process of flow back and production, the CO2 in fracture flows back quickly, but the CO2 in matrix is keeping dissolved in oil and will not be quickly produced. It is conclued that the longest possible shut-in time is conducive to making full use of the CO2-EOR mechanism in fractured shale oil reservoirs. However, due to the pursuit of economic value, a shut-in time of 10 days is the more suitable choice. This work can provide a better understanding of CO2 mass transfer mechanism in fractured shale oil reservoirs. It also provides a reference for the evaluation of the shut-in time and production management after CO2 fracturing.
Horizontal drilling and Hydraulic fracturing technologies have substantially increased oil production from unconventional resources (Zou et al., 2013; Zhao et al., 2018). The slick water fracturing fluid system is widely used in the process of hydraulic fracturing due to its high efficiency and low cost. However, a series of problems have also been introduced such as easily causing clay swelling, reducing formation permeability and consuming water resources (Myers, 2012; Vengosh et al., 2013). Introducing CO2 as a fracturing fluid seems to have broad application prospects for its multiple advantages (Liu et al., 2014; Meng et al., 2016; Wang et al., 2016b; Jin et al., 2017). Extensive experimental studies (Zhou et al., 2016; Zou et al., 2018; Li et al., 2019; Li et al., 2020a; Li et al., 2020b) and numerical simulation studies (Li et al., 2018b; Li and Zhang, 2019; Meng et al., 2019; He et al., 2020) have shown that CO2 fracturing fluid is beneficial to fracture morphology and fracture scale. Moreover, CO2-water-rock reaction also plays a positive role in the realization of large-scale hydraulic fracturing (Fischer et al., 2010; Zhang et al., 2018; Tian et al., 2020; Zhou et al., 2020a). In addition to the benefits of CO2 for fracture propagation and fracture morphology, another huge advantage of CO2 fracturing is the CO2-oil interactions.
The subject on CO2 enhancing oil recovery (EOR) in conventional oil and gas reservoir has been widely investigated. CO2 flooding and CO2 huff-n-puff has become an important means of enhancing oil reservoir production due to the behaviors of CO2 such solubility, miscibility, reducing viscosity, and suppling oil pressure after it contacts with crude oil (Habibi et al., 2017a; Habibi et al., 2017b). However, There is a big difference on the EOR mechanism of CO2 between unconventional formation and conventional formation mainly caused by the difference of transport mechanisms (Sorensen et al., 2015; Lu et al., 2016; Wang et al., 2016a; Zhou et al., 2019; Song et al., 2020).
In conventional reservoirs, the injected CO2 flows through the rock matrix and sweeps the oil out. However, in unconventional fractured reservoirs, CO2 will flow most rapidly through the major and minor fractures, but not significantly through the unfractured rock matrix due to the characteristics of low permeability and low porosity of rock matrix (Hawthorne et al., 2013, Hawthorne et al., 2014; Alharthy et al., 2015; Alfarge et al., 2018). In the early socking stage, pressure gradient between the fracture and the matrix lead to CO2 penetrating into limited rock matrix maily known as solution-gas drive. As the shut-in stage continues, advective mass transfer gradually weaken, and CO2 penetrates further into the matrix maily through diffusive mass transfer (Wei et al., 2020). During the whole socking satge, the CO2 transported into the matrix dissolve into oil and causes oil swelling, viscosity reduction. In addition, the pressure slightly increases in the matrix around fractures and this creates a local gradient where oil is extracted out of the matrix through fractures (Hawthorne et al., 2014).
It is concluded that diffusive mass transfer contributes CO2 transported further into the matrix, which may become the dominating transfer mechanism as pressure approaches equilibrium, until CO2 concentration equilibrium in oil phase is approached (Sorensen et al., 2015; Yu et al., 2015; Alfarge et al., 2018; Santiago and Kantzas, 2020). Thus, research on the diffusion of CO2 in porous media has become a vital subject for investigating CO2-EOR mechanisms in unconventional reservoirs. In previous experimental studies, indirect methods are mainly carried out to determinate the CO2 effective diffusion coefficient in laboratory. The process of CO2 diffusion in bulk liquid or in porous media is indirectly reflected by measuring and recording experimental data, including pressure decay, volume change, gas-liquid interface location (Trivedi and Babadagli, 2009; Ghasemi et al., 2018; Zhou et al., 2020b).
Among the different experimental methods, the pressure decay method is applied most commonly, such as the constant volume diffusion (CVD) method and radial constant volume diffusion (RCVD) method. Scholars usually dertermined the CO2 effective diffusion coefficient through establishing diffusion mathematical models with different factors considered (Li et al., 2016; Li et al., 2018a; Zhou et al., 2020b) or using commercial reservoir simulators (Ghasemi et al., 2016; Ghasemi et al., 2017; Tsau and Barati, 2018) and then historymatching the pressure profile. It is widely believed that the CO2 effective diffusion coefficient ranges from 10–10 to 10–9 m2/s, and lower viscosity of crude oil, higher temperature, and higher pressure facilitate the diffusion of CO2 into crude oil, under tight formation conditions (Li et al., 2018a; Fayazi; Amir and Apostolos, 2019; Zhou et al., 2020b).
Although the diffusion phenomenon in the laboratory is widely studied, there are few studies on the role of CO2 diffusion in field-scale simulation. The phenomenon that the distance of CO2 penetrating the matrix from fractures is usually several meters cannot be captured with the grids of several meters to tens of meters used in field-scale simulation (Alharthy et al., 2015; Ribeiro et al., 2015; Kanfar and Clarkson, 2017; Zuloaga et al., 2017; Zhang et al., 2019). Moreover, the dua-porosity model applied generally to simulate fractured reservoirs uses two independent sets of grids to simulate fractures and matrix respectively, which results that transient mass transfer process cannot be identified in the matrix adjacent to the fractures (Hoteit, 2011; Ghasemi and Suicmez, 2019).
In this study, a radial constant volume diffusion experiment on kerosene saturated shale cores was designed. and the pressure drop curve history was matched through numerical model to determine the composition effective diffusion coefficient. A field-scale numerical model based on data obtained in the laboratory was established, in which a series of certain grids were used to explicitly characterize fracture instead of a dual-porosity model to quantify the prosess of CO2 mass transfer and oil replacement. Through local refined grid of matrix around fractures, the true mass transfer distance of CO2 is obtained. In order to establish the initial shut-in conditions after CO2 fracturing, the porosity-permeability-pressure correlation curve of the fracture grids based on the fracture propagation numerical simulation results was used. Based on the field-scale numerical model, the process of shut-in, flow back and oil production after CO2-fracturing was simulated. The distribution of CO2 in fractured shale oil formation and its impact on crude oil during shut-in stage and flow back stage were investigated.
The Radial-Constant-Volume-Diffusion (RCVD) method is adopted for this study, which physical model is shown in Figure 1 (Li S. et al., 2018). A core sample with two end faces sealed is positioned vertically in a diffusion cell. The gas diffusion occurs only along the radial direction as illustrated in Figure 1. The decrease of pressure in the diffusion cell is recorded as a function of time to generate a pressure decay curve which is used for determining the effective diffusion coefficient. The greater side surface area of the core sample provides a greater diffusion flux, and this advantage makes the measured pressure decay curve less sensitive to the environment than the constant volume diffusion (CVD) method (Li and Dong, 2009).
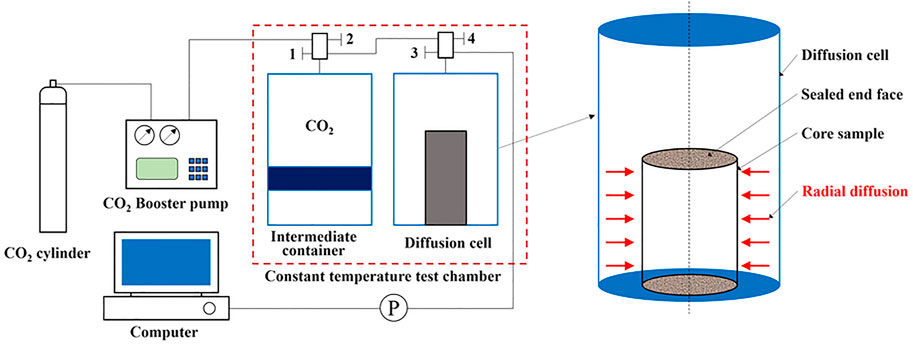
FIGURE 1. Schematic diagram of experimental apparatus and the physical model for CO2 diffusion.
Two core samples used in the experiments are collected from shale oil formation in the Ordos Basin, China, where its depth is 1,440 m at 46.4°C. After dring the core samples are dried at 105°C to constant weight, The permeabilities are determined with nitrogen gas flooding, and the porosities are determined using the Helium Porosimeter (Table 1). The core saturated with live oil cannot be put into the diffusion cell under high pressure in the experiment. As a compromise, kerosene withnot dissolved gas from the lab was used as experimental oil. As shown in Table 2, the viscosity and density of experimental oil are close to those of crude oil in the target formation characterized as a light oil. The CO2 gas with purity of 99.99% were used.

TABLE 1. Physical properties for the core samples with different test pressures at 46.4°C.
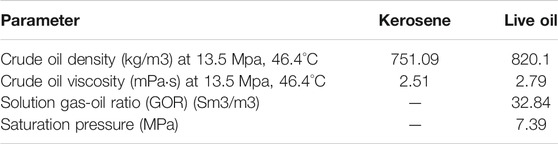
TABLE 2. Measured properties for the experimental oil sample and crude oil used in simulation.
The experimental apparatus is schematically shown in Figure 1. The core samples are placed vertically in the center of the diffusion cell with inner diameter of 37 mm and depth of 95 mm. The CO2 in the container is supplied from a CO2 cylinder, whose pressure can be controlled by a high-pressure booster pump. A constant temperature test chamber of accuracy 0.1°C is used to control the temperature of the CO2 container and the diffusion cell (dotted area in Figure 1). The pressure transducer with full scale pressure of 40.0 MPa and full scale accuracy of 0.5% is used to measure the pressure of the diffusion cell.
The procedure for conducting the diffusion experiments is briefly described as follows:
1) The core sample is cleaned and dried at 105°C to constant weight. Then, the permeability is determined with nitrogen gas flooding, and the porosity is determined using the Helium Porosimeter.
2) The core sample is placed in a container, and evacuated for more than 10.0 h. The experimental oil is pumped into the container under indoor temperature until the pressure reaches the test pressure. It is laid aside for 48.0 h for oil saturating.
3) After oil saturating, epoxy, and aluminum foil are used to seal the two end faces of the cylindrical core sample to establish an environment for radial diffusion.
4) The equipment required for the diffusion experiments is connected and the air tightness of the equipment is tested. Then, the core sample is placed into the diffusion cell. Low pressure CO2 is injected into it to replace air.
5) Intermediate container and the diffusion cell are placed into the constant temperature test chamber. When the required temperature of test chamber is stable, open valve 2, pump CO2 into intermediate container from the CO2 cylinder, adjust the booster pump to ensure the pressure in the intermediate container reach the required test pressure. Then, the intermediate container and diffusion cell are kept in test chamber for 2.0 h at the constant test temperature and pressure to make CO2 reach stabilization.
6) Open valve 3 to measure the pressure of the diffusion cell with the pressure transducer. Then, open valves 1 and 4 to connect the intermediate container full of high pressure CO2 with the diffusion cell. After the pressure of the diffusion cell reaches a relative stable value within 1–2 min, close valves 1 and 4 quickly. Record the pressure data of the pressure transducer.
7) When the pressure of the diffusion cell no longer changes, the experiment can be stopped. Open all the valves of the diffusion cell slowly, discharge the remained CO2, take out the used core sample, and clean the equipment.
In this paper, two base numerical models are established. Model A is a 2-D laboratory-scale model with a cylindrical (radial-angular) grid type used to determine the CO2 effective diffusion coefficient by historymatching the pressure decay curve of the diffusion experiments. Model B is a 2-D field-scale model used to investigate the distribution of CO2 in the fractured shale oil reservoir after CO2-fracturing during the process of shut-in, flow back and oil production.
The commercial reservoir simulator GEM™ from CMG is used to construct numerical models in this study. The model A is represented by two regions with distinct properties. We refer the void space of the diffusion cell excluding the core as Region 1, and the core sample as Region 2. Although the height of the diffusion cell is not equal to the length of the core, according to the assumption that only Radial diffusion happens the RCVD experiment, we scale the height of the diffusion cell to be consistent with the length of the core in the model, keeping the void space volume constant.
A series of grids are set in the radial direction to capture the process of CO2 diffusion, butonly one grid is set in both the axial direction and the circumferential direction (Figure 2), as the effect of gravity is ignored and the diffusion process is hypothetically symmetric in the circumferential direction. In addition, a thin layer (0.1 mm) is set at the interface between Region 1 and Region 2; it acts as a contact zone connecting the oil and gas phase to capture the diffusion transfer mechanism (Tsau and Barati, 2018). Therefore, the number of grids in model A is 25 × 1×1 = 25, which are found to be sufficient to eliminate numerical effects.
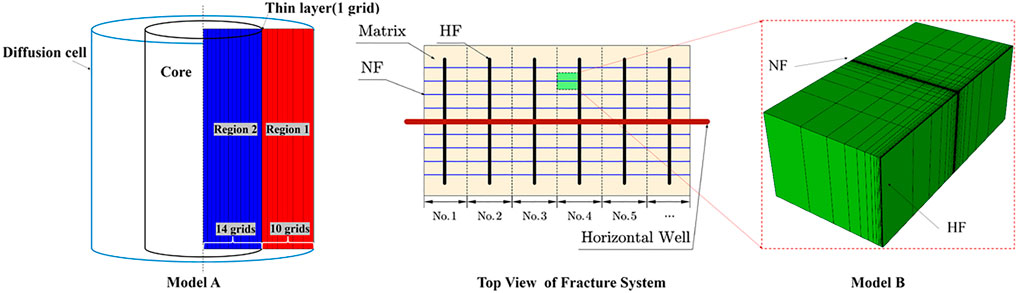
FIGURE 2. Grid settings of model (A) and model (B).
Model B as a 2-D field-scale model includes three systems: matrix (M), hydraulic fracture (HF), and natural fracture (NF) drawing on (Zhang et al., 2017)’ study (see Figure 2). It is assumed that the fracture system after fracturing is composed of HFs and NFs, where HFs are evenly distributed in the horizontal well and symmetrically distributed on both sides of the horizontal well. NFs are orthogonal to HFs with the same spacing and length. Only a segment of SRV region is simulated and then the results can be scaled back to the full lateral. In addition, the method of fracture permeability stress sensitivity is also used for approximately simulating the process of fracturing, which needs injecting a large amount of CO2 into the formation in a short time (Zhang et al., 2017).
The scale of grid system is 16 × 31×1 cells with 0.008 m width of HFs and 0.004 m width of NFs. Due to the drastically pressure and saturation changing in the regions near the fracture face, the size of grids increases logarithmically along planes of HFs and NFs to the reservoir matrix perpendicularly. The fracture width of HFs and NFs in this model is wider than reality to ensure numerical stability however still honors real dimensionless fracture conductivities. In other words, to be consistent with the real fracture conductivity, any widening of the fracture width in the model is compensated for by reduced fracture permeability.
Advective flow and molecular diffusion are considered in this study. Advection is a transport mechanism that is based on pressure and gravity gradients. Gravity drainage is ignored in this study because it is a minor force in a liquid-rich shale reservoirs with low permeable matrix (Alharthy et al., 2015). The contribution from the pressure gradient can be through changes of pressure during fracturing and producion stages and also as a result of oil swelling. The oil swelling during CO2 exposure causes reduction in hydrocarbon density, viscosity and interfacial tension. This in turn promotes CO2-hydrocarbon interaction, miscibility, and oil mobility. Molecular diffusion mass transport is driven by chemical potential gradient of the molecular species and is rather slow as an oil recovery mechanism; however, miscibility of CO2 and oil in a narrow region near the fracture-matrix surface interface is the main mechanism of oil extraction from the tight oil matrix. Thus, in this short distance, the role of molecular diffusion cannot be ignored.
Parameters of core properties and fluid properties inputted in the laboratory-scale model (Model A) remain consistent with the diffusion experiments. According to (Tsau and Barati, 2018)’s research, the value of entry capillary pressure (Pe) is set to 0.69 kPa, the purpose of which is to keep the oil phase (wetting phase) held in the center of core cell.
The parameters of reservoir properties (Table 3) and fluid properties (Table 2) inputted in the field-scale model is from shale oil formation in the Ordos Basin, China. The target reservoir has low pressure and temperature, in which the crude oil is undersaturated, of low gas-oil ratio and of low viscosity. Considering that the solubility of CO2 in oil phase is far greater than that in the water phase, the reaction between formation water and CO2 is ignored this simulation. The parameters of the fracture system used in model B is from the research of (Zhang et al., 2017).
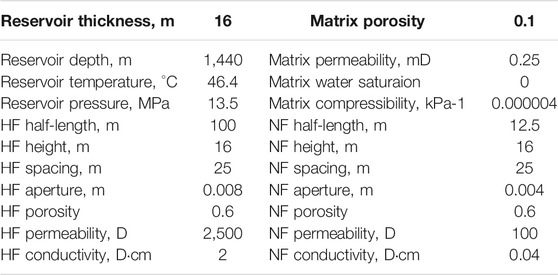
TABLE 3. Grid properties for model B.
To simulating the process of fracturing, 28.8 m3 of supercritical CO2 (46.4°C, 13 MPa) is designed to be injected into model B within 1 h, equivalent to 230.4 m3 of supercritical CO2 fracturing fluid to create a SRV region of 25 m width in the formation of 16 m height.
Considering that in the process of fracturing fluid injection, the fractures with high conductivity will only form when the fluid pressure is greater than the breakdown pressure of the formation, while matrix permeability will increase, stress-dependent permeability of fracture grids is necessary. The following exponential empirical formula Eq. 1 can be used to describe the permeability changing with the pressure.
Where K is current permeability, mD; K0 is original permeability, mD; m is the permeability changing factor (exponent determined empirically), kPa−1; Pnet is net pressure (difference between original reservoir pressure and current gird cell pressure), kPa. The values of permeability changing factor m during the injection process are 0.197, 0.0943, and 0.116, respectively, and the production process are 0.197, 0.0276, and 0.131, respectively (Zhang et al., 2017). The result can be seen in the Figure 3.

FIGURE 3. Stress-dependent permeability during injection and production stage.
Considering the interaction between CO2 and crude oil, compositional modeling is needed. The component compositions of kerosene used in model A and crude oil used in Model B are measured in the laboratory; the component critical properties (Table 4, 5) are correctted by fitting a series of PVT experiments (such as CCEs, Swelling Tests) based on PR-EOS. For the crude oil components of the reservoir, proper combination of components is carried out to improve the calculation efficiency. The jobs of compositional modeling mentioned above are completed by the equation of state multiphase equilibrium property simulator Winprop™ from CMG.
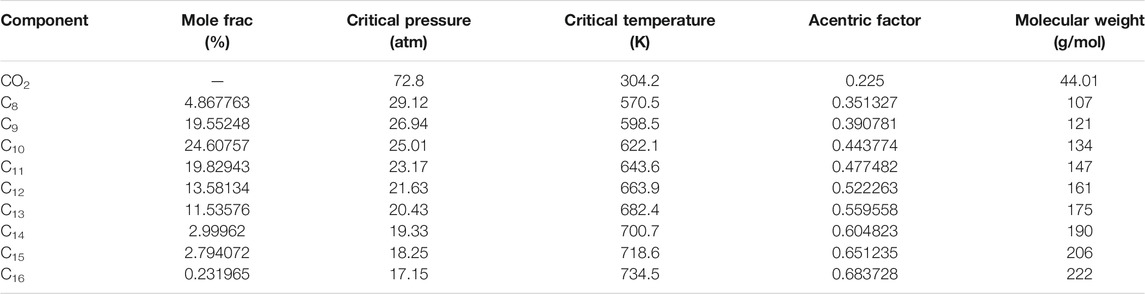
TABLE 4. Composition and properties of experimental oil components.
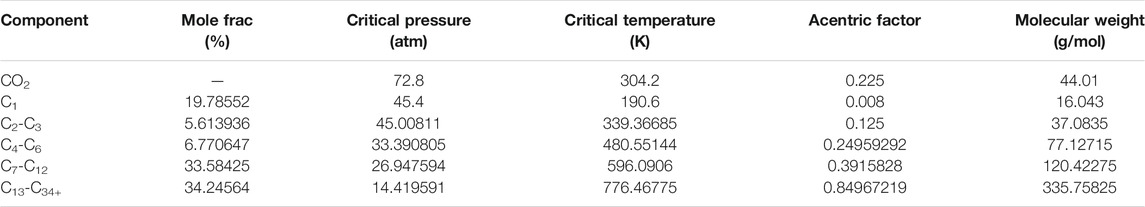
TABLE 5. Composition and properties of live oil pseudo-component.
For multicomponent mixtures, fick classical model assumes that diffusion of each component is independent of other components and diffusion flux is proportional to the component concentration gradient, and the physical quantity that characterizes the molecular diffusion ability of a substance is called the molecular diffusion coefficient. The effective diffusion coefficient mentioned in this paper is used to describe total dispersion phenomenon caused by diffusion, local velocity gradients, locally heterogeneous streamline lengths, and mechanical mixing (Lake, 1989). Dispersion phenomenon is a kind of strengthening effect on molecular diffusion caused by fluid flowing due to uneven velocity, which is called mechanical dispersion. It is impossible to separate mechanical dispersion from molecular diffusion in the diffusion experiment. Therefore, the diffusion coefficient obtained by the experiment is called the effective diffusion coefficient rather than the molecular diffusion coefficient to some extent.
The effective diffusion coefficient is related to the porous medium, temperature and pressure, and also the concentration at its location, which means that the effective diffusion coefficient changes at any time. For all that, we can still use a constant coefficient to characterize the diffusion process. Similar to fick’s law of diffusion, that dispersion of each component is proportional to the component concentration gradient is assumed. The dispersion flux
Where,
Due to the lack of experimental data support, The sigmund method is used to determinate the molecular diffusion coefficient of crude oil components in oil and gas phase (da Silva and Belery, 1989). In other words, mechanical dispersion was not considered for the crude oil components. Moreover, the CO2 effective diffusion coefficient in the gas phase is also calculated. In short, only the CO2 effective diffusion coefficient in oil phase is used as the target of fitting the experimental data.
In the early stage of diffusion, the pressure drop process is unstable due to the fast diffusion rate (Li et al., 2018a). Therefore, fitting the full curve of the experiment data does not yield perfect matching results. The stage of stable diffusion, whose pressure drop is proportional to t1/2 explained by the analytical solution (Li et al., 2016), is selected as the target of numerical simulation fitting. Average absolute relative deviation (AARD) is used to check the fitness between experimental and simulated pressure curves with data recorded every five minutes:
Where Pexp is the experiment pressure and Psim is the simulated pressure, and N is the number of data points.
Figures 4A,B presents linear fitting result of pressure drop and t1/2 for the two diffusion experiments respectively. For test 1, the pressure drop data after 65 min is used for history matching, and for test 2, 145 min.
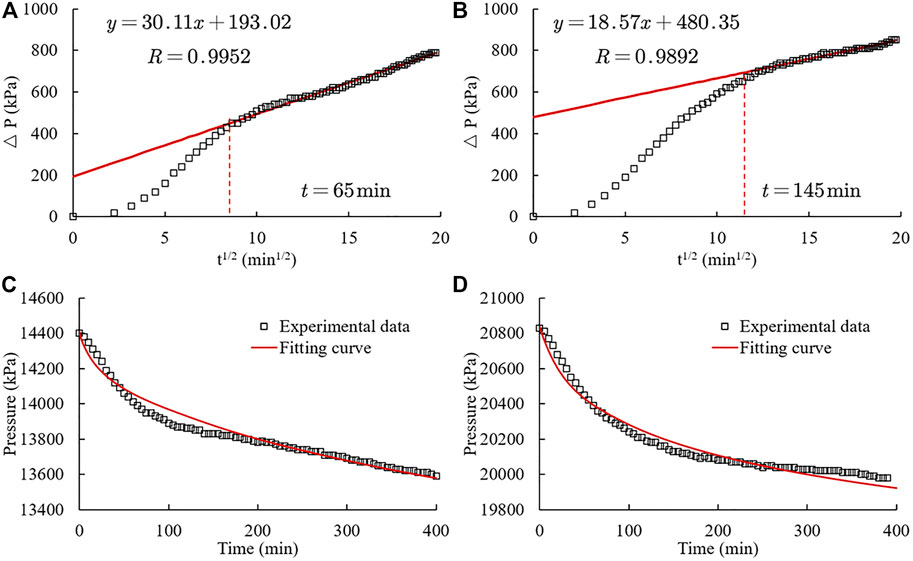
FIGURE 4. Linear fitting result of pressure drop and t1/2 of Test 1 (A) and Test 2 (B); Best history fitting curves of Test 1 (C) and Test 2 (D).
Figures 4C,D presents the best history fitting curves of Test 1 and Test 2, and the fitting results show that the effective CO2 diffusion coefficients are 8.105 × 10⁻⁶ cm2/s and 3.138 × 10⁻⁵ cm2/s, respectively.
Figure 5 shows the average absolute relative deviation (AARD) of historymatching for different values of CO2 effective diffusion coefficient. The AARDs of the best-fitting values are 0.56 and 0.39%, respectively.
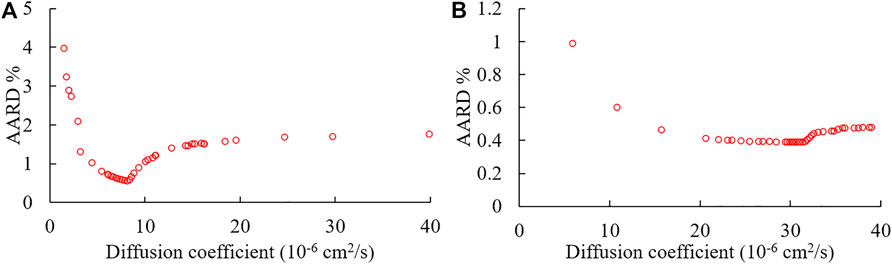
FIGURE 5. Estimation of diffusion coefficients of Test 1 (A) and Test 2 (B).
The CO2 effective diffusion coefficient fitting from test 1 is less than that of test 2. This result reflects that higher pressure facilitate the diffusion of CO2 into crude oil, under tight formation conditions. Also, it is noticed that although there is an optimal fitting result, the average standard deviation of experimental and simulated data is less than 5% with the value of CO2 effective diffusion coefficient ranging from 1 × 10⁻⁶ cm2/s to 4 × 10⁻⁵ cm2/s. Generally, field-scale numerical simulations with historical fitting errors less than 5% are accepted. This shows that for the field-scale model (model B), the selection of the CO2 effective diffusion coefficient can be appropriately adjusted within a certain range. As a result, in model B, as a field-scale mechanism model, a typical value of 10–5 cm2/s is selected for the CO2 effective diffusion coefficient.
During the shut-in process after the fracturing process is completed, CO2 will continue to penetrate into the matrix along the fracture system. During the flow back and production stage, part of CO2 is prodcucted with the crude oil, and some of CO2 may still be dissolved in the crude oil left in the formation. Therefore, we investigated the distribution of CO2 and the viscosity of crude oil during the long-term shut-in stage and during production stage after shutting in for a period of time, individually.
Figures 6A,B reports the concentration distribution of CO2 in from HF and NF surface to deeper matrix under different shut-in time, respectively. At the moment when the CO2 fracturing fluid injection is completed, the concentration of CO2 in the matrix within 0.1 m of the fracture has reached 0.8, which means that CO2 drives the crude oil to a deeper matrix in a short distance. As shown in Figure 6, with the increase of the shut-in period, the whole body of the curves move to the right direction. After shutting in for 6 months, the front edge of CO2 concentration where concentration is greater than to 1% reached a distance of 1 m from the fractures.
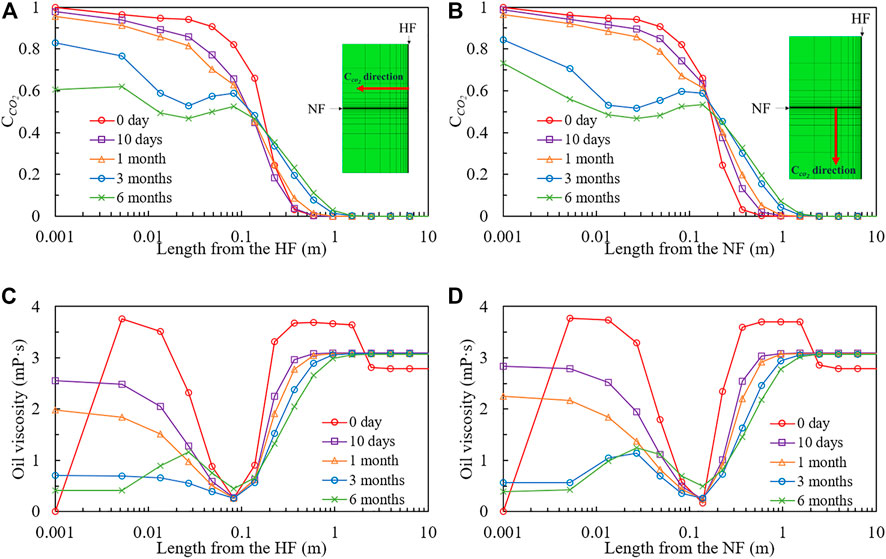
FIGURE 6. Mole concentration distribution of CO2 in from HF(A) and NF (B) and viscosity distribution of oil in from HF (C) and NF (D).
Figures 6C,D reports the viscosity distribution of oil in from the surface of HF and NF to deeper matrix under different shut-in time. As the fracturing fluid increases the formation pressure, the viscosity of the crude oil in the matrix after fracturing is generally higher than the original viscosity. It can still be observed that the viscosity of the crude oil is greatly reduced in the matrix within 1 m of the fracture, where the lowest viscosity of crude oil reaches 0.26 mPa·s (one-tenth of the original crude oil viscosity). It is noticed that the viscosity of crude oil does not always increase with the increase of distance. The abnormal phenomenon of viscosity increasing appears in the position between the position of the lowest crude oil viscosity and the fracture, which is caused by CO2 driving light components of crude oil deeper into matrix and leaving heavy components in this position. In the CO2-EOR process of conventional reservoirs, this process is called CO2 extraction. Long-term shut-in can eliminate the phenomenon of viscosity increase due to the redistribution of fluid components dominated by molecular diffusion mechanism.
Figure 7 reports the variation of average oil saturation and global CO2 concentration in fracture system in the injecting stage (Figure 7A) and shut-in stage (Figure 7B).
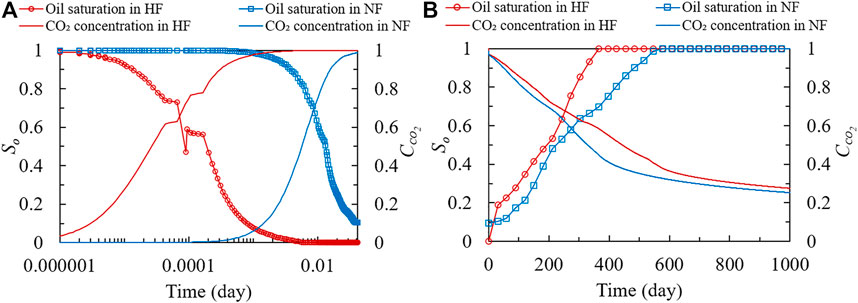
FIGURE 7. Variations of average oil saturation and global CO2 mole concentration in fracture system with the time of injecting stage (A) and shut-in stage (B).
During the 1-h injecting process, the fracture system was quickly filled with CO2, and rate of CO2 filling the NF was slightly slower than that of HF. At the end of fracturing, the HF contains the gas phase only constituted of CO2, while 10% oil phase exists in NF. This oil phase in NF is composed of a small amount of heavy components and a large amount of CO2, caused by the CO2 extraction mechanism mentioned above.
During the long-term shut-in stage, the components of the crude oil return to the fracture system through advective flow and molecular diffusion, which is a long process. 360 and 546 days are the time when HF and NF are completely filled with oil phase, respectively. It is noted that the oil phase returning into the fracture system is dissolved with CO2 with the molar concentration greater than 0.2. This part of the crude oil has better fluidity due to the viscosity reduction effect of CO2.
To investigate the production performance after CO2 fracturing, a basic production model was designed, in which the well is shut in for 10 days, and then producted at the bottom hole pressure of 5 MPa.
Figures 8A,B reports the concentration distribution of CO2 in from HF and NF surface to deeper matrix under different production time, respectively. It is noted that the front edge of the CO2 concentration continues to advance to the deeper matrix during production stage, for example, the front edge is located at a distance of about 3 m from the fracture system to matrix after 1,000 days of production. this phenomenon can be explained by the following two reasons: First, the existence of a concentration gradient provides a continuous driving force for the diffusion of CO2; besides, the crude oil in the deep matrix is gradually migrated into the fractures and is recovered from the formation along the fracture system, which increases the concentration gradient of CO2 and promotes the diffusion mechanism. In addition, it is also found that the concentration of CO2 seems to be higher in the matrix near NF than near HF. This is because the conductivity of NF is less than that of HF, and the crude oil recovery and CO2 recovery efficiency in the matrix near NF is lower than that near NF, making the apparent CO2 concentration higher.
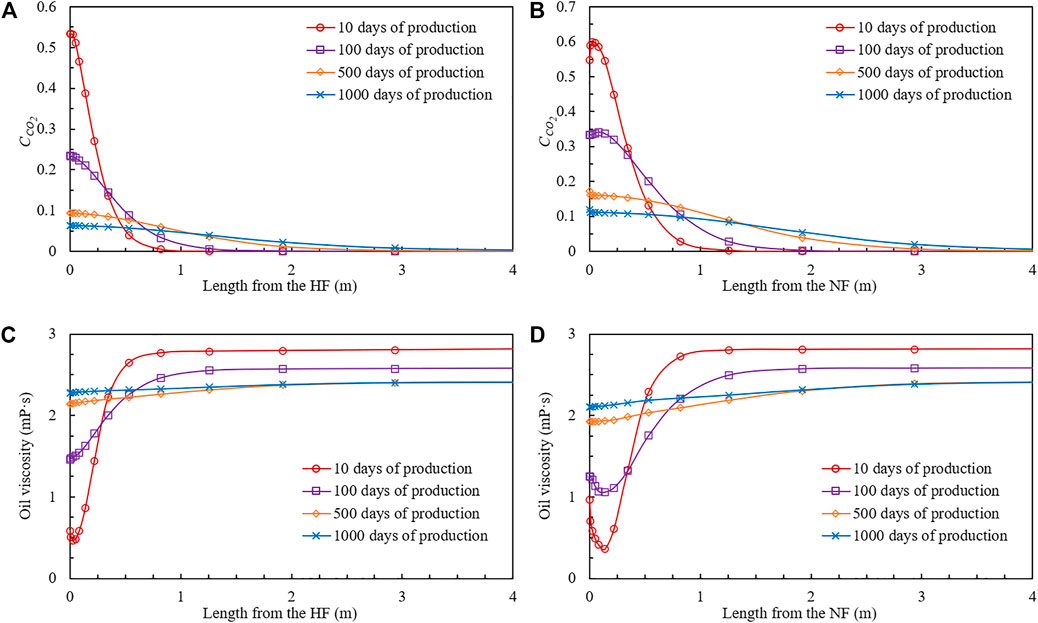
FIGURE 8. Mole concentration distribution of CO2 in from HF(A) and NF(B)and viscosity distribution of oil in from HF (C) and NF (D).
Figures 8C,D reports the viscosity distribution of oil in from HF (a) and NF (b) surface to deeper matrix under different production time. As the crude oil that has dissolved CO2 is recovered from the reservoir, the viscosity-reducing effect of CO2 on the remaining crude oil gradually weakens. Also due to the difference in the conductivity of HF and NF, CO2 seems to have a stronger viscosity-reducing effect in the matrix near NF, where, in fact, the oil recovery is lower.
Through the analysis of the CO2 concentration distribution in the shut-in stage, we believe that the increase of shut-in time will facilitate CO2 entering deeper matrix and thereby further exerting its EOR mechanism. In order to investigate the impact of shut-in time on production performance, based on the basic production model, a series of simulations is carried out at different shut-in times.
Figure 9 reports the production performance and CO2 recovery efficiency at different shut-in times. Figure 9 visually shows that the increase in shut-in time helps to improve the oil recovery. The decrease of CO2 recovery efficiency (Figure 9) also reflects that more CO2 keeped in the formation is beneficial to oil recovery. Moreover, it is found that the increase of shut-in time makes the produced oil lighter through the calculation of the average molar mass of produced oil components (including produced oil and gas). In other words, the residual oil becomes heavier because more heavy components remain in the reservoir. For the target reservoirs saturated with low-viscosity oil, this phenomenon has no effect. However, for high-viscosity oil reservoirs rich in heavy components, a large amount of crude oil may not be recovered as a result.
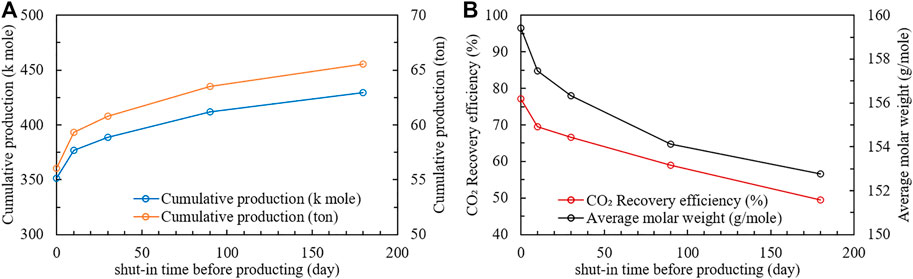
FIGURE 9. Cumulative production (A), average molar mass of oil producted and CO2 recovery efficiency (B) at different shut-in times before producting.
Theoretically, unlimited shut-in time is the best choice to increase oil recovery for this reservoir in this study. However, due to the pursuit of economic value, short shut-in time is a popular choice. Therefore, according to the production curve in Figure 9, we tend to shut in the well for 10 days because the relative increase of production is the largest at this time.
In this paper, a radial constant volume diffusion (RCVD) experiment on kerosene saturated shale cores was designed, and the CO2 effective diffusion coefficient is determined through historymatching the experimental pressure drop curve with simulated data based a lab-scale numerical model constructed by using the commercial simulator. The advancement of the process of determining the CO2 effective diffusion coefficient is that it takes into account the molecular diffusion of the oil components, and it selects the stable diffusion stage as the target of historymatching, based on the conclusion of a typical analytical solution (pressure drop is proportional to t1/2).
In this paper, based on the typical data of fractured shale oil reservoir, the field-scale numerical simulation model of shut-in and production stages after CO2 fracuting is established by using the commercial simulator. The distribution of CO2 in fractured shale oil formation and its impact on crude oil during shut-in stage and flow back stage are investigated. The novelties of this model is that: 1) a series of certain grids were used to explicitly characterize fracture instead of a dual-porosity model to capture the exchange of CO2 between the matrix and the fracture system. 2) through the logarithmic distribution grid of the matrix near the fracture, the diffusion mechanism of CO2 is described and the true mass transfer distance of CO2 is obtained. 3) the process of injecting huge amount of CO2 into formation within a short time during fracturing operation is described by taking into account stress-dependent permeability. 4) through compositional modeling, the interaction between CO2 and crude oil is described.
This paper provides some explanation for the difference of the CO2 EOR mechanism in field-scale and that in lab by comparing the lab-scale model and the field-scale model. When measuring the diffusion coefficient experimentally, the volume of CO2 is in the same order of magnitude as the volume of crude oil or saturated crude oil porous media, and CO2 can achieve sufficient dissolution and diffusion. Until the pressure balances, there is still a large amount of single phase contained with CO2 only; however, in the formation, CO2 gradually diffuses into the matrix along the fracture system, which volume is very small relative to the matrix, that is, the initial volume of CO2 is limited in field-scale. Moreover, whether it is a full-diameter core or a small core column (2.5 cm or 3.8 cm in diameter) in lab, the scale of core samples remains at the centimeter level, which is still too small relative to the scale of the reservoir in meters. The distance that CO2 enters the matrix through diffusion mechanism is relatively short in lab, causing the entire core easily swept by CO2. That is, the actual mass transfer distance of CO2 in the reservoir cannot be captured in the lab.
The CO2 mass transfer distance obtained in this paper is basically agreed with previous reports. However, this paper further distinguishes the different performance of CO2 in the shut-in stage and the production stage, which provide a better understanding of CO2 EOR mechanism in fractured shale oil reservoirs. CO2-EOR performance during shut-in stage exhibits the characteristics of short effect distance and high viscosity-reducting effect. These characteristics indicate that, the CO2 diffusion mechanism has limited effect, although it is more important in shale oil reservoir than in conventional reservoir. At the same time, in this limited range, the viscosity reducting effect of CO2 on crude oil is very encouraging, mainly due to the undersaturation of the target crude oil. It is believed that the high solubility of CO2 in undersaturated oil reservoirs promote the EOR effect of CO2. During production stage, although more than half of the injected CO2 will flow back to the surface, the remained CO2 still plays a positive role in the reservoir. The viscosity of crude oil in the matrix within 1 m near the fracture system is still relatively low.
The relationship between shut-in time after fracturing operation and production performance is still controversial as the phenomenon of fracturing fluid imbibition is a mixed blessing. However, if the water-based fracturing fluid is replaced with CO2 fracturing fluid, that production increases as the shut-in time prolongs seems to be an inevitable conclusion. In this research, we got the conclusion that the increase of shut-in time helps to improve the oil recovery. At the same time, we also found that the increase of shut-in time makes the produced oil lighter. Although an unlimited shut-in time as the best choice to increase oil recovery is not realistic. This conclusion also provides a reference for the evaluation of the shut-in time and flowback measure after CO2 fracturing.
The interaction characteristics of CO2 and different crude oils are different. For saturated oil, it is difficult for CO2 to dissolve into crude oil, and the extraction effect of CO2 may become more obvious. In addition, during the production stage, the pressure drop may cause CO2 to separate from the crude oil in the formation. In this process, CO2 may extract the light components of the crude oil, resulting in an increase in the viscosity of the residual oil, which may be a negative effect. Therefore, in future study, we need to understand the applicability of CO2 in different unconventional reservoirs further. In addition, this work did not take into account the reaction of CO2 with formation water and rocks as a regret, which is also a key direction that needs to be tackled in the future.
The main conclusions are obtained in this study:
1) the effective CO2 diffusion coefficients are 8.105 × 10⁻⁶ cm2/s and 3.138 × 10⁻⁵ cm2/s.
2) During fracturing operation, CO2 drives the crude oil in a short distance of less than 0.1 m to a deeper matrix.
3) During shut-in stage, the range of CO2 entering the matrix around fractures is less than 1 m, where the viscosity of the crude oil is greatly reduced (the lowest viscosity of crude oil reaches 0.26 mPa·s). The crude oil gradually return to the fracture system through advective flow and molecular diffusion. 360 and 546 days are the time when HF and NF are completely filled with oil phase, respectively.
4) During production stage, more than half of the injected CO2 will flow back to the surface. CO2 left in the formation continues to maintain the advantage of improving the fluidity of oil in matrix. the front edge of the CO2 concentration keeping moving forward is located at a distance of about 3 m from the fracture system to matrix after 1,000 days of production.
5) The increase in shut-in time helps to improve the oil recovery and makes the produced oil lighter. Due to the pursuit of economic value and high-yield shut-in time, 10 days is the optimal shut-in time.
The raw data supporting the conclusion of this article will be made available by the authors, without undue reservation.
RQ conducted experiments, numerical simulations and drafts. SZ and FW conducted experimental guidance, theoretical guidance and inspection of the first draft. FL, HW, and TZ provided samples and reservoir data needed for the experiment, assisted in completing the experiment, and conducted numerical simulation guidance.
The authors would like to acknowledge the National Natural Science Foundation of China (No. 51974332) for the financial support.
Authors FL, HW and TZ were employed by the company SINOPEC.
The remaining authors declare that the research was conducted in the absence of any commercial or financial relationships that could be construed as a potential conflict of interest.
All claims expressed in this article are solely those of the authors and do not necessarily represent those of their affiliated organizations, or those of the publisher, the editors and the reviewers. Any product that may be evaluated in this article, or claim that may be made by its manufacturer, is not guaranteed or endorsed by the publisher.
Alfarge, D., Wei, M., and Bai, B. (2018). CO2-EOR Mechanisms in Huff-N-Puff Operations in Shale Oil Reservoirs Based on History Matching Results. Fuel 226, 112–120. doi:10.1016/j.fuel.2018.04.012
Alharthy, N., Teklu, T., Kazemi, H., Graves, R., Hawthorne, S., Braunberger, J., et al. (2015). Enhanced Oil Recovery in Liquid-Rich Shale Reservoirs: Laboratory to Field. SPE 29, 15–16. doi:10.2118/175034-ms
Amir, F., and Apostolos, K. (2019). Determining Diffusivity, Solubility, and Swelling in Gaseous Solvent–Heavy Oil Systems. Ind. Eng. Chem. Res. 58, 10031–10043. doi:10.1021/acs.iecr.9b01510
da Silva, F. V., and Belery, P. (1989). Molecular Diffusion in Naturally Fractured Reservoirs: A Decisive Recovery Mechanism. Society of Petroleum Engineers.
Fischer, S., Liebscher, A., and Wandrey, M. (2010). CO2-brine-rock Interaction - First Results of Long-Term Exposure Experiments at In Situ P-T Conditions of the Ketzin CO2 Reservoir. Geochemistry 70, 155–164. doi:10.1016/j.chemer.2010.06.001
Ghasemi, M., Astutik, W., Alavian, S. A., Whitson, C. H., Sigalas, L., Olsen, D., et al. (2017). Determining Diffusion Coefficients for Carbon Dioxide Injection in Oil-Saturated Chalk by Use of a Constant-Volume-Diffusion Method. SPE J. 22, 505–520. doi:10.2118/179550-pa
Ghasemi, M., Astutik, W., Alavian, S. A., Whitson, C. H., Sigalas, L., Olsen, D., et al. (2016). “Determining Diffusion Coefficients for CO2 Injection in Oil Saturated Chalk Using a Constant Volume Diffusion Method,” in SPE Improved Oil Recovery Conference, May 30–June 2, 2016 (Tulsa, Oklahoma, USA: Society of Petroleum Engineers). doi:10.2118/179550-ms
Ghasemi, M., Astutik, W., Alavian, S., Whitson, C. H., Sigalas, L., Olsen, D., et al. (2018). Experimental and Numerical Investigation of tertiary-CO2 Flooding in a Fractured Chalk Reservoir. J. Pet. Sci. Eng. 164, 485–500. doi:10.1016/j.petrol.2018.01.058
Ghasemi, M., and Suicmez, V. S. (2019). Upscaling of CO2 Injection in a Fractured Oil Reservoir. J. Nat. Gas Sci. Eng. 63, 70–84. doi:10.1016/j.jngse.2019.01.009
Habibi, A., Yassin, M. R., Dehghanpour, H., and Bryan, D. (2017a). “CO2-Oil Interactions in Tight Rocks: An Experimental Study,” in SPE Unconventional Resources Conference, February 15–16, 2017 (Calgary, Alberta: Canada: Society of Petroleum Engineers). doi:10.2118/185047-ms
Habibi, A., Yassin, M. R., Dehghanpour, H., and Bryan, D. (2017b). Experimental Investigation of CO2-oil Interactions in Tight Rocks: A Montney Case Study. Fuel 203, 853–867. doi:10.1016/j.fuel.2017.04.077
Hawthorne, S. B., Gorecki, C. D., Sorensen, J. A., Miller, D. J., Harju, J. A., and Melzer, L. S. (2014). Hydrocarbon Mobilization Mechanisms Using CO2 in an Unconventional Oil Play. Energ. Proced. 63, 7717–7723. doi:10.1016/j.egypro.2014.11.805
Hawthorne, S. B., Gorecki, C. D., Sorensen, J. A., Steadman, E. N., Harju, J. A., and Melzer, S. (2013). “Hydrocarbon Mobilization Mechanisms from Upper, Middle, and Lower Bakken Reservoir Rocks Exposed to CO,” in SPE Unconventional Resources Conference Canada, November 5–7, 2013 (Calgary, Alberta: Canada: Society of Petroleum Engineers).
He, Y., Yang, Z., Jiang, Y., Li, X., Zhang, Y., and Song, R. (2020). A Full Three‐dimensional Fracture Propagation Model for Supercritical Carbon Dioxide Fracturing. Energy Sci Eng 8, 2894–2906. doi:10.1002/ese3.709
Hoteit, H. (2011). “Proper Modeling of Diffusion in Fractured Reservoirs,” in SPE Reservoir Simulation Symposium, February 21–23, 2011 (The Woodlands, Texas, USA: Society of Petroleum Engineers). doi:10.2118/141937-ms
Jin, F., Shunyuan, Z., Bingshan, L., Chen, C., and Kedi, M. (2017). “Green Fracturing Technology of Shale Gas: LPG Waterless Fracturing Technology and its Feasibility in China,” in SPE Latin America and Caribbean Petroleum Engineering Conference, May 18–19, 2017 (Buenos Aires, Argentina: Society of Petroleum Engineers). doi:10.2118/185500-ms
Kanfar, M. S., and Clarkson, C. R. (2017). “Factors Affecting Huff-N-Puff Efficiency in Hydraulically-Fractured Tight Reservoirs,” in SPE Unconventional Resources Conference, February 15–16, 2017 (Calgary, Alberta: Canada: Society of Petroleum Engineers). doi:10.2118/185062-ms
Li, S., Li, Z., and Dong, Q. (2016). Diffusion Coefficients of Supercritical CO 2 in Oil-Saturated Cores under Low Permeability Reservoir Conditions. J. CO2 Utilization 14, 47–60. doi:10.1016/j.jcou.2016.02.002
Li, S., Qiao, C., Zhang, C., and Li, Z. (2018a). Determination of Diffusion Coefficients of Supercritical CO2 under Tight Oil Reservoir Conditions with Pressure-Decay Method. J. CO2 Utilization 24, 430–443. doi:10.1016/j.jcou.2018.02.002
Li, S., and Zhang, D. (2019). How Effective Is Carbon Dioxide as an Alternative Fracturing Fluid? SPE J. 24, 857–876. doi:10.2118/194198-pa
Li, S., Zhang, S., Ma, X., Zou, Y., Li, N., Chen, M., et al. (2019). Hydraulic Fractures Induced by Water-/Carbon Dioxide-Based Fluids in Tight Sandstones. Rock Mech. Rock Eng. 52, 3323–3340. doi:10.1007/s00603-019-01777-w
Li, S., Zhang, S., Ma, X., Zou, Y., Li, N., Wu, S., et al. (2020a). Coupled Physical-Chemical Effects of CO2 on Rock Properties and Breakdown during Intermittent CO2-Hybrid Fracturing. Rock Mech. Rock Eng. 53, 1665–1683. doi:10.1007/s00603-019-02000-6
Li, S., Zhang, S., Zou, Y., Zhang, X., Ma, X., Wu, S., et al. (2020b). Experimental Study on the Feasibility of Supercritical CO2-gel Fracturing for Stimulating Shale Oil Reservoirs. Eng. Fracture Mech. 238, 5–11. doi:10.1016/j.engfracmech.2020.107276
Li, X., Li, G., Yu, W., Wang, H., Sepehrnoori, K., Chen, Z., et al. (2018b). Thermal Effects of Liquid/Supercritical Carbon Dioxide Arising from Fluid Expansion in Fracturing. Spe J. 23, 2026–2040. doi:10.2118/191357-pa
Li, Z., and Dong, M. (2009). Experimental Study of Carbon Dioxide Diffusion in Oil-Saturated Porous Media under Reservoir Conditions. Ind. Eng. Chem. Res. 48, 9307–9317. doi:10.1021/ie900145c
Liu, H., Wang, F., Zhang, J., Meng, S., and Duan, Y. (2014). Fracturing with Carbon Dioxide: Application Status and Development Trend. Pet. Exploration Dev. 41, 513–519. doi:10.1016/s1876-3804(14)60060-4
Lu, J., Sorensen James, A., Hawthorne Steven, B., Smith Steven, A., Bosshart Nicholas, W., Burton-Kelly Matthew, E., et al. (2016). “Improving Oil Transportability Using CO2 in the Bakken System – A Laboratory Investigation,” in SPE International Conference and Exhibition on Formation Damage Control, February 24–26, 2016 (Lafayette, Louisiana, USA: Society of Petroleum Engineers).
Meng, S., Liu, He., and Yang, Q. (2019). Exploration and Practice of Carbon Sequestration Realized by CO2 Waterless Fracturing. Energ. Proced. 158, 4586–4591. doi:10.1016/j.egypro.2019.01.750
Meng, S., Liu, H., Xu, J., Duan, Y., Yang, Q., and Yao, Z. (2016). “Optimisation and Performance Evaluation of Liquid CO2 Fracturing Fluid Formulation System,” in SPE Asia Pacific Oil & Gas Conference and Exhibition, October 25–27, 2016 (Perth, Australia: Society of Petroleum Engineers). doi:10.2118/182284-ms
Myers, T. (2012). Potential Contaminant Pathways from Hydraulically Fractured Shale to Aquifers. Groundwater 50, 872–882. doi:10.1111/j.1745-6584.2012.00933.x
Ribeiro, L. H., Li, H., and Bryant, J. E. (2015). “Use of a CO2-Hybrid Fracturing Design to Enhance Production from Unpropped Fracture Networks,” in SPE Hydraulic Fracturing Technology Conference., February 3–5, 2015
Santiago, C. J. S., and Kantzas, A. (2020). “On the Role of Molecular Diffusion in Modelling Enhanced Recovery in Unconventional Condensate Reservoirs,” in SPE Europec (Amsterdam, The Netherlands: Society of Petroleum Engineers). doi:10.2118/200596-ms
Song, Z., Song, Y., Li, Y., Bai, B., Song, K., and Hou, J. (2020). A Critical Review of CO2 Enhanced Oil Recovery in Tight Oil Reservoirs of North America and China. Fuel 276, 118006. doi:10.1016/j.fuel.2020.118006
Sorensen, J. A., Braunberger, J. R., Liu, G., Smith, S. A., Hawthorne, S. A., Steadman, E. N., et al. (2015). Characterization and Evaluation of the Bakken Petroleum System for CO2 Enhanced Oil Recovery. SPE 21, 2–3. doi:10.2118/167200-MS
Tian, S., Zhang, P., Sheng, M., Wang, T., Tang, J., and Xiao, L. (2020). Modification of Microscopic Properties of Shale by Carbonic Acid Treatment: Implications for CO2-Based Fracturing in Shale Formations. Energy Fuels 34, 3458–3466. doi:10.1021/acs.energyfuels.9b03772
Trivedi, J. J., and Babadagli, T. (2009). Experimental and Numerical Modeling of the Mass Transfer between Rock Matrix and Fracture. Chem. Eng. J. 146, 194–204. doi:10.1016/j.cej.2008.05.032
Tsau, J.-S., and Barati, R. (2018). “Measurement of CO2 Diffusion Coefficient in the Oil-Saturated Porous Media,” in Abu Dhabi International Petroleum Exhibition & Conference., November 12–15, 2018
Vengosh, A., Warner, N., Jackson, R., and Darrah, T. (2013). The Effects of Shale Gas Exploration and Hydraulic Fracturing on the Quality of Water Resources in the United States. Proced. Earth Planet. Sci. 7, 863–866. doi:10.1016/j.proeps.2013.03.213
Wang, H., Lun, Z., Lv, C., Lang, D., Pan, W., Luo, M., et al. (2016a). “Nuclear Magnetic Resonance Study on Mechanisms of Oil Mobilization in Tight Reservoir Exposed to CO2 in Pore Scale,” in SPE Improved Oil Recovery Conference, April 11–13, 2016 (Tulsa, Oklahoma, USA: Society of Petroleum Engineers).
Wang, L., Yao, B., Cha, M., Alqahtani, N. B., Patterson, T. W., Kneafsey, T. J., et al. (2016b). Waterless Fracturing Technologies for Unconventional Reservoirs-Opportunities for Liquid Nitrogen. J. Nat. Gas Sci. Eng. 35, 160–174. doi:10.1016/j.jngse.2016.08.052
Wei, B., Zhong, M., Gao, K., Li, X., Zhang, X., Cao, J., et al. (2020). Oil Recovery and Compositional Change of CO2 Huff-N-Puff and Continuous Injection Modes in a Variety of Dual-Permeability Tight Matrix-Fracture Models. Fuel 276, 117939. doi:10.1016/j.fuel.2020.117939
Yu, W., Lashgari, H. R., Wu, K., and Sepehrnoori, K. (2015). CO2 Injection for Enhanced Oil Recovery in Bakken Tight Oil Reservoirs. Fuel 159, 354–363. doi:10.1016/j.fuel.2015.06.092
Zhang, T., Li, X., Li, J., Feng, D., Li, P., Zhang, Z., et al. (2017). Numerical Investigation of the Well Shut-In and Fracture Uncertainty on Fluid-Loss and Production Performance in Gas-Shale Reservoirs. J. Nat. Gas Sci. Eng. 46, 421–435. doi:10.1016/j.jngse.2017.08.024
Zhang, X., Wei, B., Shang, J., Gao, K., Pu, W., Xu, X., et al. (2018). Alterations of Geochemical Properties of a Tight sandstone Reservoir Caused by Supercritical CO2-brine-rock Interactions in CO2-EOR and Geosequestration. J. CO2 Utilization 28, 408–418. doi:10.1016/j.jcou.2018.11.002
Zhang, Y., Hu, J., and Zhang, Q. (2019). Simulation Study of CO2 Huff-N-Puff in Tight Oil Reservoirs Considering Molecular Diffusion and Adsorption. Energies 12, 2136. doi:10.3390/en12112136
Zhao, X., Zhou, L., Pu, X., Jin, F., Han, W., Xiao, D., et al. (2018). Geological Characteristics of Shale Rock System and Shale Oil Exploration Breakthrough in a Lacustrine basin: A Case Study from the Paleogene 1st Sub-member of Kong 2 Member in Cangdong Sag, Bohai Bay Basin, China. Pet. Exploration Dev. 45, 377–388. doi:10.1016/s1876-3804(18)30043-0
Zhou, J., Liu, G., Jiang, Y., Xian, X., Liu, Q., Zhang, D., et al. (2016). Supercritical Carbon Dioxide Fracturing in Shale and the Coupled Effects on the Permeability of Fractured Shale: An Experimental Study. J. Nat. Gas Sci. Eng. 36, 369–377. doi:10.1016/j.jngse.2016.10.005
Zhou, J., Yang, K., Tian, S., Zhou, L., Xian, X., Jiang, Y., et al. (2020a). CO2-water-shale Interaction Induced Shale Microstructural Alteration. Fuel 263, 116642. doi:10.1016/j.fuel.2019.116642
Zhou, X., Jiang, Q., Yuan, Q., Zhang, L., Feng, J., Chu, B., et al. (2020b). Determining CO2 Diffusion Coefficient in Heavy Oil in Bulk Phase and in Porous media Using Experimental and Mathematical Modeling Methods. Fuel 263, 116205. doi:10.1016/j.fuel.2019.116205
Zhou, X., Yuan, Q., Zhang, Y., Wang, H., Zeng, F., and Zhang, L. (2019). Performance Evaluation of CO2 Flooding Process in Tight Oil Reservoir via Experimental and Numerical Simulation Studies. Fuel 236, 730–746. doi:10.1016/j.fuel.2018.09.035
Zou, C., Yang, Z., Cui, J., Zhu, R., Hou, L., Tao, S., et al. (2013). Formation Mechanism, Geological Characteristics and Development Strategy of Nonmarine Shale Oil in China. Pet. Exploration Dev. 40, 15–27. doi:10.1016/s1876-3804(13)60002-6
Zou, Y., Li, N., Ma, X., Zhang, S., and Li, S. (2018). Experimental Study on the Growth Behavior of Supercritical CO 2 -induced Fractures in a Layered Tight sandstone Formation. J. Nat. Gas Sci. Eng. 49, 145–156. doi:10.1016/j.jngse.2017.11.005
Keywords: fractured shale oil reservoirs, carbon dioxide, mass transfer, CO2-oil replacement, reservoir simulation
Citation: Qiao R, Li F, Zhang S, Wang H, Wang F and Zhou T (2022) CO2 Mass Transfer and Oil Replacement Capacity in Fractured Shale Oil Reservoirs: From Laboratory to Field. Front. Earth Sci. 9:794534. doi: 10.3389/feart.2021.794534
Received: 13 October 2021; Accepted: 24 November 2021;
Published: 03 January 2022.
Edited by:
Feng Yang, China University of Geosciences Wuhan, ChinaReviewed by:
Junjing Zhang, ConocoPhillips, United StatesCopyright © 2022 Qiao, Li, Zhang, Wang, Wang and Zhou. This is an open-access article distributed under the terms of the Creative Commons Attribution License (CC BY). The use, distribution or reproduction in other forums is permitted, provided the original author(s) and the copyright owner(s) are credited and that the original publication in this journal is cited, in accordance with accepted academic practice. No use, distribution or reproduction is permitted which does not comply with these terms.
*Correspondence: Fei Wang, d2FuZ2ZlaUBjdXAuZWR1LmNu
Disclaimer: All claims expressed in this article are solely those of the authors and do not necessarily represent those of their affiliated organizations, or those of the publisher, the editors and the reviewers. Any product that may be evaluated in this article or claim that may be made by its manufacturer is not guaranteed or endorsed by the publisher.
Research integrity at Frontiers
Learn more about the work of our research integrity team to safeguard the quality of each article we publish.