 Jiangtao Qiu
 Lingyun Ji2*
- 1Institute of Geology, China Earthquake Administration, Beijing, China
- 2The Second Monitoring and Application Center, China Earthquake Administration, Xi’an, China
The Tianshan orogenic belt has intense crustal deformation and shortening in the near north-south direction. We processed ascending and descending Sentinel-1A/B 1synthetic aperture radar (SAR) data to obtain the first line-of-sight deformation field over South Tianshan (75–78 E), and combined with GPS velocity data to construct the current three dimensions surface velocity fields with high quality and high spatial resolution. The results show that: 1) deformation is not evenly distributed in the study area. The convergence across the Tianshan ranges is approximately 15–24 mm/yr; the deformation gradient in the junction area between South Tianshan and Pamir is the largest, and adjusts ∼68% of the total convergence deformation. South Tianshan is relatively stable without sharp gradients, and ∼58% of the deformation is distributed in the intermontane faults and basin systems in the north of South Tianshan. 2) Thrust slip of faults, uplift of folds, and slippage of décollement jointly play important roles in accommodating regional strain. The Maidan fault, which is the boundary between South Tianshan and Tarim Basin, has strike-slip and thrust characteristics, and is the root fault of the slip partitioning system. Our results can provide effective kinematic boundary constraints for the study of Asian crustal movement models.
Introduction
The Tianshan orogenic belt (TSOB) is one of the most active regions in Eurasia. The long-range effect of the collision between the Indian plate and the Eurasian plate in the late Cenozoic led to the reactivation of the TSOB and the occurrence of intracontinental orogeny. At the same time, the TSOB expanded to the foreland basins on both sides, forming multiple rows of décollement- and fault-related fold belts in the basin-mountain boundary zone (Yin et al., 1998; Burchfiel et al., 1999; Deng et al., 2003). Global Positioning System (GPS) observations around longitude ∼76° show that the crustal shortening rate in the north-south direction across the Tianshan Mountains is at least ∼20 mm/yr (Wang et al., 2000; Yang S. et al., 2008; Zubovich et al., 2010). However, the distribution of deformation in the tectonics of the TSOB is controversial.
One point of view is that the basins on the north and south of the Tianshan Mountains are compressed into the mountain along the main root faults on both sides, causing the nappe structure at the basin-mountain junction to absorb most of the deformation in Tianshan (Yang S. et al., 2008; Wang and Shen, 2020). The intermountain basins in Tianshan also have significant tectonic deformation, therefore, the strain accumulation is distributed evenly throughout the Tianshan Mountains (Thompson et al., 2002; Zhang et al., 2003). In addition, certain researchers have shown that fold-thrust belts are the most intensely deformed areas in the TSOB (Abdrakhmatov et al., 1996; Zhang et al., 1996; Burbank et al., 1999), and the expansion and uplift of active folds play an important role in regulating regional strain in the southern Tianshan-Tarim collision zone (Bufe et al., 2017; Li et al., 2020). Therefore, in the study of tectonic deformation partitioning in this area, if only faults are considered and active folds are disregarded, the deformation of faults will be overestimated.
Interferometric synthetic aperture radar (InSAR) has yielded numerous results with respect to obtaining the deformation characteristics of fault zones (e.g., Jolivet et al., 2008; Wang and Wright, 2012; Daout et al., 2016; Liu et al., 2018; Wang et al., 2019; Ji et al., 2020). Unlike the station information observed by GPS, InSAR observes continuous area information, which can determine the fine variations in the shortening deformation of the Tianshan Mountains. This provides a new way of studying the fine deformation of the Tianshan orogenic belt. However, owing to the challenges in data processing, only a few studies have attempted to investigate the regional deformation field in the southern Tianshan-Tarim collision zone (He et al., 2015; Qiao et al., 2017). In this study, we focus on the central part of South Tianshan between longitudes 75°and 78° (Figure 1). We processed two ascending and descending Sentinel-1 tracks from Issyk-Kul Lake to the northwest of the Tarim Basin based on the time-series InSAR technology, thereby, yielding a line-of-sight (LOS) velocity map covering a 250 × 420 km region. Combining GPS data, a velocity decomposition of crustal movement with high spatial resolution in Tianshan was obtained, elucidating the present-day tectonic deformation partitioning across southern Tianshan. We further discussed the tectonic kinematics and strain distributions in the study area.
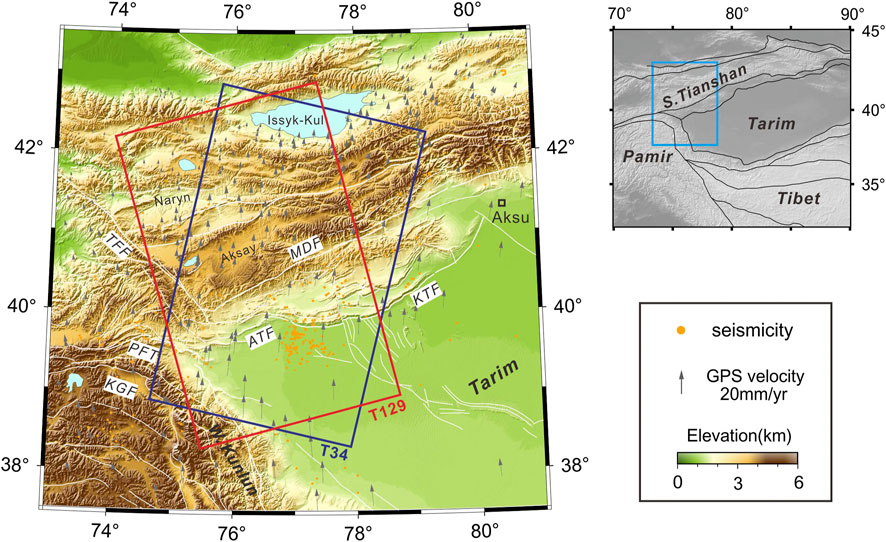
FIGURE 1. Topographic and tectonic map of the study area superimposed on Digital Elevation Model of the Shuttle Radar Topography Mission (SRTM DEM). Gray vectors represent the GPS velocities with respect to stable Eurasia plate (Wang and Shen, 2020). White lines represent fault traces from http://www.activefault-datacenter.cn. Orange dots are the locations of M > 4.5 earthquakes since 1992. Blue and red rectangles delimit the extents of Sentinel-1A/B radar imagery on ascending (129) and descending tracks (34). ATF: Atushi fault, MDF: Maidan fault, KTF: kepingtag fault, KGF: Kongur fault, PFT: Pamir front thrust, TFF: Taras-Fergana fault.
Geologic Setting
Owing to its intense crustal deformation and shortening in the near north-south direction, the TSOB is a natural experimental field for the study of intraplate deformation and continental dynamics. Numerous active faults and folds are developed in the Tianshan Mountains and in the basin-mountain junction zone, which are important components for adjusting the compressive strain and controlling the uplift of the Tianshan Mountains. Among them, the Pamir-South Tianshan-Tarim collision zone is the strongest uplift area of the TSOB (Figure 1).
The compression of the TSOB, Pamir Plateau, and Tarim Basin has resulted in the complex and unique structural features of the central part of South Tianshan. The fold-thrust belts in the front of South Tianshan are merged into the main décollement plane at the bottom of the sedimentary caprock in the deep, forming typical thin-skin structures (Zhang et al., 1996; Chen et al., 2001). The Keping nappe structure in the east of our study area is composed of rows of EW-trending reverse fault-anticline belts, which are fan-shaped. The main bodies of these anticlines are composed of Paleozoic strata, which are formed by the fault slope caused by the uplift of the décollement plane. The décollement of the Keping nappe structure is divided by the Piqiang fault, which plane exists at ∼9 km depth in the west, and at ∼5 km depth in the east. The nappe slopes gently to the north until it converges with the Maidan fault, which is the root of South Tianshan (Yin et al., 1998; Tian et al., 2006; Yang X. et al., 2008). In the southernmost front edge of the Keping nappe, the Kepintag fault is one of the most recent active faults, and many M ≥ 6 earthquakes have occurred on this fault.
In the west of our study area, deformation along the Main Pamir Thrust appears to have ceased for the most part (Chen et al., 2011) and moved northward, where it interferes with southern Tianshan, and the Cenozoic fold-thrust belt at the Kashi area is composed of three to four rows of anticlines. From north to south, the Muziduke anticline and the Tashipisake anticline are controlled by the north-dip thrust fault, whereas the western and eastern parts of the Atushi anticline are controlled by the north-dip thrust fault and the south-dip thrust fault, respectively, and the Kashi anticline is controlled by a south-dip thrust fault (Miao et al., 2007). In contrast to the Keping nappe structure, the Kashi fold-thrust belt has been active at a significantly later time and is currently more active, and most of the deformation occurs on the young fold anticlines (Chen et al., 2011). An M 81/4 earthquake occurred in the Toth Goubaz fault on the north side of the Atushi anticline in 1902 (Shen J. et al., 2001).
As the boundary fault between South Tianshan and Tarim basin, the root fault of the Kashi fold-thrust belt and the Keping nappe, the Maidan fault is nearly 400 km long. Starting from Aheqi to the east, the Maidan fault and the several surrounding peripheral faults together form a complex fault zone, with a maximum width of 17 km. Geological and seismic data have shown that thrust is the main activity of the fault at present (Chen et al., 2001; Gao et al., 2005). However, certain researches believe that apart from thrust movement, the Maidan fault has evident left-lateral strike-slip characteristics and is a large-scale left-lateral compression-torsion fault (Shen Z.-K. et al., 2001; Li et al., 2015; Wu et al., 2019).
InSAR Processing
We acquired Sentinel-1A/B data (ascending track: 129; descending track: 34) from the European Space Agency (ESA) between November 2014 and December 2019 covering a 420 km long and 250 km wide range of South Tianshan (Figure 1). We constructed 108 ascending interference pairs and 91 descending interference pairs based on commercial Gamma software (Wegnüller et al., 2016) and the permanent scatterer InSAR method (Supplementary Figures S1, S2 in the Supporting Information show all the epochs and baselines of the processed pairs). InSAR time series analysis was performed using the StaMPS package (Hooper et al., 2004; Hooper et al., 2007). The long-wavelength and elevation-dependent atmospheric errors from each interferogram are reduced using the TRAIN package (Bekaert et al., 2015) and GACOS data (Yu et al., 2018; Yu et al., 2020).
Decrease Decoherence
As InSAR measures one-dimensional areal displacements in the direction of radar line-of-sight (LOS), it is prone to shrinkage, overlap, and shadows in areas with high terrain gradients, leading to high decorrelation and a corresponding low coherence of deformation signals. The PSInSAR method was used to obtain the time series deformation of the study area and to limit the signal decoherence. Single look complex (SLC) images were computed from the raw radar data in a common mean Doppler geometry. After the SLC images were co-registered, the linear ramp within range was corrected to account for orbital errors and clock drift (Zhang et al., 2014; Daout et al., 2018). Interferograms are formed with one range look and one azimuth look to obtain finer differential interferograms. The finer the resolution, the fewer the scatterers contained within each resolution pixel, and the greater the chance that the pixel is dominated by one scatterer. This reduces the probability that the high-coherence pixel is averaged by the surrounding decorrelation noise, and the pixel is more easily recognized as a permanent scatter (PS) pixel. Subsequently, we used a robust power spectrum filter (Goldstein and Werner, 1998) to further reduce the phase noise thus improving the quality of the interferogram.
Finally, we used StaMPS to select and filter PS pixels. StaMPS selects PS candidates based on the spatial correlation of the interferogram phase, which does not rely on thresholding pixel amplitude dispersion over time and does not require prior knowledge of temporal variations in the deformation rate (Hooper et al., 2004; Hooper et al., 2007). Therefore, a certain number of PS pixels can be found in the low-amplitude area. We obtained 48,655,102 PS candidates for the ascending track (A129) and 44,340,642 PS candidates for the descending track (D34). The pixels that were mistakenly selected were removed based on phase analysis, and 316,079 PS for A129 and 318,066 PS for D34 were finally screened out, which completely covered the study area.
Atmospheric Delay Correction
Spatial and time variations in temperature, pressure, and relative humidity in the atmosphere caused a delay in the radar signal in the propagation path, and this delay information was finally integrated into the interferometric phase, which is known as the atmospheric delay error. The atmospheric delay can be split into hydrostatic and wet components. For C-band SAR data, the proportion of hydrostatic delay to the total delay can reach 15% in areas with significant relief and spatial variation areas (Jolivet et al., 2014), which can be attenuated by differential and stacking InSAR technology. In contrast with hydrostatic signals, the magnitude of wet delays, which are caused by the lateral variation in water vapor, is several times smaller (Hanssen, 2001), whereas the spatial pattern is significantly more variable and is not related to topography. Therefore, if the interferometric phase is in a flat or mountainous area, the wet delay may conceal the slight surface deformation information.
At present, there are two types of atmospheric delay estimation approaches (Bekaert et al., 2015; Shen et al., 2019). One entails correcting the atmosphere using external data, such as GPS data and atmospheric models (ERA5, WRF, etc.). The other entails empirically determining the phase/elevation relationship using the interferometric phase. Different approaches have different sensitivities to hydrostatic and wet delay components, and have unique advantages and disadvantages.
Here, to reduce the atmospheric delay effects of Sentinel-1 data covering South Tianshan, we use the toolbox for reducing atmospheric InSAR noise (TRAIN) to estimate the atmospheric delay maps using the Generic Atmospheric Correction Online Service (GACOS; Yu et al., 2018; Yu et al., 2020) product. The GACOS analysis product integrates the surface pressure, temperature, and humidity from the latest high-resolution European Center for Medium-Range Weather Forecasts (HRES-ECMWF), with a significantly higher spatial resolution (0.1°) and time resolution (6 h), which could be beneficial for describing smaller-scale variations in atmospheric delays. Both hydrostatic and wet delay components to the phase delay are taken into account in this approach. As shown in Supplementary Figures S3, S4, the atmospheric delay phase ranges of A129 and D34 are −13.9–18.3 rad and −16.3–19.1 rad, respectively, which shows that the atmospheric noise in the study area is severe.
Combine GPS and InSAR Velocity Data
Monitoring the intense N-S shortening in Tianshan is a significant challenge. Restricted by the polar-orbit flight and side-view imaging of SAR satellite, InSAR can only monitor the one-dimensional projection of surface deformation in LOS, and is insensitive to the north-south deformation. Therefore, InSAR LOS deformation is very likely to result in the misinterpretation of crustal movement in South Tianshan. Considering that GPS can provide high-precision crustal horizontal movement information, even reach the sub-millimeter level. However, its spatial resolution of the GPS network is very low, which can only provide the deformation of a few discrete points. The technical characteristics of InSAR and GPS are complementary; therefore, information on surface deformation in the study area can be developed by combining GPS velocities and InSAR LOS rate data.
After the InSAR LOS deformation field (Figure 2) was produced, we used the method developed by Shen and Liu (2020) to integrate GPS and InSAR data. The GPS data were obtained from the study performed by Wang and Shen (2020). They found that 28 CMONOC I (phase I of the Crustal Movement Observation Network of China) campaign sites located in the eastern TianShan region showed abnormal displacements before 2008, and speculated that the problem may be attributed to systematic biases caused by the use of different receiver/antenna units between surveys, particularly certain substandard antennas. Therefore, they removed the troublesome epochs of data in the derivation of the velocities for the affected sites. The uniformly distributed GPS sites in the study area can be used to perform remarkable horizontal calibration of the InSAR data of the two tracks (A129 and D34).
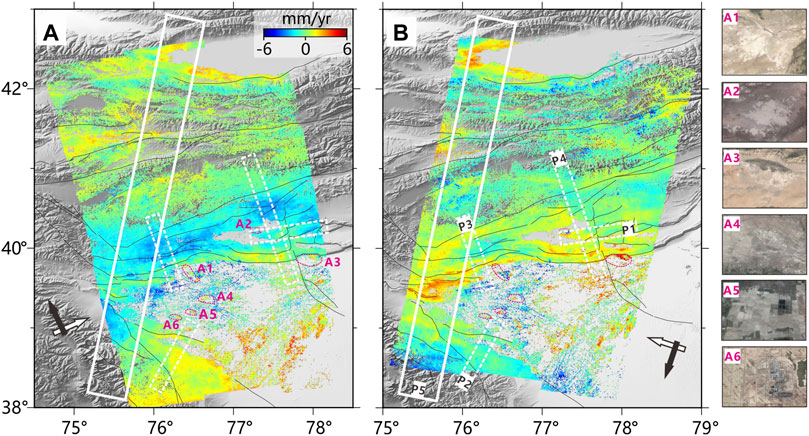
FIGURE 2. Line-of-sight (LOS) velocity map of the tracks 129 (A) and 34 (B).
We interpolated the discrete GPS data points to generate a 2-dimensional continuous velocity field on the grid covered by InSAR data. In the algorithm of Shen and Liu (2020), the GPS data and their interpolated values are needed in the estimate and remove offset/ramp of InSAR LOS measurements to stabilize the inversion at the first step. The offset and/or ramp were globally estimated for all the images to minimize data misfit, particularly in regions where the data overlap. To combine the interpolated GPS data with InSAR data, the GPS velocities uncertainties are estimated from the interpolation to be used as data weighting in the combination. The uniform smoothing method is adopted to ensure that the estimated uncertainty can consistently reflect the strength of the measured data and is not affected by uneven smoothing. We set 2 mm/yr as cutoff uncertainty of InSAR data and 3 as the weighting thresholds for GPS data interpolation in the GPS/InSAR combination. At the location with InSAR and interpolated GPS data, the weighted least squares method is used to solve the optimal 3-dimensional component. Finally, we obtained a horizontal continuous deformation field from spatially limited GPS and dimensionally limited InSAR data (Figure 3). Owing to the lack of a GPS vertical velocity constraint, the vertical deformation combination effect in the non-overlapping areas of A129 and D34 was not good (Figure 3C). The data post-fit residuals and solution uncertainties are shown in Supplementary Figures S6. As Shen and Liu (2020) suggested, for a GPS network with a spacing of ∼30 km, the GPS data can provide significantly greater constraints for the solution of continuous horizontal deformation than InSAR. However, because the spatial resolution of GPS is not as high as that of InSAR, there may be exceptions at places with localized deformation sources, for example, Kashi.
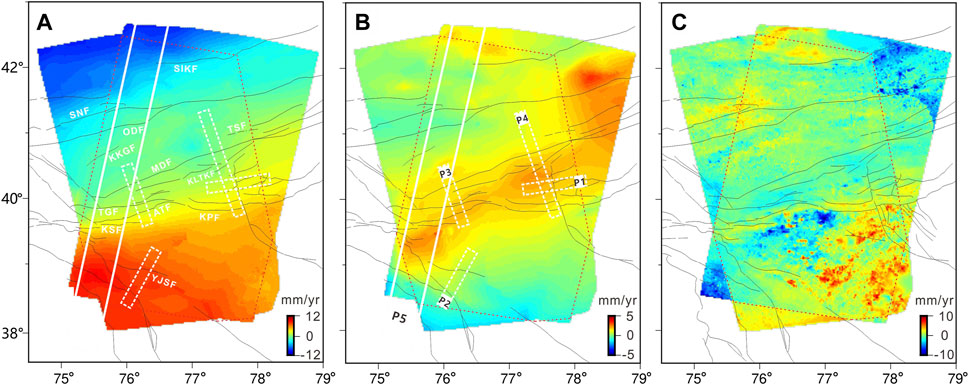
FIGURE 3. horizontal deformation map. (A) deformation for the north-south component and positive toward north. (B) deformation for the east-west component and positive toward east. (C) deformation for the vertical component and positive toward up.
Positive motion is toward the satellite. Black lines represent fault traces. Pink dashed contours (A1–A6) are caused by nontectonic activities. The intersecting black and white arrows indicate satellite flight and look directions, respectively. P1,P2,P3,P4, P5 denote five velocity profiles locations described in Supplementary Figures S5, S6, S7, S8 and Figure 7.
profiles P1,P2,P3,P4, P5 as in Figure 2. The red dotted line box is the common coverage area of tracks 129 and 34. YJSF:Yingjisha fault, KSF: Kashi fault, ATF: Atushi fault, TGF: Toth Goubaz fault, MDF: Maidan fault, KKGF:kerkeigel fault, ODF:Oinak-Djar fault, SNF:South Naryn fault, SIKF:South Issyk-Kul lake fault,TSF: Toshgan fault, KLTKF: Kalatieke fault, KPF: Kepingtag fault.
Analysis of Deformation Field
The final LOS surface velocity maps (Figure 2) show, for the first time, an almost continuous view of the surface displacement field across South Tianshan. Figure 2 shows that deformation information is only lacking in these marginal or local areas, such as grasslands and deserts in the Tarim basin, and high-altitude snow areas in South Tianshan. There are six significant deformation signals in the Kashi region (A1–A6, dashed boxes in Figures 2A,B). According to the field survey, these abnormal deformation signals are caused by nontectonic activities, including salt mining (A1, A2, A3), farmland reclamation (A4, A5), and oil and gas exploitation (A6). Excluding the influence of these nontectonic activities, the overall depression in the Kashi region, which is bounded by the Atushi fault in the north, the Pamir front thrust in the southwest, and the Tarim Basin in the southeast is clearly visible relative to the surrounding area. As shown in Figure 2, the LOS deformation in the Kashi depression is negative in both ascending and descending tracks (blue tones, away from the satellite). Figure 3C shows that the vertical subsidence deformation is approximately 2–10 mm/yr. The most severe depression was north of Jiashi County (7–10 mm/yr) and Kashi City (5–10 mm/yr). The fold-thrust belt and Keping nappe structure in the periphery of the Kashi region have evident uplift.
The horizontal deformation maps (Figure 3) show that the deformation was not evenly distributed throughout the study area. The clear feature of the N-S velocity field (Figure 3A) is that the north and south sides of the Tianshan are strongly compressed, and the N-S convergence rate across the Tianshan is approximately 15–24 mm/yr. The largest deformation among these is in the collision area between South Tianshan and Pamirs; the deformation is mainly distributed in the Pamir front thrust (PFT) and Cenozoic fold-fault belts. The central section of South Tianshan is relatively stable, with very slight deformation. These results are consistent with previous GPS research results (Niu et al., 2007; Yang S. et al., 2008; Li et al., 2015; Wang and Shen, 2020). This shows that the crust in Tianshan has undergone intense shortening deformation due to the push of the Indian plate, and the crustal deformation gradually weakens from west to east and from south to north with increased proximity from Pamirs. As shown in Figure 3B, there is a steep gradient across the fold area between South Tianshan and Tarim basins, which shows the overall eastward movement of the fold area with respect to South Tianshan and Tarim basins. The W-E movement rate of the fold area is approximately 1–3 mm/yr, and exhibits obvious segmentation in Kashi and Keping.
For the rather complex deformation field of South Tianshan, we created a series of velocity profiles to examine the regional deformation fields. These profiles clearly show the deformation gradients on various structural faults and the distribution of crustal deformations throughout southern Tianshan.
Kashi Fold-Thrust Belt
The Kashi fold-thrust belt is located in a narrow area where the Pamir collides with South Tianshan, and is currently the most active place in this area. From the LOS deformation field (Figures 2, 4), the deformation is mainly concentrated on a series of folds: the Mushi, Kashi, and Atushi folds and the faults between folds: the Kashi, Atushi, and Toth Goubaz faults. Among these folds, the LOS deformation gradually attenuated from south to north. The Mushi fold and Kashi fold had the highest surface uplift rate: ∼ 6 mm/yr; followed by the Atushi fold: ∼ 2 mm/yr. The peak surface uplift rates on the folds were all near their adjacent faults. Structures to the north of these folds appear to be mostly inactive.
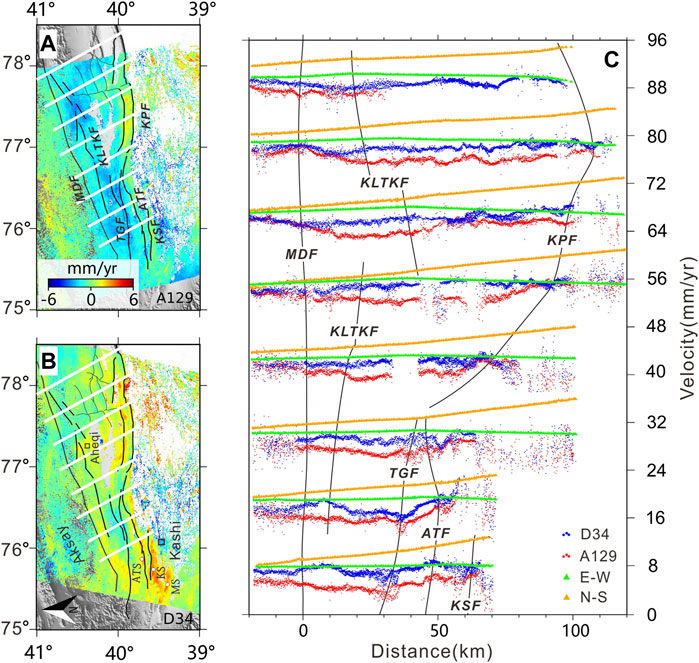
FIGURE 4. Deformation data profiles across the south of southern Tianshan. (A) and (B) indicate LOS velocity map of the tracks 129 (A129) and 34 (D34),respectively. The white lines are 8 profiles locations (C) velocity profile from D34 (blue dots), A129 (red dots), E-W (green triangle)and N-S (yellow triangle). The black lines are fault tracks. KSF: Kashi fault, ATF: Artux fault, TGF: Toth Goubaz fault, MDF: Maidan fault, KPF: Kepingtag fault, KLTKF: Kalatieke fault. MS: Mushi fold, KS: Kashi fold, ATS: Atushi fold.
From the north-south component of the horizontal deformation field (Figure 3A), the N-S deformation rate of the Kashi fold-thrust belt is approximately 10 mm/yr. Among them, the kashi fault is approximately 4 mm/yr, the Atushi fault is approximately 2 mm/yr, and the Toth Goubaz fault is approximately 2 mm/yr. The remaining convergence and shortening occurred on the folds, resulting in the uplift and growth of the folds. From the east-west deformation field (Figure 3B), we can see that the fold region has an entire eastward movement relative to South Tianshan and Tarim, and the movement rate is approximately 4 mm/yr at most. This discovery is consistent with the geological conclusion that these folds have the growth characteristics of lateral extension from east to west. However, the E-W deformation of the Atushi, Toth Goubaz, and Kashi faults is not clear, and exhibits thrust characteristics.
Maidan Fault
We can see from the LOS deformation fields (Figures 2, 4) that, as the boundary fault between South Tianshan and Tarim basins, the positive and negative deformations on both sides of the Maidan fault are at opposite positions in ascending and descending deformation fields, indicating that the present tectonic deformation of the Maidan fault has a strike-slip component. From the horizontal deformation field (Figure 3), the tectonic deformation of the Maidan fault seems segmented. In the segment between the Talas-Fergana fault and eastern Aheqi (75.8–77.0E), the Maidan fault shows slight left-lateral strike-slip and thrust deformation. In Aheqi eastward to Wushi (77.0–78.8E), the N-S deformation of the Maidan fault is strengthened.
To better determine the deformation variation of the Maidan fault and its deformation partitioning relationship with adjacent folds and nappes, we selected eight profiles of LOS and horizontal deformation from west to east across the front of South Tianshan (Figure 4). From Figure 4, we observed that the strike-slip of the Maidan fault gradually weakened from west to east, and the E-W and N-S deformations are approximately 1.0–2.0 mm/yr and approximately 1.0–1.5 mm/yr, respectively. Especially after the Kalatieke fault, strike-slip deformation mostly occurred on the fault. This shows that the Maidan fault is still active today, and has absorbed part of the tectonic deformation of the Tianshan orogeny with the adjacent faults.
Keping Nappe
The Keping nappe is bounded by the Kalatieke fault, and folds appear in the nappe from north to south. Among them, the profiles in Figure 5 show that the deformation difference in N-S and E-W on both sides of the Karatike fault is approximately 2.0 mm/yr and 1.0 mm/yr, respectively, showing a left-lateral strike-slip pattern. Considering the Piqiang fault as the dividing line, the Keping nappe is divided into the eastern and western parts, and the two parts show different tectonic deformations. As shown in Figures 5A,B, in the western part, the deformation is mainly concentrated on the Keping hill and Kepingtag fault in the front of the nappe, where the N-S and E-W deformation of kepingtag fault are approximately 2.5 mm/yr and approximately 1.0 mm/yr respectively. In the eastern part, the N-S deformation of the front of the nappe is reduced to approximately 1.5 mm/yr and distributed on the Kepingtag fault and other folds and faults. This shows that as the front edge of the Keping nappe, the tectonic deformation of the Keping Tage fault is segmented in the Piqiang fault.
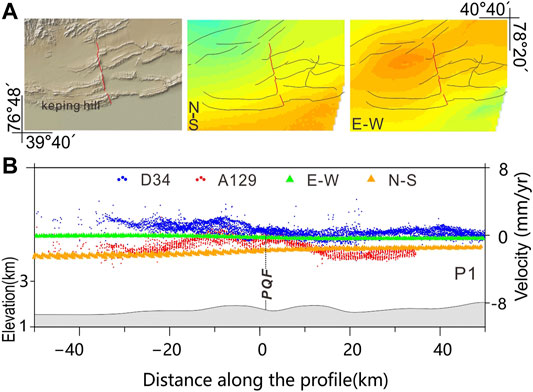
FIGURE 5. (A) Enlargements of shaded elevation, the N-S and E-W velocity maps overing Piqiang fault, the color bar is the same as Figure 3. (B) Deformation data profile across Piqiang fault (PQF). See Figures 2, 3 for P1 location.
Figures 2, 3 show that the LOS deformation and N-S deformation on the east and west sides of the Piqiang fault are evidently different, and gradually become clear from south to north. The velocity profile across the middle of the Piqiang fault (Figure 5) shows that the fault is a left-lateral strike-slip, with an average rate of ∼1.5 mm/yr.
West Kunlun Piedmont Thrust
From the LOS deformation maps (Figure 2) and the N-S horizontal deformation map (Figures 3A, 6), the western Kunlun piedmont thrust (WKPT) located in the south of the Kashi depression also exhibits deformation. Influenced by the significant northward movement and rotation of the Pamirs in the Cenozoic, the WKPT and its periphery developed in an arc shape (Cheng et al., 2012). The main fault in the middle of the WKPT is the Kusilafu fault, and the front fault is the Yingjisha fault. The deformation profile across the WKPT (Figure 6) shows that the Kusilafu fault has the characteristics of right-lateral strike-slip and thrust, showing deformation gradients in the N-S and E-W directions, indicating that it is affected by regional right-lateral strike-slip stress in addition to northward thrust. There is an N-S deformation gradient on the Yingjisha fault. Therefore, the Kusilafu and Yingjisha faults, as the boundary faults between the WKPT and Tarim Basin continue to accommodate the pushing movement of the Pamirs on the Tarim Basin. Owing to the difference in the positions of the deformed fronts on the east and west sides of the fault, the Kusilafu fault’s right lateral compression and torsion are formed.
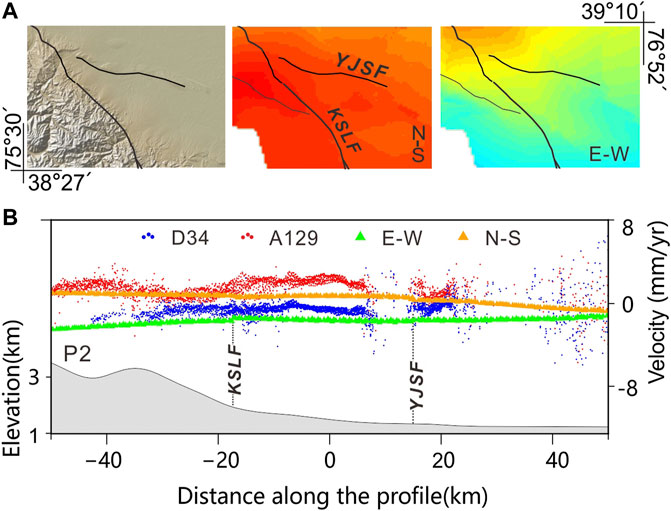
FIGURE 6. (A) Enlargements of shaded elevation, the N-S and E-W velocity maps overing the western Kunlun piedmont thrust belt, the color bar is the same as Figure 3. (B) Deformation data profile across the western Kunlun piedmont thrust belt. See Figures 2, 3 for P2 location. KSLF:kusilafu fault, YJSF:Yingjisha fault.
Northern Basins of South Tianshan
As seen in the LOS deformation maps (Figures 2, 7) and the horizontal deformation map (Figure 3), the deformation in the north of South Tianshan is dispersed in a series of intermountain active structures and the depression basins, unlike in the south side, where the deformation is mainly concentrated on the thrust folds.
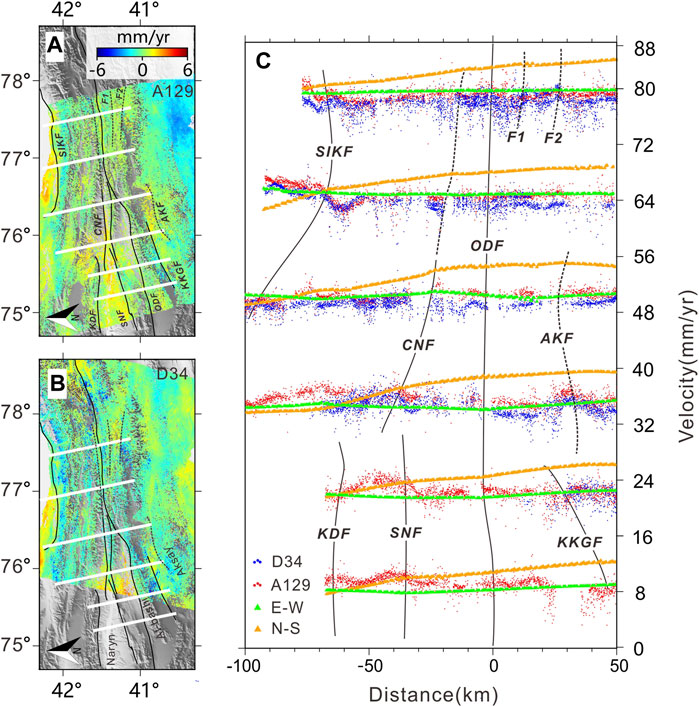
FIGURE 7. Deformation data profile across the north of the South Tianshan. (A,B) indicate LOS velocity map of the tracks 129 (A129) and 34 (D34),respectively. The white lines are 6 profiles locations (C) velocity profile from D34 (blue dots), A129 (red dots), E-W (green triangle)and N-S (yellow triangle). KKGF, kerkeigel fault; AKF, Aksay fault; ODF, Oinak-Djar fault; SNF, South Naryn fault; KDF, Kadierty fault; CNF, Central Naryn fault; SIKF, South Issyk-Kul lake fault.
There is an evident deformation gradient in the northwestern Aksay Basin, involving the Kerkeigel fault and a previously unresearched fault, which we named the Aksay fault here. The deformation profiles in Figure 7C show that the N-S convergence rates on the two faults are approximately 1.5 mm/yr, and W-E deformations are slight but show left-lateral slip. There is a subsidence area between the Kerkeigel fault and the At-Bashi range, where there is a lake. This shows that there is a local squeeze and subsidence deformation inside South Tianshan. From Figure 7C, the N-S convergence of Oinak-Djar fault in At-Bashi Basin is approximately 1.0 mm/yr, with slight W-E deformation of <0.5 mm/yr.
Naryn Valley is one of the largest intermontane basins in the Kyrgyz Tian Shan and contains abundant evidence of Quaternary shortening (Burbank et al., 1999; Thompson et al., 2002; Jobe et al., 2017). Located in the northern margin of the basin, the Kadjerty fault has N-S convergence of approximately 2.0 mm/yr and E-W deformation of approximately 0.5 mm/yr. In the middle of the basin, the central Naryn fault has N-S convergence of 2.0 mm/yr, and the deformation extends eastward along the intermountain valley. At 76.3°, it is close and approximately parallel to the Oinak–Djar fault, and the deformation decreased.
We also observed uplift deformation distributed around Issyk-Kul Lake. The South Issyk-Kul lake fault has an N-S convergence deformation of approximately 2.0–3.0 mm/yr. There are deformations on multiple faults between the southern edge of the Issyk-Kul and Maidan faults. Among them, the deformation gradient zone involves two faults that have not been studied before. We temporarily refer to them as F1 and F2; there is almost no W-E deformation on these two faults, but N-S convergences of approximately 2.0 and 1.0 mm/yr are accommodated, respectively. This indicates that the internal tectonic faults and basins north of South Tianshan have played a role in accommodating the current crustal movement.
Discussion
Present Tectonic Deformation Partitioning Across South Tianshan
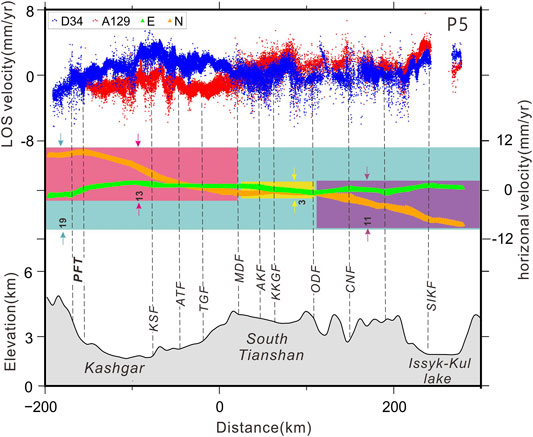
The collision and compression of the TOSB, Pamir Plateau, and Tarim basin caused complex and intense tectonic movements. The relative movements among the three were accommodated by diverse structures. Based on the first LOS velocity maps (Figure 2) and horizontal velocity fields (Figure 3) over South Tianshan (75–78 E), continuous across high-relief areas and sedimentary basins, we quantitatively analyzed the present tectonic deformations across South Tianshan. As some previous studies suggested, one of the most intriguing features of crustal deformation across South Tianshan is that both sides of the entire TOSB are strongly compressed in the N-S direction. In this study, we include deformation information which are more than that have been used in all of the previous studies. Our 3D surface deformations shown that the narrow collide area between the Pamir Plateau and South Tianshan is the most active place at present, as the deformation profile in Figure 8 shows, the deformation in this area accounts for ∼68% (13/19) of the total N-S convergence across South Tianshan, and the deformation is mainly concentrated on the PFT and Cenozoic folds-faults.
We found that the strongest deformation occurred on the front edge folds of both the Kashi fold-fault belt and the western part of the Keping nappe. In the Kashi fold-fault belt, the Mushi and Kashi anticlines had the highest surface uplift rates. In the Keping Nappe, the Keping hill had the highest surface uplift rate. This shows that, among the crustal movements of South Tianshan, the uplift deformation of active folds occupies a major proportion. We believe that this significant fold uplift may be related to the development of décollement in the region. According to geological suggestion, the existence of the décollement provides a regional weak layer for the extension of Pamir and South Tianshan to the foreland region, which is beneficial for the formation of a foreland thrust fault-fold belt (Chen et al., 2011).
For deformation within the north of South Tianshan, our observation in this study is the deformation is dispersed in a series of intermountain active structures and depression basins. Compared with the southern piedmont fault of the South Tianshan, the E-W strike-slips of faults in this area are clearer. Thompson et al. (2002) and Zubovich et al. (2010) discussed these faults across the Naryn Basin of the range slipping at 3–4 mm/yr, and other more minor faults. Zubovich et al. (2010) also discussed another of ∼5–6 mm/yr between the southern and northern edges of Issyk-Kul and the large basin that it occupies. Our profiles P5 show a difference of ∼11 mm/yr across the north of South Tianshan between 100 and 300 km on the profile (Figure 8), and the deformation in this area accounts for ∼58% (11/19) of the total N-S convergence across South Tianshan.
In addition, we found that the fold belts at the Pamir-South Tianshan junction and the nappes at the Tarim-South Tianshan junction move eastward relative to South Tianshan. The northern boundary of the movement is the Maidan fault. This indicates that the Maidan fault is still active, indicating sinistral strike-slip and thrust. Compared with the previously known tectonic pattern of the Maidan fault (Wu et al., 2019), the high spatial resolution surface deformation field shows that tectonic deformation of the Maidan fault is weakened from west to east. This weakening is closely related to the activity of adjacent faults. This indicates that the tectonic deformation in South Tianshan area is not completely concentrated in the piedmont fault-anticline belts, and the root faults of Tianshan accommodate a part of the deformation.
Furthermore, separated by the Piqiang fault, the eastern and western parts of the Keping nappe show different structural deformations. The deformation gradient is mainly concentrated at the front edge of the western nappe, but the deformation is diffusely distributed on the front edge and inner folds of the eastern nappe. As a result, the deformation of the Kepingtage fault at the front edge of the nappe suddenly decreases east of the Piqiang fault. This indicates that the Piqiang fault may not only be a separation line in the geological structure, but also an important separation line of tectonic movement to regulate the unequal crust shortening in the Tianshan.
Tectonic Kinematic Model of the South Tianshan Foreland
Under the stress environment of compression in the N-S direction, the TOSB has uplifted mountains and shortened and thickened the crust. In its eastern part, the Tarim Basin is inserted under South Tianshan from south to north; in its western part, the Fergana Basin is inserted under South Tianshan from north to south (Zhao et al., 2008). There must be a transition zone between the western and eastern subduction zones. The south Tianshan foreland in our study area is located at this transition zone, which is geologically considered to be a typical thin-skin structure, involving thrust-folds and décollement. To understand the tectonic kinematics and the partitioning of the deep-secular motion in this area, we established two 2-dimensional motion models by using the Bayesian inversion tool developed by Daout et al. (2016). We explored various fault geometries in agreement with the observed displacements along two data profiles (P3 and P4 in Figures 2, 3) of LOS and horizontal velocity across the Kashi fold belt and the Keping nappe. Based on the research results of seismology and geology (Chen et al., 2001; Turner et al., 2010; Liu 2011; Wu et al., 2019; Li et al., 2020), we modeled the flat décollement in profile P3 by a horizontal semi-infinite dislocation, limited to the north by the Maidan fault, with oblique motion (both strike-slip and dip-slip). In profile P4, a composite structure comprising two triple junctions and one frontal ramp was modeled. See Supporting Information 4 for the specific model settings.
For the western profile P3 (Supplementary Figures S7, S9A), the model suggests a depth of 21.6 km for the décollement, H1, and sets the tip of the shallow ramp, H2, at 5.5 km. Our estimates also indicate a well-constrained width, D, of 45 km, corresponding to a dip angle of 20.1° below the Kashi fold-thrust belt, with a dip-slip rate of 6.2 mm/yr. The left-lateral slip rate on the western section of the Maidan Fault is 2.2 mm/yr, and the strike-slip rate of the Atushi fault is 0.7 mm/yr. The mean shortening rate across the entire system is 6.0 mm/yr. The geometry of the inverted model is consistent with the geometry inferred from seismic reflection studies (Liu, 2011; Figure 9A).
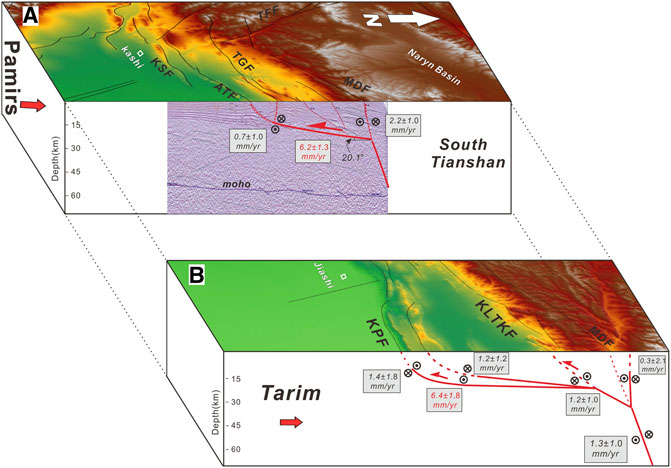
FIGURE 9. Three-dimensional schematic tectonic model across the South Tianshan-Tarim junction zone (Deep seismic reflection profile is from Liu Jinkai, 2011), and interpreted active faults summarizing the average interseismic strike-slip (back font) and dip-slip (red font) rates extracted from the Bayesian exploration.
For eastern profile P4 (Supplementary Figures S8, S9B), the model suggests that the left-lateral slip rate in the eastern section of the Maidan fault is 1.3 mm/yr, and the locking depth, H1, is 35.0 km. On the Toshigan fault, the dip-slip rate is -0.8 mm/yr, the left-lateral strike-slip rate is 0.3 mm/yr, and the locking depth, H2, is 7.0 km. On the Kalatieke fault, the dip-slip rate is 0.8 mm/yr, the right-lateral strike-slip rate is 1.2 mm/yr, and the locking depth, H3, is 20.0 km. On the Ozgeltawu fault in the north of Keping hill, the left-lateral strike-slip rate is 1.2 mm/yr, and the locking depth, H4, is 10.0 km. On Kepingtag fault on the south of Keping hill, the right-lateral strike-slip rate is 1.4 mm/yr, and the locking depth, H5, is 5.2 km. The dip-slip rate on the Keping hill ramp is 6.4 mm/yr. The mean shortening rate across the entire system is only 1.1 mm/yr.
The slip rate of the Maidan fault in the west and east sections is consistent with the geological results (Wu et al., 2019). The dip-slip rates of the Atushi and Kepingtag faults were very high, which indicates that the active fold is very intense and plays an important role in regulating the relative movements of Pamir-Tianshan and Tarim-Tianshan. The structural deformation has been partitioned into low-angle thrust-folds along the foreland and sinistral reverse faulting along the high-angle range front of the Maidan fault. The dip-slip rate on the décollement will result in the accumulation of elastic deformation, which we supposed will eventually be transformed by intermittent seismic activity into permanent strain of these parallel thrust faults in the overlying layer.
Strain Partitioning in South Tianshan
The velocity field can reflect the evident structural difference movement characteristics in the study area most visualized, but cannot effectively reflect the relationship between deformation and the dynamic mechanism. To further discuss the dynamic background of the structural deformation across south Tianshan and the strain distribution on both sides of the Tianshan, we derived a continuum strain rate field (Figure 10) by using the method developed by Shen et al. (2015) and constrained by the horizontal deformation field. From Figure 10, fine strain rate fields show the same features as those of the previous studies (Zheng et al., 2017; Wang and Shen, 2020). the TSOB is mainly dominated by N-S compression, with the largest shear and convergence occurring in the contact area between Pamirs and south Tianshan, with N-S convergence of approximately 120–150 nanostrain/yr, and a dilatation rate of approximately 50–80 nanostrain/yr, corresponding to the rapid shortening of the crust of the thrust-fault zone in the northern margin of Pamirs, where earthquakes are most likely to occur. However, we found that the principal strain rates of the thrust fault zone are mainly in the NW-SE direction, which is consistent with the strike of the Talas-Fergana fault. The convergence and shear deformation front is located at the contact zone between the Pamir and Alai Valley, where the distributed thrust strike-slip fault system includes the Pamir Frontal Thrust and Main Pamir Thrust. In the south of the high compressive strain area, near-W-E extensional deformation occurs in the Kongur tensile system.
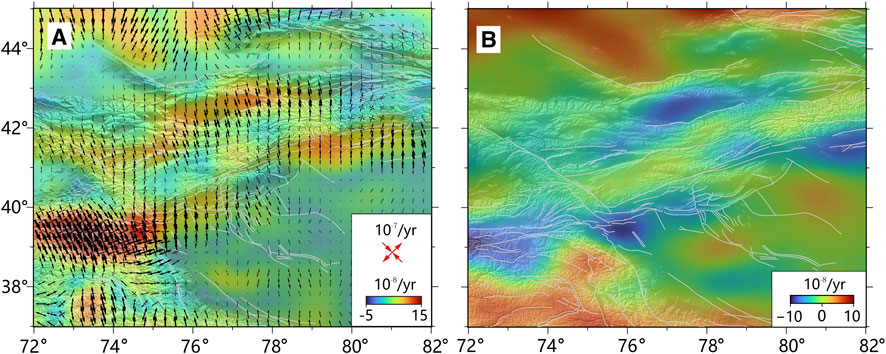
FIGURE 10. Continuum deformation field of Tianshan derived from horizontal velocities. (A) Strain rates. Maximum shear strain rate is shown in background color and principal strain rates are shown as vector pairs. (B) Dilatation rate.
The results in Figure 10 also show a few interesting strain zones. 1) From the east of the Talas-Fergana fault, the direction of the principal strain rate in the collision zone between South Tianshan and Tarim basin is mainly in the N-S direction, which differs from that in the thrust-fault zone on the northern edge of Pamir. From west to east, the rates tend to decrease. This indicates that the tectonic stress field in this area is complex and restricted by several tectonics such as faults and folds. 2) The dilatation rate showed strong areal contraction, up to 100 nanostrain/yr, along the South Tianshan-Pamir-Talimu collision zone (Figure 10B). Assuming that the volume of this area is conserved, this means that the crust under the thrust fault-fold belts shortens and/or thickens. Considering the robust fold structure in this case, we can expect that the growth of active folds may play an important role in regulating regional strain.3) In the Keping nappe, separated by the Piqiang fault, the eastern and western parts of the nappe show opposite shear strain rates and different dilatation rates. This corresponds to the different tectonic deformation between the eastern and western parts, and also corresponds to the different depths of the detachment plane under the Keping nappe, which is approximately 9 km in the west and 5 km in the east (Yin et al., 1998; Tian et al., 2006; Yang X. et al., 2008). The reason may be that the Pamirs pushed northward along with the Tarim, which was mainly pushed by Pamirs in the west of Piqiang, and the Tarim basin in the east of Piqiang. The Piqiang fault is a transition boundary of regional stress. 4) The principal strain rates are very low in south Tianshan, and high in the Naryn Basin and Issyk-Kul Lake in the north of South Tianshan. Approximately 20–60 nanostrain/yr shear strain and approximately 50 nanostrain/yr dilatation indicate that Naryn Basin and Issyk-Kul Lake experience crustal thickening caused by compression on both the north and south, especially in Issyk-Kul Lake. This may be attributable to the existence of small-scale mantle convection in this area (Wolfe and Vernon, 1998; Tian et al., 2010), or the shearing effect between the lithosphere and asthenosphere on a regional scale (Li and Chen, 2006).
Conclusion
We produced the LOS velocity fields from two Sentinel-1 tracks by PSInSAR and horizontal velocity fields by combining GPS data reported by Wang and Shen (2020) across South Tianshan. Adequate coverage of the velocity fields significantly improved the spatial resolution of the present-day crustal deformation in southern Tianshan, leading to the following conclusions:
(1) The TSOB is strongly compressed by the Eurasian plate and Indian plate on the north and south sides respectively, and the deformation across South Tianshan is not evenly distributed. The contact area between Pamirs and south Tianshan is currently the most active area, which accommodates the total N-S convergence by ∼68%. The deformation field at the center of South Tianshan is stable, and deformation is observed in local places. Approximately 58% of the total N-S convergence deformation is continuously distributed in active faults and basin systems in the north of South Tianshan.
(2) The deformation of the Pamir-South Tianshan-Tarim collision zone is gradually attenuated from west to east and from south to north as the distance from the Pamir Plateau increases. This indicates that the pushing of the Indian plate is the main driving force for the intense shortening deformation of the crust in this area.
(3) Thrust strike-slip of structural faults, uplift deformation of active folds, and slippage of décollement play important roles in regulating regional strain. As a root fault in South Tianshan, the Maidan fault continues to exhibit strike-slip and thrust, and its strike-slip is gradually attenuated from west to east, which together with adjacent faults has part of tectonic deformation in the Tianshan orogeny. The shallow flat décollement in the south Tianshan foreland was modeled, and the dip-slip rate ranged 6.2–6.4 mm/yr.
(4) The strain rate field shows that the N-S convergence of approximately 120–150 nanostrain/yr and dilatation rate of approximately 50–80 nanostrains/yr occurred in the collision area between the Pamir Plateau and South Tianshan, where rapid shortening of the crust and earthquakes are most likely to occur.
Data Availability Statement
Publicly available datasets were analyzed in this study. This data can be found here: All Sentinel-1 data were obtained from the ESA (https://scihub.copernicus.eu/).
Author Contributions
JQ: Data curation, Visualization, Investigation, Writing—Original draft preparation. LJ: Conceptualization, Writing—Reviewing, Supervision. LZ: Writing—Reviewing and Editing. QW: Software.
Funding
This work was supported by the National Natural Science Foundation of China (No. 41904007) and the Spark Programs of Earthquake Sciences granted by the China Earthquake Administration (XH20083).
Conflict of Interest
The authors declare that the research was conducted in the absence of any commercial or financial relationships that could be construed as a potential conflict of interest.
Publisher’s Note
All claims expressed in this article are solely those of the authors and do not necessarily represent those of their affiliated organizations, or those of the publisher, the editors and the reviewers. Any product that may be evaluated in this article, or claim that may be made by its manufacturer, is not guaranteed or endorsed by the publisher.
Acknowledgments
We appreciate Prof. Jianbao Sun for giving detailed guidance in using StaMPS. All Sentinel-1 data were obtained from the ESA. Figures were drawn by using Generic Mapping Tools.
Supplementary Material
The Supplementary Material for this article can be found online at: https://www.frontiersin.org/articles/10.3389/feart.2021.793890/full#supplementary-material
Abbreviations
SAR, Sythetic aperture radar; InSAR, Interferometric synthetic aperture radar; TSOB, Tianshan orogenic belt; GPS, Global Positioning System; LOS, line-of-sight; SLC, single look complex; HRES-ECMWF, high-resolution European Center for Medium-Range Weather Forecasts;GACOS, Generic Atmospheric Correction Online Service; WKPT, western Kunlun piedmont thrust.
References
Abdrakhmatov, K. Y., Aldazhanov, S. A., Hager, B. H., Hamburger, M. W., Herring, T. A., Kalabaev, K. B., et al. (1996). Relatively Recent Construction of the Tien Shan Inferred from GPS Measurements of Present-Day Crustal Deformation Rates. Nature 384, 450–453. doi:10.1038/384450a0
Bekaert, D. P. S., Walters, R. J., Wright, T. J., Hooper, A. J., and Parker, D. J. (2015). Statistical Comparison of InSAR Tropospheric Correction Techniques. Remote Sensing Environ. 170, 40–47. doi:10.1016/j.rse.2015.08.035
Bufe, A., Bekaert, D. P. S., Hussain, E., Bookhagen, B., Burbank, D. W., Thompson Jobe, J. A., et al. (2017). Temporal Changes in Rock Uplift Rates of Folds in the Foreland of the Tian Shan and the Pamir from Geodetic and Geologic Data. Geophys. Res. Lett. 44, 10977–10987. doi:10.1002/2017GL073627
Burbank, D. W., McLean, J. K., Bullen, M., Abdrakhmatov, K. Y., and Miller, M. M. (1999). Partitioning of Intermontane Basins by Thrust‐related Folding, Tien Shan, Kyrgyzstan. Basin Res. 11, 75–92. doi:10.1046/j.1365-2117.1999.00086.x
Burchfiel, B. C., Brown, E. T., Qidong, D., Xianyue, F., Jun, L., Molnar, P., et al. (1999). Crustal Shortening on the Margins of the Tien Shan, Xinjiang, China. Int. Geology. Rev. 41, 665–700. doi:10.1080/00206819909465164
Chen, J., Li, T., Li, W. Q., and Yuan, C.-D. (2011). Late Cenozoic and Present Tectonic Deformation in the Pamir Salient, Northwestern China. J. Seismology Geology. 33 (2), 241–259. (in Chinese with English abstract). doi:10.3969/j.issn.0253-4967.2011.02.001
Chen, J., Lu, Y. C., and Ding, G. Y. (2001). Records of Late Cenozoic Mountain Building in Western Tarim Basin: Molasses, Growth Strata and Growth Unconformity. J. Quat. Sci. 21 (6), 528–539. (in Chinese with English abstract). doi:10.3321/j.issn:1001-7410.2001.06.009
Cheng, X. G., Huang, Z. B., Chen, H. L., Du, C., Li, K., and Shi, J. (2012). Fault Characteristics and Division of Tectonic Units of the Thrust belt in the Front of the West Kunlun Mountains. J. Acta Petrologica Sinica 28 (8), 2591–2601. (in Chinese with English abstract).
Daout, S., Doin, M.-P., Peltzer, G., Lasserre, C., Socquet, A., Volat, M., et al. (2018). Strain Partitioning and Present-Day Fault Kinematics in NW Tibet from Envisat SAR Interferometry. J. Geophys. Res. Solid Earth 123, 2462–2483. doi:10.1002/2017JB015020
Daout, S., Jolivet, R., Lasserre, C., Doin, M.-P., Barbot, S., Tapponnier, P., et al. (2016). Along-strike Variations of the Partitioning of Convergence across the Haiyuan Fault System Detected by InSAR. Geophys. J. Int. 205, 536–547. doi:10.1093/gji/ggw028
Deng, Q., Zhang, P., Ran, Y., Yang, X., Min, W., and Chen, L. (2003). Active Tectonics and Earthquake Activities in China. J. Earth Sci. Front. 10, 66–73. (in Chinese with English abstract). doi:10.3321/j.issn:1005-2321.2003.z1.012
Gao, G., Wen, H., and Nie, X. (2005). Analysis of Focal-Mechanism Solution of Moderately strong Earthquakes in Xinjiang from 1991 to 2002. J. Earthquake. 25 (1), 81–87. (in Chinese with English abstract).
Goldstein, R. M., and Werner, C. L. (1998). Radar Interferogram Filtering for Geophysical Applications. Geophys. Res. Lett. 25, 4035–4038. doi:10.1029/1998GL900033
Hanssen, R. F. (2001). Radar Interferometry: Data Interpretation and Error Analysis (Remote Sensing and Digital Image Processing). New York, United States: Springer.
He, P., Wen, Y., Xu, C., Liu, Y., and Fok, H. S. (2015). New Evidence for Active Tectonics at the Boundary of the Kashi Depression, China, from Time Series InSAR Observations. Tectonophysics 653, 140–148. doi:10.1016/j.tecto.2015.04.011
Hooper, A., Segall, P., and Zebker, H. (2007). Persistent Scatterer Interferometric Synthetic Aperture Radar for Crustal Deformation Analysis, with Application to Volcán Alcedo, Galápagos. J. Geophys. Res. 112, B07407. doi:10.1029/2006JB004763
Hooper, A., Zebker, H., Segall, P., and Kampes, B. (2004). A New Method for Measuring Deformation on Volcanoes and Other Natural Terrains Using InSAR Persistent Scatterers. Geophys. Res. Lett. 31, 1–5. doi:10.1029/2004GL021737
Ji, L., Zhang, W., Liu, C., Zhu, L., Xu, J., and Xu, X. (2020). Characterizing Interseismic Deformation of the Xianshuihe Fault, Eastern Tibetan Plateau, Using Sentinel-1 SAR Images. Adv. Space Res. 66, 378–394. doi:10.1016/j.asr.2020.03.043
Jobe, J. A. T., Li, T., Chen, J., Burbank, D. W., and Bufe, A. (2017). Quaternary Tectonic Evolution of the Pamir‐Tian Shan Convergence Zone, Northwest China. Tectonics 36, 2748–2776. doi:10.1002/2017TC004541
Jolivet, R., Agram, P. S., Lin, N. Y., Simons, M., Doin, M. P., Peltzer, G., et al. (2014). Improving InSAR Geodesy Using Global Atmospheric Models. J. Geophys. Res. Solid Earth 119 (3), 2324–2341. doi:10.1002/2013jb010588
Jolivet, R., Cattin, R., Chamot-Rooke, N., Lasserre, C., and Peltzer, G. (2008). Thin-Plate Modeling of Interseismic Deformation and Asymmetry across the Altyn Tagh Fault Zone. Geophys. Res. Lett. 35 (2), L02309. doi:10.1029/2007gl031511
Li, A., and Chen, C. (2006). Shear Wave Splitting beneath the central Tien Shan and Tectonic Implications. Geophys. Res. Lett. 33, L22303. doi:10.1029/2006GL027717
Li, A., Ran, Y., Gomez, F., Thompson Jobe, J. A., Liu, H., and Xu, L. (2020). Segmentation of the Kepingtage Thrust Fault Based on Paleoearthquake Ruptures, Southwestern Tianshan, China. Nat. Hazards 103, 1385–1406. doi:10.1007/s11069-020-04040-6
Li, J., Qiao, X. J., Yang, S. M., Nie, Z. S., Wang, D. J., Zou, R., et al. (2015). Detachment Fault Model Characterized for the 3D Surface Displacement Field in the Southwestern Tian Shan. Chin. J. Geophys. 58 (10), 3517–3529. (in Chinese with English abstract). doi:10.1002/cjg2.20184
Liu, C., Ji, L., Zhu, L., and Zhao, C. (2018). InSAR-Constrained Interseismic Deformation and Potential Seismogenic Asperities on the Altyn Tagh Fault at 91.5-95°E, Northern Tibetan Plateau. Remote Sensing 10 (6), 943. doi:10.3390/rs10060943
Liu, J. K. (2011). Fine Data Processing and Pre-stack Imaging of the Deep Seismic Reflection Profile of the Contact Zone between the Southern Tianshan and Tarim basin. China, Beijing: D. Chinese Academy of Geological Sciences. (in Chinese with English abstract).
Miao, J., Jia, C., Hou, X., Wang, Z., Zou, C., Tang, L., et al. (2007). Structural Analysison Cenozoic Fold and Thrust Belts in Kashi Area, Western Tarim basin. J. Chin. J. Geology. 42 (4), 740–752. (in Chinese with English abstract). doi:10.3321/j.issn:0563-5020.2007.04.009
Niu, Z., You, X., and Yang, S. (2007). Analysis of Contemporary Crustal Deformation Characteristics with GPS Data of Tianshan Mountain. J. J. Geodesy Geodynamics 27 (002), 1–9. (in Chinese with English abstract). doi:10.5194/sed-7-3179-2015
Qiao, X., Yu, P., Nie, Z., Li, J., Wang, X., Kuzikov, S. I., et al. (2017). The Crustal Deformation Revealed by GPS and InSAR in the Northwest Corner of the Tarim Basin, Northwestern China. Pure Appl. Geophys. 174, 1405–1423. doi:10.1007/s00024-017-1473-6
Shen, J., Wang, Y., Zhao, R., Jei, C., and Guosheng, Q. (2001). Propagation of Cenozoic Arcuate Structures in Northeast Pamir and Northwest Tarim basin. J. Seismology Geology. 23 (3), 381–389. (in Chinese with English abstract). doi:10.3969/j.issn.0253-4967.2001.03.005
Shen, L., Hooper, A., and Elliott, J. (2019). A Spatially Varying Scaling Method for InSAR Tropospheric Corrections Using a High‐Resolution Weather Model. J. Geophys. Res. Solid Earth 124, 4051–4068. doi:10.1029/2018JB016189
Shen, Z.-K., Wang, M., Li, Y., Jackson, D. D., Yin, A., Dong, D., et al. (2001). Crustal Deformation along the Altyn Tagh Fault System, Western China, from GPS. J. Geophys. Res. 106, 30607–30621. doi:10.1029/2001jb000349
Shen, Z. K., and Liu, Z. (2020). Integration of GPS and InSAR Data for Resolving 3‐Dimensional Crustal Deformation. Earth Space Sci. 7, e2019EA001036. doi:10.1029/2019EA001036
Shen, Z. K., Wang, M., Zeng, Y., and Wang, F. (2015). Optimal Interpolation of Spatially Discretized Geodetic Data. Bull. Seismological Soc. America 105 (4), 2117–2127. doi:10.1785/0120140247
Thompson, S. C., Weldon, R. J., Rubin, C. M., Abdrakhmatov, K., Molnar, P., and Berger, G. W. (2002). Late Quaternary Slip Rates across the central Tien Shan, Kyrgyzstan, central Asia. J. Geophys. Res. 107, 7–1. doi:10.1029/2001jb000596
Tian, Q., Ding, G., and Hao, P. (2006). Seismotectonic Study on West Part of the Interaction Zone between Southern Tianshan and Northern Tarim. J. Seismology Geology. 28 (002), 213–223. (in Chinese with English abstract).
Tian, X., Zhao, D., Zhang, H., Tian, Y., and Zhang, Z. (2010). Mantle Transition Zone Topography and Structure beneath the central Tien Shan Orogenic Belt. J. Geophys. Res. 115, B1030. doi:10.1029/2008JB006229
Turner, S. A., Cosgrove, J. W., and Liu, J. G. (2010). Controls on Lateral Structural Variability along the Keping Shan Thrust belt, SW Tien Shan Foreland, China. Geol. Soc. Lond. Spec. Publications 348 (1), 71–85. doi:10.1144/sp348.5
Wang, H., Wright, T. J., Liu‐Zeng, J., and Peng, L. (2019). Strain Rate Distribution in South‐Central Tibet from Two Decades of InSAR and GPS. Geophys. Res. Lett. 46 (10), 5170–5179. doi:10.1029/2019gl081916
Wang, H., and Wright, T. J. (2012). Satellite Geodetic Imaging Reveals Internal Deformation of Western Tibet. Geophys. Res. Lett. 39 (7), 7303. doi:10.1029/2012gl051222
Wang, M., and Shen, Z. K. (2020). Present‐Day Crustal Deformation of Continental China Derived from GPS and its Tectonic Implications. J. Geophys. Res. Solid Earth 125, e2019JB018774. doi:10.1029/2019JB018774
Wang, Q., Ding, G., Qiao, X., Wang, X., and You, X. (2000). The Rapid Crustal Shortening and the Relative Movement with the north and South Blocks in the Tianshan. J. Chin. Sci. Bull. 45 (14), 1543–1547. (in Chinese). doi:10.1007/bf02909695
Wegnüller, U., Werner, C., Strozzi, T., Wiesmann, A., Frey, O., and Santoro, M. (2016). Sentinel-1 Support in the GAMMA Software. Proced. Comput. Sci. 100, 1305–1312. doi:10.1016/j.procs.2016.09.246
Wolfe, C. J., and Vernon, F. L. (1998). Shear-wave Splitting at central Tien Shan: Evidence for Rapid Variation of Anisotropic Patterns. Geophys. Res. Lett. 25, 1217–1220. doi:10.1029/98GL00838
Wu, C., Zheng, W., Zhang, P., Zhang, Z., Jia, Q., Yu, J., et al. (2019). Oblique Thrust of the Maidan Fault and Late Quaternary Tectonic Deformation in the Southwestern Tian Shan, Northwestern China. Tectonics 38, 2625–2645. doi:10.1029/2018TC005248
Yang, S., Li, J., and Wang, Q. (2008). Study on the Present Deformation and Fault Activity of Tianshan by GPS. J. SCIENTIA SINICA Terrae 38 (7), 872–880. (in Chinese). doi:10.1007/s11430-008-0090-8}
Yang, X., Deng, Q., Zhang, P., and Xu, X.-W. (2008). Crustal Shortening of Major Nappe Structcrus on the Front Margins of the Tianshan. J. Seismology Geology. 30 (1), 111–131. (in Chinese with English abstract).
Yin, A., Nie, S., Craig, P., Harrison, T. M., Ryerson, F. J., Xianglin, Q., et al. (1998). Late Cenozoic Tectonic Evolution of the Southern Chinese Tian Shan. Tectonics 17, 1–27. doi:10.1029/97TC03140
Yu, C., Li, Z., Penna, N. T., and Crippa, P. (2018). Generic Atmospheric Correction Model for Interferometric Synthetic Aperture Radar Observations. J. Geophys. Res. Solid Earth 123, 9202–9222. doi:10.1029/2017JB015305
Yu, C., Li, Z., and Penna, N. T. (2020). Triggered Afterslip on the Southern Hikurangi Subduction Interface Following the 2016 Kaikōura Earthquake from InSAR Time Series with Atmospheric Corrections. Remote Sensing Environ. 251, 112097. doi:10.1016/j.rse.2020.112097
Zhang, L., Ding, X., Lu, Z., Jung, H.-S., Hu, J., and Feng, G. (2014). A Novel Multitemporal Insar Model for Joint Estimation of Deformation Rates and Orbital Errors. IEEE Trans. Geosci. Remote Sensing 52, 3529–3540. doi:10.1109/TGRS.2013.2273374
Zhang, P., Deng, Q., Xu, X. W., Peng, S. Z., Feng, X. Y., Yang, X. P., et al. (1996). Late Cenozoic Tectonic Deformation and Mechanism along the Tianshan Mountain, Northwestern China. J. Earthquake Res. China 12 (2), 127–140. (in Chinese with English abstract).
Zhang, P., Deng, Q., Zhang, G., Ma, J., Gan, W., Min, W., et al. (2003). Strong Seismicity and Active Block in Chinese Mainland. J. SCIENTIA SINICA Terrae 33, 12–20. (in Chinese). doi:10.3321/j.issn:1006-9267.2003.z1.002
Zhao, J., Cheng, H., Pei, S., Liu, H., Zhang, J., Liu, B., et al. (2008). Deep Structure in the Northern Margin of Tarim basin. J. Chin. Sci. Bull. 053 (008), 946–955. (in Chinese). doi:10.1007/s11434-008-0117-8
Zheng, G., Wang, H., Wright, T. J., Lou, Y., Zhang, R., Zhang, W., et al. (2017). Crustal Deformation in the India-Eurasia Collision Zone from 25 Years of GPS Measurements. J. Geophys. Res. Solid Earth 122, 9290–9312. doi:10.1002/2017JB014465
Keywords: South Tianshan, GPS/InSAR, 3D surface deformation, deformation partitioning, fault slip
Citation: Qiu J, Ji L, Zhu L and Wang Q (2022) Present-Day Tectonic Deformation Partitioning Across South Tianshan From Satellite Geodetic Imaging. Front. Earth Sci. 9:793890. doi: 10.3389/feart.2021.793890
Received: 12 October 2021; Accepted: 29 December 2021;
Published: 10 February 2022.
Edited by:
Ying Li, China Earthquake Administration, ChinaReviewed by:
Alexis Rigo, UMR8538 Laboratoire de Géologie de l'Ecole Normale Supérieure (LG-ENS), FranceHua Wang, Guangdong University of Technology, China
Copyright © 2022 Qiu, Ji, Zhu and Wang. This is an open-access article distributed under the terms of the Creative Commons Attribution License (CC BY). The use, distribution or reproduction in other forums is permitted, provided the original author(s) and the copyright owner(s) are credited and that the original publication in this journal is cited, in accordance with accepted academic practice. No use, distribution or reproduction is permitted which does not comply with these terms.
*Correspondence: Lingyun Ji, ZGluc2FyMDEwQDE2My5jb20=