 Lu Liu
 Yuqing Wang
 Hui Wang
- 1State Key Laboratory of Severe Weather, Chinese Academy of Meteorological Sciences, Beijing, China
- 2International Pacific Research Center and Department of Atmospheric Sciences, School of Ocean and Earth Science and Technology, University of Hawaii at Manoa, Honolulu, China
In this study, the performance of three exponential decay models in estimating intensity change of tropical cyclones (TCs) after landfall over China is evaluated based on the best-track TC data during 1980–2018. Results indicate that the three models evaluated can reproduce the weakening trend of TCs after landfall, but two of them (M1 and M2) tend to overestimate TC intensity and one (M3) tends to overestimate TC intensity in the first 12 h and underestimate TC intensity afterwards. M2 has the best performance with the smallest errors among the three models within 24 h after landfall. M3 has better performance than M1 in the first 20 h after landfall, but its errors increase largely afterwards. M1 and M2 show systematic positive biases in the southeastern China likely due to the fact that they have not explicitly included any topographic effect. M3 has better performance in the southeastern China, where it was originally attempted, but shows negative biases in the eastern China. The relative contributions of different factors, including landfall intensity, translational speed, 850-hPa moist static energy, and topography, to model errors are examined based on classification analyses. Results indicate that the landfall intensity contributes about 18%, translational speed, moist static energy and topography contribute equally about 15% to the model errors. It is strongly suggested that the TC characteristics and the time-dependent decay constant determined by environmental conditions, topography and land cover properties, should be considered in a good exponential decay model of TC weakening after landfall.
Introduction
Tropical cyclones (TCs) can exert severe destructive potential and impacts on human activities and often cause substantial property damage and loss of life after their landfall, particularly in a well-populated area with high economic development. The disaster potential caused by extremely strong winds, torrential rainfall, and storm surge is largely related to the intensity of a TC during and after its landfall. Therefore, understanding and forecasting the weakening rate of TCs after landfall are of critical importance for disaster prevention by estimating the potential inland penetration of the TC-induced hazards. Although TCs mostly experience a rapid weakening after landfall, the rate of the weakening is determined by many factors, including the large-scale atmospheric circulation, the internal dynamics of the TC itself (such as size and intensity, etc.), the near-shore sea surface temperature (SST), and the land surface properties (such as the land cover, soil moisture and temperature, orography, etc.). These processes may interact nonlinearly with each other, leading to large variability in the weakening rate of TCs during and after landfall. This also makes the intensity forecasts of landfalling TCs even more challenging than the intensity forecasts of TCs over open oceans (e.g., Duan et al., 2019).
In the last 3 decades or so, considerable efforts have been devoted to understanding the processes that lead to TC weakening after landfall. The basic principle behind the TC weakening after landfall is known to be mainly due to the decrease in sensible and latent heat fluxes and the increase in surface friction over land (Tuleya and Kurihara, 1978; Tuleya et al., 1984; Tuleya, 1994). However, the detailed dynamic and thermodynamic processes involved are multiple, highly nonlinear, and varying in both time and space. Nevertheless, still considerable progress has been made to quantify the weakening rate of landfalling TCs. One of the efforts is to construct empirical models to fit the decay rate of maximum sustained near-surface wind speed (MSSW) of a TC after landfall (Schwerdt et al., 1979; Batts et al., 1980; Georgiou, 1985; Ho et al., 1987; Kaplan and DeMaria, 1995; Kaplan and DeMaria, 2001; Vickery and Twisdale, 1995; Knaff et al., 2005; Colette et al., 2010). Schwerdt et al. (1979) first showed that the decay of a TC after landfall in terms of central sea level pressure depended on the region where the TC made landfall. Batts et al. (1980) proposed a decay model for a TC over land with a decaying constant that varies with the angle at which the TC crosses the coastline. Georgiou (1985) modeled the decay of a TC after landfall as a function of the distance from the landfalling point. Ho et al. (1987) found that the decay rate was a function of the TC intensity at landfall.
The most promising decay models are the so-called exponential decay models, which are shown to be better than other decay models and will be evaluated in this study. Kaplan and DeMaria (1995) developed a simple empirical decay model to estimate TC intensity change after landfall over the United States, which is an exponential decay equation in terms of the MSSW as a function of time after landfall. The model was later extended and refined for TCs making landfall in the New England area (north of 37°N) by (Kaplan and DeMaria, 2001) and for TCs making landfall over narrow landmasses by DeMaria et al. (2006). This decay model of landfalling TC intensity is used in the Statistical Hurricane Intensity Prediction Scheme (SHIPS, DeMaria and Kaplan, 1994; Demaria and Kaplan, 1999) for TC intensity forecasts over the North Atlantic and the Eastern Pacific (DeMaria et al., 2005), and have been shown to have good skills in predicting TC intensity after landfall. Bhowmik et al. (2005) further improved the decay model of Kaplan and DeMaria (1995) for TCs making landfall over India by considering different decay constants for two periods: the first 6 h after landfall and the remaining 12 h over land. Vickery (2005) proposed a decay model of TC intensity in terms of the increase in central sea level pressure after landfall over the United States by considering the exponential decaying constant as a function of three factors: the landfall intensity, the radius of maximum wind, and the translational speed of the TC at landfall. These factors are believed to considerably affect the TC weakening rate after landfall. Wong et al. (2008) constructed an empirical decay model for estimating TC intensity change after landfall along the South China coast. In this empirical decay model, the exponential decay constant is a function of TC intensity, the landward translational speed of the TC, and the 850-hPa moist static energy at the time of landfall.
Because all existing decay models of TC intensity change after landfall were developed for a particular region, it is unclear how well these models estimate TC intensity after landfall in other regions. To address this issue, in this study we evaluated and compared the performance of three previously developed decay models in estimating TC intensity change in terms of the MSSW after landfall over China [namely, those developed, respectively, by Kaplan and DeMaria (1995), Bhowmik et al. (2005), Wong et al. (2008)]. We paid special attention to the relative contributions of various factors to the model errors and to identify the error sources and their regional dependence and various parameters, including the TC intensity at landfall, translational speed at landfall, and landfall latitude. Results from this study can help future improvements of the decay models for estimating and forecasting TC intensity change after landfall over China. The rest of the paper is organized as follows. Data and Decay Models describes the data and exponential decay models evaluated in this study. The performances of the three decay models are evaluated in Evalution of Model Performance. Model Error Analysis examines the impact of different factors on the weakening rate of TC intensity after landfall and model errors. A brief discussion and major conclusions are given in the last section.
Data and Decay Models
Data
The best-track TC data during 1980–2018 used in this study were acquired from the China Meteorological Administration–Shanghai Typhoon Institute (CMA/STI), which include latitude and longitude of the TC center, TC intensity in terms of the MSSW (2-min mean), and minimum sea level pressure at 6-h intervals. Note that the 6 hourly best-track data were linearly interpolated into 1-h intervals in the following analyses. The CMA/STI best-track data were used as the primary TC data because relatively more observational data were available over mainland China when the postseason TC analysis was conducted to generate the best-track TC data [see Ying et al. (2014) for more details]. The European Centre for Medium-Range Weather Forecasts (ECMWF) interim reanalysis (ERA-Interim) data at the horizontal resolution of 0.75° × 0.75° (Dee et al., 2011) were used to calculate the parameters in the decay models as described in the next subsection.
We only considered TCs making landfall over mainland China (excluding those making landfall over Taiwan or Hainan Islands) during 1980–2018. A landfalling TC is referred to a TC whose center crossed the coastline of mainland China at least once during its lifetime. Only TCs that made landfall and remained over land for at least three subsequent hours during the peak TC season (June–October) were included. If a TC re-entered the sea after landfall, we only considered the time period when the TC moved over land. The data period includes 135 cases of landfalling TCs over mainland China, with the average post-landfall duration of 32.6 h per TC. The tracks of these TCs are depicted in Figure 1. Here the track density is defined as the occurrence frequency of TCs that made landfall over mainland China and passed through a 2° × 2° grid box. Note that when two time (1 hourly) points from one TC that occurred in one grid box, we counted them twice in the track density.
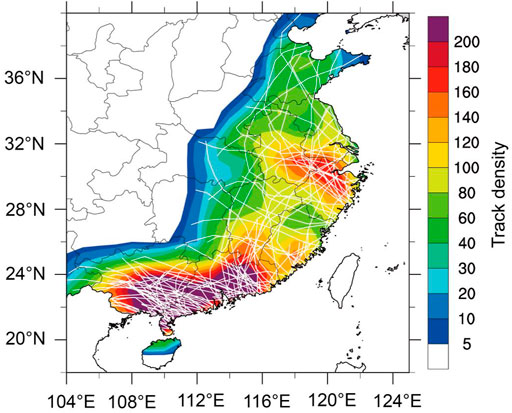
FIGURE 1. Track density (shaded) of landfalling TCs. The white lines represent the tracks of landfalling TCs.
Description of Three Decay Models
As mentioned in Introduction, the performance of the most recent three exponential decay models for estimating the time evolution of MSSW of TCs after landfall are evaluated and compared in this study. They are developed by Kaplan and DeMaria (1995), Bhowmik et al. (2005), and Wong et al. (2008), respectively, and named in short M1, M2, and M3 for convenient discussions below. Each of the three decay models is briefly described below to allow readers to know the similarities and differences among these models.
The first model (M1) is that developed by Kaplan and DeMaria (1995), which is a simple exponential decay model for estimating the MSSW for TCs after landfall south of 37°N over the United States. Kaplan and DeMaria (1995) found that the decay rate of MSSW of a TC after landfall is proportional to the MSSW of the TC at the time of landfall, and the MSSW decreases with time to a background wind speed. The decay model is mathematically expressed by
where V is MSSW of the TC after landfall and
The second model (M2) is the empirical decay model developed by Bhowmik et al. (2005) for estimating TC intensity crossing the east coast of India. They found that the decay rate during the first 6 h after landfall is more than doubled than that of the next 6 h in the region. Therefore, they used the same exponential decay model of Eq. 1 but they allowed the decay constant to be different in the two time periods. The decay constant becomes,
where V6 and V18 are MSSWs at 6 and 18 h after landfall, respectively. The decay constant
The third model (M3) is the intensity decay model for TCs making landfall along the south coast of mainland China (110.5–117.5°E) developed by Wong et al. (2008). Different from the above two decay models, based on an analysis of various factors, Wong et al. (2008) found that the landfall intensity, landward translational speed, and 850-hPa moist static energy of the TC at landfall had significant impact on the decay constant. They constructed the following decay model
where c is the landward translational speed of the TC at landfall, and
Evalution of Model Performance
We first examine the averaged intensity of landfalling TCs as a function of time after landfall (black curve in Figure 2). We can see from Figure 2 that rapid weakening of TCs occurs during the first 12 h after landfall. The weakening slows down afterwards. Eventually, the MSSW weakens to the background wind speed (about 30–40 h after landfall). Consistent with previous studies (Kaplan and DeMaria, 1995; Bhowmik et al., 2005; Vickery, 2005; Wong et al., 2008), TCs after landfall weaken roughly exponentially with time in terms of the MSSW. This explains why the existing decay models are based on the exponential function of time as summarized in Description of Three Decay Models.
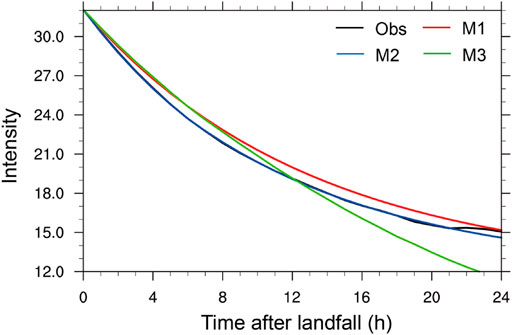
FIGURE 2. The mean decay curves of maximum sustained near surface wind (m s−1) for landfalling TCs over China during 1980–2018 from CMA dataset (black), and from M1 (red), M2 (blue), and M3 (green).
The performances of the three decay models in estimating TC intensity change within 24 h after landfall are evaluated based on the basic statistical analysis of the model errors applied to all samples of landfalling cases over China during 1980–2018. Figure 2 compares the overall performances of the three models in terms of the mean intensity evolution after landfall against the CMA best-track data during 1980–2018. All three models can produce the overall weakening of TCs after landfall, but with considerable mean errors. In M1, the decay constant is assumed to be independent of time (Kaplan and DeMaria, 1995). Therefore, it can only roughly model the overall weakening trend of landfalling TCs but with relatively larger mean errors. On average, M1 overestimates the intensity of landfalling TCs in the first 24 h after landfall. This is similar to the result in Kaplan and DeMaria (1995), who also found that on average the decay model tends to overpredict the MSSWs of TCs inland. Different from M1, M2 uses two decay constants for two different time periods after landfall (Bhowmik et al., 2005). The use of different decay constants largely improves the model performance in estimating the weakening of TCs after landfall, especially during the first 12 h after landfall. Particularly, the overall rapid weakening of TCs in the first 6 h after landfall is well captured by M2. Although the mean error from M2 increases for the following 18 h (Figure 3A), the mean errors are much smaller than those from M1. Different from those in M1 and M2, the decay constant in M3 is determined by considering the TC intensity, landward translational speed, and 850-hPa moist static energy of the TC at the time of landfall. As a result, in M3, different TCs possess different decay constants determined by different environmental conditions and characteristics of the landfalling TCs. In this sense, M3 can reflect the different characteristics of each TC to some extent. On average, M3 overestimates the intensity of landfalling TCs in the first 12 h after landfall while underestimates the intensity after TCs move further inland. The mean error increases largely as TC move further inland.
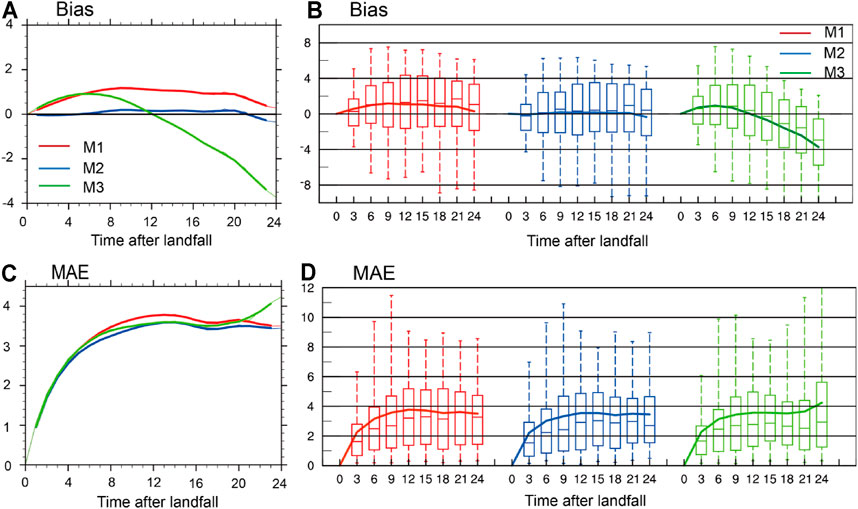
FIGURE 3. Distribution of biases [(A, B), m s−1] and mean absolute errors [MAE, (C, D), m s−1] of M1 (red), M2 (blue) and M3 (green) for TCs making landfall over China during 1980–2018. The top (bottom) of each vertical line means the 95th (5th) percentile, the upper (lower) bound of each box means the 75th (25th) percentile, and the horizontal line in each box means the median. The solid curve denotes the average intensity in (B, D). The bold curves show the 3-point running average in (A, C).
In addition to the mean intensity evolution, we also analyzed biases and mean absolute errors (MAEs) of the three decay models in estimating intensity of landfalling TCs after landfall during 1980–2018 with the results shown in Figure 3. Here, bias is defined as the estimated intensity minus the observed intensity in terms of the MSSW. On average, M1 and M2 tend to overestimate the intensity of landfalling TCs with positive biases during the whole period, while M3 tends to overestimate the intensity with positive biases during the first 12 h after landfall and underestimate the intensity with negative biases afterwards (Figures 3A,B). The average biases of M1 are generally larger than those of M2, with the mean bias of 0.82 m s−1 for M1 versus that of 0.05 m s−1 for M2. The errors of the two models initially increase with time, reach the peak of 1.17 m s−1 at 9 h after landfall for M1 and 0.24 ms−1 at 19 h after landfall for M2, and then turn to decrease with time for both models. As a result, the smallest biases of M1 and M2 occur in the beginning and at the end of the evaluated time period, with larger errors in between. M3 has the moderate biases of −0.56 m s−1 during the first 24 h after landfall, but the bias of M3 increases with time afterwards. The large increase in model error was consistent with the results in Wong et al. (2008), who mentioned that the MAE error and root-mean-square error (RMSE) increase with time after 12 h after landfall.
Compared the MAEs among the three decay models (Figures 3C,D), the increasing MAEs with time after landfall is similar. Among them, M2 has the lowest averaged MAE of 3.02 m s−1 during the whole period, while M1 has the highest averaged MAE of 3.16 m s−1. M3 has the better performance during the first 20 h after landfall than M1 and M2. However, after 20 h after landfall, the MAE of M3 significantly increases with time, resulting in the largest RMSE among the three models during 24 h after landfall (Table 1). In Wong et al. (2008), the averaged MAE and RMSE are 1.8 and 2.67 m s−1 at 12 h after landfall, which are a little bit lower than 2.66 and 3.66 m s−1 in ours. This is mainly because M3 was originally developed for estimating intensity change of TCs making landfall along the southern coast of China (Wong et al., 2008), while here we considered all samples of TCs making landfall over both southern and eastern coasts of mainland China. In additions, the rapid increase in the MAE of M3 with time is likely because the decay coefficient in M3 is determined with factors at the time of landfall, but the changes in both dynamic and thermodynamic processes after landfall are not considered. This strongly suggests that the time independent decay coefficient can’t reflect the intensity change after TCs move further inland, thus leading to the rapid error growth for M3.
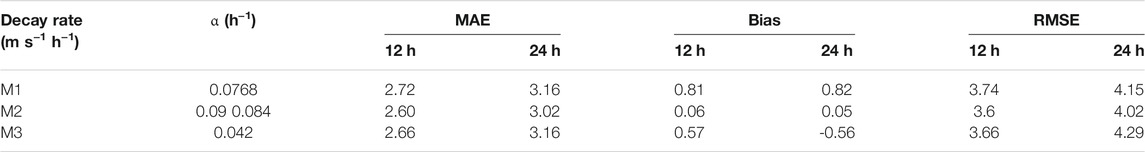
TABLE 1. The decay rate, mean absolute error (MAE), bias and root-mean-square error (RMSE) from M1, M2, and M3 during the first 12 h or 24 h after landfall.
The method proposed by Aberson (2008) was adopted to further evaluate the model skills in estimating the landfalling TC intensity. By this method, all estimates and observations of the MSSWs are binned by certain intervals. At each forecast (estimate) time, a contingency table (or matrix) is filled with the count of each forecast-verification pair in the sample. The row and column in the table represent the number of times in intensity during certain intervals. Perfect forecasts/estimates are along the contingency table’s diagonal. The farther each forecast is from the diagonal, the larger the forecast error is. The skill score (S) is then calculated using the following equation,
where C is the number of correct forecasts, T is the total number of forecasts, and E is the number of forecasts expected to be correct, which is calculated for each contingency table.
Figure 4 illustrates the skill scores of the three decay models for the period 1980–2018. The skill scores of all models almost decrease linearly with time, with the highest skill score of approximately 0.36 in the beginning, and become nearly zero or negative by 24 h after landfall and afterwards. This means that the effective forecast time of the three decay models are approximately 24 h, especially for M3. Note that the skill score of M2 and M3 decreases steadily during the whole period with relatively higher values than M1, indicating that M2 and M3 outperforms M1 during this period, especially the period between 6 and 18 h after landfall. This is consistent with the above conclusion.
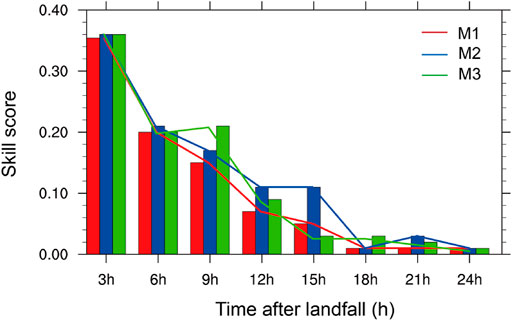
FIGURE 4. Skill score of M1 (red), M2 (blue), and M3 (green) for TCs making landfall over China during 1980–2018.
We further examine the spatial distribution of biases of the three decay models with the results shown in Figure 5. To help see any orographic dependence of model errors, the topographic map of China is given in Figure 5D. The distributions of biases of M1 and M2 are similar (Figures 5A,B), with large positive biases primarily in the southeastern China, where the Wuyi Mountains in Fujian Province are located (Figure 5D), and slightly negative biases in the eastern China. The large positive bias is likely due to the topographic effect, which may enhance the weakening of a TC when it moves inland. The rough surface and the blocking effect of mountains in the southeastern China can impose considerable effects on TC motion, structure, precipitation, and intensity (Duan et al., 2019; Lin et al., 2018). These effects often enhance the weakening of a TC and slow down the TC motion, leading to the enhancement of local torrential rainfall (e.g., Dong et al., 2019; Li et al., 2019). Because the decay constants in the decay models are obtained based on the fitting of landfalling TC samples, the orographic/terrain effects are not explicitly considered in the current decay models.
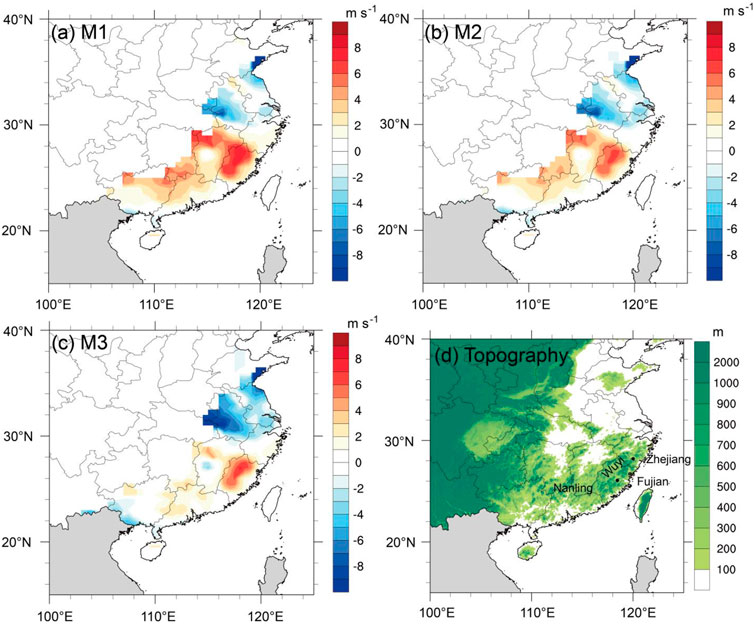
FIGURE 5. The spatial distribution of biases (m s−1) in (A) M1, (B) M2, and (C) M3 for TCs making landfall over China during 1980–2018. (D) Topographic map of China.
Both M1 and M2 can’t reflect the effect of mountains along the coastal areas and, thus, overestimate TC intensity after landfall with positive biases over the southeastern China (Figures 5A,B). By contrast, M3 performs relatively better in the southeastern China with a small area of positive biases, but it shows large negative biases in the eastern China (Figure 5C), where the land is dominated by flat plain (Figure 5D). This is mainly because M3 was originally developed for estimating intensity change of TCs making landfall along the southern coast of China (Wong et al., 2008). Since mesoscale mountains exist in the southern coastal regions of China and the effect of atmospheric environmental conditions along the southern coast of China at the time of landfall are partly considered. This explains why M3 performs the best for the intensity change of TCs making landfall in the southeastern China. However, the environmental atmospheric conditions with negligible terrain effects in the eastern China are different from those in the southern China. As a result, M3 overestimates the weakening rate of landfalling TCs in the eastern China with negative intensity biases.
Model Error Analysis
To identify the main error sources in the three decay models discussed above, we further analyzed three critical factors, namely TC intensity and translational speed, and the 850-hPa moist static energy for landfalling TCs, all at the time of landfall, to quantify contributions by different factors to the model errors. Since the topography may affect the model performance as well, the topography is also selected as the fourth critical factor for our analysis. Figure 6 illustrates the distributions of the key variables, including the landfall intensity, the landfall translational speed, and the 850 hPa moist static energy
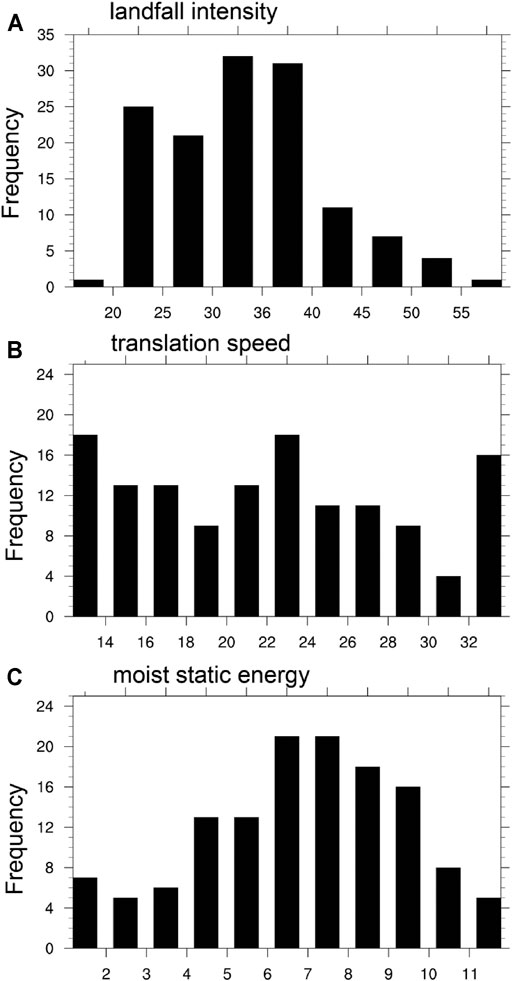
FIGURE 6. Distribution of (A) the landfall intensity (m s−1), (B) the translation speed at landfall (km h−1), and (C) the mean 850 hPa moist static energy at landfall (
We then examine the dependences of TC weakening rate after landfall on the four critical factors mentioned above. Firstly, we classified landfalling TCs into strong TCs (STCs, with MSSW ≥32 m s−1) and weak TCs (WTCs, with MSSW <32 m s−1) at the time of landfall. The weakening rate of STCs is much higher than that of WTCs (Figure 7A). The difference in the decay rates between STCs and WTCs is statistically significant over 99% confidence level during the whole period up to 24 h after landfall (Table 2). After 24 h after landfall, the intensity of landfalling TCs continue to weaken but more slowly. Secondly, we classified the landfalling TCs into fast moving TCs (Fast, with translational speed ≥20 km h−1) and slow moving TCs (Slow, with translational speed <20 km h−1) at the time of landfall. Here, the translational speed of a TC at the time of landfall was calculated as the distance traveled between 3 h prior to landfall and 3 h after landfall. The slow-moving TCs are generally weaker at the time of landfall and, thus, show lower weakening rate than the fast-moving TCs (Figure 7B). Such a difference is significant over 90% confidence level (Table 2) during the first 12 h after landfall. This means that the slow moving TCs at the time of landfall is more favorable for the maintenance of their intensity after landfall. Thirdly, we classified the landfalling TCs into high moist static energy (Em_h, with
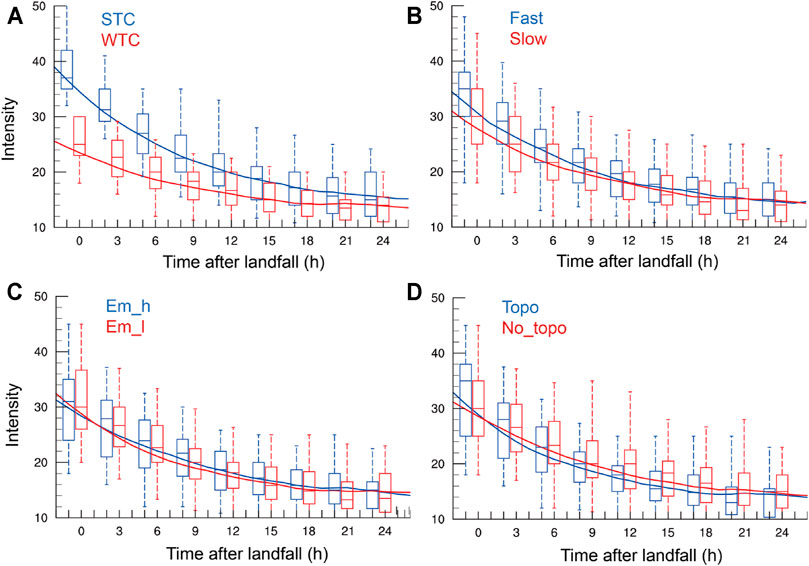
FIGURE 7. As in Figure 3B, but for (A) STC (blue) vs. WTC (red), (B) Fast (blue) vs. Slow (red), (C) Em_h (blue) vs. Em_l (red), and (D) Topo (blue) vs. No_topo (red), see text for details.
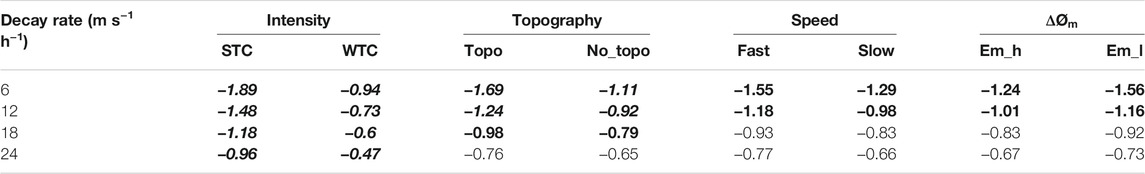
TABLE 2. Decay rates (m s−1 h−1) during different periods (0–6, 0–12, 0–18, and 0–24 h) after landfall for different classification groups (STC/WTC, Topo/No_topo, Fast/Slow, Em_h/Em_l). Boldface and italic fonts indicate the differences being statistically significant over the 90 and 99% confidence level, respectively, based on the Student’s t test.
We see in Evalution of Model Performance that M1 and M3 have relatively larger errors than M2 and both show geographical dependences of model errors, where we speculated the larger errors could be related to terrain effect for M1 and the time-independent decay coefficient for M3. To confirm those speculations, we did some further analyses. We separately analyzed TC samples making landfall north of 29°N over China, where there are no visible terrains, and compared the errors with those for all simples of TCs making landfall over China (Figure 8). As expected, the decay rate for all TC samples is larger than that for TCs making landfall north of 29°N in the first 10 h after landfall and then becomes smaller afterwards (Figures 8A,B). Both MAE and bias (Figures 8C,D) for TCs making landfall north of 29°N are much smaller than those for all samples of landfalling TCs over China in the whole period, with MAE of 3.16 m s−1 and bias of 0.82 m s−1 for all samples and 2.98 and 0.4 m s−1 for TCs making landfall north of 29°N, especially when TC moved farther inland. This indicates that errors for TCs north of 29°N with little terrain effect are close to or even smaller than those in Kaplan and DeMaria (1995). Therefore, the relatively large errors in M1 results partially from the ignorance of terrain effects as mentioned above.
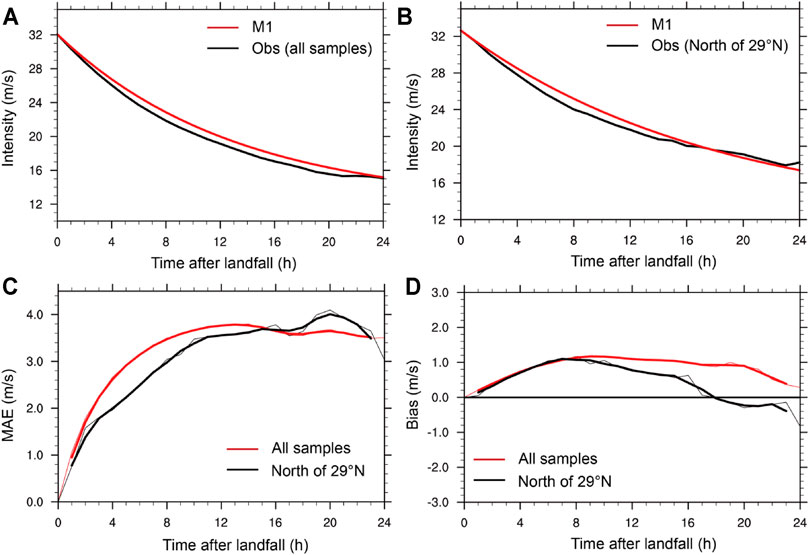
FIGURE 8. The mean decay curves of maximum sustained near-surface wind (m s−1) (A) for all samples of landfalling TCs, and (B) for TCs making landfall north of 29°N over China. Distribution of (C) MAE (m s−1) and (D) biases (m s−1) of all samples of landfalling TCs (red lines) and TCs making landfall north of 29°N (black lines) over China during 1980–2018.
Since M3 was originally attempted for TCs making landfall over the South China coast, we show in Figure 9A the MAEs for all TCs samples and samples of TCs making landfall along the South China coast (110.5–117.5°), and in Figure 9B the spatial distribution of biases and tracks for TCs making landfall along the South China coast. MAE for TCs making landfall along the South China coast is much smaller than that for all TC samples, with MAE of 3.16 m s−1 for all TC samples and MAE of 2.25 m s−1 for TC samples making landfall along the South China coast. Compared with the MAE of 1.8 m s−1 and RMSE of 2.67 m s−1 at 12 h after landfall in Wong et al. (2008), the MAE of 2.08 m s−1 and RMSE of 2.7 m s−1 in our study are very close to those at 12 h after landfall. Nevertheless, although the error for TCs making landfall along the South China coast increases more slowly with the time after landfall than that for all samples of landfalling TCs over China, the error still grows rapidly after TCs move further inland. This suggests that the rapid error growth in M3 can be largely attributed to the fact that the decay coefficient in M3 is determined by factors at the time of landfall only. As TCs move further inland, the decay rate should be adjusted with changes in both dynamic and thermodynamic environmental conditions after landfall. This suggests that the time independent decay coefficient can’t reflect the intensity change of TCs that move further inland, thus leading to the rapid error growth for M3. Note that the error evolution in Figure 9A is very similar to that in Wong et al. (2008, see their Figure 10B). The above analysis confirms that the terrain effect and the time independent decay coefficient are two essential factors responsible for the relatively large errors in M1 and M3.
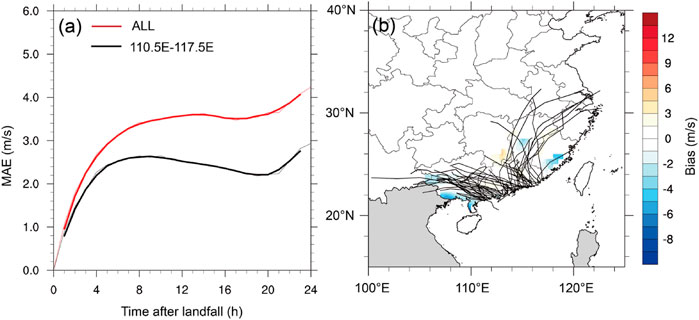
FIGURE 9. (A) Distribution of MAE (m s−1) of M3 for all samples of landfalling TCs (red line) and for TCs making landfall along the South China coast (110.5°–117.5°, black line). (B) The spatial distribution of biases (m s−1) in M3 for TCs making landfall along the South China coast. The black lines in (B) represent the tracks of landfalling TCs.
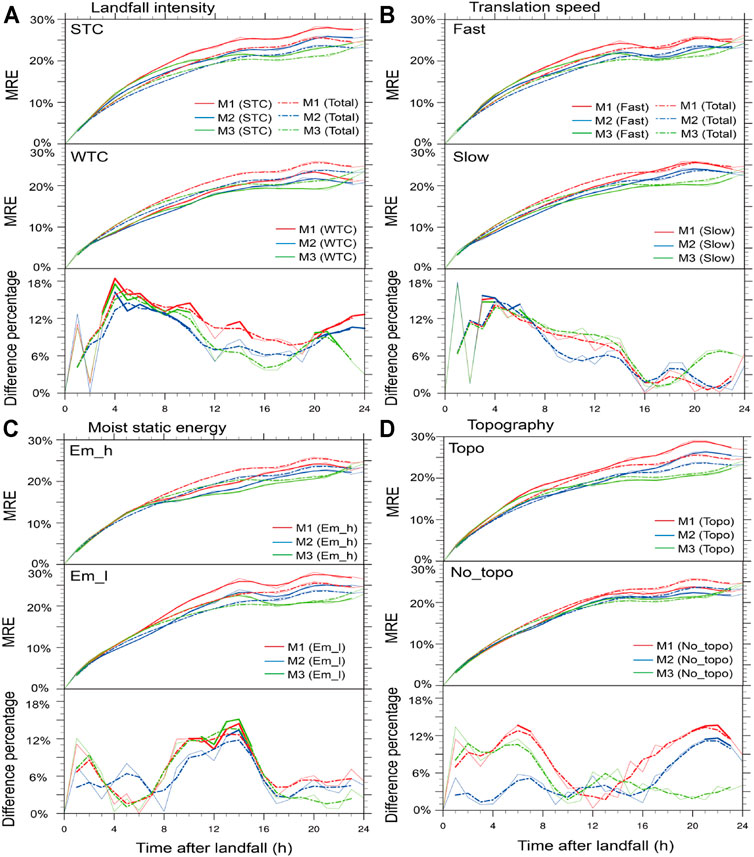
FIGURE 10. Mean relative errors (MRE) of all samples of landfalling TCs (dashed) and the MREs of different classification groups (solid) in the upper and middle part of each panel, and the percentage of difference in MREs between different groups and all TCs in the lower panels. The solid portions in the lower panels indicating the difference being statistically significant over 90% confidence level, for (A) landfall intensity, (B) translation speed, (C) moist static energy, (D) topography.
To further examine the relative contributions of different key factors to model errors, we compared the mean relative errors (MREs) of different groups (STC/WTC, Fast/Slow, Em_h/Em_l, Topo/No_topo) and the percentage of difference in the model errors between different groups and all TCs. Here, the relative error is defined as the absolute error divided by the TC intensity at the evaluation time. We used the relative errors instead of the absolute errors to reduce the influence of TC intensity on model errors because strong TCs often have larger absolute errors than weak TCs. The percentage of difference is defined as the percentage of the difference in the MREs between one group and all landfalling TCs divided by the MRE of all landfalling TCs. The solid curves in the upper and middle parts of different panels in Figure 10 represent the MREs of TCs in different groups, and the dashed curves represent the MREs of all samples of landfalling TCs from M1, M2 and M3, respectively. The dashed curves in the lower parts of different panels in Figure 10 indicate the percentages of differences between MREs for TCs in different groups and MREs for all landfalling TCs, and the corresponding solid portions indicate the differences that are statistically significant over 90% confidence level between different groups.
Compared MREs of all TC samples among M1, M2 and M3 (dashed lines in the upper part of each panel in Figure 10), MREs of M2 and M3 are relatively smaller than that of M1 during the whole period, and the averaged MRE of M3 is the smallest. In Figure 10A, the MREs of M1, M2, and M3 are significantly larger for STCs than for all TC samples during the whole period after landfall. On the contrary, the MRE for WTCs is significantly smaller than that for all samples of TCs. This indicates that all three models have larger relative errors for strong TCs than weak TCs. Note that the difference in MREs between STCs and WTCs becomes statistically significant during 3–10 h after landfall, with the largest contribution of about 18% from the initial TC intensity. Among them, the difference percentage in M1 is the largest, indicating that M1 is less stable than other two models. The MREs of the three models are larger for fast moving TCs than for all sample TCs during the first 16 h after landfall and are smaller for slow moving TCs, especially during the first 2–6 h after landfall, with the largest contribution over 15% (Figure 10B). This means that the forecast errors for landfalling TCs with faster translational speeds would be larger in the early stage after landfall. However, the MREs are similar between fast TCs/slow TCs and all samples of TCs in the later stage. This indicates that the impact of translational speed at the time of landfall on model errors is negligible except for the period shortly after landfall. The MREs for landfalling TCs with high moist static energy are smaller than landfalling TCs with low moist static energy in all three models (Figure 10C), which is statistically significant for about 10–15 h after landfall, with the largest contribution over 15%. The MREs of M1 and M2 are larger for TCs in the Topo group than in the No_topo group almost for the whole period after landfall (Figure 10D), with the largest contribution up to 15% between 4 and 8 h and after 18 h after landfall. However, the MRE of M3 is slightly lower for TCs in the Topo group and slightly higher for TCs in the No_topo group than that for all landfalling TCs with no significant difference between the Topo and No_topo groups, suggesting that the topography has some minor effects on the performance of M3 (Figure 10D).
Discussion and Conclusion
In this study, the performances of three exponential decay models (M1, M2, and M3) in estimating the intensity change in terms of the MSSW of TCs after landfall over China are evaluated and compared. The three models are developed by, respectively, Kaplan and DeMaria (1995), Bhowmik et al. (2005), and Wong et al. (2008). The decay constants in M1 and M2 are obtained by fitting the mean MSSWs of all TC samples making landfall over mainland China. The difference between M1 and M2 is in that only one decay constant is fitted in M1 but two different decay constants are fitted in M2 for different time periods after landfall. The decay constant in M3 is determined by several factors, including the TC intensity, landward translational speed, and 850-hPa moist static energy, all at the time of landfall. The performances of the three models are evaluated based on all TC samples making landfall over mainland China during 1980–2018.
Results indicate that these models can reproduce the weakening trend of TCs after landfall and have reasonable skills in estimating/predicting TC intensity change after landfall. On average, M1 and M2 tend to overestimate TC intensity after landfall, while M3 overestimates the TC intensity in the first 12 h after landfall and underestimates the intensity after TCs moving further inland. M2 has the best performance with the smallest mean errors among the three models within 24 h after landfall, which is mainly due to the fact that two decay constants are fitted for two different time periods in M2 based on the mean intensity change of all TC samples after landfall. M3 shows relatively better performance than M1 in the first 20 h after landfall, but its errors increase largely after TCs move further inland. This is because M3 considers several environmental factors and/or the characteristics of the TCs only at the time of landfall in determining the decay constant.
M1 and M2 have similar spatial error distributions with large positive biases primarily in the southeastern coastal regions of China, where the Wuyi Mountains in Fujian Province are located. Because the possible orographic effects are not explicitly considered in M1 and M2, both models overestimate TC intensity with positive biases in the southeastern China. M3 performs better in the southeastern China, but shows negative biases in the eastern China. This is because M3 was originally developed to estimate the intensity change of TCs making landfall along the southern coast of China (Wong et al., 2008). Since both the terrain and the environmental conditions in the eastern China coast are different from those in the southeastern China coast, it is not surprising that M3 performs better over the southeastern China than over the eastern China. The classification analyses based on landfall intensity, translational speed, and 850-hPa moist static energy of the TCs at the time of landfall, and topography of the landfalling region are conducted to examine the relative contributions of different factors to model errors. Results demonstrate that these four factors all contribute to model errors of M1, M2, and M3, with the maximum contribution of about 18% by landfall intensity, and about 15% equally by translational speed, moist static energy and topography during different periods after landfall.
Although the three exponential decay models evaluated in this study can reproduce the weakening trends of TCs after landfall, their performances are not perfect. Based on results from this study, we can recommend several aspects for future development/improvement of the decay model of landfalling TC intensity. First, topography could have a significant effect on the model performance as inferred from the spatial error distribution. However, such an effect has not been explicitly considered in the current intensity decay models. Second, different performances of M1 and M2 indicate the importance of the time-dependent decay constant in a decay model. TCs often have a larger decay rate in the first period than in the second period after landfall. Third, including the effects of environmental conditions and TC characteristics as factors in determining the decay constant has some benefits to the performance of a decay model. However, only the conditions at the time of landfall might be not enough. Future efforts may consider changes in the environmental conditions based on forecast of numerical weather prediction models and also the land surface properties, such as the effect of large lakes and so on. In addition, the inner core size of a TC at the time of landfall may affect the decay rate of the TC intensity after landfall as well (Vickery, 2005). Therefore, the time-dependent decay constant determined by environmental conditions, topography and land cover properties, and the TC characteristics (including the inner core size) is necessary to further improve the exponential decay models for estimating TC intensity change after landfall. Efforts in this direction are under way and the results will be reported in a future publication in due course.
Data Availability Statement
The ERA-Interim data used in this study were downloaded from https://apps.ecmwf.int/datasets/data/interim-full-daily/levtype=pl/. The TC best track datasets were obtained from STI/CMA (http://tcdata.typhoon.org.cn). Further inquiries can be directed to the corresponding author.
Author Contributions
YW designed the study. LL analyzed the datasets and generated figures. YW and LL wrote the paper with contributions from HW.
Funding
This study has been supported by National Natural Science Foundation of China under grants 41730960, 42175011 and in part by the National Key R&D Program of China under grant 2017YFC1501602. YW was supported in part by NSF grant AGS-1834300.
Conflict of Interest
The authors declare that the research was conducted in the absence of any commercial or financial relationships that could be construed as a potential conflict of interest.
Publisher’s Note
All claims expressed in this article are solely those of the authors and do not necessarily represent those of their affiliated organizations, or those of the publisher, the editors and the reviewers. Any product that may be evaluated in this article, or claim that may be made by its manufacturer, is not guaranteed or endorsed by the publisher.
References
Aberson, S. D. (2008). An Alternative Tropical Cyclone Intensity Forecast Verification Technique. Wea. Forecast. 23, 1304–1310. doi:10.1175/2008WAF2222123.1
Batts, M. E., Simiu, E., and Russell, L. R. (1980). Hurricane Wind Speeds in the United States. J. Struct. Div. 106, 2001–2016. doi:10.1061/JSDEAG.0005541
Bhowmik, S. K. R., Kotal, S. D., and Kalsi, S. R. (2005). An Empirical Model for Predicting the Decay of Tropical Cyclone Wind Speed after Landfall over the Indian Region. J. Appl. Meteorol. 44, 179–185. doi:10.1175/JAM-2190.1
Colette, A., Leith, N., Daniel, V., Bellone, E., and Nolan, D. S. (2010). Using Mesoscale Simulations to Train Statistical Models of Tropical Cyclone Intensity over Land. Mon. Wea. Rev. 138, 2058–2073. doi:10.1175/2010MWR3079.1
Dee, D. P., Uppala, S. M., Simmons, A. J., Berrisford, P., Poli, P., Kobayashi, S., et al. (2011). The ERA-Interim Reanalysis: Configuration and Performance of the Data Assimilation System. Q.J.R. Meteorol. Soc. 137, 553–597. doi:10.1002/qj.828
Demaria, M., and Kaplan, J. (1994). A Statistical hurricane Intensity Prediction Scheme (SHIPS) for the Atlantic basin. Wea. Forecast. 9, 209–220. doi:10.1175/1520-0434(1994)009<0209:aships>2.0.co;2
Demaria, M., and Kaplan, J. (1999). An Updated Statistical hurricane Intensity Prediction Scheme (SHIPS) for the Atlantic and Eastern North Pacific Basins. Wea. Forecast. 14, 326–337. doi:10.1175/1520-0434(1999)014<0326:auship>2.0.co;2
DeMaria, M., Knaff, J. A., and Kaplan, J. (2006). On the Decay of Tropical Cyclone Winds Crossing Narrow Landmasses. J. Appl. Meteorol. Climatol. 45, 491–499. doi:10.1175/JAM2351.1
Demaria, M., Mainelli, M., Shay, L. K., Knaff, J. A., and Kaplan, J. (2005). Further Improvements to the Statistical hurricane Intensity Prediction Scheme (SHIPS). Wea. Forecast. 20, 531–543. doi:10.1175/WAF862.1
Dong, M., Ji, C., Chen, F., and Wang, Y. (2019). Numerical Study of Boundary Layer Structure and Rainfall after Landfall of Typhoon Fitow (2013): Sensitivity to Planetary Boundary Layer Parameterization. Adv. Atmos. Sci. 36 (4), 431–450. doi:10.1007/s00376-018-7281-9
Duan, Y., Wan, Q., Huang, J., Zhao, K., Yu, H., Wang, Y., et al. (2019). Landfalling Tropical Cyclone Research Project (LTCRP) in China. Bull. Amer. Meteorol. Soc. 100 (12), ES447–ES472. doi:10.1175/bams-d-18-0241.1
Georgiou, P. N. (1985). Design Windspeeds in Tropical Cyclone-Prone Regions. London, ON, Canada: Ph.D. thesis, University of Western Ontario, 295. Available at: https://ir.lib.uwo.ca/digitizedtheses/1523.
Ho, F. P., Su, J. C., Hanevich, K. L., Smith, R. J., and Richards, F. P. (1987). Hurricane Climatology for the Atlantic and Gulf Coasts of the United States. Washington, DC: NOAA Tech. Rep. NWS38, Federal Emergency Management Agency, 195. Available at: https://coast.noaa.gov/data/hes/images/pdf/ATL_GULF_HURR_CLIMATOLOGY.pdf.
Kaplan, J., and DeMaria, M. (1995). A Simple Empirical Model for Predicting the Decay of Tropical Cyclone Winds after Landfall. J. Appl. Meteorol. 34, 2499–2512. doi:10.1175/1520-0450(1995)034<2499:asemfp>2.0.co;2
Kaplan, J., and Demaria, M. (2001). On the Decay of Tropical Cyclone Winds after Landfall in the New England Area. J. Appl. Meteorol. 40, 2802–3286. doi:10.1175/1520-0450(2001)040<0280:OTDOTC>2.0.CO10.1175/1520-0450(2001)040<0280:otdotc>2.0.co;2
Knaff, J. A., Sampson, C. R., and Demaria, M. (2005). An Operational Statistical Typhoon Intensity Prediction Scheme for the Western North Pacific. Wea. Forecast. 20, 688–699. doi:10.1175/WAF863.1
Li, Y., Lin, Y., and Wang, Y. (2019). A Numerical Study on the Formation and Maintenance of a Long‐Lived Rainband in Typhoon Longwang (2005). J. Geophys. Res. Atmos. 124 (19), 10401–10426. doi:10.1029/2019jd030600
Lin, Y., Li, Y., Li, Q., Chen, M., Xu, F., Wang, Y., et al. (2018). A Long-Lasting Vortex Rossby Wave-Induced Rainband of Typhoon Longwang (2005). Bull. Amer. Meteorol. Soc. 99, 1127–1134. doi:10.1175/BAMS-D-17-0122.1
Schwerdt, R. W., Ho, F. P., and Watkins, R. R. (1979). Meteorological Criteria for Standard Project hurricane and Probable Maximum hurricane Wind fields, Gulf and East Coasts of the United States. MD: NOAA Tech. Rep.NWS23, Silver Spring, 317.
Tuleya, R. E., Bender, M. A., and Kurihara, Y. (1984). A Simulation Study of the Landfall of Tropical Cyclones. Mon. Wea. Rev. 112, 124–136. doi:10.1175/1520-0493(1984)112<0124:assotl>2.0.co;2
Tuleya, R. E., and Kurihara, Y. (1978). A Numerical Simulation of the Landfall of Tropical Cyclones. J. Atmos. Sci. 35, 242–257. doi:10.1175/1520-0469(1978)035<0242:ANSOTL>2.0.CO;2
Tuleya, R. E. (1994). Tropical Storm Development and Decay: Sensitivity to Surface Boundary Conditions. Mon. Wea. Rev. 122, 291–304. doi:10.1175/1520-0493(1994)122<0291:tsdads>2.0.co;2
Vickery, P. J. (2005). Simple Empirical Models for Estimating the Increase in the central Pressure of Tropical Cyclones after Landfall along the Coastline of the United States. J. Appl. Meteorol. 44, 1807–1826. doi:10.1175/JAM2310.1
Vickery, P. J., and Twisdale, L. A. (1995). Wind-field and Filling Models for hurricane Wind-Speed Predictions. J. Struct. Eng. 121, 1700–1709. doi:10.1061/(asce)0733-9445(1995)121:11(1700)
Wong, M. L. M., Chan, J. C. L., and Zhou, W. (2008). A Simple Empirical Model for Estimating the Intensity Change of Tropical Cyclones after Landfall along the South China Coast. J. Appl. Meteorol. Climatol. 47, 326–338. doi:10.1175/2007JAMC1633.1
Keywords: landfalling tropical cyclones, exponential decay model, model performance, tropical cyclone intensity, error analysis
Citation: Liu L, Wang Y and Wang H (2021) The Performance of Three Exponential Decay Models in Estimating Tropical Cyclone Intensity Change After Landfall Over China. Front. Earth Sci. 9:792005. doi: 10.3389/feart.2021.792005
Received: 09 October 2021; Accepted: 19 November 2021;
Published: 10 December 2021.
Edited by:
Qingqing Li, Nanjing University of Information Science and Technology, ChinaReviewed by:
Li Tao, Nanjing University of Information Science and Technology, ChinaKevin Cheung, Macquarie University, Australia
Copyright © 2021 Liu, Wang and Wang. This is an open-access article distributed under the terms of the Creative Commons Attribution License (CC BY). The use, distribution or reproduction in other forums is permitted, provided the original author(s) and the copyright owner(s) are credited and that the original publication in this journal is cited, in accordance with accepted academic practice. No use, distribution or reproduction is permitted which does not comply with these terms.
*Correspondence: Lu Liu, bGl1bHVAY21hLmdvdi5jbg==